
Abstract
Neighbourhood change is a complex and dynamic process stemming both from macro-level changes in economic conditions and from micro-level changes in circumstances of individual residents. This article explores the intersection of these contributions to processes of neighbourhood change through the lens of changes in consumer credit access in California during the late 2010s. While improvements in consumer credit access were widespread across California neighbourhoods during this period, the specific mechanisms underlying these neighbourhood changes are found to differ in important respects. Employing credit panel data, this article identifies the distinct contributions of residential mobility and incumbent change to changes in consumer credit access at the neighbourhood scale. Descriptive and cluster analysis further reveals the types of neighbourhoods in which these mechanisms operate, highlighting the dominant role of incumbent credit score growth in neighbourhoods with moderate incomes and racially diverse populations with high rates of homeownership. The findings of this analysis point to the importance of uncovering the mechanisms underlying neighbourhood change, and indicate the existence of multiple such mechanisms facilitating the widespread expansion of access to consumer credit in California during the late 2010s.
Introduction
The identification and measurement of neighbourhood change provides valuable insights into the social, economic and financial restructuring of urban areas. While many empirical analyses of neighbourhood change use aggregate measures to indicate whether changes have occurred, they often do not reveal the underlying mechanisms by which they occur. Changes in aggregate neighbourhood characteristics – such as increases in average neighbourhood incomes – could occur for multiple reasons. These increases may be driven by population turnover, as when a group of lower-income residents moves out of a neighbourhood and is replaced by a group of higher-income residents moving in. However, average neighbourhood income may also increase due to changes in the incumbent population, as when residents that remain in the same location experience increases in income over time. This study illustrates the roles of these respective processes in shaping neighbourhood change, leveraging credit panel data to examine increases in consumer credit scores across California neighbourhoods between 2014 and 2019.
By focusing on access to consumer credit instead of conventional measures such as neighbourhood income, this study also emphasizes the significance of consumer credit as a contemporary factor in individual economic circumstances. In a highly financialized economy, in which opportunities to build wealth – such as homeownership – are heavily conditioned by one’s credit standing, consumer credit access provides an indicator of the extent to which individuals are able to access housing and economic opportunity. Widespread credit score increases across California between 2014 and 2019 reflected growing access to financial resources during a period of sustained post-recession economic recovery, but these credit score increases did not occur across all neighbourhoods to the same extent or for the same reasons. Were observed increases in average neighbourhood credit scores the result of improvements in credit access for existing residents that remained in place (‘incumbent change’), or were these increases primarily due to people with higher credit scores moving in and people with lower credit scores moving out (‘residential mobility’)? To what extent are there observable differences between neighbourhoods that experienced credit score increases primarily due to incumbent change compared with those that changed primarily due to residential mobility?
This article begins by contextualizing the role of finance capital and consumer credit in processes of neighbourhood change, emphasizing the spatial evolution of California’s urban landscapes. After outlining various methods for measuring neighbourhood change, the subsequent analysis uses arithmetic decomposition, a mathematical method which identifies the separate contributions of different mechanisms to aggregate changes in average neighbourhood credit scores. The distinct contributions of residential mobility and incumbent change to neighbourhood credit scores are described and analyzed alongside various neighbourhood characteristics. The magnitudes of these contributions are then used to identify five distinct categories of neighbourhood change. The description of these neighbourhood categories points to important differences in the mechanisms underlying credit score change across different types of neighbourhoods, highlighting neighbourhoods that experienced increased credit access as a result of population turnover but also identifying neighbourhoods where the incumbent population experienced large gains in credit access during the post-recession recovery.
Urban change and consumer credit
Urban neighbourhoods are constantly undergoing economic and social transformations, resulting from shifts in both underlying structural conditions and in the everyday circumstances of individual households. At the macro-level, uneven processes of investment and disinvestment in the built environment have the potential to reconfigure which socioeconomic and racial groups are able to occupy neighbourhood spaces (Smith, 1996). Each wave of capital investment influences subsequent stages of development: while the built environment provides a ‘spatial fix’ for excess capital, barriers created by prior waves of development result in continuously shifting spatial patterns of investment (Harvey, 1985). This is visible in several historical trends in urban and neighbourhood change – from mid-century suburbanization to the subsequent ‘back to the city’ movement – as socioeconomic and demographic changes directly reflected flows of capital, first away from and then back towards urban centres (Smith, 1979). The nature of this restructuring has only grown in complexity in recent years, as existing processes of inner-city gentrification and suburban exclusion have been joined by the growing suburbanization of poverty and continued expansion at the exurban fringe (Schafran, 2019).
While the role of financial capital in neighbourhood change via investment in the built environment has been heavily theorized, financial systems are also implicated in the reshaping of the urban landscape via the strategic expansion (and contraction) of consumer credit. The waves of mid-20th century suburbanization and urban disinvestment that set the stage for subsequent inner-city gentrification were enabled not only by capital investment in the built environment, but also by the extension of mortgage credit that enabled widespread suburban homeownership for certain segments of the population, while excluding from credit systems other areas and populations deemed overly ‘risky’ (Hyman, 2012). Differential access to credit continues to play an important role in shaping the socioeconomic and demographic landscape of metropolitan regions. The advent of contemporary credit scoring provided a sophisticated means of assessing and pricing risk that enabled lenders to not only measure default risk, but also to set interest rates commensurate with that risk in order to maximize profits (Carruthers, 2013). This paradigm of risk-based pricing offered an alternative to conventional credit rationing resulting from information asymmetry (Stiglitz and Weiss, 1981), enabling lenders to potentially profit from riskier loans (Lauer, 2017). The subsequent advent of ‘subprime’ mortgage lending during the 1990s and 2000s extended homeownership access to formerly excluded groups, but also increased the vulnerability of existing urban communities (Immergluck, 2011) while creating new landscapes of disadvantage on the suburban and exurban fringes (Schafran and Wegmann, 2012). The consequences of these spatially uneven extensions of consumer credit became clear in the aftermath of the great recession, as foreclosures spread through primarily low-income racialized communities (Rugh et al., 2015).
California provides a rich case study for examining the interplay between consumer credit and urban change. Shaped by evolving flows of investment into local circuits of production and the built environment, places like Los Angeles and the San Francisco Bay Area have transformed into sprawling polycentric metropolises characterized by socioeconomic and racial diversity alongside deep spatial polarization (Schafran, 2019; Soja et al., 1983). California’s urban areas occupied a central role in the great recession (Bardhan and Walker, 2011), while the subsequent economic boom was characterized by dense agglomerations of economic activity (in particular, the thriving tech sector) alongside growing regional crises of housing affordability. Successive waves of capital investment have contributed to spatial unevenness in the form and quality of the built environment across these metropolitan landscapes. Following its tendency to circumvent the physical and economic barriers imposed by prior waves of investment in the built environment of cities and inner-ring suburbs, capital has increasingly leapfrogged over existing suburban development to the exurban periphery, finding sites for residential investment on the metropolitan fringes (Schafran, 2013). This has resulted in the emergence of distinctive rings of development in California’s metropolitan regions, featuring gentrifying regional cores (e.g. downtown Los Angeles, San Francisco), wealthy inner-ring suburbs with substantial employment centres (e.g. Silicon Valley) and largely residential developments in outer-ring suburbs and exurbs.
While suburban and exurban areas provide new opportunities for access to housing and homeownership, those moving to these communities have done so on very different terms than those who had benefited from prior waves of suburban development. Unlike the primarily white middle- and upper-class suburbanization of the mid-20th century, this wave of urban development has been characterized both by more racially and socioeconomic diverse populations and by processes of retrenchment that have left those new communities with insufficient funding for infrastructure and services to support their growing populations (Schafran, 2019). The development of communities on the metropolitan fringes coincided with the rise of subprime mortgage lending during the 1990s and 2000s, which enabled a wider array of households to own homes, but often only on predatory terms and largely at the expense of the financial freedom commonly associated with homeownership (Wyly et al., 2009). These outlying communities became key sites of foreclosure during the great recession, reflecting a combination of predatory and sprawling patterns of residential development (Schafran, 2013).
While California’s economy quickly recovered from the recession, the uneven nature of this recovery has had profound consequences for the spatial polarization of its major metropolitan regions. Whereas coastal urban cores experienced intensive housing cost growth as dense agglomerations of economic activity attracted a growing population of highly skilled workers (Scott, 2019), lower-income households have increasingly located on the comparatively lower-cost periphery (Blumenberg and Wander, 2023). Given these shifts in the socioeconomic landscape of California’s urban regions, it might be expected that neighbourhood change in both urban cores and exurban peripheries would be driven primarily by population turnover. However, neighbourhoods impacted by the great recession may also have experienced improvements in the financial conditions of incumbent households, reflecting the recovery of household finances a decade after the economic crisis. The following section considers how both of these factors – population turnover and the changing prospects of incumbent residents – may be incorporated into an empirical analysis of neighbourhood change.
Measuring neighbourhood change
Any empirical study of neighbourhood change must contend with the longstanding focus on gentrification. Various analyses have sought to identify ‘potentially gentrifying’ and ‘gentrifying’ neighbourhoods by measuring aggregate changes in income, the educational attainment of residents, housing prices or new housing development (e.g. Freeman, 2005). While these studies have provided crucial insights into the spatial distribution of neighbourhood change, they share several limitations. Misalignments between theoretical conceptualizations and available neighbourhood data result in inconsistent and unstable neighbourhood definitions that differ between analyses (Preis et al., 2021). The tendency to focus solely or primarily on a binary definition of gentrification also limits the scope of empirical research, overlooking other forms of change rooted not in residential mobility but in other processes of socioeconomic ascent such as incumbent change (Owens, 2012).
The existence of multiple processes contributing to neighbourhood change has periodically been acknowledged. Clay (1979) distinguishes between two discrete forms of ‘neighbourhood renewal’: processes of ‘gentrification’ resulting from population turnover, and processes of ‘incumbent upgrading’ resulting from existing residents improving their socioeconomic standing. Residential mobility has received the bulk of attention in neighbourhood change research owing to the theoretical linkage between gentrification and displacement, although empirical results regarding this relationship have been mixed (Freeman, 2005; Newman and Wyly, 2006). Meanwhile, the potential role of incumbent change in aggregate neighbourhood change has often been overlooked, with neighbourhood context more often regarded as a potential source of changes in household socioeconomic status rather than as a consequence of those changes (Sampson et al., 2002). This focus on neighbourhood effects has also been incorporated into gentrification research, with some arguing that households who remain in gentrifying neighbourhoods experience socioeconomic ascent due to the resources and positive social capital effects generated by newcomers (Brummet and Reed, 2019). The possibility that residents themselves might contribute to observed changes in neighbourhood socioeconomic conditions requires an alternative theoretical and empirical orientation that acknowledges the dual role of residential mobility and incumbent change.
Several strategies have been proposed to untangle the separate roles of changes driven by residential mobility (‘residential mobility effects’) and changes driven by current residents (‘incumbent change effects’). One common approach measures the distinct socioeconomic trajectories experienced by out-movers, in-movers and stayers, and describes how those trajectories differ across different categories of neighbourhoods over time (i.e. ‘downgrading’, ‘upgrading’) over time (Hochstenbach et al., 2015; Teernstra, 2014). Focusing on low-income U.S. neighbourhoods that experienced socioeconomic ascent during the 1990s, Ellen and O’Regan (2011) similarly measure the trajectories of these groups to assess the extent of (1) the selective exit of low-income households, (2) the selective entrance of high-income households or (3) changes in the incumbent population of ‘stayers’. These studies find evidence for incumbent change and the selective entrance of higher-income households in neighbourhoods experiencing socioeconomic ascent but find less evidence for low-income out-migration.
Others have decomposed contributions to neighbourhood-level measures of socioeconomic segregation. Bailey (2012) employs a ‘neighbourhood accounts’ framework to decompose changes in neighbourhood measures of income segregation, measuring how changes in the segregation of income groups are driven by residential mobility and in situ change, as well as other processes such as births and deaths. These components are arranged into a sequential process, measuring the contribution of each process to changes in segregation and identifying the important role of ‘in situ’ changes. Other approaches (Huang et al., 2017; South et al., 2022) use a method akin to Oaxaca-Blinder decomposition to quantify contributions to changes in neighbourhood segregation, differentiating between (1) the difference in neighbourhood income changes between race and income groups (‘in situ change’), and (2) the difference driven by the ‘class-selective’ migration of different groups in explaining neighbourhood changes.
Hochstenbach and van Gent (2015) examine the relationship between individual socioeconomic status and neighbourhood socioeconomic change via three categories of individual income and four categories of neighbourhood change based on initial socioeconomic status and change over time. Changes in the size of each income group are decomposed into three components: (1) residential mobility, (2) ‘social mobility’ caused by individuals moving between income groups (e.g. from ‘low’ to ‘middle’) and (3) ageing, as younger individuals enter the data and older individuals exit. Residential mobility-driven changes are primarily observed in ‘high-status’ neighbourhoods, while low-status upgrading neighbourhoods experience changes due primarily to the social mobility of their residents. Vogiazides and Mondani (2023) take this approach a step further, identifying a wider array of neighbourhood types via k-means clustering and sequence analysis. However, these approaches all fundamentally rely upon identifying predetermined neighbourhood types and assessing different patterns of residential mobility and incumbent change effects across these neighbourhoods. The following analysis instead begins without predetermined neighbourhood categories, using the magnitudes of decomposed neighbourhood change effects themselves to produce distinct neighbourhood clusters.
Research design
This analysis focuses on credit scores, which are indicative not merely of a consumer’s recent borrowing history, but also of the likelihood that they will be able to access credit in the future as well as on what terms (interest rates and fees). Credit scores impact one’s position within the housing market, playing a critical role in both mortgage lending decisions (Laufer and Paciorek, 2022) and increasingly in rental background checks (Rona-Tas, 2017). Households with low credit scores face greater reliance on informal channels such as family members and payday lenders; thus, credit scores serve as a measure of economic vulnerability, exposure to risk, and ability to reliably access economic resources (Dwyer, 2018). In the period following the Great Recession, the tightening of credit further increased the salience of credit scores for access to homeownership, making access to certain types of housing and neighbourhoods even more dependent upon an individual’s credit standing (Acolin et al., 2019). Average credit scores have increased steadily since the Great Recession, reflecting both economy recovery throughout the 2010s and the improvement of individual credit records as financial events tied to the crisis (i.e. foreclosures) were removed from credit score calculations. 1
This analysis uses the University of California Consumer Credit Panel, which contains longitudinal credit records for California residents between 2014 and 2019. The eligible population for each census tract consists of individuals that were observed with valid credit scores between 300 and 850 in California in both 2014 and 2019, excluding individuals who entered or exited the credit system or did not have a valid credit score. These exclusions likely bias estimates for neighbourhoods primarily composed of highly mobile populations, college students or seniors – as well as higher-poverty neighbourhoods where informal credit and payday loans are more prevalent than conventional forms of credit (Dwyer, 2018). Furthermore, this measure focuses on average credit scores across all individuals rather than households, given both the distinct credit histories of individual household members and the potential for household dissolution and formation. 2 While these features constrain the scope of the analysis, they permit the isolation and consistent measurement of residential mobility and incumbent change effects.
Average credit score across the entire population, total counts of stayers, out-movers and in-movers, and average credit scores for each of those sub-populations are calculated for each census tract in both 2014 and 2019. Eligible census tracts are limited to those which: (1) have sufficient population density, 3 (2) possess sufficient credit panel observations in both periods 4 and (3) have less than half of the adult population living in group quarters (university housing, military bases and prisons). These conditions limit noise introduced by small sample sizes and emphasize urbanized regions. Demographic and socioeconomic variables from the American Community Survey (ACS) are joined to these census tracts, measuring both initial neighbourhood characteristics (based on 2010–2014 estimates) and changes in neighbourhood characteristics over time (based on the difference between 2010–2014 and 2015–2019 estimates) that are centred, scaled and median-imputed. In addition, reflecting the likely significance of the foreclosure crisis in subsequent patterns of credit access, this analysis includes foreclosure risk scores developed for the Neighborhood Stabilization Program in 2009. 5 The resulting sample contains 7069 census tracts across California.
Following Coulton et al. (2012), changes in average credit scores across these census tracts are decomposed into three components: (1) change in average credit score resulting from individuals who remained in the same location between the two time periods, (2) change resulting from the difference in average credit scores between individuals moving into the neighbourhood and individuals moving out of the neighbourhood between the two time periods and (3) the change resulting from the relative growth (or decline) of movers and stayers as a proportion of the neighbourhood population. This decomposition for any given neighbourhood may be expressed through the following formula:

The first component of this formula
The second component
The final component
Distinct from prior decomposition approaches, which largely compare these decomposed effects across predetermined neighbourhood categories, this analysis uses the magnitudes of the decomposed effects themselves to identify discrete neighbourhood types. Following a descriptive assessment of residential mobility and incumbent change effects across the study neighbourhoods, hierarchical clustering is used to establish discrete categories of neighbourhoods based on the magnitude of each effect. Hierarchical clustering allows for the identification of outliers; while outliers are normally undesirable in cluster analyses, this is useful in the context of neighbourhood change because extreme cases of positive or negative change are likely to be conceptually significant. Other popular clustering methods, such as k-means clustering, often conceal these outliers by incorporating them into and skewing existing clusters. Furthermore, hierarchical clustering can be useful in identifying underlying neighbourhood types that may not be readily apparent. Mikelbank (2004), for example, uses hierarchical clustering to identify 10 distinct suburban configurations of demographic and socioeconomic factors, providing a nuanced illustration of suburban diversity. Hierarchical clustering provides a balance between outlier detection and cluster coherence, while also producing conceptually meaningful categories.
Results
Sources of neighbourhood change
The average credit score of eligible census tracts increased by 15.4 points between 2014 and 2019, from 682.2 to 697.6. This change in average neighbourhood credit scores is based on three populations: (1) individuals that remained within the same census tract between 2014 and 2019 (‘stayers’), (2) individuals that were located in the census tract in 2014 but had moved to a different location by 2019 (‘out-movers’) and (3) individuals that were not located in the census tract in 2014 but moved into the census tract by 2019 (‘in-movers’). Within eligible census tracts, roughly 63% of the observed sample remained within the same census tract between 2014 and 2019. While some census tracts experienced population increases and decreases, the population moving out of any given neighbourhood was generally replaced by a similarly sized population moving in. The incumbent change effect is calculated based on the same set of individuals that were located in the neighbourhood in both 2014 and 2019, while the residential mobility effect is calculated by comparing out-movers from 2014 with in-movers from 2019.
Both stayers and movers experienced credit score increases between 2014 and 2019. These increases reflect improving macroeconomic conditions during the latter half of the 2010s along with improving credit records as the lingering effects of the Great Recession faded. While California’s economy was impacted by the recession, the broader economy and the housing market had largely recovered by 2014 and continued to grow steadily until the Covid-19 pandemic (Myers and Park, 2020). Increases in credit scores were particularly dramatic in the communities that were most heavily impacted by the crisis, including both lower-income neighbourhoods in urban cores such as East Oakland, South Los Angeles as well as exurban inland communities such as in the Inland Empire east of Los Angeles. Stayers experienced credit score increases as their financial profiles recovered from the crisis, while the low credit scores of households moving out of these communities was countered by the higher credit scores of households moving in. While both incumbent change and residential mobility thus contributed significantly to the overall increase in average credit scores, the net increase in average credit score between out-movers and in-movers was larger than the gains experienced by stayers. Incumbent change effects contributed 7.3 points and residential mobility contributed 8.1 points to the overall average increase of 15.4 points (Table 1, Column 1). The scale of these effects varied widely across urban neighbourhoods in California, however, indicating substantial spatial variation in the extent of this credit score growth.
Characteristics of California census tracts and neighbourhood change clusters.
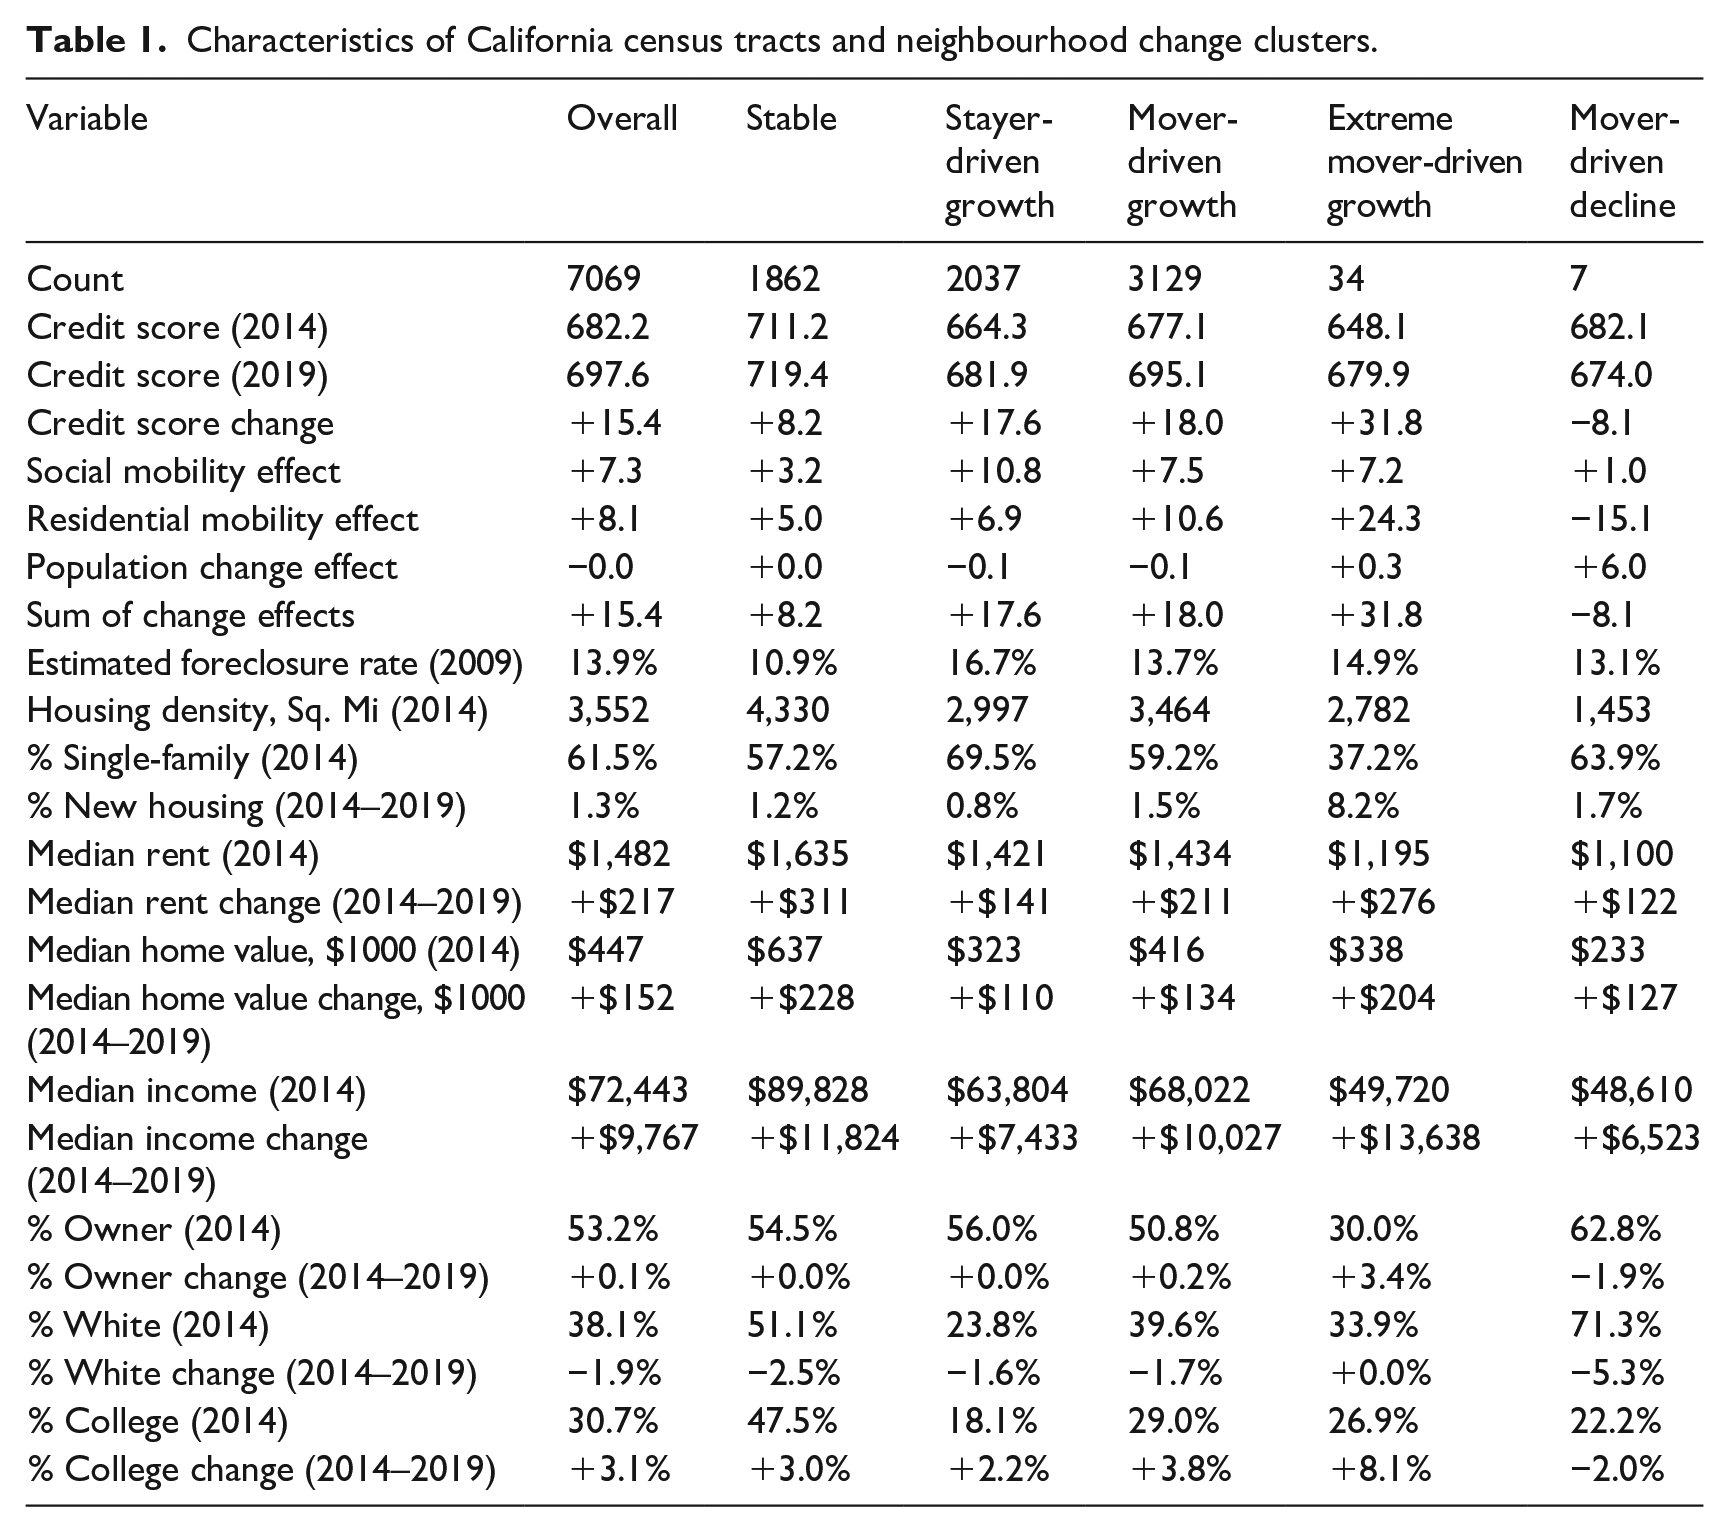
The scale of these effects may be influenced by a neighbourhood’s baseline average credit score at the beginning of the study period (Table 2, Column 1). Given that the range of possible credit scores is constrained, neighbourhoods with low average credit scores are more likely to experience increases over time compared to neighbourhoods with high average credit scores. Indeed, there is evidence of a robust negative relationship between average neighbourhood credit scores in 2014 and the change that those neighbourhoods experienced between 2014 and 2019. This regression to the mean is driven primarily by incumbent change effects, which exhibit an even stronger negative relationship between initial 2014 credit score and credit score changes over time. In other words, people who remained in neighbourhoods with high initial credit scores experienced smaller increases than those who remained in neighbourhoods with lower initial credit scores. While residential mobility effects were similarly negatively correlated with initial credit score, the scale of this correlation was much weaker, indicating that the net difference between out-movers and in-movers was much less strongly determined by a neighbourhood’s starting condition.
Bivariate and partial correlation coefficients for credit score change, social mobility effects and residential mobility effects.
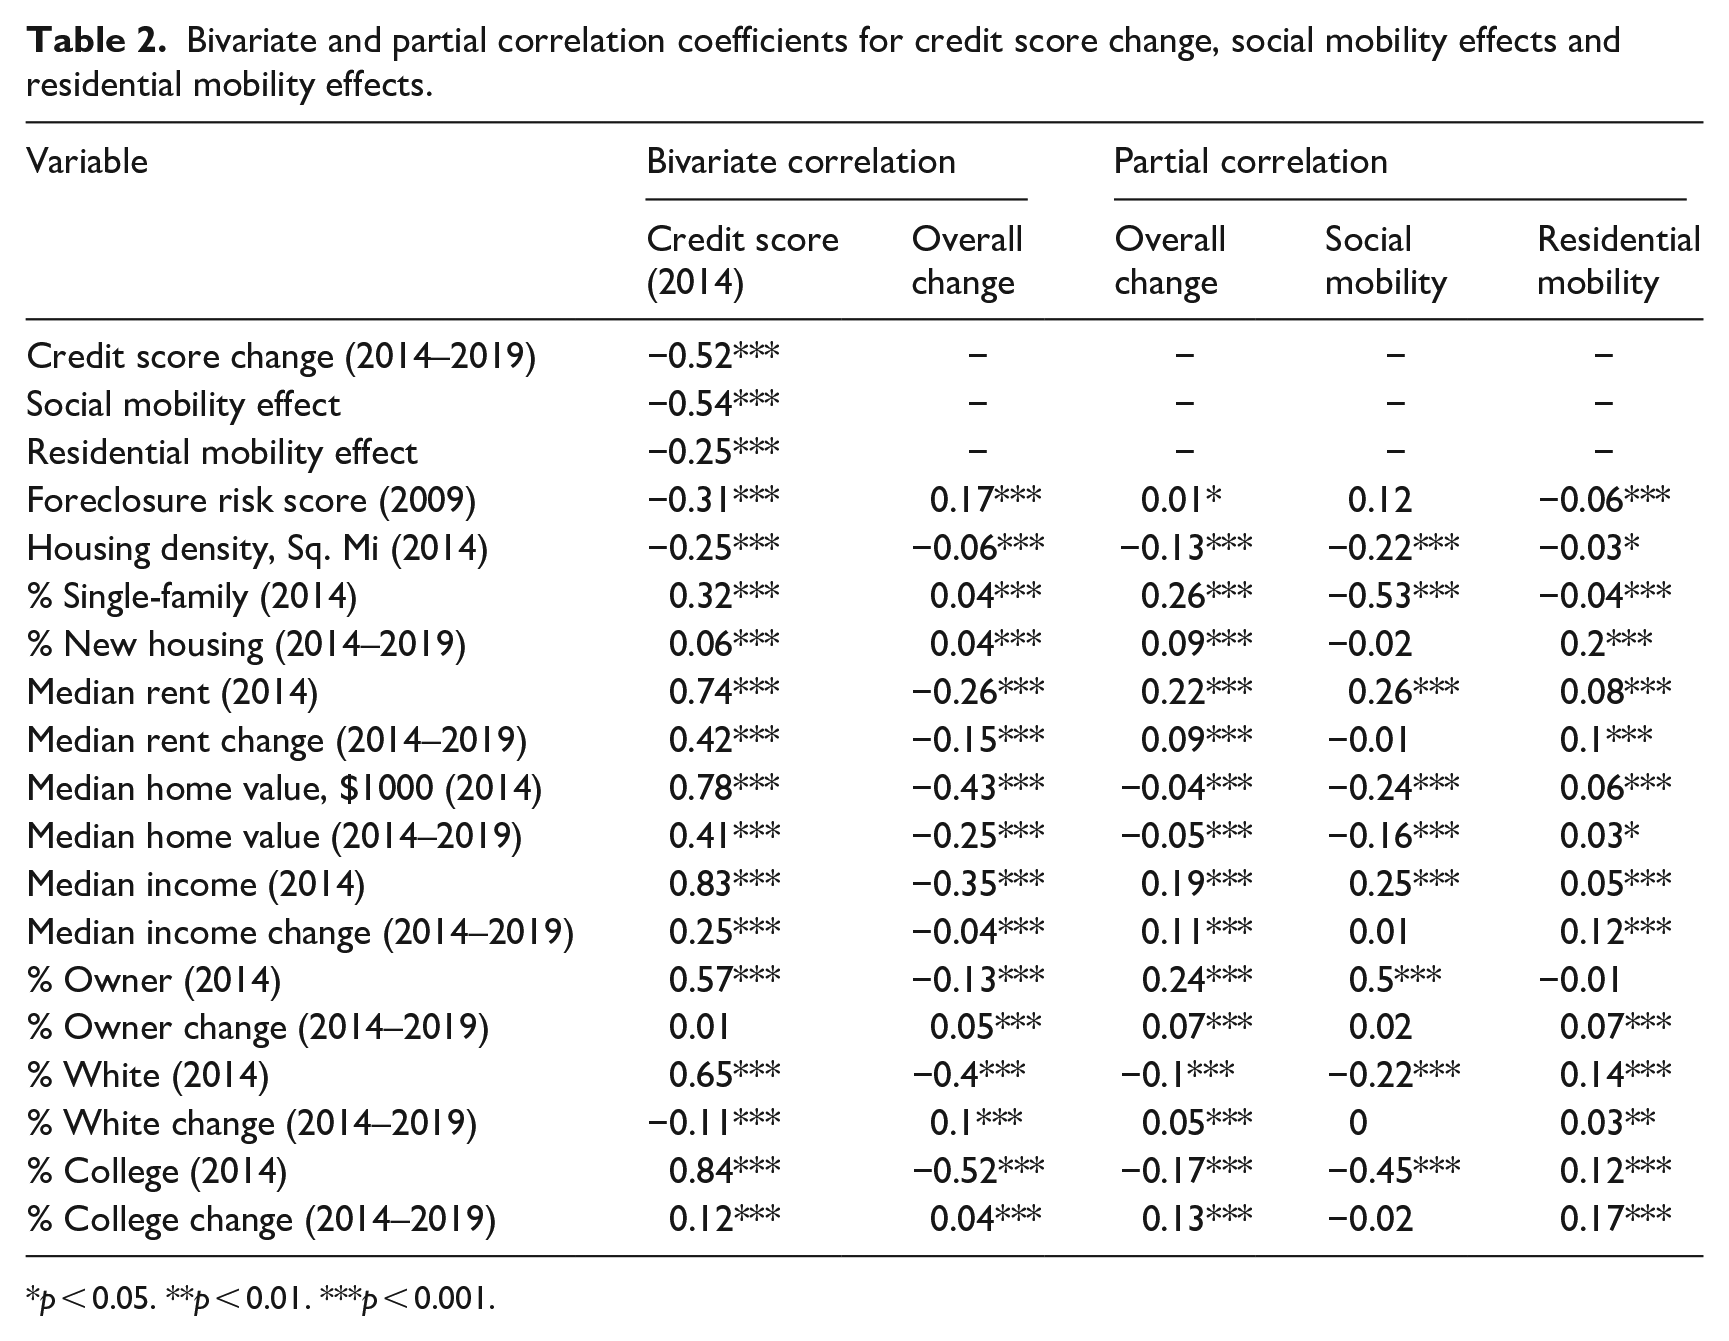
p < 0.05. **p < 0.01. ***p < 0.001.
Credit score change is associated with common census-derived proxies for neighbourhood change derived from census data – including income, educational attainment, racial composition and housing market conditions (Table 2, Column 2). Bivariate correlations reveal negative associations between credit score changes and other baseline neighbourhood measures drawn from the 2010 to 2014 ACS including median income, median rent, median home value, homeownership rate, percent white and percent college educated. Credit score changes are also positively associated with prior foreclosure risk in 2009. This again alludes to regression to the mean: neighbourhoods with lower incomes, lower homeownership or higher foreclosure risk, may simply have had lower credit scores at the beginning of the time period, and therefore have more room to experience growth compared with neighbourhoods where initial scores were higher. Regression to the mean is addressed via partial correlation that controls for initial credit score averages in 2014 (Table 2, Column 3). Controlling for initial credit score, credit score changes remain negatively associated with home values, percent white and percent college-educated, albeit to a lesser extent. Correlation with single-family housing and new housing construction are strengthened. Most significantly, the relationship between credit score growth and median income, median rent, median rent change and homeownership rates shift from negative to positive. Excepting median home value, changes in these neighbourhood variables between the 2010–2014 and 2014–2019 ACS periods are also positively associated with credit score growth: as average credit scores increased, so too did median incomes, homeownership rates, percent white and percent college educated.
Decomposing sources of credit score change into incumbent change and residential mobility effects reveal the extent to which each mechanism is driving these various associations after controlling for initial neighbourhood credit score (Table 2, Columns 4–5). Residential mobility effects are positively correlated with the share of new housing construction while incumbent change effects are not associated with new housing construction at all. New housing is likely to be occupied by in-movers with higher credit scores and large amounts of new housing will thus alter the population balance of a neighbourhood in favour of movers, whereas incumbent residents are less likely to experience the same degree of increase. By contrast, incumbent change effects appear primarily responsible for the positive relationship between credit score growth and homeownership rates, which reflect the benefit accruing to incumbent homeowners that are not necessarily experienced by movers. Residential mobility is the primary driver of the relationship between homeownership growth and credit score change, as such growth is driven by newer homeowners moving in. Incumbent change and residential mobility also contrast with respect to racial composition and educational attainment: residential mobility effects are positively associated with share white and share college-educated, while incumbent changes are negatively associated. This finding is somewhat counterintuitive, as it may be expected that incumbents of whiter and more highly educated communities would see larger credit score increases over time after controlling for baseline characteristics.
Credit score increases resulting from residential mobility were associated with neighbourhoods that became whiter and more highly educated between 2014 and 2019. Increases in median rents and median home values are also primarily reflected in credit score increases driven by residential mobility effects, whereas incumbent residents in rapidly appreciating neighbourhoods do not experience benefits in the form of credit score increases. This reflects the role of rising housing costs as a growing barrier to entry for households with lower credit scores, whereas those already living in increasingly costly areas may be able to remain without corresponding credit score increases due to already owning their home or otherwise attaining residential stability (e.g. formal or informal rent stabilization). Increases in various measures of socioeconomic status such as median income, homeownership rates and college education are all primarily associated with increases in residential mobility effects rather than incumbent change effects, highlighting the significance of residential mobility in driving socioeconomic change. At the same time, incumbent change is strongly associated with baseline neighbourhood conditions, with high rates of homeownership and high incomes in particular resulting in further gains after controlling for regression to the mean.
Types of neighbourhood change
To understand how these mechanisms of neighbourhood change are interrelated across different neighbourhood contexts and to identify neighbourhoods experiencing different types of socioeconomic change, I employ hierarchical clustering on the magnitude of the incumbent change and residential mobility effects for each neighbourhood. Five clusters are selected to maximize interpretability (Table 1, Columns 2–6). Figure 1 visualizes these clusters in cartesian space, with vertical and horizontal lines delineating between positive or negative incumbent change and residential mobility effects, while the position of each census tract observation relative to the diagonal line indicates whether incumbent change or residential mobility effects contributed more strongly to overall changes in average credit scores. Slightly more than half (55%) of the observations fall above the diagonal line, indicating that residential mobility effects outweighed incumbent change effects in the majority of neighbourhoods. The delineation between these clusters also closely aligns with average levels of credit score growth during this period, with the ‘Stable’ and ‘Mover-Driven Decline’ categories exhibiting below-average levels of credit score growth, while the remaining three categories exhibit above-average levels of growth. Figure 2 illustrates the spatial distribution of these clusters, which are described in greater detail below.
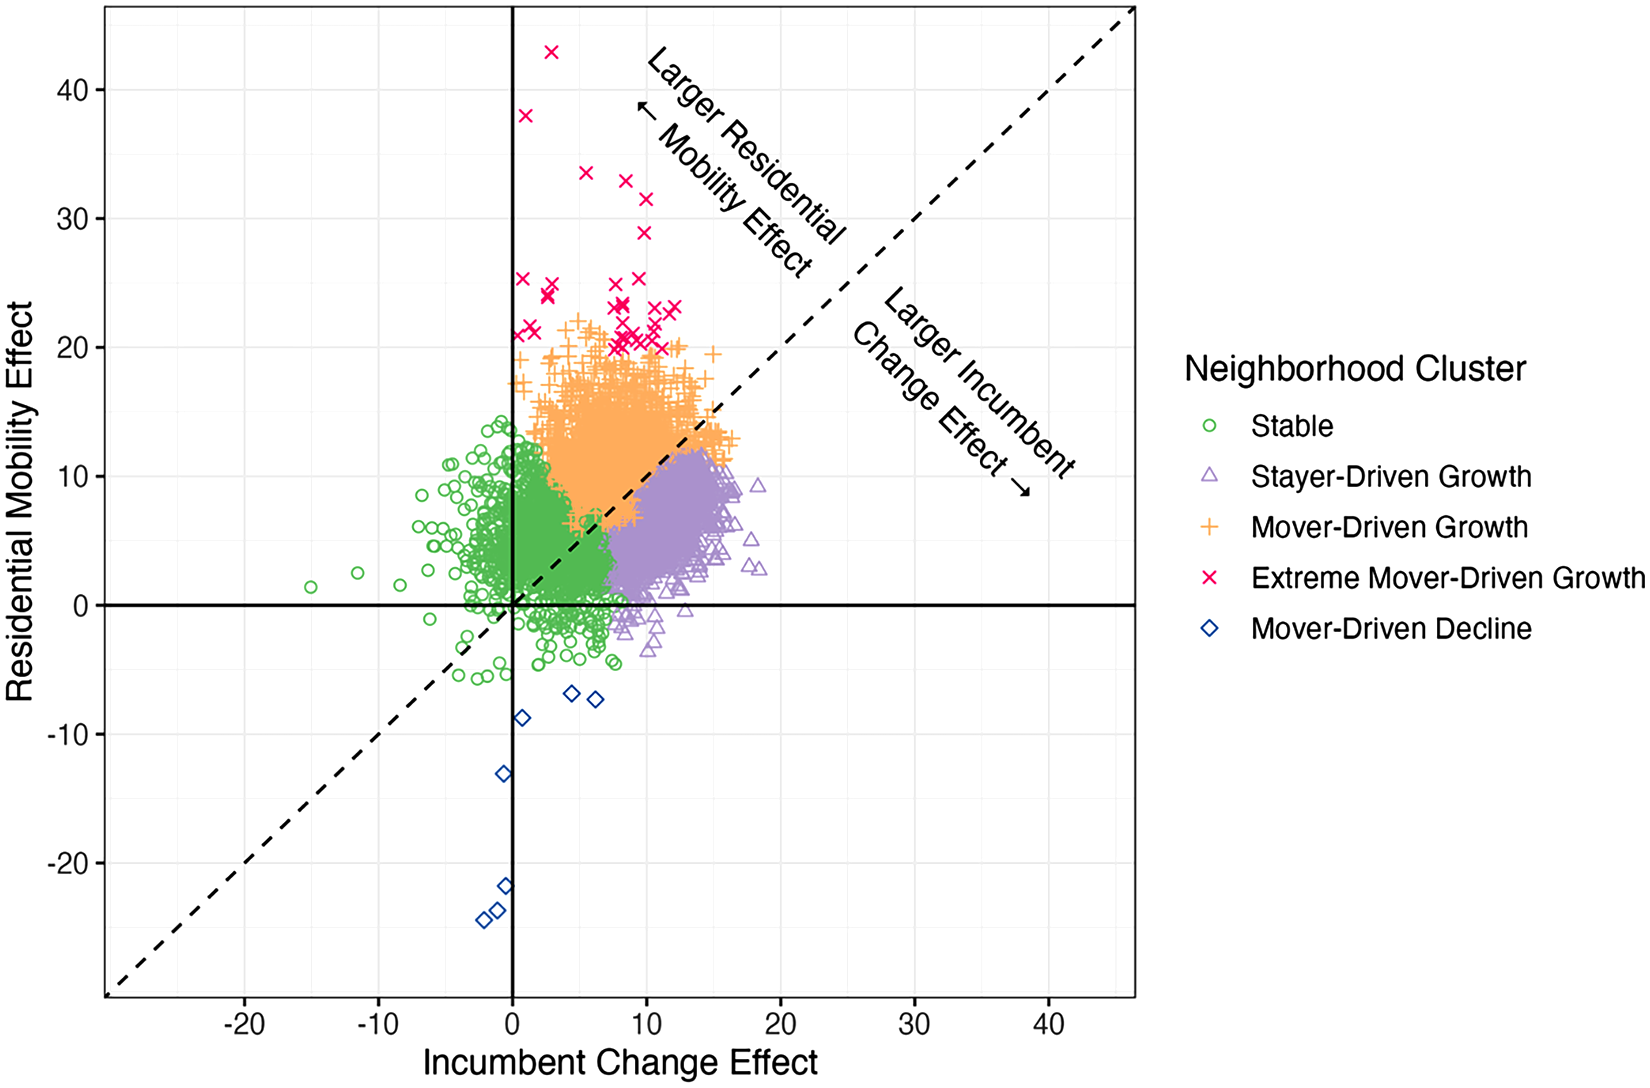
Neighbourhood change type clusters by social mobility effect and residential mobility effect.
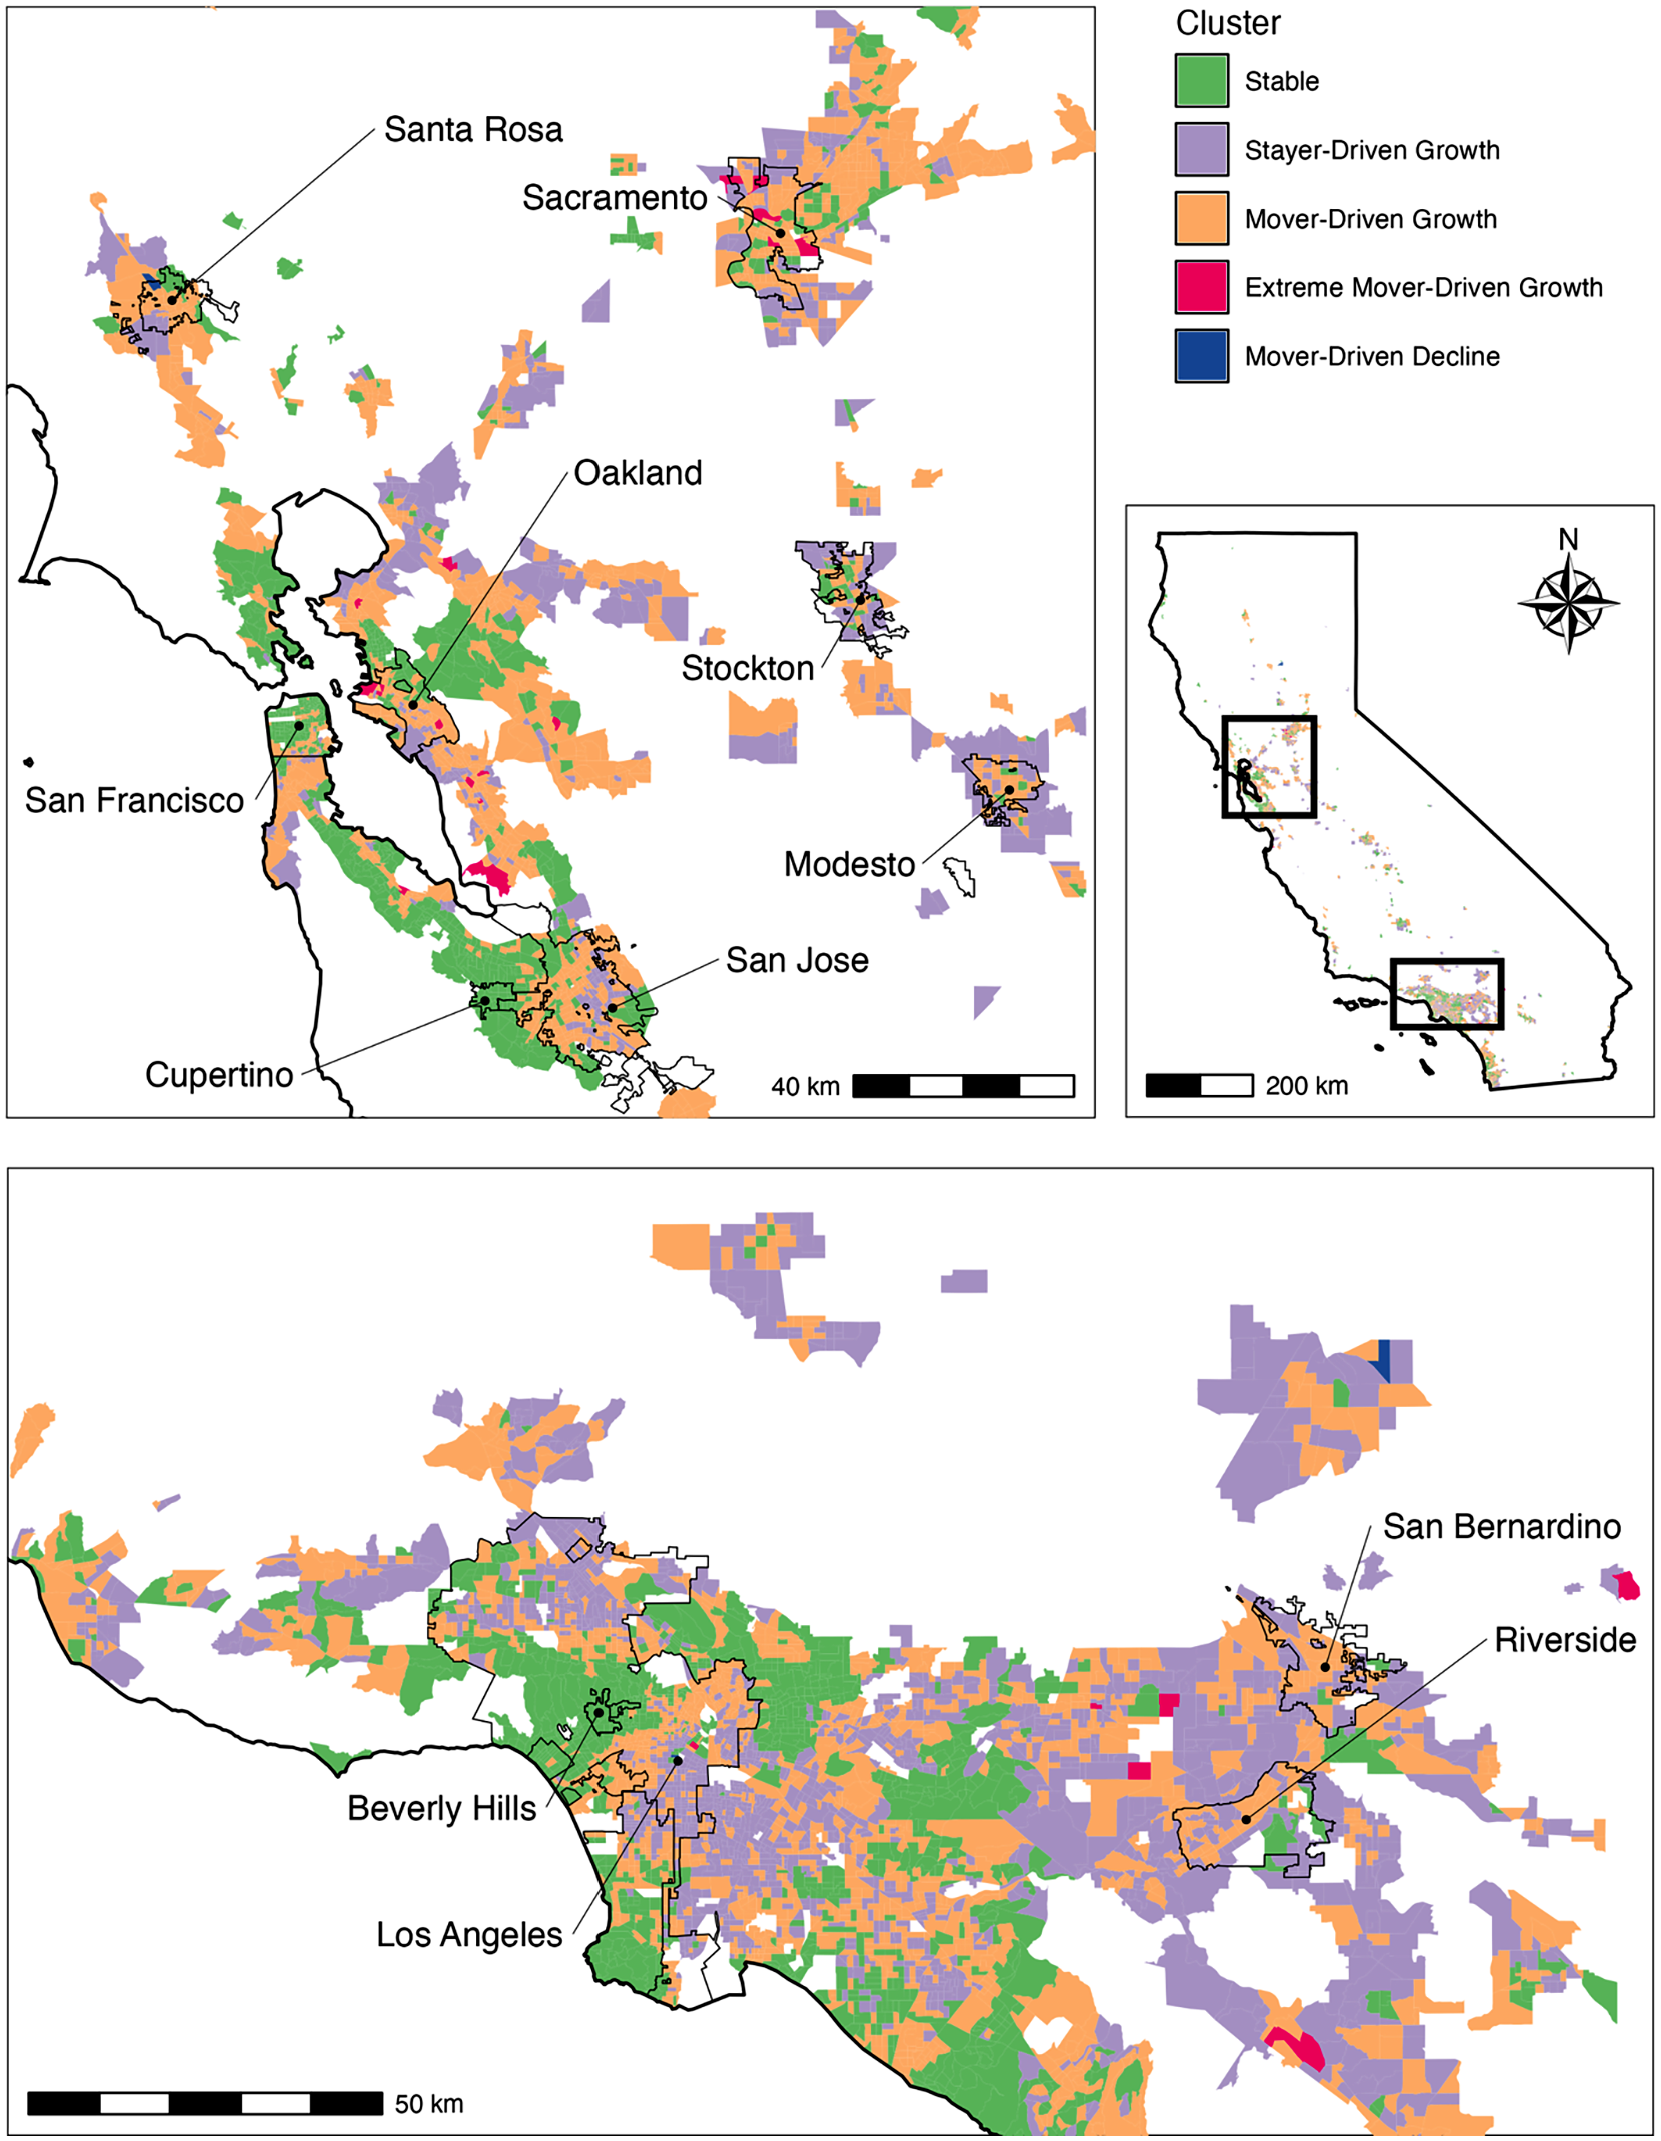
Census tract clusters in Northern and Southern California.
Category 1: Stable
These neighbourhoods experienced below-average increases (or even decreases) in average credit scores between 2014 and 2019 (Table 1, Column 2). This cluster represents neighbourhoods close to the centre of the distribution, with incumbent change effects (+3.2) and residential mobility effects (+5) that are roughly half the average magnitude across the state. According to the variable importance analysis, this cluster is most strongly defined by high levels of educational attainment, high median home values and large increases in home values over time, reflecting the association of this cluster with affluent urban and inner suburban, including large portions of expensive cities like San Francisco and Los Angeles, as well as affluent suburbs such as Beverly Hills and Cupertino (home to Apple). Low credit score growth in more affluent neighbourhoods is consistent with the finding that neighbourhoods with high initial credit scores have less room to experience further credit score growth. Indeed, while exhibiting low average credit score growth, neighbourhoods in this category had by far the highest initial average credit scores in 2014. This reflects an important limitation of credit scores in measuring neighbourhood change, as the ceiling on credit scores means that cases of growing affluence in already affluent areas (e.g. Lees, 2003) cannot be detected.
Category 2: Stayer-driven growth
This category represents places that experienced above-average levels of credit score growth driven primarily via improvements in the credit scores of those that remained within the same neighbourhood during the study period (Table 1, Column 3). These neighbourhoods had relatively low initial credit scores and median incomes on average, as well as the lowest levels of college education and share white of any category. This category describes neighbourhoods with a diverse and ascendant lower-middle class, located particularly in central parts of Los Angeles, as well as in more racially diverse suburban neighbourhoods. These represented areas that were less white and less college-educated, with relatively high rates of homeownership alongside low home values. This cluster thus represents sites that provide opportunities for (relatively) more affordable homeownership opportunities, particularly for people of colour and populations without higher education. This neighbourhood type is important from a policy perspective, as it points to neighbourhood spaces where incumbent socioeconomic ascent can occur alongside improvements in the socioeconomic position of in-movers.
Category 3: Mover-driven growth
The category encompasses neighbourhoods that experienced above-average increases in credit scores that were driven primarily by residential mobility effects – this is also the largest single category across the state (Table 1, Column 4). This indicates that in a period of rapid economic change and rising housing costs, mover-driven change was the dominant dynamic across the state. Neighbourhoods in this category were spread throughout the state, located not only in ‘gentrifying’ urban cores but also in more distant inland locales (e.g. Stockton and Modesto in northern California; San Bernardino and Riverside in southern California). This points to growing spillovers from high housing costs that have pushed households towards cheaper neighbourhoods further from employment centres (Blumenberg and Wander, 2023). These neighbourhoods tended to have incomes that were slightly lower than the statewide average and experienced an above-average increase in the share of college-educated residents, pointing to the theoretical role of educational attainment in mobility-driven neighbourhood change.
Category 4: Substantial mover-driven growth
This category features a small handful of neighbourhoods across the state that experienced even higher levels of growth due to residential mobility (Table 1, Column 5). These include a handful of neighbourhoods that experienced substantial redevelopment and new housing, which include a diverse array of contexts encompassing the rapidly evolving neighbourhoods of downtown Los Angeles, Oakland and Sacramento, as well as greenfield developments on the outskirts of the Los Angeles metropolitan area. The most significant predictors for this cluster were new housing development and extremely substantial increases in the college-educated population, reflecting the status of these neighbourhoods as largely new developments catering to an increasingly affluent population. These neighbourhoods initially featured relatively low incomes, rents, home values, homeownership rates and educational attainment, but experienced significant changes that are accompanying the new housing development.
Category 5: Mover-driven decline
This category is represented primarily by neighbourhoods that experienced devastating wildfires in 2018 (Table 1, Column 6). This includes the entirety of the town of Paradise in northern California, which experienced severe population loss alongside negative economic and financial outcomes for those that remained (McConnell et al., 2021). It also includes the Coffey Park neighbourhood in the city of Santa Rosa north of San Francisco, which was similarly impacted by wildfires in 2018. Due to the recent and acute nature of these events, their impact was not yet fully incorporated into census estimates. This category is indicative of the extreme circumstances required for substantial mover-driven declines and reveals the extent to which the impacts of extreme events may be reflected in measures that specifically capture residential mobility effects.
These identified clusters align with other recent efforts to develop more nuanced typologies of neighbourhood change. The category of ‘stable’ neighbourhoods aligns with areas in both the San Francisco Bay Area and Los Angeles region identified by the Urban Displacement Project as ‘exclusive’, while areas experiencing mover-driven change often align with areas identified as experiencing gentrification (Thomas et al., 2021). Similarly, ‘Stable’ neighbourhoods in Los Angeles county largely coincide with neighbourhoods identified by Delmelle (2016) as ‘Stable Elite’, while sites of mover-driven change are most often found in ‘young urban’ neighbourhoods, and stayer-driven change is most strongly associated with neighbourhoods classified as ‘persistently struggling’. This also aligns with the finding that stayer-driven change is generally associated with neighbourhoods that have relatively disadvantaged populations, but that are experiencing upward economic mobility over time.
Discussion
Decomposing the separate contributions of residential mobility and incumbent change provides several insights into the nature of changes in credit access in California during the late 2010s. Mobility and incumbent change effects were often concurrent and complementary, with most neighbourhoods experiencing substantial increases in credit scores for both movers and stayers during the study period. This reflected the broad recovery in the consumer credit system following the great recession, and indicates that stable populations experienced gains from this economic recovery alongside new residents. However, despite the relatively widespread nature of these credit score increases, there remained notable differences in the extent of changes driven by residential mobility and incumbent change within specific types of neighbourhood contexts.
Some neighbourhoods experienced credit score increases primarily by virtue of incumbent households increasing their credit scores over time, particularly in neighbourhoods characterized by more diverse populations, higher rates of homeownership, and lower home values. These are places where the recovery from the great recession likely had the largest impact on the credit standing of individual residents, and points to the rapid reincorporation of these urban spaces and populations into the consumer credit system after the disruptions caused by the great recession. The fact that these neighbourhoods – places such as South Los Angeles, the Inland Empire suburbs outside of San Bernardino and Riverside and the outer eastern suburbs of the San Francisco Bay Area – are largely associated with lower and moderate-income communities and communities of colour with higher rates of owner-occupation reflects the central role of homeownership and residential stability in promoting economic mobility within these communities and in facilitating rapid recovery in access to consumer credit even after acute economic disruptions. The fact that credit score increases led by incumbent change were limited to these neighbourhoods, however, reflects the relatively narrow set of circumstances in which the incumbent population was the driving force in economic recovery. By contrast, the large volume of neighbourhoods that experienced credit score increases primarily through population turnover indicates that many urban spaces required an inflow of newcomers – and an outflow of residents with lower credit scores – in order to facilitate their ascent, as increases in the credit scores of the incumbent population within these neighbourhoods were not keeping up with mobility-driven changes. In contrast with neighbourhoods experiencing substantial incumbent change, population turnover served as a necessary mechanism for the reincorporation of these neighbourhoods into the consumer credit system.
These findings also highlight the impacts of acute events such as the substantial new housing development and wildfire destruction. Rapid housing growth leads to significant population growth and mover-driven increases in credit scores, reflecting the tendency for new housing to mainly cater to higher-resource households. These neighbourhoods appear within contrasting contexts of rapidly densifying downtown neighbourhoods (i.e. Los Angeles, Oakland) on the one hand, and new-build suburban and exurban developments on the other hand. These combinations of dense urban and sprawling exurban communities represent the latest frontiers for capital investment in the built environment, with a rarity that reflects continued barriers to housing production across the state. Wildfire-related housing destruction and displacement in places such as Paradise, meanwhile, are reflected in the opposite phenomenon – population decline and mobility-driven decreases – speaking to the growing impact of climate risks upon exurban communities and the accompanying risks not only for residential stability but also for financial security.
Conclusion
Consumer credit provides a valuable lens for assessing the spatial impacts of urban restructuring and neighbourhood change, particularly in the context of economic and financial recovery a decade after the great recession. While the role of financial systems in urban change is customarily interpreted in terms of capital flows within circuits of production and the built environment (e.g. Smith, 1996; Soja et al., 1983), the great recession revealed that systems of consumer credit also play a significant role in shaping patterns of urbanization and urban change (Schafran, 2019; Wyly et al., 2009). Beyond the direct impacts of the financial crisis, little ongoing attention has been paid to shifts in access to consumer credit at the neighbourhood scale. The results of this analysis point to both the scale and diversity of changes in neighbourhood credit access across California in the late 2010s. Growth in credit scores was remarkably consistent and widespread throughout the state, indicating the widespread recovery of household finances and the rapid recovery of the consumer credit system. However, the diverging mechanisms by which this credit score growth occurred illustrate the spatial variation between residential mobility and incumbent change underlying these apparently sweeping changes. This differentiation has broader implications for urban regions undergoing significant economic upheaval, indicating whether existing communities are directly benefiting from (or suffering from) changing economic conditions or whether observed aggregate changes are primarily the product of population turnover.
Whereas prior studies have considered the separate roles of residential mobility and incumbent change, the focus has largely remained on how these mechanisms differ between predetermined neighbourhood categories (e.g. Hochstenbach and van Gent, 2015). By using decomposed neighbourhood change effects themselves as a means of categorization, this analysis organically identifies types of neighbourhoods in which specific mechanisms of change are more prevalent. This approach distinguishes neighbourhoods seeing socioeconomic improvements as a result of incumbent change and those witnessing changes aligned with processes of population turnover. Future research has the potential to further develop this approach, both for understanding the evolving geography of credit access and for measuring other neighbourhood changes. Other regional and temporal contexts, such as lower-cost ‘rust belt’ cities, would provide insights into the nature of stayer-driven and mover-driven change in contexts of economic stagnation or decline. Future analyses could also expand to include the role of demographic processes (i.e. births and deaths) on these neighbourhood changes (Bailey et al., 2017). Further exploration into the role of individuals in aggregate changes – whether in credit scores or incomes – offers a valuable opportunity to further unravel the complexity of neighbourhood change.
Footnotes
Acknowledgements
The author would also like to acknowledge Carolina Reid, Evan White, Vikram Jambulapati, Karen Chapple, Daniel Rodríguez and Taesoo Song for their feedback and support on this project. Thanks also to editor Kathe Newman and to three anonymous reviewers for their extremely constructive feedback on this manuscript.
Declaration of conflicting interests
The author declared no potential conflicts of interest with respect to the research, authorship, and/or publication of this article.
Funding
The author disclosed receipt of the following financial support for the research, authorship, and/or publication of this article: The author would like to thank the California Policy Lab for hosting and facilitating access to the University of California Consumer Credit Panel and the Irvine Foundation for providing funding support.