
Abstract
The paper estimates the production, realisation, and capture of economic value in the world economy from 2000 to 2014. Estimates show how value is produced and transferred across 56 sectors and 43 countries. The methodology builds on the Marxian literature and the productive-unproductive classification. Value production is the labour directly and indirectly required to produce goods and services within global value chains. Value capture is the deviation between value realisation and production. Results show that China is the largest giver of value while the USA is the largest capturer of value in the world economy. Unproductive activities (real estate, finance, and trade) and capital-intensive industries (manufacturing, mining, and oil) are value capturers. Labour-intensive industries (health, education, construction, agriculture, and services) transfer value away. The paper also demonstrates that the theory of unequal exchange is incompatible with the conventional assumption that all activities are productive. Only under the Marxian productive-unproductive classification do the results converge with unequal exchange theory.
Introduction
China’s entry into the World Trade Organisation (WTO) in 2001 and the subsequent shift of manufacturing from the United States and Europe to Asia have dramatically reshaped global value chains. This new phase of globalisation, driven by China’s ascent, has resulted in significant deindustrialisation in the United States and Europe, with profound impacts on wages, employment, politics, and income distribution. Against this backdrop, the present study provides a fresh empirical analysis of how economic value is produced and distributed in the global economy.
This paper has two main objectives. The first is to estimate the production, realisation, and capture of economic value in the world economy. The second is to identify the causes of value capture within global value chains. To achieve these goals, the empirical approach uses input-output data for 56 sectors across 43 countries from 2000 to 2014. The methodology is based on Marxian literature and the classification of economic activities into productive and unproductive categories.
The estimation methodology is based on the ‘New Interpretation’ of Marxian value theory (Duménil, 1980; Duménil et al., 2009; Foley, 1982) and applies this framework to the global economy. Marxian value theory is chosen because it enables the quantification of value creation, realisation, and capture across different industries and countries. In this respect, the paper employs the following definitions. Value production is the total (direct and indirect) labour embodied in commodities, where commodities are goods and services produced for profit. The labour input to production is the direct labour embodied, while the non-labour inputs (machines, plants, equipment, and raw materials) are the indirect labour embodied in production. Since commodity production occurs within global value chains, these definitions apply across industries and countries on a global scale. Value realisation, on contrary, is the total labour drawn from the global pool of value production. Value capture is the gap between value realisation and production. Broadly speaking, production determines contribution, realisation determines allocation, and capture determines transfer. These distinctions are important because national and industry income accounts record values realised, not necessarily produced.
These concepts are related to the literature on unequal exchange and to the definition of exploitation as the unequal exchange of labour (Cogliano et al., 2022b, 2024). By expanding Marx’s original definition of exploitation (within-firm appropriation of unpaid labour by capitalists), the concept of exploitation as the unequal exchange of labour encompasses two key aspects: (i) the class relations between workers and capitalists at the firm level; and (ii) the trade relations between industries and countries at the global level. Capitalists exploit workers at the firm level because capitalists draw more labour from workers than what capitalists contribute with their own labour to production, implying that the value that workers receive as wages is less than the value that they produce for the capitalist. In a similar way, industries and countries exploit one another at the global level when they draw more labour than what they contribute. The class and trade dimensions of exploitation (defined as the unequal exchange of labour) are correlated, and the present study provides estimates of both: activities with higher rates of exploitation are mostly labour-intensive activities that also tend to transfer value away, while activities with lower rates of exploitation are mostly capital-intensive activities that tend to capture value from other activities.
Marxian value theory additionally introduces the productive-unproductive classification of economic activities (Mohun, 1996; Shaikh and Tonak, 1994). Productive activities are economic activities that create value through the production of new commodities, as either goods or services produced for profit. Unproductive activities are economic activities that do not create new commodities and therefore consume or recirculate the value produced in productive activities. Finance, insurance, real estate, wholesale trade, retail trade, and not-for-profit government services do not create new commodities and thus must be classified as unproductive. This classification does not imply that unproductive activities are secondary, less important, or unnecessary; it simply splits the economy into the creation of value-added and the consumption of value-added. Unproductive activities are in many ways very much necessary for the production and realisation of value: finance provides credit for investment in productive activities; public schools provide skilled labour for the job market; government agencies provide research and development for high-risk high-return investments (as in the creation of the internet, GPS, and vaccines); and wholesale and retail traders distribute the commodities. In some other cases, on the contrary, unproductive activities can put a drag on value production: high taxes, rents, and interest payments might draw excessively from the pool of value-added and thus limit the ability of productive activities to grow and invest.
Marx hypothesised that three factors explain why value realisation deviates from value production: (i) A share of the value created in the production sphere must pay for unproductive activities in the circulation sphere, which do not create new commodities but are necessary for the realisation of value through trade (Marx, 1991 [1894]: chapter 17, 394–416) and for the financing of commodity production (Marx, 1991 [1894]: chapter 19, 431–439); (ii) Labour-intensive activities tend to transfer value to capital-intensive activities due to differing capital/labour ratios and the tendency of competition to equalise profit rates relative to the capital advanced (Marx, 1991 [1894]: chapter 9, 254–272; chapter 10, 273–301; chapter 11, 302–306); (iii) The concentration and centralisation of capital can increase the market power of larger firms (Marx, 1982 [1887]: chapter 25, 762–871) and their ability to capture value from smaller firms (Marx, 1991 [1894]: chapter 15, 349–377), where concentration and centralisation are facilitated by the credit system (Marx, 1991 [1894]: chapter 27, 566–573). To test Marx’s hypotheses on the causes of value capture, this paper employs econometric techniques and constructs a panel dataset with 36,120 observations at the country-industry level.
The empirical evidence from global value chains provides support to Marx’s hypotheses on the mechanisms of value capture. Most importantly, the data reveal deviations between the produced and realised rates of exploitation. Due to value transfers across industries and countries, exploitation rates can be measured both in terms of values produced and values realised. Countries and sectors that transfer value away can have high rates of exploitation produced but low rates of exploitation realised. Conversely, countries and sectors that capture value can have low rates of exploitation produced but high rates of exploitation realised. This distinction is relevant because exploitation rates computed directly from national income accounts and input-output matrices are based on values realised, which can deviate substantially from the values actually produced.
The empirical results are relevant because they provide concrete estimates of what Mazzucato (2020) named ‘value making’ and ‘value taking’ in the world economy. Results for the 2000–2014 period indicate that China is the largest giver of value while the United States is the largest capturer of value in the world economy. Alongside unproductive activities (real estate, finance, insurance, and trade), capital-intensive industries (manufacturing, mining, and oil) tend to capture value. On the other hand, labour-intensive industries (health, education, construction, agriculture, and services) tend to transfer value away. Because labour-intensive activities are mostly located in the service sectors and in developing economies, value tends to be transferred from poorer to richer countries and from services to capital-intensive industries. But the data also reveal the hierarchy among rich countries themselves, since developed nations transfer large sums of value to unproductive activities (finance, insurance, real estate, and trade) controlled by American companies. The United States captures value not only from developing countries but also from other developed economies.
Labour-intensive industries specialising in health, education, construction, agriculture, and productive services are the largest givers of value, and thus where the gap between produced and realised rates of exploitation are the largest. On the other hand, unproductive activities (real estate, trade, finance, and insurance) and capital-intensive industries (manufacturing, mining, and oil extraction) draw the largest sums from the global pool of value-added. This pattern can explain the central role of industrialisation and the rise in capital intensity associated with economic development. It can also explain the growing adoption of artificial intelligence (a capital-intensive labour-saving technology) in the service sectors. The automation of labour-intensive services through the employment of artificial intelligence raises the capital/labour ratio and is a potential source of value capture for capitalists in the service industries.
Lastly, the paper demonstrates that the theory of unequal exchange, which claims that rich countries exploit poorer countries (Dorninger et al., 2021; Hickel et al., 2022; Infante-Amate et al., 2022), is incompatible with the conventional assumption that all activities are productive. Only under the Marxian productive-unproductive classification do the empirical results converge with unequal exchange theory. This is a consequence of the massive relocation of productive capital to China and the growth of unproductive activities in the United States. The United States captures value from developed and developing countries alike, but does so primarily through unproductive activities—such as finance, real estate, and wholesale and retail trade—dominated by American companies.
The paper is organised as follows. Section 2 presents the data sources and the classification of productive and unproductive activities. Section 3 presents the estimation methodology. Section 4 presents the empirical results. Section 5 presents the econometric analysis on the causes of value capture. Section 6 concludes the paper. Additional material is included in the appendix. The panel datasets constructed for this paper contain data at four different levels of aggregation: country-industry, country, industry, and global. The datasets are available for download in the Supplemental material section.
Data sources and the productive-unproductive classification
The estimates in this paper derive from the World Input-Output Database (Dietzenbacher et al., 2013; Timmer et al., 2015, 2016). The WIOD provides global input-output tables and data on capital stock, employment, self-employment, and wages for 56 industries across 43 countries during the 2000–2014 period. Table A1 in the appendix lists the countries included. The WIOD comprises the World Input-Output Tables (WIOT) and the Socio-Economic Accounts (SEA). Input-output matrices are taken from the WIOT. Data on capital stock, employment, self-employment, and labour compensation are taken from the SEA.
The WIOT are denominated in nominal US dollars while the SEA data are denominated in units of national currencies. To convert national currencies into US dollars, this paper uses the same nominal exchange rates that were used to construct the WIOT. All variables are then adjusted for inflation using constant 2015 dollars from the World Bank. Computations are conducted at the country-industry level, encompassing 2408 observations (56 countries × 43 industries) for each variable per year. When necessary, variables can be aggregated by either country or industry.
The WIOD relies on the United Nations’ System of National Accounts (SNA) and thus, by convention, records the values realised by country and industry, not the values produced. To distinguish value realisation from value production, this paper estimates value production using labour values from Marxian theory, where labour values measure the average total labour (directly and indirectly) embodied in commodities. Rather than measuring the labour realised by market prices, labour values measure the vertically integrated (i.e. upstream) labour embodied in commodity production.
Labour values from Marxian theory comprise a superior index of labour productivity when compared to the conventional labour productivity index based on value-added, since only labour values can properly measure the decreasing total labour content of goods and services (Cogliano et al., 2018, 2022b; Flaschel et al., 2013). The conventional labour productivity index based on value-added per person or per work hour is biased by market power and by changes in relative prices unrelated to productivity. Marxian labour values, on the contrary, measure the total labour content of goods and services (which tends to decrease over time) and are thus less biased by monopoly prices and changes in relative prices unrelated to labour productivity.
More fundamentally, a crucial component of the empirical approach in this paper is the classification of productive and unproductive activities. Unproductive activities do not create value and thus must draw from the global pool of value-added. Likewise, the labour employed in unproductive activities is paid for from the value-added of productive activities. The paper employs the productive-unproductive classification from Tsoulfidis and Paitaridis (2019), Tsoulfidis and Tsaliki (2019), and Shaikh and Tonak (1994). Table A2 in the appendix classifies the 56 industries of the WIOD into productive and unproductive activities. Productive activities exclude activities that do not create new commodities, such as: finance, insurance, real estate (but not construction), wholesale and retail trade (trade margins only), not-for-profit activities, and government administration. The same classification is implemented in Rotta and Kumar (2024) at the global level. The present study does not therefore implement the ‘knowledge rent’ approach of Rotta (2024, 2022, 2018), who classified as unproductive activity the production of knowledge in industries like pharmaceutical and chemical manufacturing, software, movie and music production. It is worth noting, in this respect, that the United Nations’ SNA has yet to improve the measurement of intangible goods and intangible capital.
Marxian value theory and the productive-unproductive classification have been, nonetheless, subject to critique (see Hornborg, 2022, for a recent example; and the literature addressed in Mohun (1996), Yoshihara and Veneziani (2013) and Cogliano et al. (2018); and in Shaikh (2016: 129)). At the theoretical level, the productive-unproductive categorisation derives from the fact that activities like trade, finance, and real estate are necessary for production but do not create new commodities. The Marxian tradition, however, has not yet reached a consensus on what should be classified as productive, and the productive-unproductive categorisation has thus been questioned for its ambiguous identification strategy. For example, there has been no universally accepted categorisation for the advertising, accounting, security, and legal service industries; Rotta (2024, 2022, 2018), Rotta and Teixeira (2019, 2016), and Rotta and Paraná (2022) classify knowledge creation as unproductive, contrary to most of the Marxian literature; and Işıkara and Mokre (2022) compute price-value deviations in the world economy but ignore the productive-unproductive categorisation altogether.
In this respect, the present study compares the Marxian approach and the conventional SNA approach by computing all estimates twice: first, under the Marxian classification of productive-unproductive activities described in Table A2 and, second, under the conventional SNA assumption that all activities are productive. This comparison reveals a major implication: the theory of unequal exchange is incompatible with the conventional SNA assumption that all activities are productive. Only under the Marxian productive-unproductive classification do the results converge with the theory of unequal exchange.
Estimation methodology
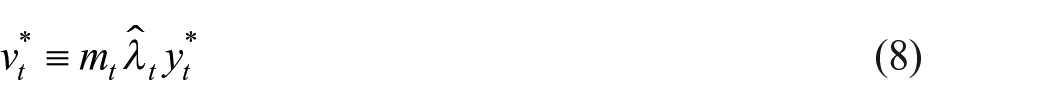
Let subscripts
Let
The Leontief input-output model used to construct the WIOT in each year

The vector of value-added realised at the country-industry level is defined as the vector of conventional monetary value-added

The

The next step is to compute the vector of labour inputs. WIOD data on labour hours are missing for workers in China and for self-employed workers in general, while employment data are complete. For this reason, the vertically integrated labour requirements are calculated not in terms of labour hours but in terms of employment levels. The employment vector must then be adjusted for self-employment and skills, where skill differentials are proxied by wage differentials relative to the global average wage in each year. The adjustment for skills approximates Marx (1982 [1887]: chapter 1, 135–137) contention that complex and simple labour must be reduced to the same units. This paper follows the model of vertically integrated labour coefficients with heterogeneous labour from Duménil et al. (2009) and thus converts complex and simple labour to units of labour of average complexity, using the global average wage as the reference wage for skill differentials.
Let
The global average wage is used as the reference wage in the computation of skill differentials in order to avoid the shortcomings of Işıkara and Mokre (2022), who did use wage differentials to proxy for skill levels but inadvertently used the national average wage as the reference wage. By using national average wages as the basis for wage differentials, Işıkara and Mokre (2022) eliminated all the between-country variability in skills and thus considered only the within-country variability in wages. Their procedure amounts to assuming that the average skill level is the same across countries. In the present study, on the contrary, skill levels are correctly adjusted for both the within- and between-country variability in relative wages.
The estimation of labour values must now consider the role of unproductive activity. In the Marxian approach, only productive activities create value and thus the vertical integration of labour requirements must include only the labour directly and indirectly required in productive activities. As argued by Basu and Moraitis (2023), unproductive activities do not enter the matrix of input-output coefficients used in the computation of labour values, which is a square matrix constructed row- and column-wise solely for productive activities. Because the SNA classifies all activities as productive, the matrices and vectors in the WIOD must be modified to reflect the productive-unproductive classification.
The first step is to rearrange the
The next step is to compute the vector of Marxian net output
For productive activities, the Marxian net output
This procedure implies that the unproductive inputs used up in productive activities
To prevent unproductive activities from transferring value to productive activities, the unproductive activities must be excluded from matrix
It is now possible to define prices proportional to labour values. Let
At the aggregate global level, the normalisation condition based on the net output is
The formula for
The next step is to estimate the Marxian value-added produced at the country-industry level. The column vector
Let the column vector
At the country-industry level, the surplus value realised is the value-added realised
The profit rate produced
Value capture and exploitation in the world economy
This section presents the stylised facts on value capture in the global economy, and the next section analyses its causes. Figure 1 summarises the main estimates for selected countries and industries over 2000–2014. Positive entries indicate value-added captured, while negative entries represent value-added transferred out. Figure 2 shows the production, realisation, and capture of global value-added in 2014 across countries. Figure 3 shows the data for 2014 across industries. All data are in constant dollars of 2015. China is the largest giver of value while the USA is the largest capturer of value. Across industries, unproductive activities (real estate, finance, and trade) and capital-intensive industries (manufacturing, mining, and oil) are value capturers. Labour-intensive industries (health, education, construction, agriculture, and services) transfer large amounts of value away. In the appendix, the heat map in Figure A3 shows value-added captured by country and industry simultaneously. Figure A4 shows value-added captured by industry within the USA and China, the world’s largest economies.
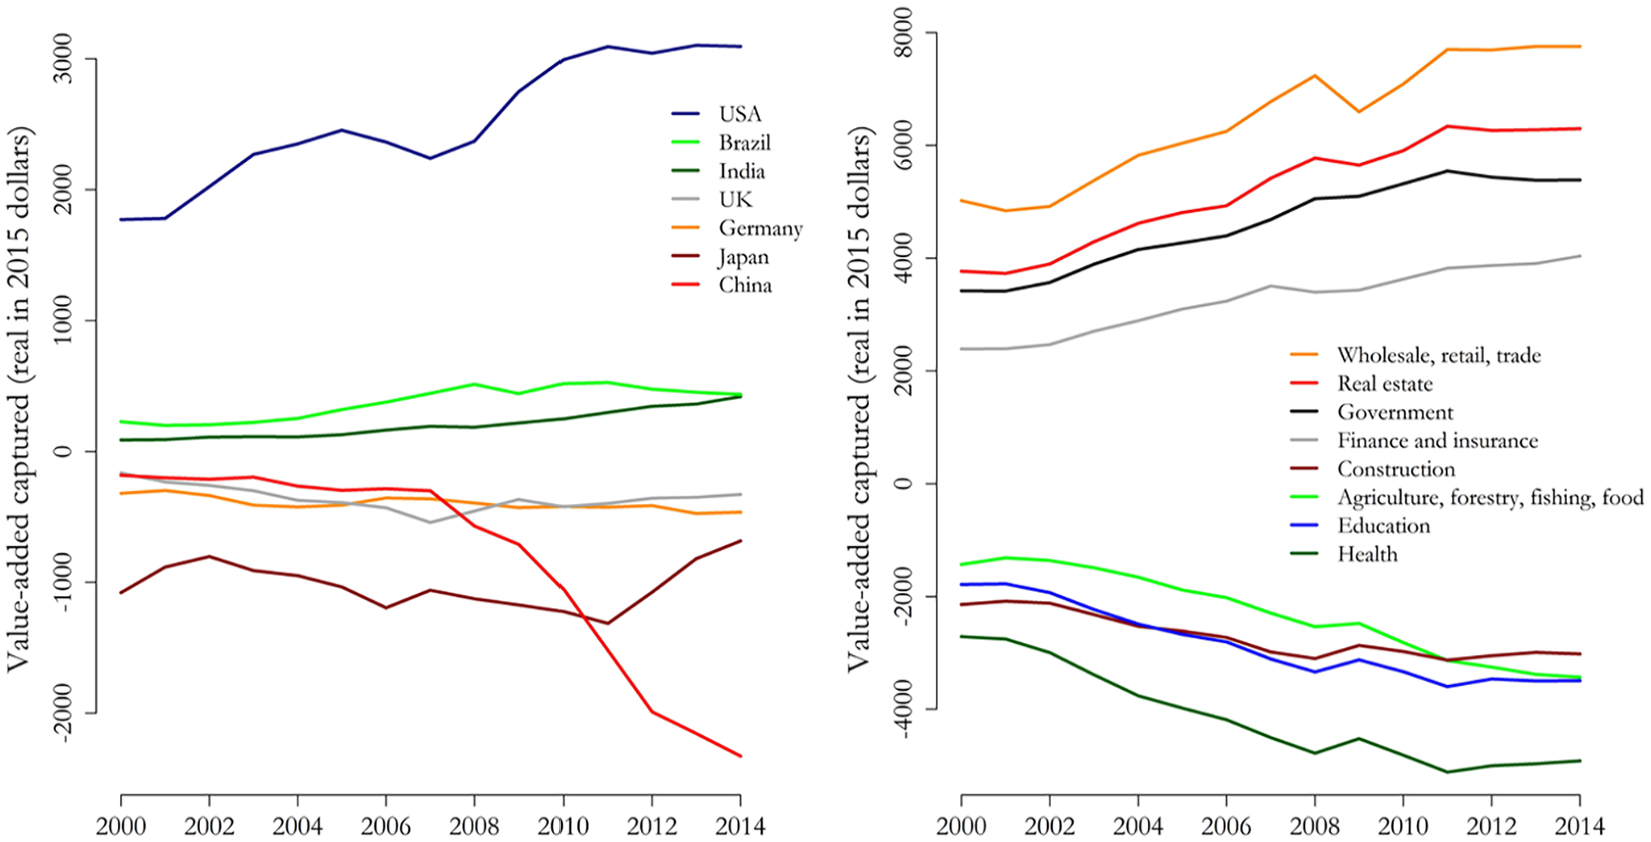
Global value-added captured in selected countries and industries, 2000–2014.
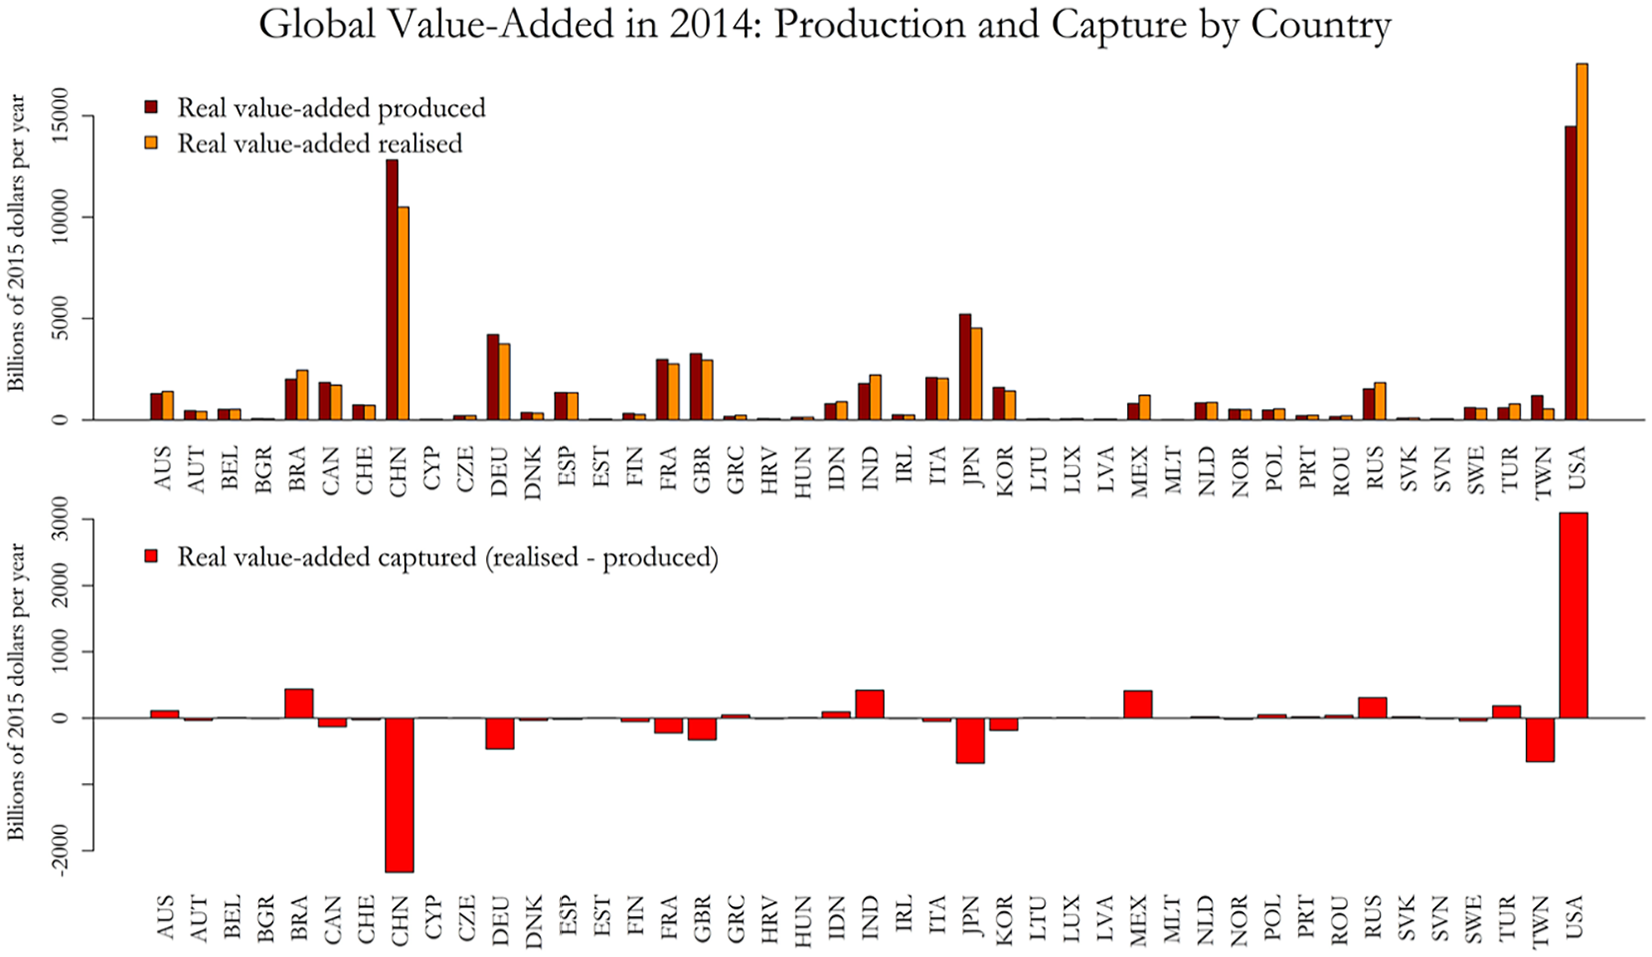
Production, realisation, and capture of global value-added by country, 2014.
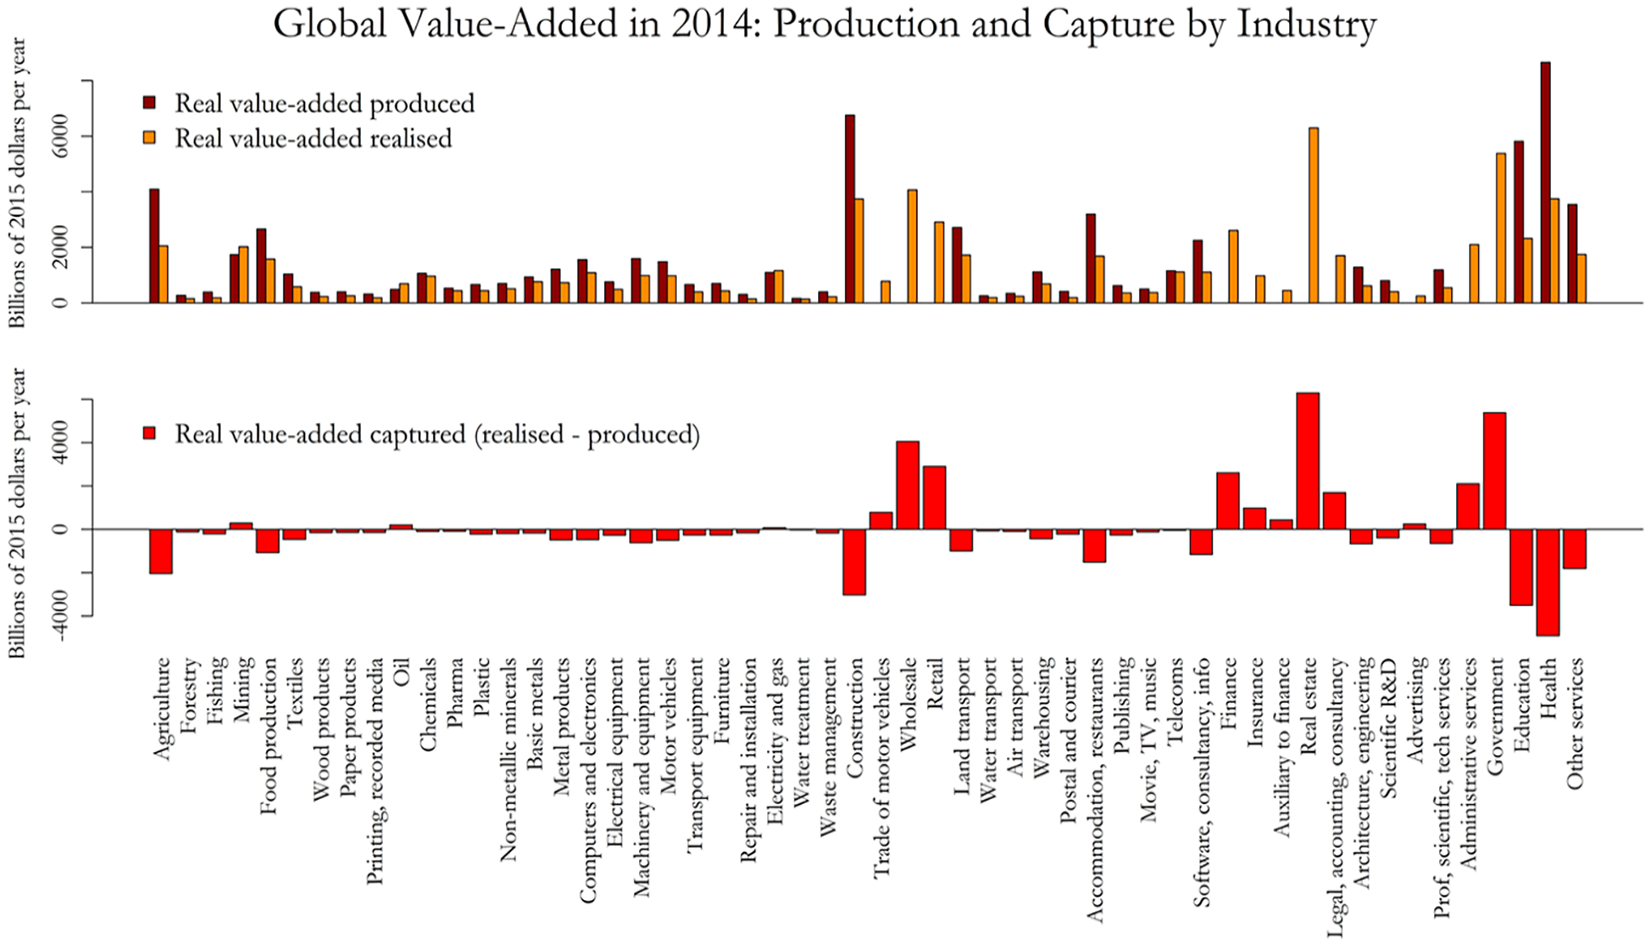
Production, realisation, and capture of global value-added by industry, 2014.
Figure 4 shows the produced and realised rates of exploitation and profit for selected countries over 2000–2014. The large gaps between produced and realised rates are caused by the substantial value transfers across industries and countries. Estimates based on values produced (as in the Marxian approach) lead to different conclusions than estimates based solely on values realised (as in the conventional SNA approach). Such differences are substantial in countries like China and the United States, or in labour-intensive industries (education, health, construction, and agriculture), where value transfers are the largest in the world. In China, for example, the produced rate of exploitation is much higher than the realised rate of exploitation, showing how much Chinese workers are exploited by capital in China and how much of their exploitation is syphoned to other countries through international value transfers. The exact opposite case holds for the United States. In the appendix, Figure A5 shows the produced and realised rates of exploitation and profit across countries in 2014. Figure A6 shows the data across industries in 2014. Figure A7 shows the wage shares of value-added produced and realised by country over 2000–2014, and compares them to the global wage share.
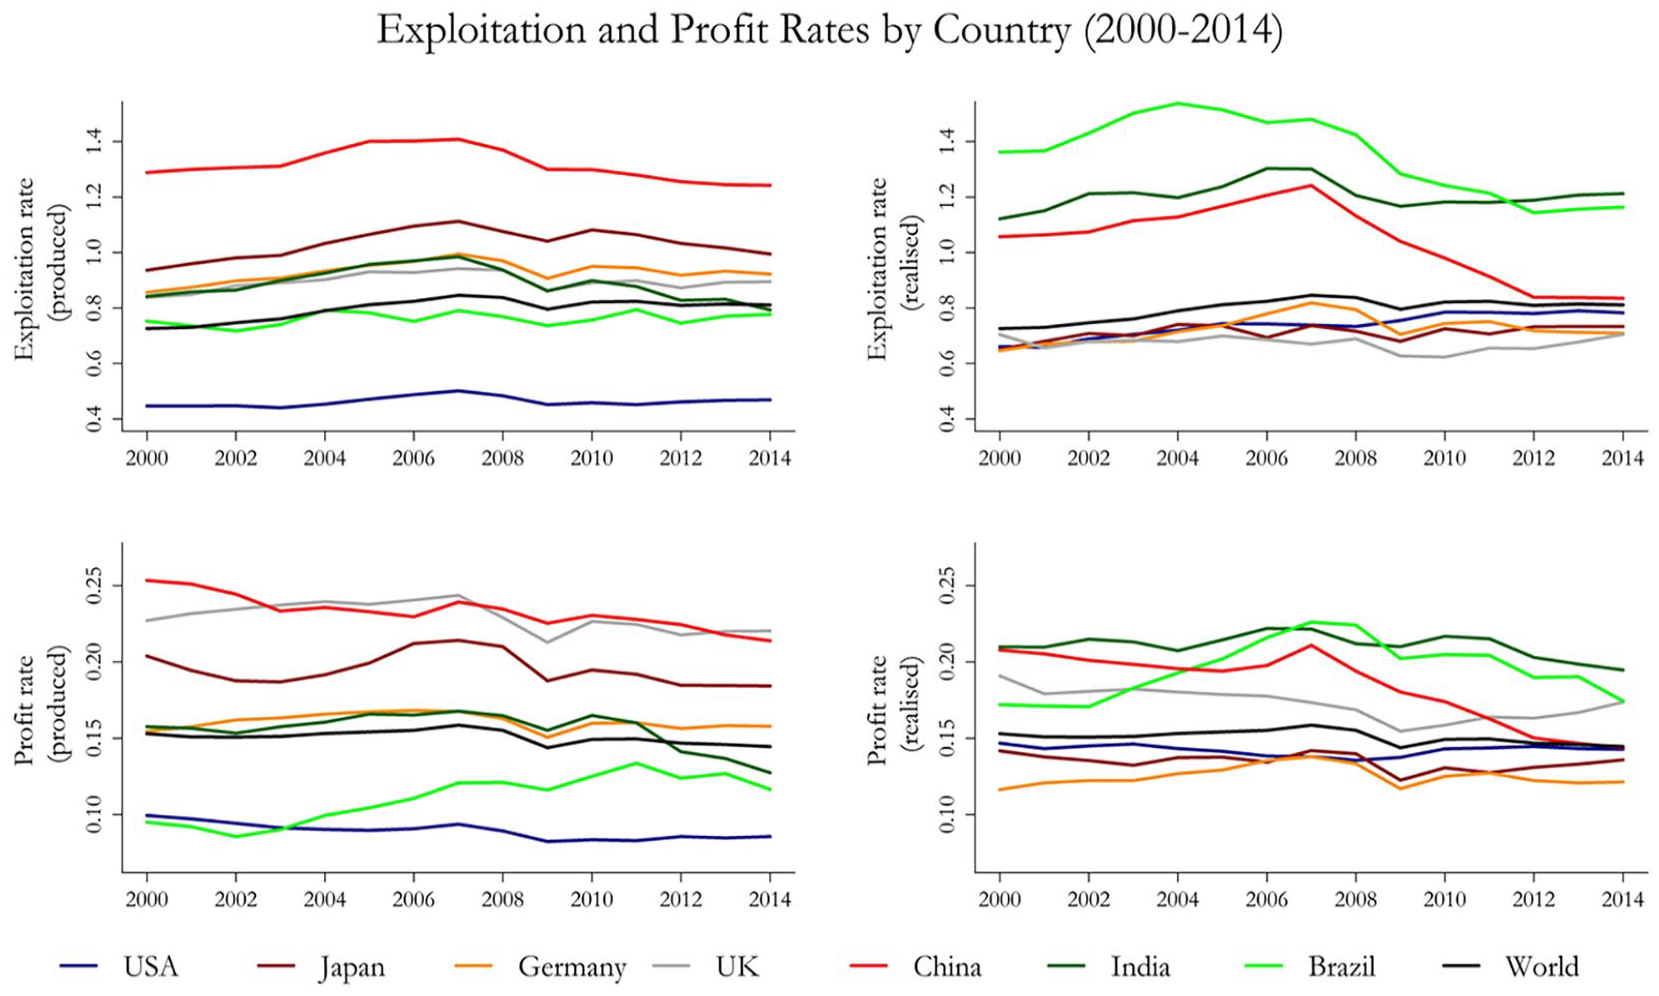
Average rates of exploitation and profit for selected countries, 2000–2014.
The equalisation of profit rates and exploitation rates has a long history in the development of the theory of labour values and prices of production, which are long-run prices corresponding to equalised profit rates (for a detailed analysis see Cogliano, 2023; Mohun and Veneziani, 2017). Cogliano (2018), for example, implemented the productive-unproductive categorisation and employed the assumption of equalised exploitation rates to estimate transfers of surplus value in the United States from industry-level data over 1990–2015. Under the assumption of equalised exploitation rates, surplus value can be estimated by multiplying labour compensation in productive industries by the average rate of exploitation. In this regard, Figure A8 in the appendix shows the empirical kernel densities of exploitation and profit rates from the full sample of 34,830 observations at the country-industry level. Kernel densities do indicate, nonetheless, substantial deviations from average values on the world scale and a more complex shape than the inverse Laplace distribution reported by Scharfenaker and Foley (2017) and Scharfenaker and Semieniuk (2017), or the Gamma distribution reported by Farjoun and Machover (1983). These latter studies measured exploitation and profit rates based solely on values realised and thus disregarded the kernel densities based on values produced.
As indicated in the introduction, the definition of exploitation as the unequal exchange of labour (Cogliano et al., 2022b, 2024) is broader than Marx’s original definition of exploitation, and it encompasses two dimensions: (i) the class dimension of exploitation, measured via the produced rate of exploitation, which refers to the extraction of unpaid labour from workers by capitalists at the firm level; (ii) the trade dimension of exploitation, which refers to transfers of embodied labour across countries and industries. Figure A9 in the appendix demonstrates that the class and trade dimensions of exploitation are in fact highly correlated, for industries with higher rates of produced exploitation are industries that transfer most of the value-added away. The figure presents rates of exploitation realised (blue) and produced (red) plotted against value-added produced and the capital-labour ratio. The data are shown at the country-industry level over 2000–2014, and the corresponding regression lines are plotted with similar colours. Results indicate that industries with higher rates of produced exploitation tend to be labour-intensive industries that transfer away large amounts of value-added. Industries with higher rates of realised exploitation, on the contrary, tend to be capital-intensive industries that capture large amounts of value-added. This is why the two regression lines in each subplot of Figure A9 move in opposite directions.
Unproductive activity and unequal exchange
Let us now examine the causes of value capture. Table 1 presents the correlations between value-added produced and realised at the country-industry level. The table compares these correlations based on the Marxian categorisation with those derived from the conventional SNA approach, which classifies all industries as productive. Figure A10 in the appendix shows the underlying data by activity type. The correlation between value-added produced and realised is 0.96 for productive activities but drops to 0.48 when unproductive activities are included. This indicates that while prices proportional to labour values do correlate with market prices—as also evidenced by the high correlations reported in Shaikh (2016) and Işıkara and Mokre (2022)—this strong correlation is confined to productive activities. The results demonstrate that unproductive activities play a significant role in value capture, as this capture occurs through various channels: national and local governments impose taxes, financial companies charge fees and interest, insurance companies collect premiums, real estate firms charge rent, and retail and wholesale traders capture a margin of the commodity’s selling price.
Correlation between value-added realised and produced by country-industry and activity type, 2000–2014.
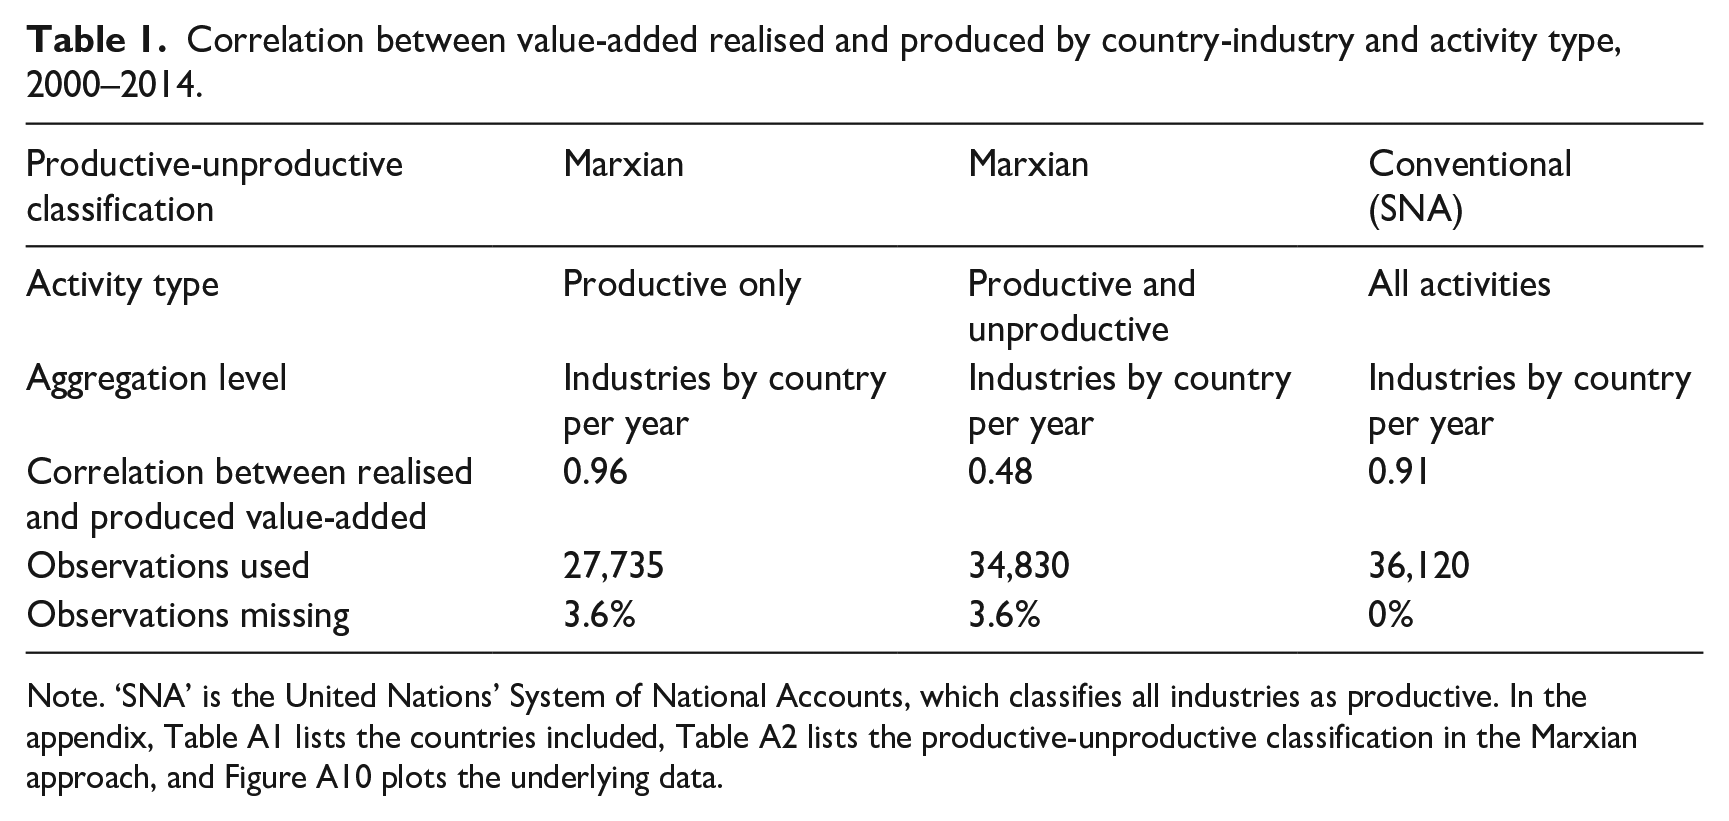
Note. ‘SNA’ is the United Nations’ System of National Accounts, which classifies all industries as productive. In the appendix, Table A1 lists the countries included, Table A2 lists the productive-unproductive classification in the Marxian approach, and Figure A10 plots the underlying data.
Table 2 uses panel econometrics to test Marx’s hypotheses on the determinants of value capture. As indicated in the introduction, Marx hypothesised that three factors explain why value realisation deviates from value production. First, a share of the value created in productive activities must pay for unproductive activities. This factor is controlled for by adding a dummy variable for unproductive activities at the country-industry level. Second, labour-intensive activities tend to transfer value to capital-intensive activities under profit rate equalisation. This factor is controlled for by adding the ratio of fixed capital to employment at the country-industry level. To control for potential nonlinearities, the econometric models also include the capital-employment ratio in quadratic and cubic forms. Third, the concentration and centralisation of capital can increase market power and allow larger firms to capture value from smaller firms. Hence, the econometric results should indicate a positive association between higher profit rates and greater value capture. This factor is controlled for by adding the realised profit rate as a regressor. To control for potential nonlinearities, the realised profit rate in quadratic form is included (pre-testing indicated that the cubic form was not significant). Lastly, the panel models include country dummies to control for country-specific fixed effects. Figure A11 in the appendix plots the panel dataset used to estimate the econometric models, showing value-added capture as a function of the capital-labour ratio, with activities colour-coded by type.
Determinants of value-added capture by country-industry, 2000–2014. Panel regression models with standardised variables.
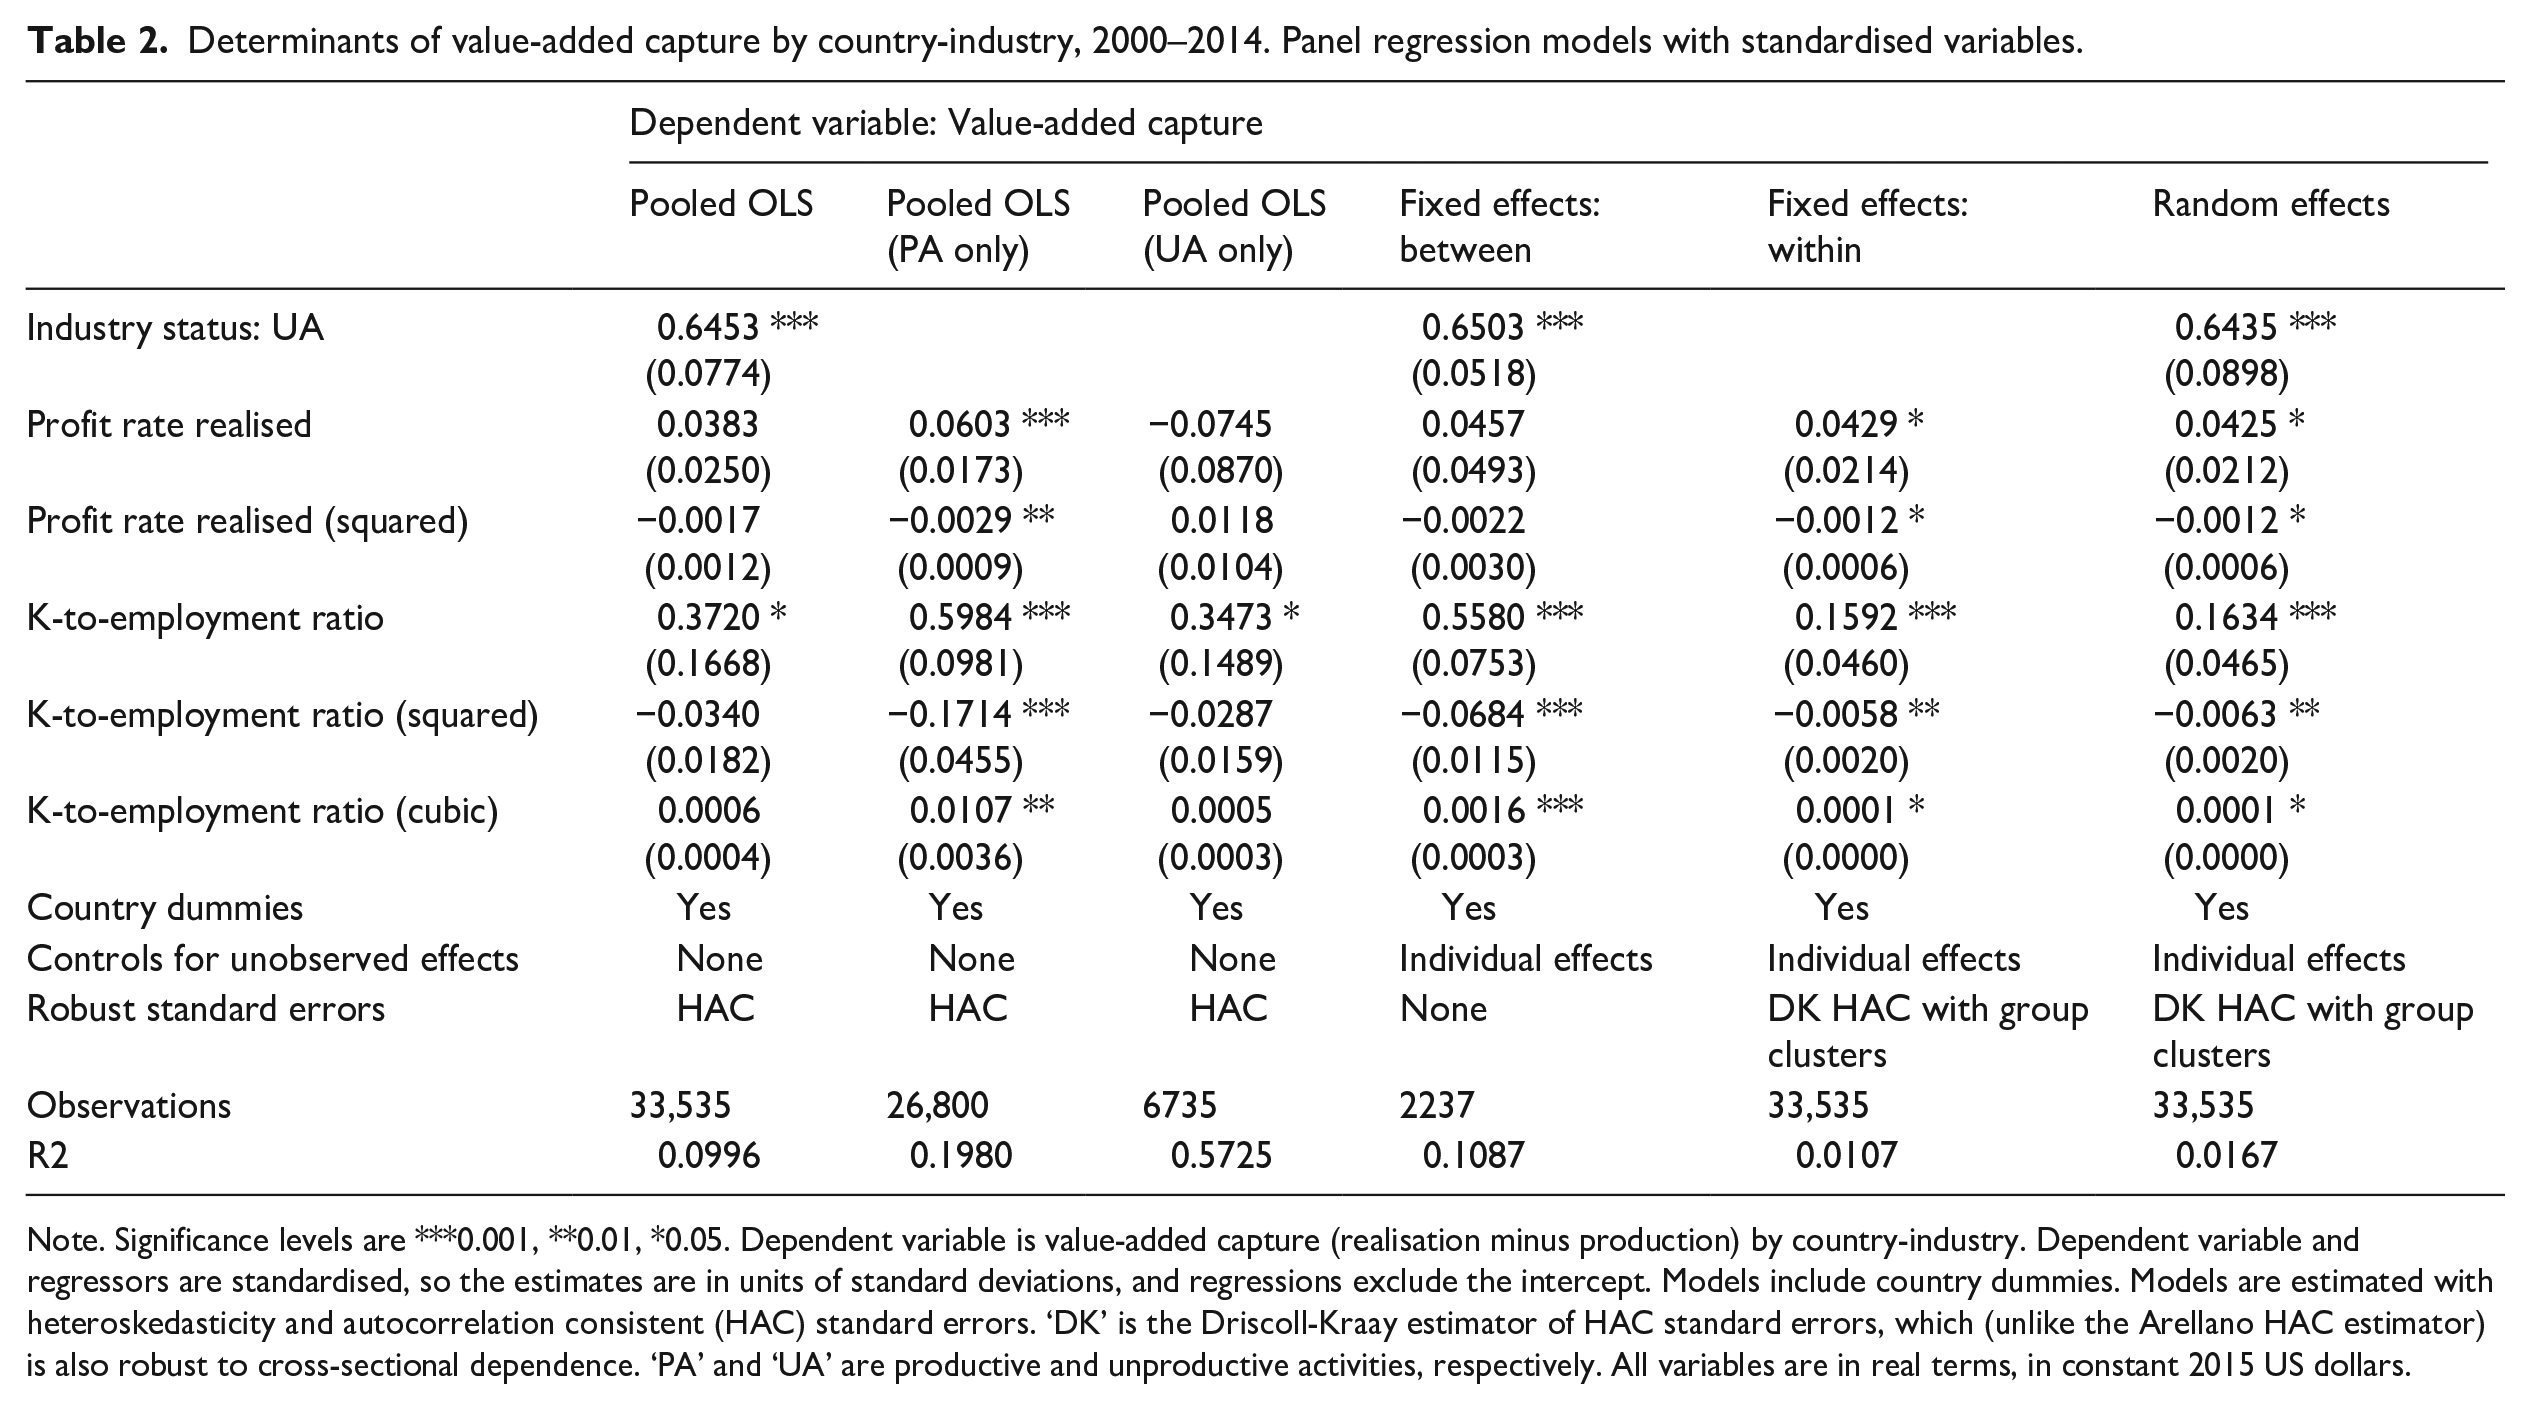
Note. Significance levels are ***0.001, **0.01, *0.05. Dependent variable is value-added capture (realisation minus production) by country-industry. Dependent variable and regressors are standardised, so the estimates are in units of standard deviations, and regressions exclude the intercept. Models include country dummies. Models are estimated with heteroskedasticity and autocorrelation consistent (HAC) standard errors. ‘DK’ is the Driscoll-Kraay estimator of HAC standard errors, which (unlike the Arellano HAC estimator) is also robust to cross-sectional dependence. ‘PA’ and ‘UA’ are productive and unproductive activities, respectively. All variables are in real terms, in constant 2015 US dollars.
The econometric models regress value capture (realisation minus production) on each factor mentioned in the previous paragraph. Variables are converted to real US dollars in constant values of 2015, and about 7% of the 36,120 observations are missing at the country-industry level. The table shows standardised coefficients (in units of standard deviations) obtained from different models: pooled, fixed effects (from both the ‘within’ and ‘between’ transformations), and random effects. The pooled model is estimated three times: using country-industry data for all activities; using data only for productive activities; and using data only for unproductive activities. The fixed effects and random effects models include controls for the unobserved individual effects. Models are estimated with robust standard errors computed from heteroskedasticity- and autocorrelation-consistent (HAC) variance-covariance matrices, adjusted for group clustering. But instead of using the conventional Arellano estimator of standard errors, the models employ the Driscoll-Kraay (DK) estimator to correct the variance-covariance matrix for both cross-sectional dependence and group clustering.
The econometric results lend support to Marx’s hypotheses on the mechanisms of value capture, albeit with some important caveats. The most important factor explaining value capture is the existence of unproductive activities. The coefficient of the unproductive activity dummy is positive, significant at the 0.1% level, and it has the largest effect across all parameter estimates. On average, unproductive activities capture 65% more value-added than productive activities. Comparing parameter estimates is straightforward since all variables are standardised in units of standard deviations. The second largest effect comes from the capital-labour ratio. According to the fixed effects model using the ‘between’ transformation, an increase of one standard deviation in the capital-employment ratio increases value-added capture by 0.56 standard deviation (considering only the linear effect). This effect is significant at the 0.1% level. In the same ‘between’ model, the effect from the realised profit rate is not statistically significant and the size of the estimate is only 0.05 standard deviation (considering only the linear effect). In the pooled model using data solely from productive activities, the effect from the realised profit rate becomes significant at the 0.1% level, but the size of the coefficient is 0.06 standard deviation (considering only the linear effect), placing it well behind other factors.
The preferred estimate is from the fixed effects model using the ‘between’ transformation, since this model focuses on the variation between country-industries. The
Figure 5 further demonstrates the importance of unproductive activities for unequal exchange. The theory of unequal exchange defines exploitation as the unequal exchange of labour and argues that rich countries exploit poor countries (Cogliano et al., 2022a, 2024; Dorninger et al., 2021; Hickel et al., 2022; Infante-Amate et al., 2022). To verify this assertion, Figure 5 plots the capture of value-added in 2014 by country (top panel) and by industry (lower panel) under both the Marxian productive-unproductive classification (red bars) and the conventional SNA assumption that all activities are productive (blue bars). In the appendix, Figure A12 shows the production, realisation, and capture of global value-added by country in 2014 under the SNA assumption that all industries are productive. Figure A13 shows global value-added captured in selected countries and industries over 2000–2014, also under the SNA assumption that all industries are productive.
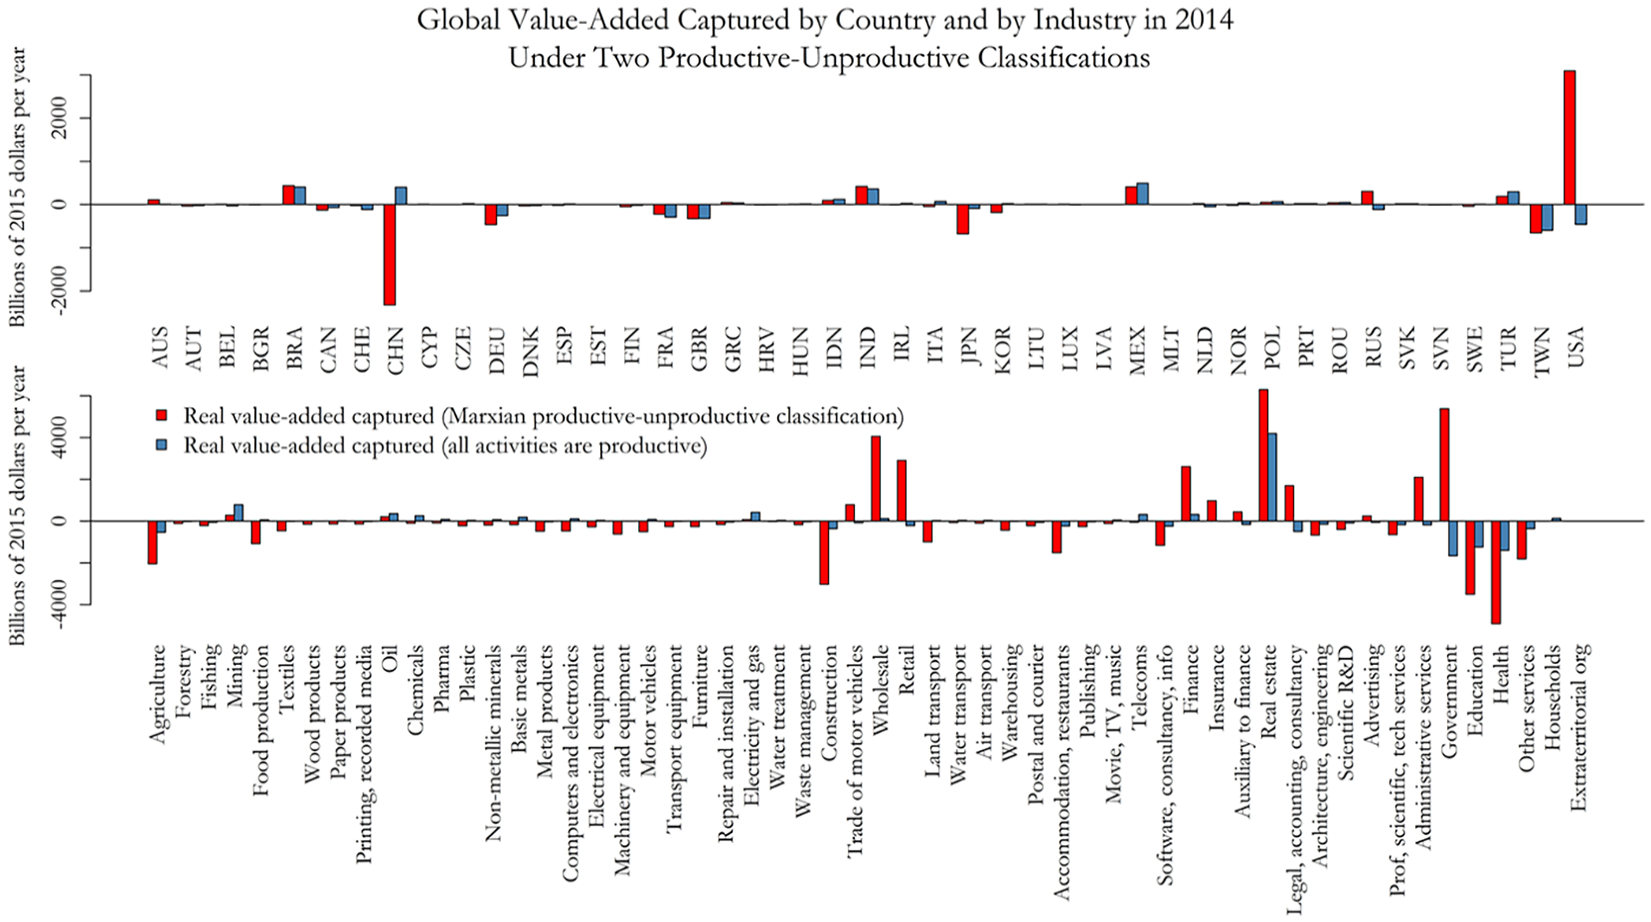
Capture of global value-added by country and by industry in 2014 under the Marxian productive-unproductive classification (red bars) and under the conventional assumption that all activities are productive (blue bars).
Under the Marxian classification, China is the largest giver of value while the USA is the largest capturer of value. Under the conventional SNA classification, on the contrary, the USA is the largest giver of value while China is the largest capturer of value. This inversion happens because the conventional approach ignores the massive relocation of productive activities from the USA, Europe, and Japan towards China. The conventional classification also ignores the rapid growth of unproductive activities (finance, trade, and real estate) within the USA and Europe. The United States has, by far, the largest share of the global pool of income from unproductive activities in the world (Rotta and Kumar, 2024). By not accounting for the large value transfers from productive to unproductive activities, the conventional classification built into the SNA and WIOD inverts the value transfers between countries. For this reason, the theory of unequal exchange, which claims that rich countries exploit poorer countries, is incompatible with the conventional SNA approach that classifies all activities as productive.
The results also reveal the hierarchy among developed countries themselves, since value transfers are not restricted to the flows from poor to rich economies. Most rich economies (like Japan, Germany, UK, and France) transfer value to American companies via unproductive activities such as finance, insurance, retail and wholesale trade, and real estate. These value transfers, which also reflect the dollar hegemony as the world money, allow the United States to maintain the greatest share of the global income from unproductive activity. When unproductive activities are properly accounted for, developed economies can emerge as value givers to the United States. This result provides further evidence to the idea that exploiting countries tend to be net lenders in international credit markets—as argued in Cogliano et al. (2024) and 2022a). By becoming net lenders, wealthy countries like the USA can capture value through fees and interest payments from net borrowers, who rely on international credit markets to finance domestic expenditures. It is therefore through unproductive activity that the unequal exchange of labour occurs between lenders and borrowers in international credit markets.
Concomitantly, the rapid growth of productive capital in China increased the value-added captured by developing countries. Brazil, Mexico, Indonesia, and India exported to China large quantities of agricultural products (soybean, meat, and seafood) and mining products (iron ore, copper, steel, and oil) at rising prices, which placed these developing countries as value capturers over 2000–2014. Large exports of primary products to China, at rising prices, explain how a developing country like Brazil became a value capturer, accumulating 378 billion dollars in international reserves by 2019. For a historical perspective on this mechanism, Figure A14 in the appendix plots the evolution of the shares of several key industries in the value-added and gross output realised in the global economy over 1965–2018. The figure combines historical data from the WIOD (1965–1995) for 22 major economies and OECD data (1995–2018) for 66 major economies. The measures show a very large increase in the share of primary products (agriculture and mining) in the 2002–2014 period, right after China joined the World Trade Organisation (WTO) in 2001. The huge boost in the value-added realised by primary products derives from the fast growth of the Chinese economy and from its high demand for the agricultural goods and raw materials produced in developing countries like Brazil, Mexico, Indonesia, and India.
Furthermore, the adjustment for complex and simple labour also plays a significant role in the empirical results. This is evident when comparing the estimates from the current study with previous studies in the unequal exchange literature that treated labour as homogeneous. In a widely cited study on unequal exchange, Dorninger et al. (2021) find that high income countries exploit poorer countries because developed economies consume more embodied labour and natural resources than what they contribute to the world economy. Dorninger et al.’s (2021) finding is based on the consumption footprint of rich economies and it does not rely on the Marxian classification of activities, which seems to challenge the results in the present paper. But as Figure A15 in the appendix demonstrates, their methodology has limitations. The finding that high income countries exploit poorer countries relies on a comparison between the labour, land, energy, and raw materials directly and indirectly consumed via final demand, relative to the resources contributed to the world economy. However, empirical studies on unequal exchange like Dorninger et al. (2021), and even Hickel et al. (2022), assume labour to be homogenous across industries and countries, for they do not adjust the labour vector for skill differentials. As shown in Figure A15, the assumption of homogenous labour overestimates the contribution from poorer countries and underestimates the contribution from richer countries.
Additionally, the unequal exchange literature has not yet fully accounted for the rapid rise of unproductive activity in developed countries or the massive relocation of productive capital to China. Instead of comparing value realisation with value production, the recent empirical studies on unequal exchange (Dorninger et al., 2021; Hickel et al., 2022; Infante-Amate et al., 2022) compare the consumption footprint with the contribution of countries in terms of social and natural resources. In doing so, however, these studies have not yet properly considered the uneven growth of productive and unproductive activities across countries. The literature on unequal exchange has, for example, overlooked the value transfers from developed countries to the unproductive activities of the United States, which can potentially position developed countries as value givers within global value chains. Likewise, these empirical studies have underestimated the surge in demand for agricultural and mining products from developing countries driven by China’s rapid rise, positioning these developing economies as value capturers within global value chains.
Conclusion
This paper has extended Marxian value theory to a global scale and introduced a methodology for estimating the production, realisation, and capture of value-added within global value chains. Results indicate that value tends to flow from labour-intensive industries (health, education, construction, agriculture, and services) to capital-intensive industries (manufacturing, mining, and oil) and to unproductive activities (real estate, finance, trade, and government administration).
These results highlight the importance of the rise in capital intensity associated with industrialisation and economic development. The findings can also explain the growing adoption of artificial intelligence in the service sectors, which amounts to a substantial increase in capital intensity and is thus a potential mechanism for capitalists to capture more value in labour-intensive services. Moreover, the capture of value-added by real estate, finance, trade, and government administration highlights the economic cost of unproductive activities. In this context, the panel dataset constructed for this paper can be used to test which subtypes of unproductive activities may hinder or boost productive investment and economic growth.
The paper has additionally shown that unequal exchange theory is incompatible with the conventional assumption that all activities are productive. Only under the Marxian productive-unproductive classification do the results converge with unequal exchange theory. This finding is driven by the massive relocation of productive capital to China, while unproductive capital expanded rapidly in the United States and Europe between 2000 and 2014. These results demonstrate the strength and actuality of Marxian value theory and the assumption that not all activities produce economic value.
Supplemental Material
sj-pdf-1-epn-10.1177_0308518X241299315 – Supplemental material for Value capture and value production in the world economy: A Marxian analysis of global value chains, 2000–2014
Supplemental material, sj-pdf-1-epn-10.1177_0308518X241299315 for Value capture and value production in the world economy: A Marxian analysis of global value chains, 2000–2014 by Tomás N. Rotta in Environment and Planning A: Economy and Space
Supplemental Material
sj-xlsx-2-epn-10.1177_0308518X241299315 – Supplemental material for Value capture and value production in the world economy: A Marxian analysis of global value chains, 2000–2014
Supplemental material, sj-xlsx-2-epn-10.1177_0308518X241299315 for Value capture and value production in the world economy: A Marxian analysis of global value chains, 2000–2014 by Tomás N. Rotta in Environment and Planning A: Economy and Space
Supplemental Material
sj-xlsx-3-epn-10.1177_0308518X241299315 – Supplemental material for Value capture and value production in the world economy: A Marxian analysis of global value chains, 2000–2014
Supplemental material, sj-xlsx-3-epn-10.1177_0308518X241299315 for Value capture and value production in the world economy: A Marxian analysis of global value chains, 2000–2014 by Tomás N. Rotta in Environment and Planning A: Economy and Space
Footnotes
Acknowledgements
The author thanks three anonymous referees for the constructive feedback.
Declaration of conflicting interests
The author declared no potential conflicts of interest with respect to the research, authorship, and/or publication of this article.
Funding
The author received no financial support for the research, authorship, and/or publication of this article.
Supplemental material
Supplemental material for this article is available online.
References
Supplementary Material
Please find the following supplemental material available below.
For Open Access articles published under a Creative Commons License, all supplemental material carries the same license as the article it is associated with.
For non-Open Access articles published, all supplemental material carries a non-exclusive license, and permission requests for re-use of supplemental material or any part of supplemental material shall be sent directly to the copyright owner as specified in the copyright notice associated with the article.