
Abstract
Since 2013, Permitted Development Rights (PDR) in England have allowed commercial-to-residential conversions in locations once deemed suitable only for non-residential land-use. This deregulation of planning control has been justified as a way of encouraging more home-building in areas experiencing ‘housing crisis’, but its overall consequences remain unclear. This paper hence compiles quantitative evidence on a city-wide scale on the price, size, build and location of these conversions in London 2013–2021. It finds that homes produced through this route are generally smaller than the London average and are over-concentrated in neighbourhoods with fewer accessible green spaces and higher-than-average levels of air pollution. Here, larger conversion schemes (of more than 10 units) appear particularly problematic, potentially subjecting residents to forms of ‘slow violence’ that could have long-term consequences for their physical and mental health. The paper also finds that, on average, PDR conversions are marginally more affordable than other new developments in the capital, but are also more expensive per square metre, suggesting deregulation is allowing developers to ‘extract’ maximum value from these schemes rather than providing affordable homes per se. The implications of this are discussed in relation to the politics of housing in London and the wider forms of planning deregulation allowing developers to accrue increased profits from housing in an era of intense financialisation.
Introduction
Recent writing on financialisation suggests the concentration of wealth in residential property markets is pushing house prices ever-upward, exacerbating the housing crisis in many global cities (Christophers, 2021). But the depth of this crisis is clearly spatially-variable, and the role of the state – local or otherwise – remains crucial: where it has largely withdrawn from the provision of housing, and encouraged private development, price rises appear especially pronounced (Ward, 2022). In many English cities, for example, the transfer of state housing assets to real-estate developers and the simultaneous removal of planning controls has allowed developers to produce more housing at greater speed, in the forlorn hope this will produce cheaper housing (Crosby and Henneberry, 2016; Livingstone et al., 2021). Here, the ‘speeding up’ of planning, and its orientation towards boosting the overall numbers of housing units, has been a particularly important move, allowing developers to reduce the time between land acquisition and housing completion, cutting their costs (Brill and Durrant, 2021). In a context of rising house prices, ‘land-value capture’ or ‘planning gain’ is hence the dominant logic though which city authorities extract benefits from developers, making social welfare contingent on developers’ profits (Hyde, 2023; Penny, 2022). This reliance on land-value capture has in turn weakened planners’ ability to influence future development, raising concerns about democratic planning processes intended to secure the best use of land.
Such shifts are consistent with a neoliberal political agenda that, over the last thirty years, has sought to ‘set markets free’ by removing ‘unnecessary’ planning constraints (Holman et al., 2018). In England, the expansion of Permitted Development Rights (PDRs) – which allow commercial and business premises to be converted to residential properties without full planning permission – constitutes one of the clearest, and controversial, examples of deregulation (Derbyshire and Havers, 2015). Justified with reference to the national housing shortage, PDR has been promoted by the government as a way of bringing under-used or abandoned buildings back into use without undue delays (see Muldoon-Smith and Greenhalgh, 2016). Crucial here has been the idea that offices and retail sites stand vacant in cities where demand for housing is high: increasing both the range of sites available for development and reducing the administrative costs associated with change-of-use has been deemed a way to produce new, and ideally affordable, homes (cf. Stabrowski, 2015, on inclusive zoning in the US).
In its own terms, PDR has succeeded: across England and Wales, 13.4% of net additions (29,720 of 222,190 units) were under the auspices of PDR in 2017–2018 alone (Wiles, 2020). PDR has then sped-up the production of new homes at a time of perceived national shortage. But by accelerating the flow of private wealth into housing, PDR reform has also undermined the plan-led system determining what land use is most appropriate where. As Raco et al. (2018) and others note, the slowness inherent to the planning process provides time for reflection, limiting the opportunities for investors to create investment bubbles that can bring ruin not only to themselves but to wider urban planning priorities designed to maximise residential amenity:
Authorities have. . .lost the ability to proactively plan for their communities, protect employment space where really needed (including for those who actually do need cheaper, secondary offices) and properly consider residential amenity and externalities. The widely shared aspiration for a more plan-led, visionary planning system is undermined and the ability for local planning authorities to spatially shape their environment is weakened. Furthermore, the scope for communities to be engaged in change affecting them is removed (Royal Institute of Chartered Surveyors [RICS], 2018: 93).
The inference here is that encouraging the development of housing through PDR may well lubricate the supply of new housing but promotes unsustainable patterns of land use and results in homes unfit for purpose (Gallent et al., 2017).
Despite some reflection on the impacts of PDR based on qualitative case studies of ‘inappropriate’ housing developments (e.g. Ferm et al., 2021; Madeddu and Clifford, 2023), to date there has been no extensive quantitative analysis of the outcomes of PDR in terms of its affordability, amenity and adequacy. In this paper we hence compile data to explore whether the homes provided via PDR constitute ‘decent’ homes in the right places. Because they are ostensibly in locations deemed less suitable for housing in the first place, do PDR conversions offer demonstrably lower residential amenity than non-conversions? Because they typically involve subdivision of office and retail spaces, are they generally smaller than other dwellings? And are they cheaper than homes approved through the formal development control process? Such questions are not just empirical puzzlements, but drive at the heart of questions about rent and the extraction of ‘value’ from land.
To answer such questions, we focus on London, a city whose very viability has been questioned because of the unaffordability of its housing (Potts, 2020). Whilst PDR schemes are found across the country, Ferm et al. (2021) documented 249 schemes in Camden and 263 in Croydon, 2013–2017, compared with 139 in the entire city of Leeds in the same period, suggesting a strongly London-centred distribution. Ferm et al. (2021: 2049) also suggest London’s office-to-residential conversions are ‘skewed towards smaller (studios and one- bedroom) units’ that are ‘less likely to meet national space standards or have amenity space’, lack natural ventilation and have ‘poor quality or unsafe internal finishing’. Media coverage has likewise highlighted examples of poor-quality PDR conversions in the capital: one retrofitted scheme in a former office-block in Ilford, next to the A12 highway, made headlines for offering single-aspect studio-flats of just 13 m2 (Jones, 2018). Here, it is not just that the flats were well below the Nationally Described Space Standards (NDSS) – which stipulate single-bedroom flats with a shower should be at least 37 m2 – but that these also subjected residents to unacceptable levels of noise and air pollution.
This paper examines 2323 residential conversion schemes delivering over 18,000 units in total, using data from the London Planning Database on developments approved through the streamlined ‘Prior Approvals’ route, 2013–2021. These schemes are considered in terms of the scale of development (number of units), unit sizes (floor space), insulation (double glazing) and energy efficiency, with this data taken from matched Energy Performance Certificates. These schemes are then considered with reference to data on access to green open space and air pollution. Air quality is an important consideration here since it impacts on mental and physical health, albeit this is shaped by occupant behaviours, time spent indoors and underlying health conditions (Ferguson et al., 2021). Finally, the paper focuses on questions of affordability and price: one of the key arguments in favour of PDR is that it allows developers to produce homes in locations deemed less suitable for housing, so we would expect this to be both cheaper and more affordable than other residential properties in the same London borough. Here, data-matching with the Treasury’s Price Paid Data allows us to draw tentative conclusions about the way that developers save money through the development of PDR sites and the way these savings are – or more often, are not – passed on to occupiers.
Financialisation, planning deregulation and Permitted Development in London
That the crisis of housing in London is both acute and deep-rooted is widely taken-for-granted, to the extent it is sometimes seen inevitable. Recent decades have seen unprecedented regional house price disparities open-up in Britain, with London pulling further and further ahead: by 2016 average London house prices were more than double the national average. While historically this gap was ‘explicable in terms of London’s industrial, occupational and income structure’, Hamnett and Reades (2019: 389) argue the inflation of London’s housing has recently been fuelled by overseas investment (see also Fernandez et al., 2016). Here, the inflationary pressure associated with REITs (Real Estate Investment Trusts), which operate as investment funds, has resulted in even relatively-affluent Londoners being displaced from ‘prime’ neighbourhoods like Kensington & Chelsea, fuelling further waves of cascading displacement. Consequently, more and more of London is now less affordable to the average wage-earner, with median house prices at least 10-times the average annual income in even the cheapest boroughs (i.e. Bexley, Croydon, Barking; ONS, 2023). Even the much-vaunted COVID-19 fuelled ‘exodus’ of middle-class families from London to the English countryside failed to significantly reduce house prices (Cheshire et al., 2021).
This crisis of unaffordability has been compounded by the lack of new, subsidised, social housing in the capital, with private-led demolition schemes on existing council estates increasing overall housing stock through densification but reducing the number of council flats in favour of market-rate homes (Lees and Hubbard, 2022). The ‘unlocking’ of what Mayor Sadiq Khan called the ‘vast development potential’ of London’s housing estates witnessed over 55,000 council house demolitions, 1997–2020, and the net addition of at least 20,000 new homes, but such measures were dwarfed by housing targets anticipating a need for a million additional homes by 2036 (as identified in the GLA’s 2013 Strategic Housing Assessment). As such, allied to such regeneration and densification strategies have been forms of planning deregulation designed to increase the production of housing, most notably the 2013 PDR reforms. This expansion of Permitted Development was primarily rationalised by government as a way of ‘opening-up’ under-utilised office space – for which there appeared falling demand in some locales – to allow for the creation of ‘affordable homes’. Brandon (2015) argued PDRs ‘. . .tap into the potential of underused buildings to offer new homes for first-time buyers and families’. Added to this is the idea that simplified procedures for change-of-use can speed up the production of new homes (DCLG, 2012) with reduced planning constraint increasing the predictability of approvals for developers, theoretically lowering the cost of new housing for struggling households.
The first notable extensions to PDRs occurred in 2008 and 2010, increasing the range of changes that could be made to residential, industrial and commercial buildings without full planning permission (Clifford et al., 2020). However, in 2013, more radical change-of-use PDRs were introduced, initially as a three-year trial to boost housing delivery. These allowed developers to convert office buildings (use class B1a) into residential (C3), subject to a limited set of Prior Approval issues covering noise, pollution and flooding (RICS, 2018). Since April 2021, minimum space standards have been added to this list of requirements, but before this there was no requirement for developers to meet the Nationally Described Space Standard. Other policy stipulations such as amenity provision and access to green space, normally enforced through the planning application process, are no longer part of the decision-making process, nor is there any obligation for developers to make affordable housing contributions when converting commercial properties under PDR. In relation to the latter, Bibby et al. (2018) estimate the direct financial impact of PDR was a net loss of between £50 and 86 m in England and Wales, 2010–2017, with London’s potential loss accounting for more than half of this. A critical London Councils (2015) briefing also noted that PDR makes no distinction between occupied and vacant offices, suggesting this was resulting in an overall shortage of office space in the capital, pushing rents up in that sector given the ‘substantial differential’ between existing office rentals and the potential value of residential properties. The fact that since 2020 Permitted Development Rights have allowed developers to add up to two additional storeys to properties further suggests this is an example of the state giving away ‘value’ to developers (see Robinson and Attuyer, 2021 on ‘value-extraction’ in London).
Despite the mixed reception given to PDRs, the General Permitted Development Order (England) 2015 made office-to-residential PDRs permanent while, in August 2021, a new Use Class E was introduced, comprising buildings categorised as commercial (previously A1, A2, A3), office (previously B1a, B1b), light industrial (previously B1c), service (previously D1) and amenity (previously D2) use. This has massively expanded the number of buildings that can be converted to residential through Prior Approval, and with the inclusion of retail-to-residential conversions, Clifford and Madeddu (2022) argue local high streets now risk losing important amenities to residential uses. This raises the spectre of increasing amounts of ‘prime’ retail estate being converted into market-rate housing, something which threatens to undermine ongoing attempts to create ‘balanced’ city centres (Ntounis et al., 2023). Consequently, scrutiny of whether the housing produced through PDR is generally ‘inferior’ to that granted formal planning consent is urgently needed to determine if PDR is ultimately privileging private wealth over public benefit.
Assessing the affordability, amenity and adequacy of PDR
To date, study of conversions has focused mainly on local authorities thought to be hotspots of PDR development using survey methods, field visits or floorplan analysis. For example, Clifford et al. (2020), identified five Local Authorities with high rates of PDR, 2013–2017, assessing the quality of office-to-residential schemes. Two were in London: in Camden, 72% of PDRs met Nationally Described Space Standards compared to only 31% for Croydon, but in both interviews with local councillors revealed concern that PDR housing was neither suitable or affordable for local residents. Clifford (2019) subsequent report on thirty PDR conversions found only four met NDSS, but also found that, location-wise, many were in convenient locations near to public transport hubs, shops and services. Conversely, and importantly for our claims, only 50% of the schemes were within 250 m of public open space, some in problematic locations (e.g. beside a waste transfer station or in front of an urban expressway; see also Ferm et al., 2021).
Few studies have investigated residents’ experiences of living in such conversions, though a Newcastle-based survey of one scheme found few PDR residents knew their neighbours (George, 2019), and the Town & Country Planning Association, as part of its campaign for Healthy Homes, commissioned a damning photography project under the title These are Homes (Clayton, 2023). A systematic review by Marsh et al. (2020) on the impact of PDR on occupants’ well-being identified only eight relevant academic studies (four mixed methods, three qualitative, one quantitative). Their review nonetheless identified a tentative link between PDR conversions and health issues, suggesting common PDR traits – small home sizes, lack of amenity space and inappropriate location – may trigger respiratory diseases and mental health problems:
Evidence links the building and neighbourhood features prominent in housing created through PDRs. . .to a range of negative health impacts, including risk of cardiorespiratory diseases, type-2 diabetes, obesity, excess winter deaths, musculoskeletal conditions, cancer, mental health problems, low well-being and premature death (Marsh et al., 2020: 7).
They also note that insufficient attention has been paid to questions of toxicity and climate change adaptation, both of which might be particularly important in the context of smaller PDRs offering little respite from over-crowded living conditions (see also Kearns, 2022).
As Clifford et al. (2019: 1) acknowledge, the dominance of case-study, interview-based approaches does ‘not provide a comprehensive or systematic review of all the schemes typical in any particular area’, suggesting a need for more extensive overviews of the size, location and quality of residential conversions. The latter is clearly a highly subjective matter, but COVID-19 showed that inferior housing can impact dramatically on mental and physical health, with people living in smaller homes during lockdown reporting difficulty in combining working and leisure in cramped surroundings (Hubbard et al., 2021; Jacoby and Alonso, 2022). This has renewed discussion of what constitutes an ‘adequate’ home, with the Government’s (2006) definition of ‘decent’ housing stipulating only that it should be of adequate size and layout; reasonably modern in terms of facilities and services; and able to provide a ‘minimum’ but unspecified degree of comfort. These are not easily translated into metrics, so in this study we focused on three broad dimensions of housing quality which we sought to measure through quantitative indicators:
1.
2.
3.
In this sense, we are not focusing on the way PDR homes are inhabited, noting existing sources like the Census allow us to say very little about who occupies conversions or the impact this has on their well-being. But by incorporating measures of pollution and environmental quality alongside indicators of housing size and affordability, we aim to shift the debate on PDRs from a focus on metrics such as the provision of additional housing units to the more ‘pervasive but elusive’ (Nixon, 2011: 3) forms of ‘slow violence’ to which those living in substandard accommodation are subjected. To date, few studies of English housing have considered the link between housing, health and toxicity - though see Davies (2022) – despite Nixon (2011) showing slow violence is built into the ‘bedrock’ of social inequality: given the highly-variable levels of atmospheric pollution in London, it is vital to factor this into any discussion of iniquitous housing quality in the capital (Ferguson et al., 2021).
Methods: Examining Permitted Development across London
Data on the number and location of residential property conversions was taken from the Planning Permissions on the London Development Database (LDD; GLA, 2017–2021), which detailed 94,947 planning applications 2013–2021, describing application type, status and/or decision, Northing and Easting coordinates, as well as details about the scheme – including decision date, existing Use Classes impacted, the number of residential units proposed and completion date, if any. Roughly 4400 of these applications were for ‘Prior Approval’ PDR conversions, but there were only 2323 completions at 2,152 distinct addresses. This gap between applications and completions is connected both to the frequency of speculative applications – a Prior Approval application can cost as little as £80 – and the fact large projects can appear multiple times due to different approvals being sought at different times for the same development. Of the reported completions, the vast majority – around 1,800 – were office conversions (Class O/J), followed by roughly 600 involving commercial and business services, including launderettes, betting and pay-day loan shops (Classes M/IA and G/F). Even in London it is possible to find conversions of storage facilities and, at the urban fringe, a tiny number of agricultural premises. The largest schemes, typically backed by national property developers such as Pocket Living, involved the creation of up to 400 residential units, while, at the other end of the scale, a single unit may replace a corner-shop owned by a landlord with a small portfolio of properties.
To explore questions of toxicity, the covariate effects of NO2 pollution on the number of PDR developments was investigated using a test of complete spatial randomness (Kim et al., 2021). Here, NO2 pollution was used as an indicator of vehicular and industrial pollution (Fecht et al., 2016), with air quality data obtained from the 2019 London Atmospheric Emissions Inventory (LAEI) Concentrations Data (Greater London Authority, 2019). A raster map of NO2 pollution levels across London was tiled into twenty segments of similar pollution levels based on percentile, with tile one being the least and tile twenty the most polluted area. The raster data was finely segmented to ensure areas around busy and polluted main roads did not get averaged out with their surrounding areas. Thereafter, the number of PDR developments falling into each segment was tabulated, before a Monte Carlo test (using quadrat counts) was performed to identify any significant spatial trends (this method was used as the data does not meet the conditions for a chi-squared test).
We also explored proximity to green, open space, recognising the recreational significance of such spaces for those living in flats, especially under conditions of lockdown. Here, Greenspace Information for Greater London (2013) on the amount/proportion of each ward that is accessible open space was correlated with the number of PDR conversions in wards to test if PDRs are more prevalent in those where open space is lacking. While ward-based analysis has limitations, and obvious boundary issues, this is the only readily-accessible data that allows for a London-wide overview of the amount and accessibility of accessible open space (i.e. excluding agricultural land and rights of way).
To gauge access to transport facilities a multiple ring buffer originating from all Transport for London and National Rail stations was plotted at 100 m intervals between 500 and 1000 m to investigate the distance PDR developments are located from public transport facilities (cf. Dubé et al., 2013). The percentage of PDR developments that fell within each buffer was analysed, demonstrating whether conversions are generally located close to transport nodes. A separate 1500 m buffer was also created for comparison with a study that found that 94% of all London homes were within this distance of a train station (Collinson, 2014).
We also matched LDD completions to data from the Environmental Performance Certificate (EPC) dataset on housing unit size and energy efficiency, as well as measures such as floorspace, glazing extent and glazing type. While there are known issues with the replicability of EPC assessments (Nagarajah and Davis, 2019), this is nonetheless the sole way to access these details at scale. The address formats for LDD and EPC are not immediately compatible, a problem compounded by the fact that both datasets contain data-entry error and, rather more importantly, that the wholesale replacement of office buildings with residential often entails not only a rebranding of the building itself, but the renaming of streets and creation of new postcodes. Here, we relied on a variety of strategies to link the datasets: taking the application and completion dates as general indicators of development (noting completion dates can precede application for EPCs) we used the combination of proximity, overlapping terms and new EPCs issued in close succession to create automate linkages. This was supplemented with manual linking for large developments where these heuristics broke down. The match rate between EPCs and completed conversions in the London planning database was 81%, but multiple EPCs were sometimes issued for the same property (the highest number for what appeared to be a single unit was five unique EPCs). We therefore focussed on the first EPC issued for a unit given this best-represented the nature of the housing produced prior to any alteration by subsequent tenants or landlords (meaning we analysed EPCs for 14,044 or 76% of the units produced via PDR conversion,).
Finally, to explore questions of affordability we linked these datasets to the Land Registry’s Price Paid Data (PPD) which details property transfers on the open market, noting some transaction types – such as Shared Ownership and Right-To-Buy – are not reported. Overall, we were able to attach 4253 transactions to the 14,044 completed units that linked to EPCs, but the true match rate was 3769 (27%) due to repeated transactions on the same unit(s) (as determined by the re-appearance of the unique EPC identifier). While this is a modest fraction of the overall number of completed units, many of the largest schemes are not developed for sale to individual owners and typically will be Build-to-Rent projects (see also Brill and Durrant, 2021). Unfortunately, detailed rental market data for these properties is not currently available, but the sales data was sufficient to allow comparison of the prices of properties at an aggregated (Borough) level. Using the Gross Internal Area data from EPCs we calculated price per square metre and, in both cases, these figures were compared to annual earnings (readily available for London boroughs) to calculate affordability ratios. For context, in 2022 the average full-time worker would expect to spend around five times their average salary buying a home in the cheapest region of England (the North-East), 10 times their salary in the South-East, but 12.5 times their salary in London as a whole, rising to a staggering 38 times in the most expensive borough, Kensington & Chelsea (ONS, 2023).
The adequacy, affordability and amenity of PDRs in London, 2013–2021
The dominant narrative surrounding PDR conversions generally focuses on larger office developments (Evans, 2018; Jones, 2018). Indeed, RICS (2018) ignored conversions of less than 10 units when estimating that over 797,000 m2 of office space was converted to housing in London, 2015–2018. However, when considering all completed PDR developments 2013–2021, Figure 1 shows that an overwhelming majority (83%) of projects delivered 10 units or less, with the median PDR delivering just two units.
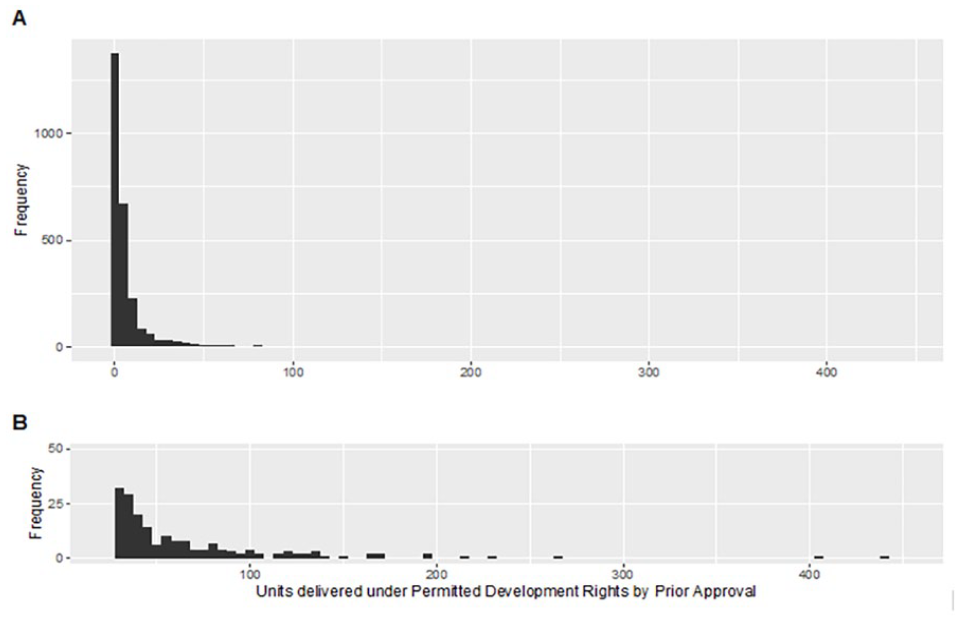
PDR developments, by units delivered (inset shows a zoomed-in view of developments delivering 50–450 units).
As such, the omission of smaller PDR projects in existing analyses impedes understanding of the process in London, warranting a more inclusive analysis. Consequently, this paper splits PDRs into small (10 units or less) and large (over 10 units) developments, to highlight key differences in terms of amenity, affordability and adequacy.
Location of PDR conversions in London
Much of the critique of Permitted Development revolves around the idea that it encourages the supply of new housing in areas where there remains demand for office space, but this is out-competed by residential land-use (noting that post-Brexit, 2016, yields in London’s office sector flatlined around 4% while residential continued to grow to 5% and beyond; Fadeyi et al., 2021). Figure 2 shows the distribution of PDR conversions across London. Notably, there are some neighbourhoods (MSOAs) lacking any PDR conversions, especially in the outer boroughs but also in Kensington & Chelsea (which was made exempt from PDR in 2013) and parts of Westminster (where Prior Approval conversions are restricted by an Article 4 direction in the ‘central activity zone’). Yet there are also notable clusters in both ‘prime’ and ‘sub-prime’ London: analysis showed small PDR developments (of fewer than 10 units) particularly noticeable in southwest London and the northern City fringe, where demand for larger offices has tended to remain high. Here, conversions were often of individual commercial premises along arterial routes and ‘high streets’. This included a west London cluster following the River Thames, a northern cluster trailing the Great North Road through Barnet and East Finchley town centres, and a southern cluster following the A21 through Lewisham and Bromley. Against this, larger PDR developments (of more than 10 units) were pronounced in Croydon, with secondary clusters in regional centres including Romford and Harrow, where demand for larger offices is known to have declined (see Supplementary Online Materials for additional maps, Kernel Density Estimation and spatial autocorrelation analyses, including hotspot and clustering results).
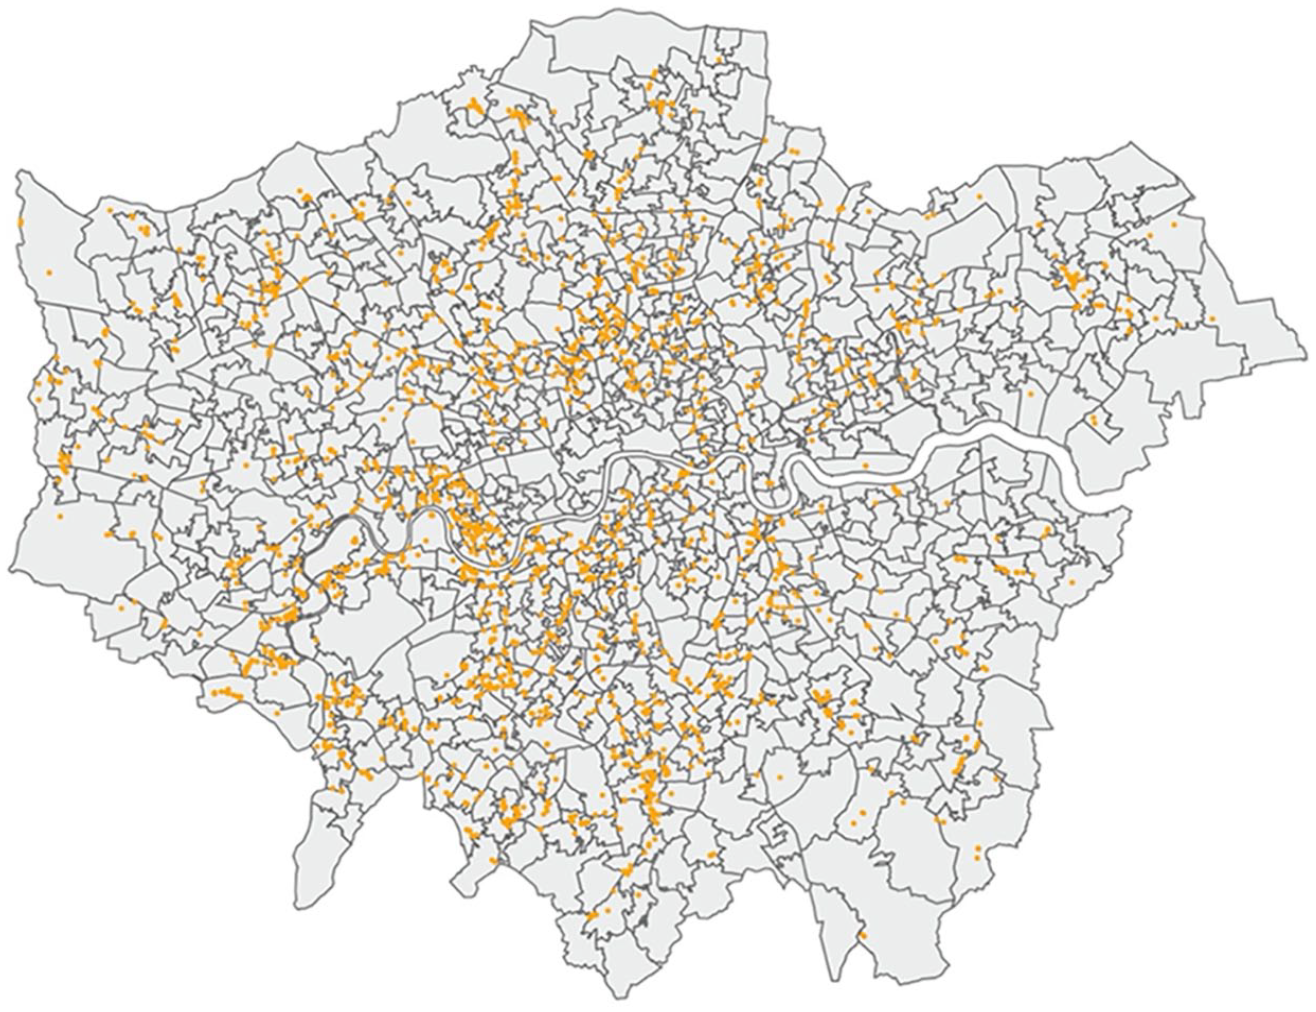
PDR schemes by MSOA.
Pollution
The location of several notable conversions alongside major highways has raised particular anxieties about air pollution (Marsh et al., 2022). London regularly experiences levels of NO2 exceeding EU-recommended limits, with pronounced inequalities present: Fecht et al. (2016) found NO2 concentrations 7.8 μg/m3 higher in the most deprived neighbourhoods compared with the least deprived. Figure 3 shows the mean and median NO2 pollution tile values for small (16.6 and 18 respectively), and large (16.1 and 17) PDRs. Though large PDR developments perform better, both the mean and median pollution values for small and large PDR developments fall within the top 20% of most NO2 polluted areas in London, with 78% of small and 72% of large PDR developments in the upper quartile of the most-heavily NO2 polluted areas (tiles 15–20). A Monte Carlo Test for spatial randomness indicated a statistically-significant relationship at the 99% level between NO2 pollution and the distribution of both small and large PDR developments (p < 0.01), suggesting both large and small PDR schemes are disproportionately found in the most polluted parts of London.
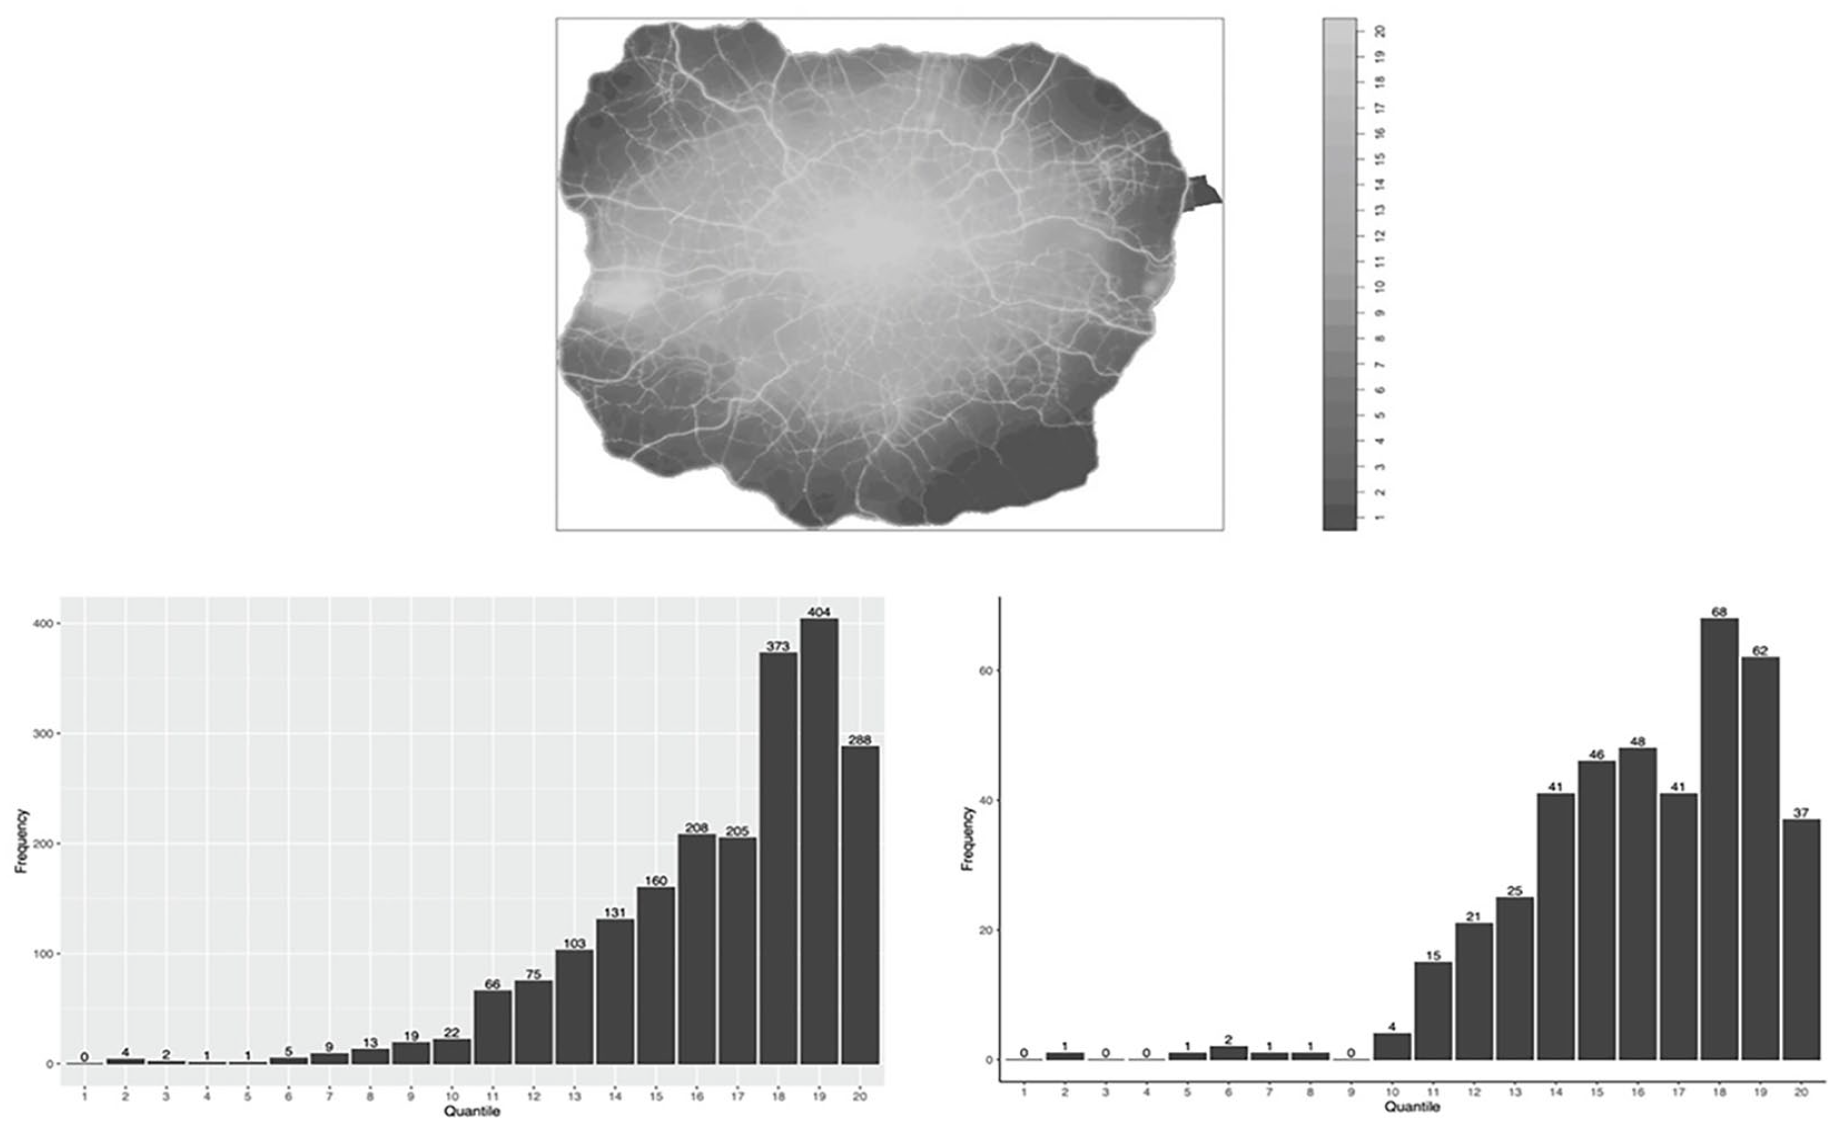
Map of pollution tiles (above) with distribution of PDR developments falling within each percentile band of NO2 pollution for small (left) and large (right) schemes.
Transport
Figure 4 shows both small and large PDR developments are fairly-well connected to public transport. Over half of small PDR developments are within a 500 m walk of the nearest train station, as compared to 62% of large PDR developments. This percentage increases to 91% for both small and large PDR developments when the buffer is increased to 1000 m (a brisk 10-minute walk to the closest station). 98% of small and 95% of large PDR developments are within 1500 m of the closest train station. In comparison, Collinson (2014) found 94% of all London homes were within 1500 m of a station, indicating PDR developments are generally better connected than the average London home (Collinson, 2014).
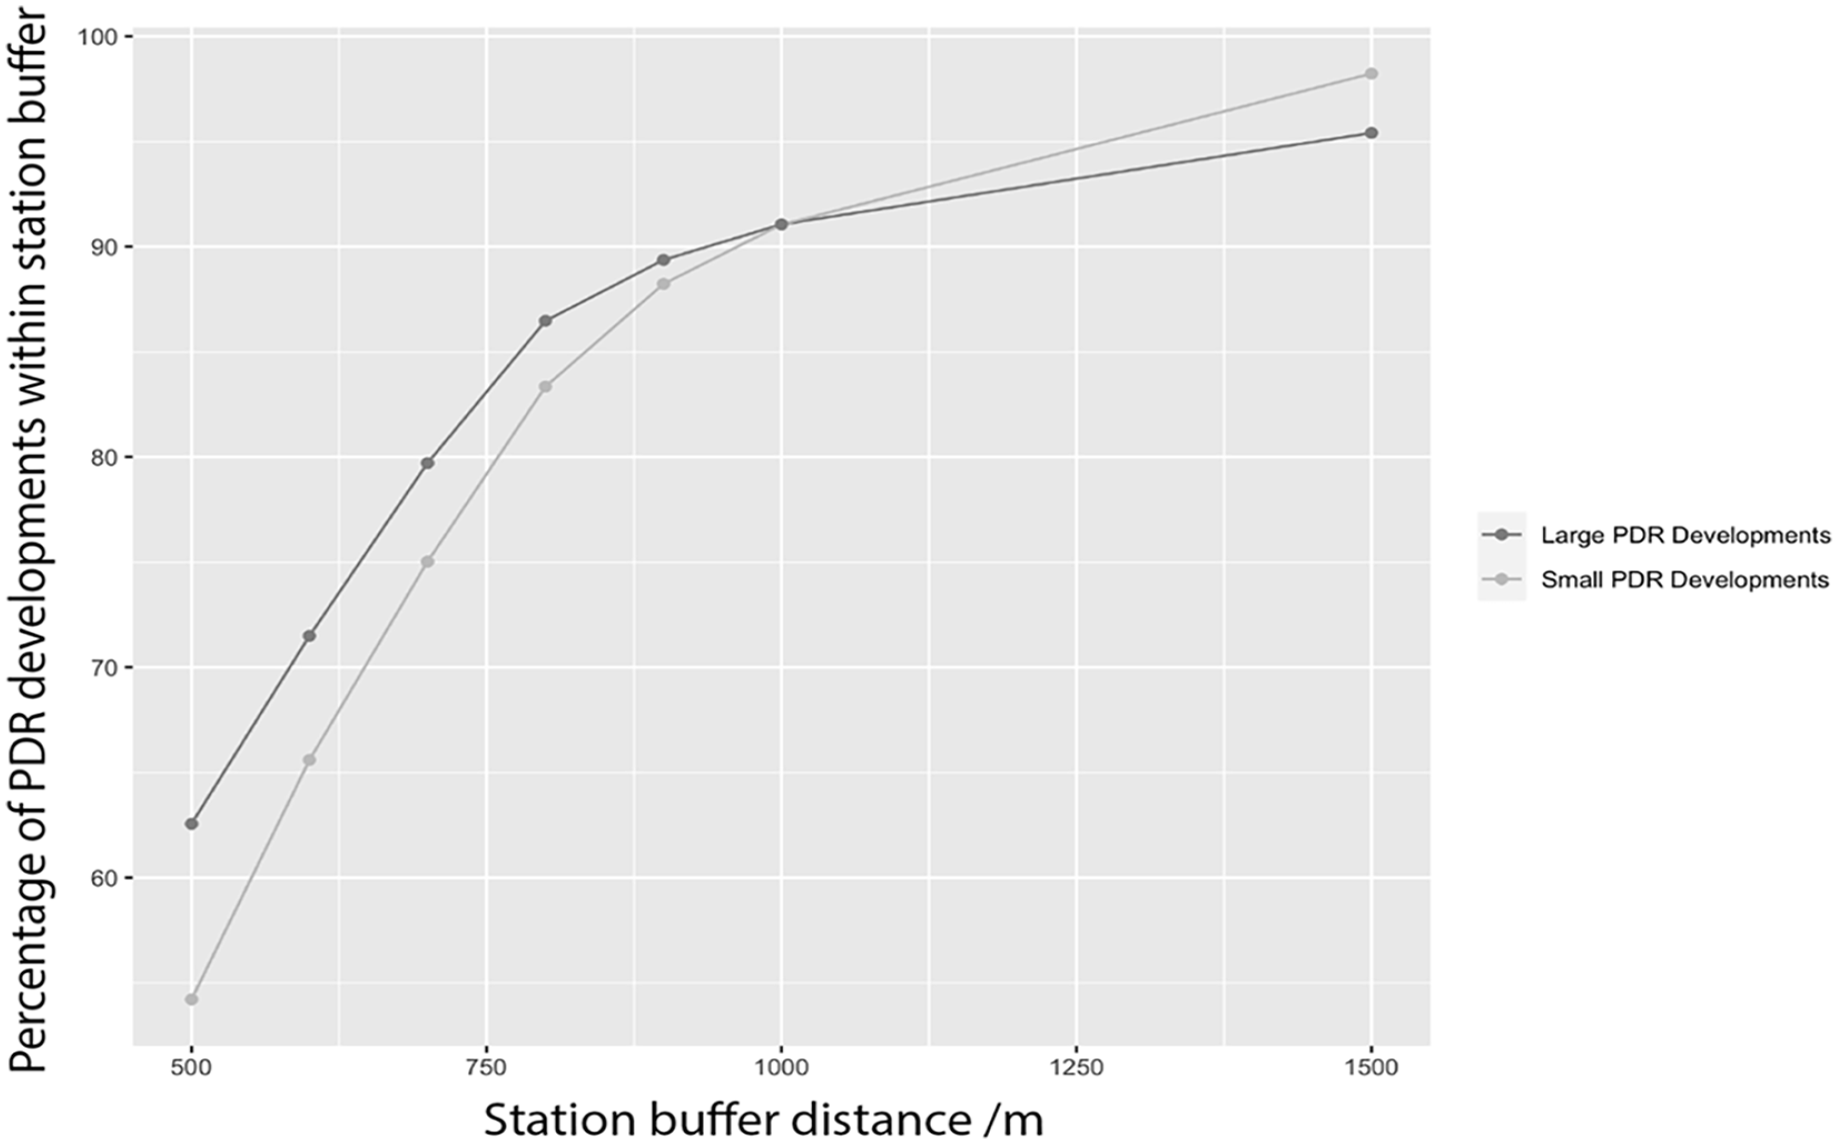
Percentage of small and large PDR developments within set distances of train stations.
Green access
Marsh et al. (2022) note limited references to green space access in the literatures on PDR, but several studies suggest conversions have characteristically poor links to the natural environment and lack external, communal spaces: Clifford et al. (2019) found only 50% of PDRs were within 250 m of green or open space. This relationship was explored by comparing number of PDRs in a ward with that ward’s proportion of accessible open space. The resulting scatterplots (Figure 5) show a negative relationship where larger numbers of PDRs are found in wards possessing less open accessible space. This relationship is more significant for large PDRs (p = 0.0317, significant at 95%) than smaller conversions (p = 0.54, insignificant at 95%). Though suggestive rather than conclusive, this implies that larger residential conversions are more common in areas with less accessible space for outdoor recreation, something that may be particularly important for those with children.
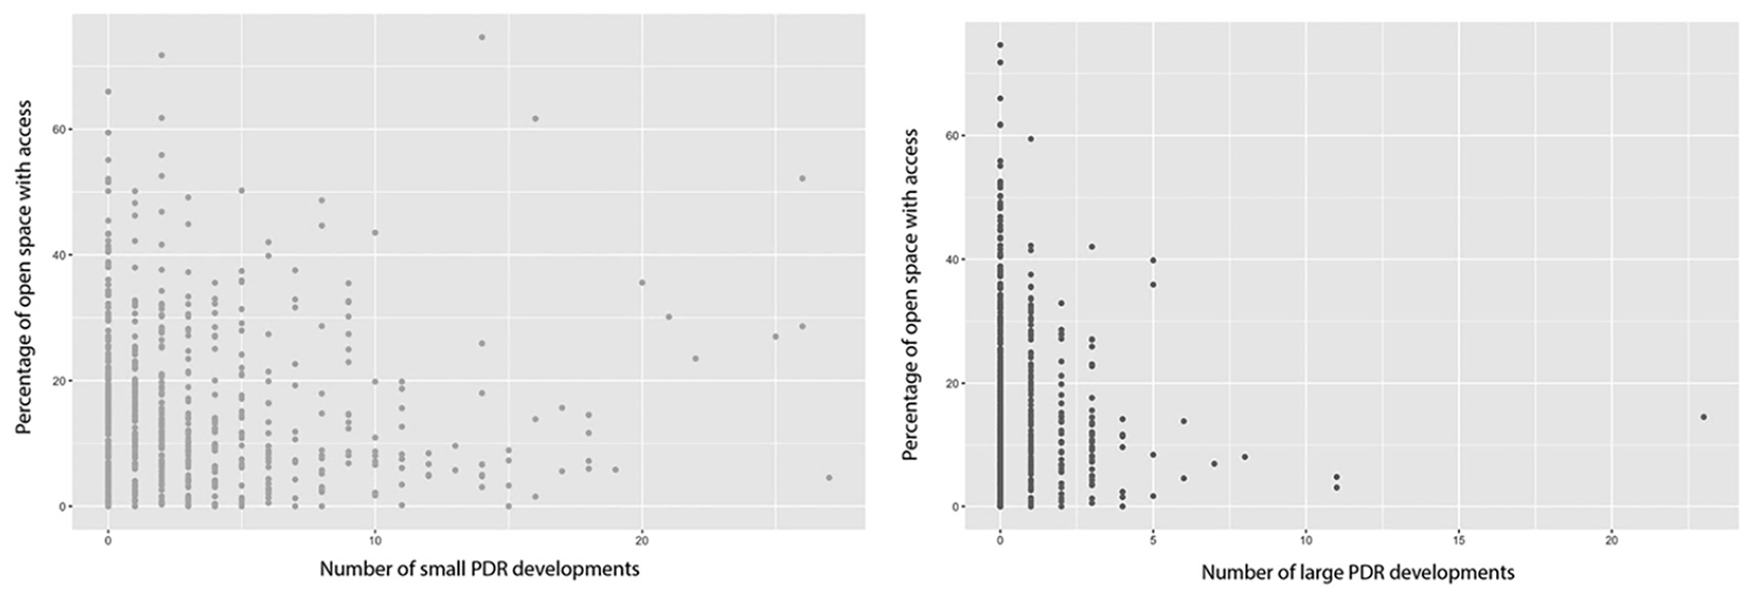
Number of PDR developments by ward vs percent of ward which is accessible open space for small (top) and large developments (bottom).
Energy and thermal comfort
The literature suggests a shortage of living space is related to higher transmission of infectious diseases within households, psychological distress and lower educational attainment (Kearns, 2022). We therefore deemed it important to assess PDR housing size and quality, employing EPC data to access floor area, glazing and energy rating as proxies for build quality. These latter attributes determine whether a flat has adequate sound and cold insulation – an issue many afflicting many older buildings (Boardman, 2007).
Table 1 shows that average energy ratings for small and large PDR developments are similar, with a mean of 3.32 and 3.22 respectively. These mean scores, and low standard deviation, suggest a typical energy rating score of C, higher than the median energy rating of D for all London dwellings (ONS, 2021) However, PDR conversions underperform when compared to new dwellings in London approved through the standard planning process, which have a median score of B. A tiny but noticeable number of small PDR units (154 units or 1.1%) have poor energy ratings of F and G, suggesting that little or nothing was done to improve their energy ratings during conversion to housing.
Summary statistics for energy ratings for small and large PDR developments, compared with all London homes and new dwellings in London.
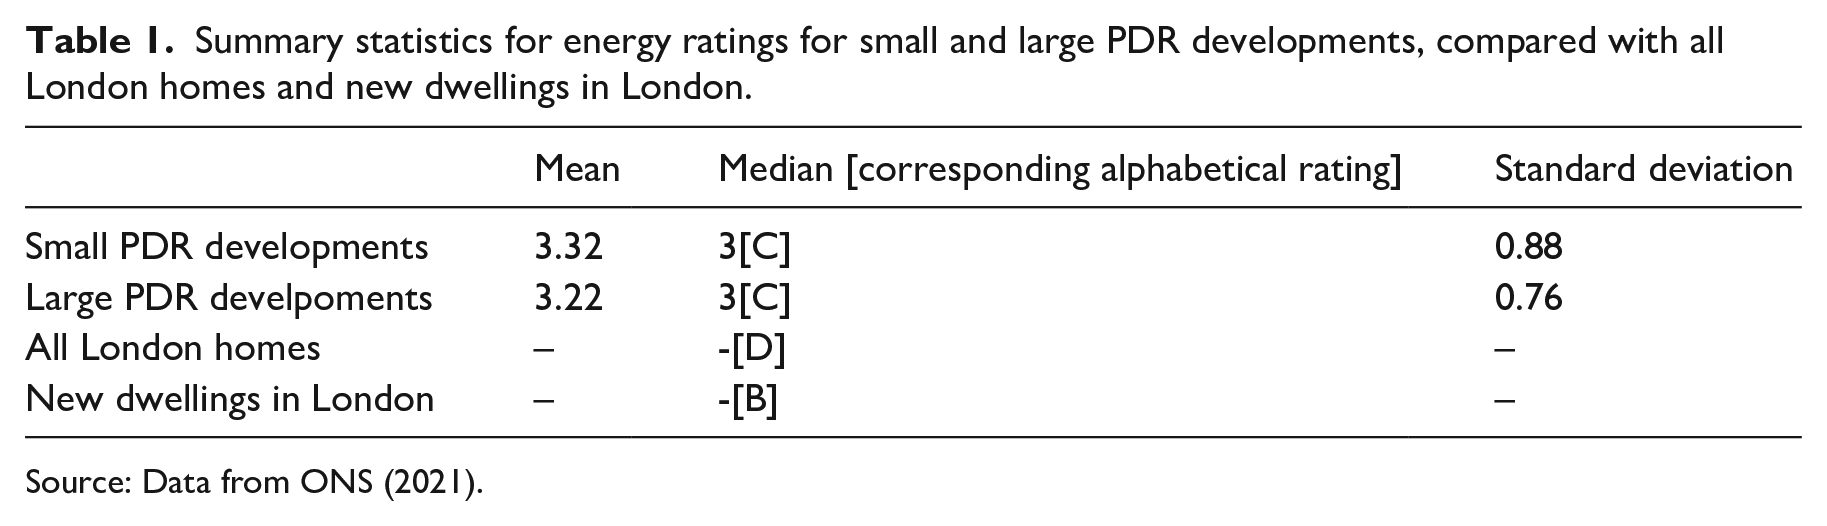
Source: Data from ONS (2021).
Noise
Only 30% of EPCs for small PDR developments and 5.5% of large PDR developments provided details on the glazing type so the findings in this section should be treated with caution. Figure 6 indicates that a majority of small and large PDR developments have double-glazed windows, but compared to units delivered in small PDR developments – which have little recorded provision of triple-glazing – a significant number of flats delivered by large PDR developments report triple-glazing.
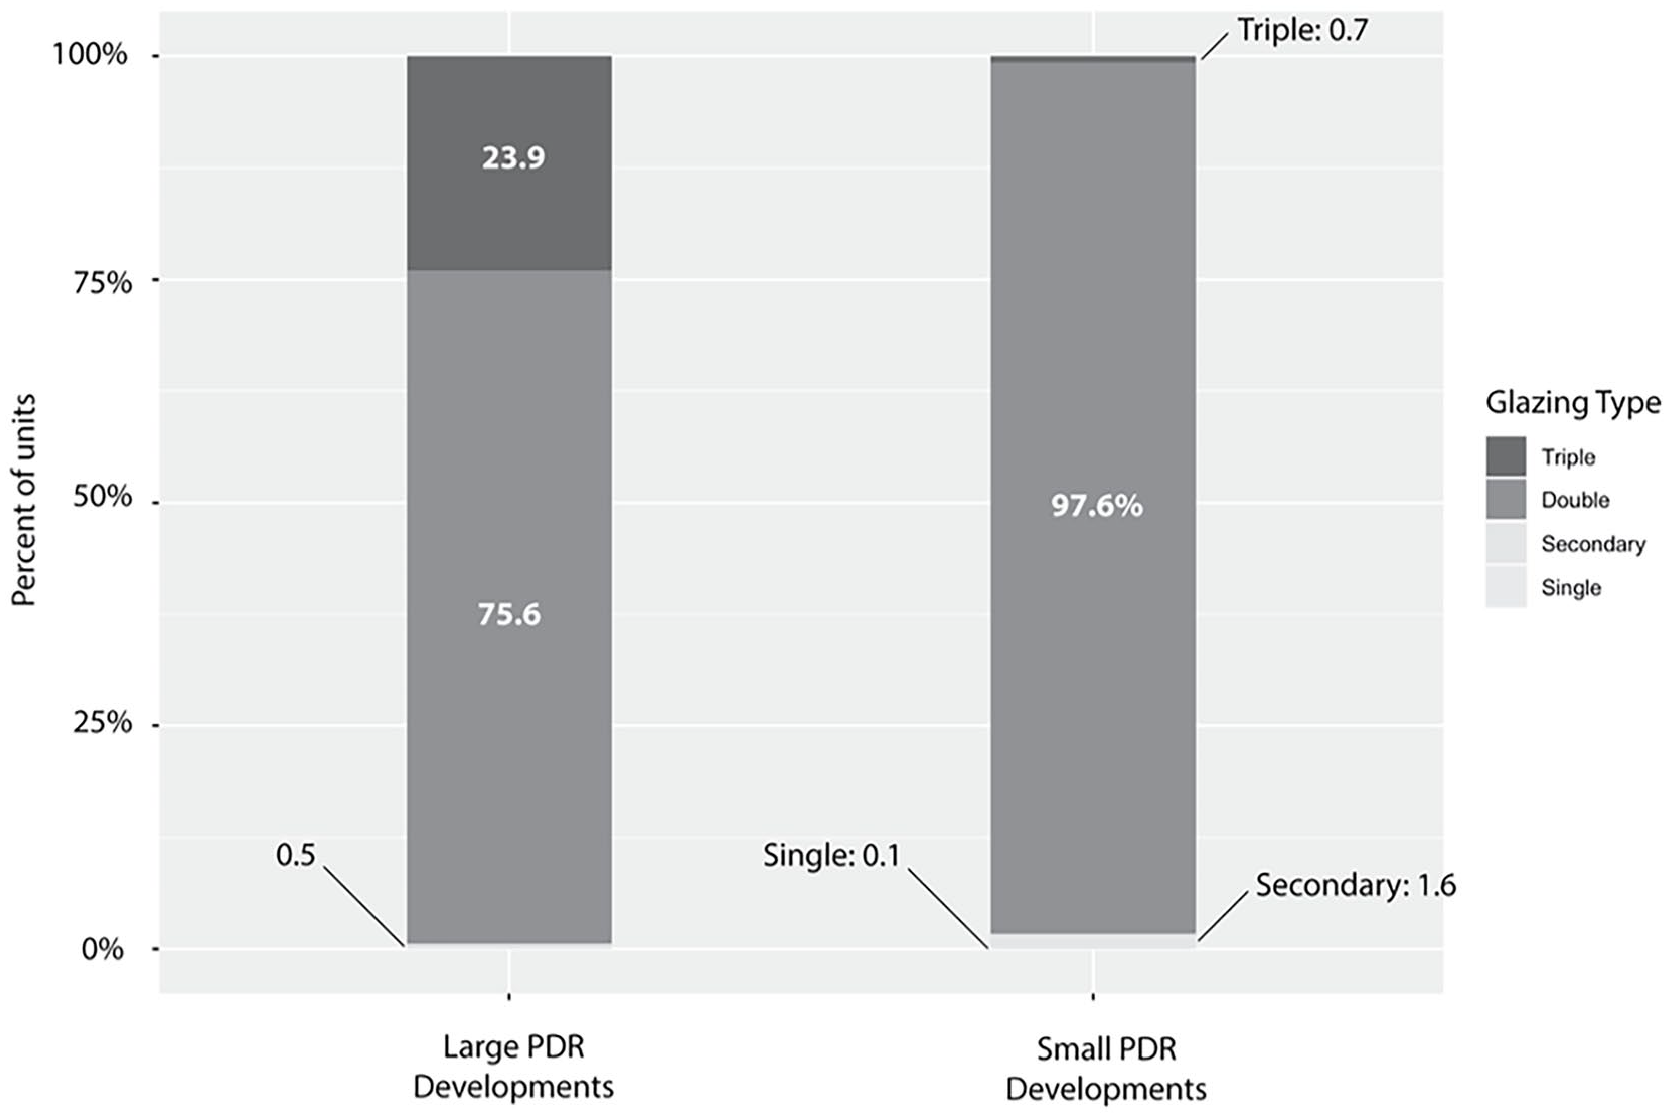
Proportion of glazing types for units delivered by small and large PDRs.
Sub-sized homes
While not all small housing in London is the result of conversion, PDR is often implicated in the production of sub-sized homes (Ferm et al., 2021). With a median size of 58 m2 and mean of 66 m2, flats delivered by small PDR developments were considerably bigger than flats in larger PDR developments (median of 49 m2 and mean of 53 m2), but both are well below the 80 m2 London average for all homes in the EPC database 2013–2021. This might well be expected since converted flats are generally smaller than free-standing homes, but analysis of matched records suggested as many as 400 cases where properties have been converted into houses rather than flats. To test if some of these larger, one- or two-unit PDR conversions skewed the overall distribution, Figure 7 distinguishes developments with 3–10 units from those with one or two. Here, the median and mean values dropped slightly to 55 and 58 m2 but remained larger than units delivered by large PDR developments.
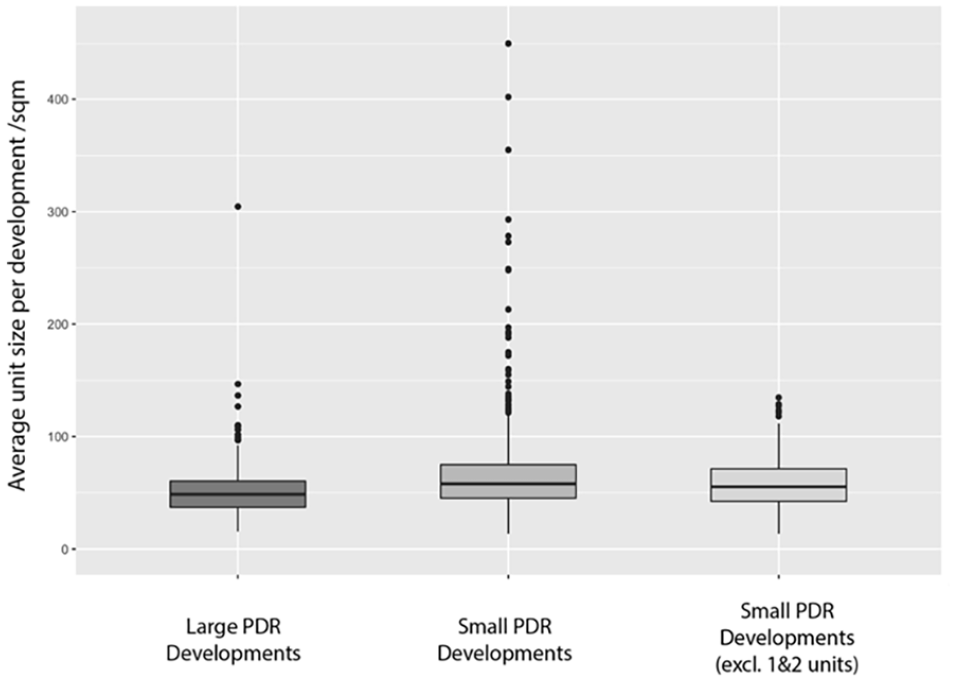
Box and whisker plot, unit sizes for large and small PDRs.
Overall, it is evident both large and small PDR developments have produced some homes below the NDSS minimum for a one-person, one-bed property of 37 m2. The smallest was a development consisting of eight studio units of 13–14 m2, and further analysis suggests the biggest culprits for small units were generally not ‘mega’ developments delivering upwards of 100 units, which are often highlighted in the media, but ‘less-visible’ developments delivering 10–30 units.
Figure 8 shows large PDR developments (33.7%) have delivered a greater proportion of units smaller than the NDSS minimum for a one-bedroom home compared to small PDR developments (14.1%), Here, we label homes smaller than 35 m2 rather than 37 m2 as below minimal size noting the over- and under-estimation evident in EPC certification (Nagarajah and Davis, 2019, suggest as many as one-in-four EPCs report floor space that varies by 10% or more from the ‘true’ habitable floor space). Whilst 34% of large and 14% of small PDR developments flouting the NDSS may seem like a high number, the values here are significantly lower than the 86.4% Clifford et al. (2019) and 70% Ferm et al. (2021) identified in their studies: however, it should be noted that some larger homes and flats may also be below the recommended NDSS for two, three or four-bedroomed properties, albeit the number of bedrooms is not indicated in the EPC/LDD, just the number of rooms per se.
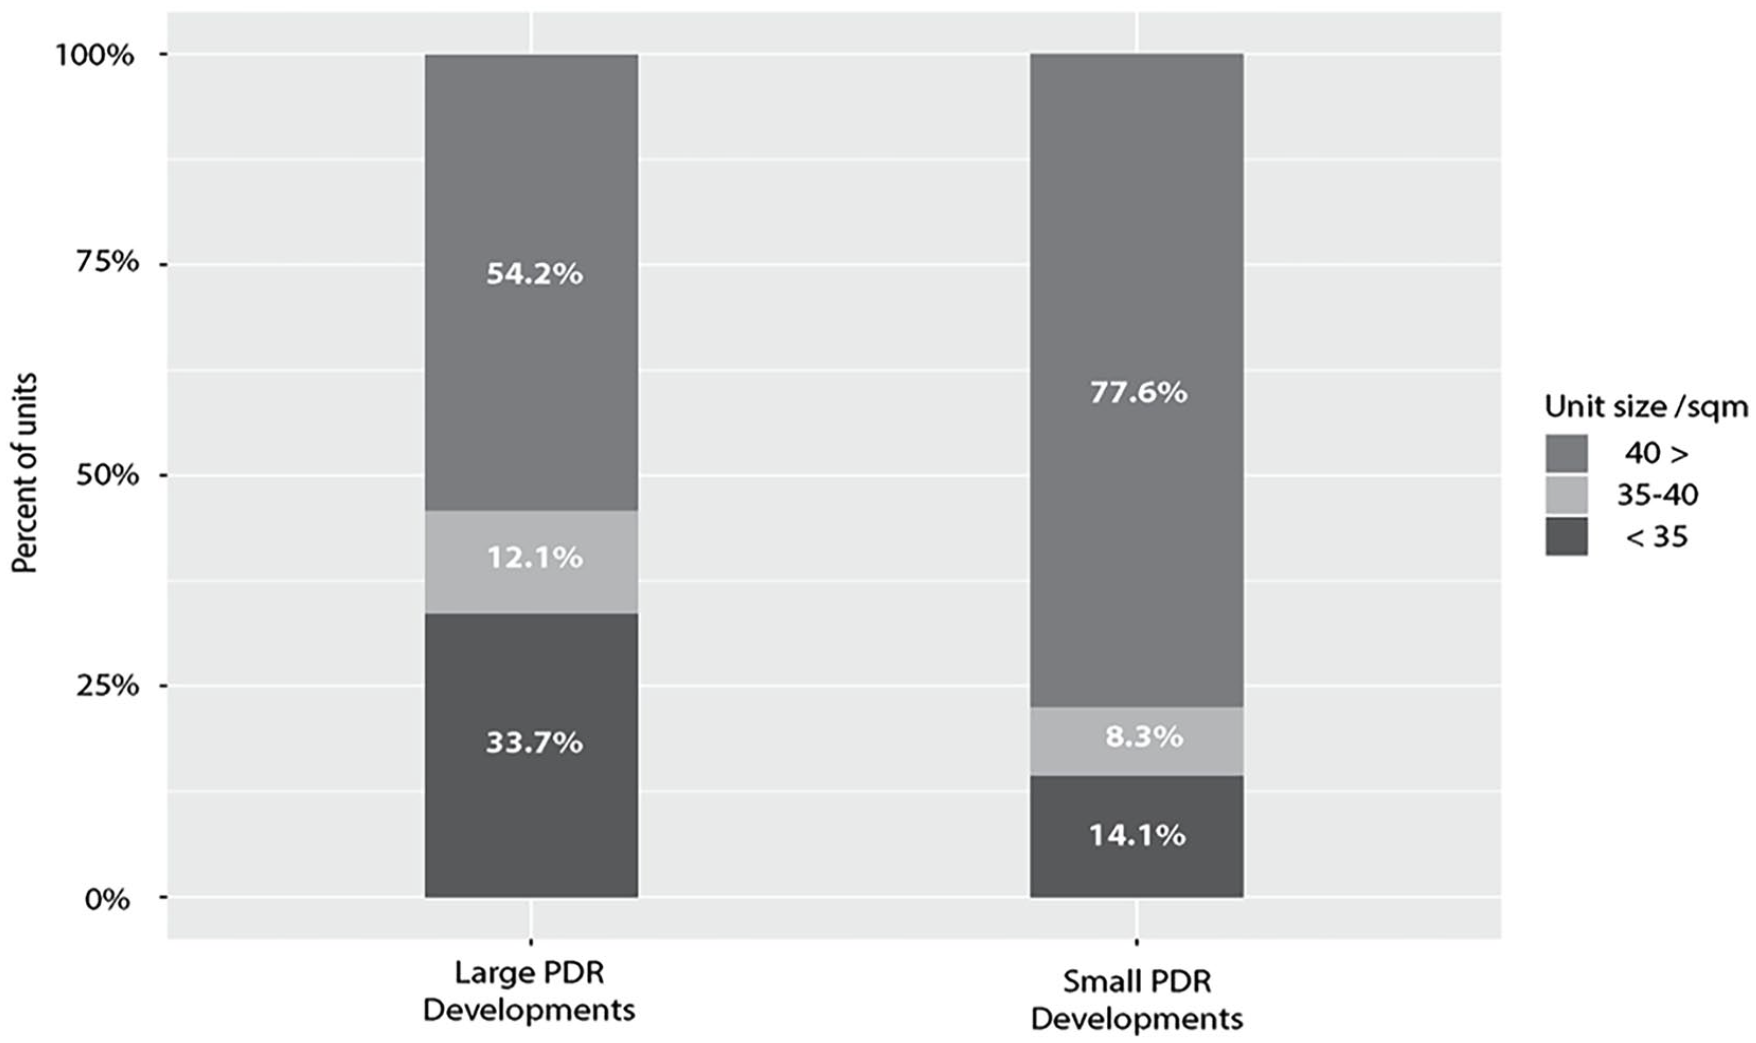
Stacked bar-chart showing the proportion of units below, at and above described space standards for small and large PDR developments.
Price and affordability
The logic of permitting commercial-to-residential conversion without full permission was that this would support housing delivery by allowing homes in locations previously deemed suitable only for offices or businesses. Because these locations are sub-optimal – for example, often adjacent to busy roads – it might be anticipated that this would allow for the development of cheaper-than-average, and hence more affordable, housing. Analysis of Price Paid Data indeed confirms that the median house price for a PDR property 2013–2021 was £337,221 as opposed to a London median of £448,221, and that PDR property prices were, on average, lower than non-PDR properties in all but 3 of the 32 boroughs (Brent, Haringey and Southwark). On the surface, this suggests these converted properties are generally more affordable than other homes, albeit the median PDR conversion still costs more than 10 times the local average annual earnings in all but five boroughs (Barking, Bexley, Havering, Hillingdon and Hounslow), noting that in 2022 the average full-time employee in England could expect to spend around 8.3 times their annual earnings buying a home (ONS, 2023).
The implication here is that while PDR housing is still expensive relative to the national average, they are generally more affordable than non-PDR properties in the same borough. Yet this positive conclusion, which suggests developers are passing on savings to property dwellers, needs to be tempered with the observation that PDR properties are on average smaller than other homes, with nearly one-third of flats in large PDR schemes below recommended minimum standards (see above). The implication is that these properties are only affordable because developers are densifying development, producing minimally-sized flats or worse. Linking PPD data to Gross Internal Area (as indicated on EPCs) confirms that while these properties are more affordable on average, on a metre-for-metre basis they cost more: the average PDR scheme cost £7487/m2 whereas the London average was £6045 in the same period, representing a significant discrepancy. The fact developers were able to obtain more on a metre-for-metre basis for property conversions than other new developments brings us to an uncomfortable conclusion: the state’s decision to roll back planning control may have produced new homes, but this came at considerable cost, with developers seemingly able to extract more value from central/accessible sites in London that were no longer subject to planning regulation than those sites that remained subject to development control.
Conclusions
In recent decades, the government has frequently accused the planning system of restricting housing supply in England by imposing strict guidelines limiting development to brownfield sites, promoting urban containment and restricting development density. Following this logic, planning deregulation has subsequently ‘greased the wheels’ of housing development, with ‘Prior Approval’ PDR conversions now responsible for around one-eighth of all housing nationally. To assess the impacts of this, this paper has offered a quantitative overview of conversions in London, 2013–2021, using unique matching techniques to explore the affordability, adequacy and amenity of the housing produced via PDR. This analysis has built on, and confirmed, many existing studies of Permitted Development, but confounded some existing assumptions which appear based on assessment of larger (i.e. more than 10 units) schemes and tipped towards obviously poorer-quality retrofitted office developments. For example, we found that more PDRs appear to meet minimum space standards than is often asserted, with around one-third of units in larger conversions appearing below the NDSS for a one-bedroom flat, but smaller, one-off conversions often producing larger flats and, in some cases, quite substantial houses. In this sense, PDR appears to have encouraged the production of homes that are on average smaller than the London mean/median, but in most cases these are above minimum space standards.
However, our analysis also revealed a distinctive geography of PDR, with the distribution of large and small PDRs revealing important differences. Overall, smaller PDR schemes clustered in South-West London, located on and around arterial roads into the capital. Many were conversions of individual offices, businesses and storage facilities in areas of high median house prices; these have relatively large accommodation spaces compared with those in larger PDR projects which tend to cluster in traditionally-more affordable parts of outer London such as Harrow, Romford and (especially) Croydon where demand for office space has demonstrably declined (cf London Councils, 2015). This noted, both small and large PDR developments share very similar locational attributes, tending to be found in well-connected places with rail/tube access, albeit often in areas with high traffic flow and pollution, making them less-than-ideal for high-density residential occupation. A possible explanation for these trends is that office and commercial developments are usually strategically located along busy roads or town centres to maximise ease of access for employees and ensure high customer footfall respectively. While deemed ideal for businesses, these locations are not be best suited for residential use due to the high noise and air pollution levels associated with busy streets. The PDR policy has therefore allowed development in areas that that were not ideal for habitation in the first place, with potential negative health impacts on residents (see Kearns, 2022; Marsh et al., 2022). The fact that many are in neighbourhoods that lack accessible open space raises further concerns about residential amenity, with large conversions statistically more likely to be found in wards without accessible green space.
Ovcrall then, this paper broadly confirms Madduda and Clifford’s (2023: 21) conclusion that PDR in England has ‘precipitated a race to the bottom’, producing accommodation that subjects residents to housing that is, on average and compared with that produced via conventional routes, inferior (being generally smaller, less energy efficient, more polluted and further from open green space than the average London property). Here, we also agree with Medduda and Clifford (2023: 21) when they state PDR has allowed ‘market actors to extract the meagre value existing in poorly-located or unsuitable buildings with minimal upfront investment’ – facilitating what they characterise as ‘quick and dirty’ conversion that involves the developer spending as little money as possible. Yet here we have suggested that this value is perhaps not so meagre, with PDR developments on average costing more per square metre than the average property sold in the same London borough. Hence, while allowing properties to be built in locations deemed less suitable for housing should have produced affordable and decent housing, PDR appears to have added to the capital’s housing crisis by producing housing that is scarcely more affordable than the London average despite being smaller on average: in relative terms it is less affordable.
Clearly, our extensive overview of the impact of PDR on London’s housing markets leaves many questions unanswered about the financialisation of housing in the capital, not least because notions of property ‘value’ involve complex symbolic forms of capital exchange as well as economic transactions (Hyde, 2022; Lake, 2023). As Rogers and McAuliffe (2023) note, the idea of ‘value capture’ itself is produce through a complex articulation of ideas, data and evidence (including, e.g. predictions of rising yields in the residential property market, and stagnating yields in London’s office market). Irrespective, our analysis points to the idea that speeding up and ‘greasing’ the planning machine has not had the outcomes which the government claimed it would have, appearing counterproductive to the goal of producing more ‘decent’ affordable homes for Londoners. In sum, we conclude that this planning reform has allowed developers to de facto exploit local ‘rent gaps’ by converting less profitable office and commercial premises into more lucrative housing (Holman et al., 2018), but has not produced the affordable, decent homes so badly needed. This identifies planning deregulation as one of the main ways that the state has facilitated forms of real estate speculation, albeit here this is presented as the solution to the housing crisis, not one of its causes (Stabrowski, 2015).
In all of this, we lack understanding of who occupies PDR developments, and how. Assumptions have tended to revolve around the idea that conversions target students and young professionals (Ferm et al., 2021) but the distribution of small and large PDRs respectively suggests a more varied picture in London. Smaller PDRs – by unit count, not floorspace – tend to be in traditionally more expensive areas of South-West London and might be intended to appeal to professionals, while larger developments are more common in cheaper areas and might cater for a wider demographic. Both might conceivably also become part of the Build to Leave market, left empty but retained as a store of value for investors who have no intention of living in these properties. Unfortunately, existing data sources allow us little purchase on such issues, but the clustering of larger conversions with smaller unit sizes in areas where there is declining demand for offices points to developers attempting to maximise their profits via a state-facilitated strategy of densification, producing smaller homes in locations that are already over-occupied, polluted and lacking in green space. These in particular cannot be considered healthy homes and may expose residents to forms of ‘slow violence’ which will only reveal themselves over time (Nixon, 2011). The latter is of especial significance given racialised and minoritised populations in ‘global’ cites are often subject to the violence of environmental inequality (see Marquardt, 2022, on Catford, SE London). Further studies exploring the experience of living in homes created through deregulated planning are hence needed, especially if these make visible the living conditions faced by many of London’s super-diverse non-white populations (Davies, 2022) – populations now poorly served by state-subsidised housing (Lees and Hubbard, 2022).
Footnotes
Declaration of conflicting interests
The author(s) declared no potential conflicts of interest with respect to the research, authorship, and/or publication of this article.
Funding
The author(s) received no financial support for the research, authorship, and/or publication of this article.