
Abstract
This paper presents a novel approach to capture ‘buzz’, the vibrancy and knowledge exchange propensity of localised informal communication flows. Building on a conceptual framework based on relational economic geography, we argue the content of buzz may allow to probe into the character of places and investigate what is ‘in the air’ within regional entrepreneurial milieux. In particular, we analyse big data to listen for the presence of buzz about innovation – defined by discursive practices that reflect an innovative atmosphere – and explore how this may influence regional firm creation. Using information from 180 million geolocated Tweets comprising almost two billion words across NUTS3 regions in the UK for the year 2014, our results offer novel evidence, robust to different model specifications, that regions characterised by a relatively higher intensity of discussion and vibrancy around topics related to innovation may provide a more effective set of informal resources for sharing and recombination of ideas, defining regional capabilities to support and facilitate entrepreneurial processes. The findings contribute to the literature on the intangible dimensions in the geography of innovation and offer new insights on the potential of natural language processing for economic geography research.
Introduction
Building on the seminal analysis of territorial agglomerations by Marshall (1890), the literature has described regions as loci for interactive learning underpinning innovation and new knowledge creation (Bathelt and Glückler, 2003; Camagni, 1991; Malmberg and Maskell, 2002; Storper, 1997). This perspective has also served as a framework of reference for the analysis of entrepreneurial processes at the regional level, where knowledge created but left unexploited by incumbent actors and then recombined with other ideas by spatially embedded agents becomes a critical driver of new firm creation (Acs et al., 2009; Audretsch et al., 2008). These dynamics present a strong spatial dimension as the exchange of tacit and uncodified knowledge which underpins entrepreneurial opportunity recognition occurs more effectively through localised interactions (Jaffe et al., 1993; Polanyi, 1967; Sonn and Storper, 2008). It is through these dense social networks that ‘entrepreneurs tap into knowledge streams they would otherwise not be able to access’ (Spigel, 2017: 4).
Economic geographers have underlined the importance of the complex web of information and knowledge exchange ecology created via co-location through the concept of ‘buzz’ (Bathelt et al., 2004; Storper and Venables, 2004). Yet, partly reflecting the intangible nature of this concept, buzz has often been simplified as a synonym for density of interaction and its analysis has remained subsumed within the broader effects of agglomeration economies and proximity in economic activity (Qian et al., 2013). This has led to researchers ignoring an important dimension of the concept – the content of buzz that is reflective of ‘nondeliberate knowledge-exchange and information-exchange propensities’ (Asheim et al., 2007: 659). Connecting to the role of place-specific informal institutions and social and normative contexts in shaping relational structures (Gertler, 2003; Saxenian, 1996; Storper, 1997, 2018), the content of buzz can be seen as indicative of whether, even for the same levels of knowledge and economic density, some places may be defined by a more innovative atmosphere better supporting the propensity to discuss new ideas and engage in innovative practices.
In this paper, we argue that listening for the presence of innovation within localised buzz represents an important element for probing into the intangible character of places to capture the seminal notion of ‘industrial atmosphere’ discussed by Marshall (1890). Building on a conceptual framework based on relational economic geography and the knowledge spillover theory of entrepreneurship (Acs et al., 2009; Bathelt and Glückler, 2003; Storper, 1997), we posit observing the content of buzz may reveal the extent of the innovativeness of knowledge-exchange ecologies that define the regional entrepreneurial context. In particular, the content of buzz may be indicative of both an informative and normative dimension (Bathelt et al., 2004; Storper and Venables, 2004). In this sense, the presence of buzz about innovation may reflect a localised relational infrastructure of shared interests and interpretative schemes, surrounding potential entrepreneurs with valuable knowledge and a continuous re-discussion of information about new opportunities. At the same time, it may reflect localised descriptive norms encouraging the discussion and implementation of novel ideas, thereby supporting entrepreneurial action.
To ‘listen’ to the buzz, we leverage the opportunities offered by big data recently highlighted in the scholarly community in the context of regional studies and entrepreneurship research (Indaco, 2020; Schwab and Zhang, 2019; Van Meeteren and Poorthuis, 2018). In the last decade, the increasing availability of geo-tagged data from social network sites has led to a substantial body of research exploring the structure and spatiality of online communities (Crampton et al., 2013; Stephens and Poorthuis, 2015; Tranos, 2020), including digitally mediated interactions of entrepreneurial networks (Wang et al., 2017). Here, we endeavour to contribute to this literature following a complementary perspective focusing on the content of geo-located social media and language patterns in economic geography (Casadei and Lee, 2020; Obschonka et al., 2020). In particular, we explore a set of measures based on natural language processing to investigate whether regions with buzz characterised by discursive practices reflecting an emphasis on innovation experience higher rates of entrepreneurship, using data from 180 million geolocated Tweets encompassing almost two billion words across NUTS3 regions in the UK for the year 2014.
Controlling for regional factor endowments such as GDP and different measures of human capital as well as density, we present novel evidence suggesting regions characterised by a relatively higher intensity of discussion and vibrancy around topics related to innovation may provide a more effective environment for entrepreneurial processes. While the explorative nature of our analysis does not address causal effects, our findings allow us to advance the concept of buzz by emphasizing the importance of its content and the potential in geo-located big data sources for comparing the ‘innovativeness’ of buzz across places.
The rest of the paper is organised as follows. In the second section, we delineate the theoretical framework of the paper. In the following sections, data and methods are discussed before presenting results and a discussion of the findings. The final section concludes with a review of the key theoretical as well as methodological implications, together with limitations of the paper.
Theoretical framework
Entrepreneurship, spatial proximity and buzz
Scholars have long emphasised the role of localised factor conditions and geographical proximity as fundamental drivers of new firm creation (Armington and Acs, 2002; Fotopoulos, 2013; Fritsch and Falck, 2007). The relationship between local knowledge, proximity and new firm creation is formalised in the knowledge spill-over theory of entrepreneurship, which suggests entrepreneurs start new firms to take advantage of opportunities offered by knowledge created but left unexploited by incumbents (Acs et al., 2009, 2012; Audretsch and Lehmann, 2005; Audretsch et al., 2008; Qian and Jung, 2017). In line with this framework, entrepreneurial opportunities are broadly defined as a function of place-specific knowledge endowments and higher density of economic activity (Qian and Acs, 2013; Qian et al., 2013). Accordingly, empirical studies have pointed to a positive relationship between investment in knowledge creation within a region and the resulting knowledge spillovers on entrepreneurship rates (Audretsch and Lehmann, 2005; Audretsch et al., 2008). Thus, ‘contexts rich in knowledge will generate more entrepreneurial opportunities’ (Audretsch and Keilbach, 2008: 1699). Similarly, the presence of higher levels of human capital allows for both a source of knowledge as well as providing higher levels of entrepreneurial absorptive capacity (Qian and Acs, 2013; Qian et al., 2013). The role of density and agglomeration for entrepreneurial processes is defined by the locally bound nature of knowledge spillovers, whose diffusion is spatially constrained because the transfer of knowledge is not costless across geographic distance (Audretsch and Lehmann, 2005). This is especially the case for ‘tacit’ knowledge, which remains highly context specific due to its uncertain and fuzzy nature (Gertler, 2003). As knowledge diffusion tends to be ‘sticky’, the density of economic activity becomes the conduit for the transmission of new ideas and entrepreneurial opportunities, encouraging the clustering of entrepreneurial and innovative activities (Glaeser et al., 2010).
The importance of geographical proximity and localised interaction for knowledge recombination is notably captured in the concept of ‘buzz’. Bathelt et al. (2004: 38) have defined ‘buzz’ as ‘the information and communication ecology created by face-to-face contacts, co-presence and co-location of people and firms within the same industry and place or region’. Scholars have traditionally underlined spatial proximity as being critical for buzz (Bathelt et al., 2004; Gertler, 2003; Storper and Venables, 2004). Yet, its conceptualisation is not confined to a synonym for density of interaction (Qian et al., 2013). Buzz comprises informal institutions rooted in a place-specific social and cultural milieux (Malmberg and Maskell, 2002). These define an informal relational infrastructure offering an effective conduit for the diffusion of information through the shared interests, attitudes and interpretative schemes of embedded participants (Bathelt et al., 2004). In this sense, buzz reflects the emergence of a common language that underpins collective learning within ‘innovative milieux’ (Lawson and Lorenz, 1999). These dynamics distinguish the informative character of buzz as a critical driver of tacit knowledge exchange, also revealing the socialisation effects within the concept (Storper and Venables, 2004). This framework also reflects similar perspectives in the entrepreneurship literature suggesting knowledge about opportunities and new technologies rests upon social attributes that are context specific (Spigel, 2017).
Building on these insights, we propose that the presence of buzz about innovation may be reflective of an atmosphere characterised by vibrancy around innovation related topics conducive to the exchange of novel ideas and be indicative of local descriptive norms of innovative behaviour, thereby fostering regional entrepreneurship.
Buzz and the innovative atmosphere
In economic geography literature, scholars have long underlined the importance of a broad set of intangible elements for knowledge diffusion within clusters suggesting that, of places with similar levels of knowledge creation and density of interaction, some may be defined by a stronger drive to innovate (Saxenian, 1996; Storper et al., 2015; Urbano et al., 2019). Moving beyond traditional perspectives based on education levels and R&D activity as determinants of such an innovative environment, growing research has started looking at the role of creative occupations in shaping such an innovative atmosphere for new firm formation. Several authors have underlined that the level of human capital is not necessarily a conduit for knowledge creation and entrepreneurship, and its effect is dependent upon whether it is used in a creative manner (Audretsch and Belitski, 2013; Lee et al., 2004; Sleuwaegen and Boiardi, 2014). Firms in creative industries have been associated with the introduction of original innovation across cities (Lee and Rodríguez-Pose, 2014). Building on the arguments by Florida (2002) on the creative class, research shows that higher proportions of people in creative industries and ‘bohemians’ are linked to regional firm entry (Lee et al., 2004) and city level firm entry (Audretsch and Belitski, 2013).
However, this view has been criticised along two main elements. First, some authors argue the creative capital of regions is simply a proxy for human capital (Glaeser, 2004). Others have pointed out that measuring creativity using creative occupations may lead to excluding many other jobs that are not classified as creative but actually do present significant aspects of innovative content (Boschma and Fritsch, 2009). Indeed, Florida himself recognises this point when he argues that creativity can be required from manufacturing and assembly workers as they engage in problem-solving to improve productivity and deal with breakdowns (Florida, 2012). Levels of creativity and innovation in a region are thus important but may not be accurately captured by measures of human capital and occupational structure (Sleuwaegen and Boiardi, 2014).
In particular, some authors have criticised these approaches for being centred solely on the presence of people with creative and innovative capabilities (Storper and Scott, 2009; Storper et al., 2015). Instead, this stream of research argues that it is place-specific practices and collective routines as well as interests of local communities that define the ‘industrial atmosphere’ and character of innovative places. Storper (2018) underlines the content of networks is a key component of the relational infrastructure of places; thus, observing shared ideas and practices can reveal a broader regional context beyond technology or industry specific factors. These elements define the nature of localised buzz. While buzz is available to the ‘insiders’ of an industrial cluster, the type of information and signals that are transmitted via buzz may not be easily accessible or interpretable for those that are not part of the cluster. This is because economic actors who are co-located are exposed to a certain ‘noise’ that can be translated into patterns of signals by insiders who share the same interpretative schemes and which might not be shared with outsiders (Grabher, 2002). In this sense, the propensity to exchange ideas goes beyond the level of human capital available and it is not simply defined by creative people moving in (Spigel, 2017). Instead, some places may offer a nurturing innovative environment characterised by a higher propensity to discuss new ideas that result from the intensity of discussion and vibrancy around topics related to innovation. In such a situation buzz can play an informative role – surrounding individuals with a context of diffused information where talk on innovation and new ideas is common.
These arguments are reinforced by the role buzz may play in socialisation of people into innovative and entrepreneurial behaviour. As Bathelt et al. (2004) point out, the information and communication flows in buzz also transmit descriptive norms to those who ‘mingle’ in the same economic and social context. Descriptive norms ‘are standards that develop out of our own observation of others’ behaviour’ (Cialdini and Trost, 1998: 152) that inform us of how other people typically act and can guide individuals’ decision-making processes. In this sense, looking at the dominant topics of conversation in a community allows us to explore a mechanism by which cultural prescriptions about expected behaviour are diffused to individual members of a community. An innovative atmosphere with descriptive norms on discussing and creating new ideas as common activities leads potential entrepreneurs to perceive their local environment as hospitable to entrepreneurial efforts. Linking to established research on the role of informal institutions in underpinning entrepreneurial processes, descriptive norms provide a particular logic of action (Lefebvre et al., 2015; Linan et al., 2011; Saxenian, 1996; Storper et al., 2015; Terjesen et al., 2016). Descriptive norms that are shared within a community create cognitive legitimacy for particular actions that are seen as typical, accepted and desirable (Stephan and Uhlaner, 2010). As such, they represent a type of ‘social proof heuristic’. These insights reflect the normative dimension of buzz, which is shaped by ‘shared cultural traditions and habits [, with] actors continuously contributing and benefiting from the diffusion of information, gossip and news by just “being there”’ Bathelt et al. (2004: 38). Similarly, Storper and Venables (2004) identify psychological motivation stimulating imitation and competition as one of the main features of buzz.
In line with these arguments, we posit the actual content of buzz is an important aspect in understanding this intangible dimension of places and the diffusion of entrepreneurial opportunities, as it may reflect the regional zeitgeist (Storper, 2018) of collective interests and practices. In some places people may be interested in innovation and have vibrant discussions on the topic whereas in others innovation is rarely spoken about. Therefore, we propose to analyse knowledge exchange more directly by examining to what extent people are ‘buzzing’ about innovation. Such buzz reflects an environment where ‘know how’, information, and opportunities for innovation are being diffused, offering a nurturing environment to nascent entrepreneurs. At the same time, we propose the presence of buzz about innovation implies that innovation is the norm, that it is considered normal to run with new ideas, to experiment and also to fail. This provides social legitimation and normative influence on innovation and experimentation, thereby fostering regional entrepreneurship activities.
Data and methods
Twitter data
In this study, we follow a novel approach to proxy the content of buzz within a region using data from Twitter. Previous research shows that people use Twitter in many different ways. This includes posting about daily routines, conversations between users as well as sharing information or reporting news (Java et al., 2007). A single user may have multiple motivations, discussing both professional and personal life topics at the same time (Java et al., 2007; Tata et al., 2017; Zhao and Rosson, 2009). In particular, our dataset is based on all geolocated tweets in the UK for 2014, corresponding to almost two billion words across 180 million tweets. 1 The use of geolocated tweets allows to capture the exact location in terms of longitude and latitude GPS coordinates at the time of the tweet, which have been remapped to match NUTS3 region boundaries.
One aspect to consider when using big data from social media is the connection between the content of Tweets and their location. 2 A stream of recent research of online social networks has shown how these are connected to place and play an important role as local forms of communication (Gross et al., 2017; Stephens and Poorthuis, 2015). Tranos and Nijkamp (2013) explore the relationship between physical distance and virtual geography, highlighting the spatiality of the Internet. Similarly, Grabher (2002) argues that online interaction does not replace offline interaction but can reflect it or even ‘multiply’ it. More recent empirical research from Stephens and Poorthuis (2015) corroborates this view as in analysing Twitter data they found that local online networks are most effective at transmitting information. Accordingly, Twitter data have already been used to provide robust evidence and accurate measures on the spatial variation of a variety of topics, ranging from rates of heart-disease (Eichstaedt et al., 2015), fine-scale electric consumption (Deng et al., 2018), patents and GDP (Corradini, 2021; Indaco, 2020) to dominant demographic dimensions (Bokányi et al., 2016). In our dataset, as an example for the connection between the content of tweets and their location, the correlation between names of cities like Birmingham, Manchester or York and their NUTS3 location yields correlation scores higher than 0.9.
Another important element related to Twitter data is their representativeness. Recent studies have suggested the Twitter gender profile is close to the UK population as captured by the UK Census (Sloan et al., 2013). However, the average age of Twitter users is lower than the general UK population, though there is a significant tail of users aged 40 or above (Sloan, 2017). Data from social media are also skewed towards wealthy and highly educated users (Crampton et al., 2013; Wang et al., 2017). Accordingly, people from the creative industries tend to be over-represented across Twitter users (Sloan and Morgan, 2015). While these elements may create limitations in terms of representativeness of the UK population as a whole, 3 the profile of Twitter users aligns well with the dominance of highly educated 25–45 year olds in UK early-stage entrepreneurship (Hart et al., 2014) and it is likely to overlap significantly with most individual engaged in buzz about innovation. Accordingly, Twitter data have been used to explore entrepreneurial networks across (Wang et al., 2017) and capture personality traits for the analysis of regional entrepreneurship culture in the USA (Obschonka et al., 2020).
Differences in the socio-economic profile of Twitter users are reflected in well-known digital divides and uneven spatial distribution of content creation, which is markedly higher in places with higher education and economic activity (Graham and Zook, 2011; Indaco, 2020; Stephens and Poorthuis, 2015; Tranos, 2020). This requires adjusting text analysis for regional differences in the level of Twitter activity, in combination with ancillary data (Crampton et al., 2013). Accordingly, our Twitter measures are normalised for the total number of words per NUTS3 region, and are analysed controlling for economic development, population density as well as education levels across locations. We discuss variables and controls for our analysis in the next section.
Variables
In line with previous research (Armington and Acs, 2002; Corradini and De Propris, 2015; Lee et al., 2004), we measure entrepreneurship (ENTRY) by looking at the relative rate of new firms over the regional population. Hence, our dependent variable is calculated as the number of firms registered as founded in 2014 on the Business Structure Database (ONS, 2019), over NUTS3 population in 10 thousand people.
The key explanatory variable in the model is a novel measure of buzz about innovation (INNOBUZZ). This is defined as the relative count for the word ‘innovation’ over the total number of words (in million) within geolocated tweets in each region across 2014. 4 We note this measure is not confined to tweets from entrepreneurs or specifically dedicated to business activities. Conversely, it is defined over the population of geolocated tweets from all users to capture what is ‘in the air’. As discussed in the previous section, we underline our measure is normalised for the total number of words per NUTS3 region to take into account the uneven distribution in the level of content creation on social media (Graham and Zook, 2011; Indaco, 2020; Malik et al., 2015). Thus, INNOBUZZ is a relative measure reflecting the extent to which the innovation is a topic of interest across all conversations within a specific area. Focusing on the aggregate content of place-specific communication ecologies, our approach is intended to emphasise the spatial embeddedness that is inherent to local buzz. This is in contrast to the analysis of knowledge flows occurring exclusively within the structure of online exchanges, as reflected in the concept of virtual buzz (Bathelt and Turi, 2011; Tranos, 2020). In this sense, our measure offers a complementary perspective to previous research using Twitter data to explore entrepreneurial networks across digitally mediated interactions (Wang et al., 2017).
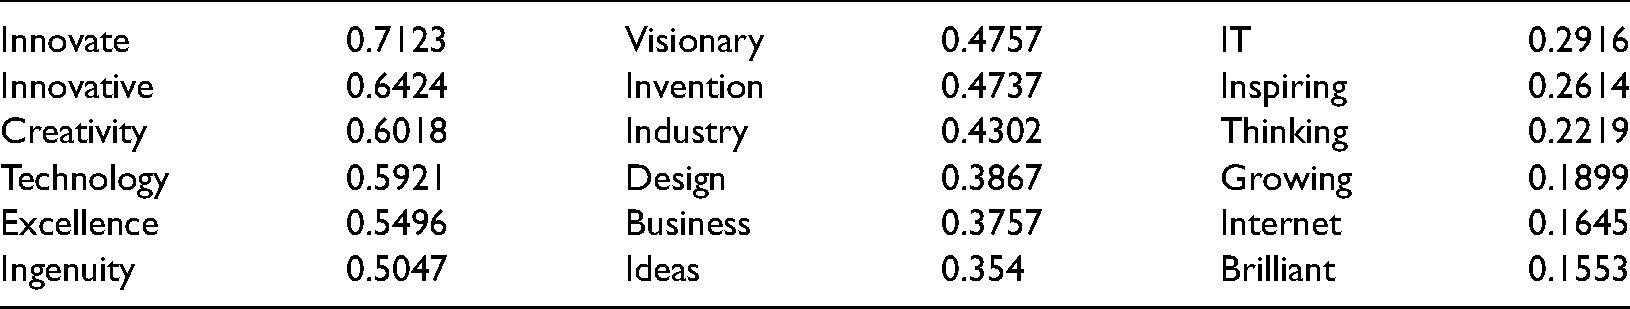
The straightforward operationalisation for INNOBUZZ is based on the word ‘innovation’ being used in a broad set of contexts, spanning across business and other areas of creative and innovative activities, as well as in more common situations. However, the use of a specific keyword exploits only limited information to capture the extent to which innovation is a topic of discussion in a specific place. Thus, we also explore an alternative approach considering all words within our corpus for each region. To this end, we follow a linguistics-based approach exploiting word co-occurrence analysis to identify other words that may be synonyms to ‘innovation’ or convey similar meanings. We start calculating the relative frequency of all words in each region weighted by their similarity to the word ‘innovation’. 5 Following an established approach in natural language processing applications, these weights are obtained by applying the Word2Vec algorithm introduced by Mikolov et al. (2013a, 2013b). Word2Vec trains a shallow neural network to obtain ‘neural word embeddings’ reflecting n-dimensional numerical vector representations for each word. This allows to transform a large corpus of words as input into a vector space where words that are used in similar contexts are assigned to vectors close to each other in the vector space (for a methodological discussion, see Mikolov et al., 2013a). This approach captures word-to-word relations based on their different contexts providing a more accurate measure of semantic similarity between words. 6 Thus, using pre-trained 300-dimensional vectors for 3 million words trained on a corpus of roughly 100 billion words from Google News (Mikolov et al., 2013b), we obtain similarity scores based on the cosine distance across word vectors numerically representing the relationship of each pre-trained word embedding to all others in the corpus.
A sample of words and their cosine similarity score is reported in Table 1. Based on this approach, we define INNOBUZZ_5 as the average regional cosine similarity of words whose cosine similarity score is higher than the 0.5 threshold in order to reduce potential noise from words with broader meanings. We also report and discuss results based on different threshold levels for robustness. In line with text analysis methods, the values are adjusted by the inverse word frequency formula 7 in order to confer a smaller weight to words that are more common in the corpus before calculating an average score for each region.
Sample of words and associated cosine similarity to innovation.
We add a set of explanatory variables to account for established determinants of entrepreneurship reflecting human capital, knowledge creation and density of interaction in the region. These measures are based on socio-economic regional data from the UK Office for National Statistics (ONS). We include a measure of human capital (EDUCATION) following the established measure defined as the share of the working population (people aged 25–64) with tertiary education, which is equivalent to at least degree-level qualifications. To test our measure of INNOBUZZ against previous work trying to capture aspects that are ‘in the air’, we follow previous work on the role of the creative class and include an index of creativity labelled CREATIVE INDEX (Lee et al., 2004; Sleuwaegen and Boiardi, 2014). This is defined as the number of people working in creative industries identified following the ONS methodology (ONS, 2016) over the total working population (Lee and Rodríguez-Pose, 2014). We also add R&D intensity (at the NUTS2 level 8 ) in logs to further capture scientific investment within the region. To proxy intensity of interaction, we use the common approach in the literature including a measure of population density in logs (POP_DENS), defined as the number of people per square kilometre at the NUTS3 level (Corradini and De Propris, 2015). We also test an alternative measure – labelled (FIRM_DENS) – reflecting the density of interaction in pooled labour markets, based on the number of firms over total population (Armington and Acs, 2002; Fang, 2020).
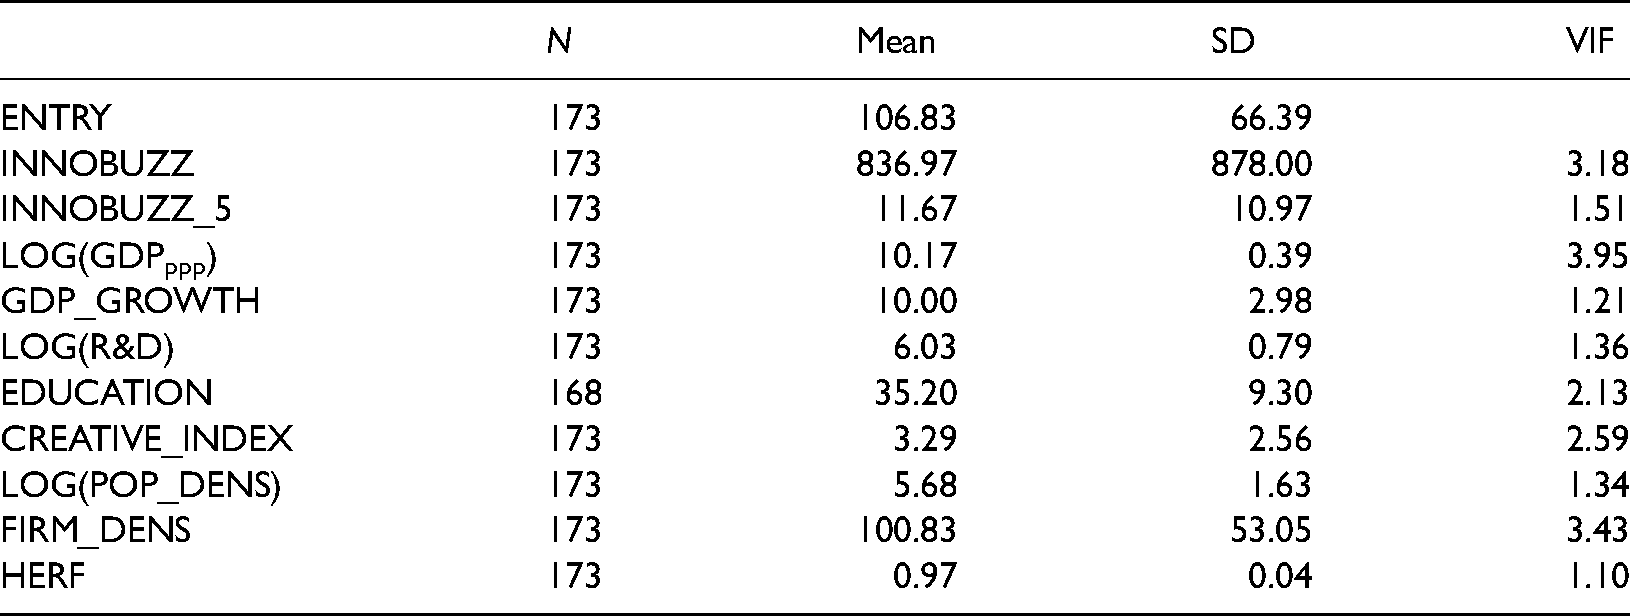
To control for other potential confounding factors, we add GDP per capita in purchasing power standard (log(GDPppp)) to control for regional factor endowments reflecting the availability of capital as well as the development of the region. Similarly, we control for GDP growth (GDP GROWTH), measured as the annual rate of change in GDP, to account for demand effects as a result of a growing economy (Armington and Acs, 2002; Rodríguez-Pose and Hardy, 2015). Finally, we proxy diversity in regional economic activity including an index of sectoral diversification (DIVERSIF) defined as an inverse Herfindhal index, calculated using employment data across SIC industries at 4-digit level. As discussed in the following section, our measure of INNOBUZZ reflects imbalances across the UK, presenting moderate levels of correlation 9 with control variables on regional development, education and density in labour markets. However, variance inflation factor (VIF) values suggest that multicollinearity is not a significant concern in this study. Descriptive statistics and VIF values for the variables in the sample are reported in Table 2.
Descriptive statistics.
Results and discussion
Exploring the spatial distribution of INNOBUZZ, which is shown in Figure 1 (left panel), we find evidence of strong heterogeneity across the various NUTS3 regions in the UK. Values for INNOBUZZ are particularly high for the largest cities, starting from central London as well as Greater London, but also Manchester, the region around Birmingham, Nottingham as well as Belfast. The regions of Oxfordshire and Cambridgeshire are similarly included in the top decile as well as the Thames Estuary region, which has seen an increasing investment and development in creative industries in recent years. The regional distribution is skewed at the top, with values in central London being significantly higher than the average value. This reflects well-known differences across UK regional economies and the special case of the capital city. Thus, we find that the distribution of INNOBUZZ across UK regions is not random, but effectively reflects the agglomerated nature of economic activities in the UK. This variable presents higher values in areas defined by high population density and high GDP per capita, both elements characterising larger cities where buzz is expected to be more prominent (Bathelt et al., 2004; Storper and Venables, 2004). These stylised facts are quite similar when looking at INNOBUZZ_5, reported in the right panel of Figure 1. The spatial distribution of both measures also resembles that of new firms across UK regions. Exploring the correlation between ENTRY and INNOBUZZ as well as INNOBUZZ_5, we observe a strong correlation between the first pair (r = 0.78); similarly, the association between ENTRY and INNOBUZZ_5 is also high (r = 0.52), though we note increasing noise.
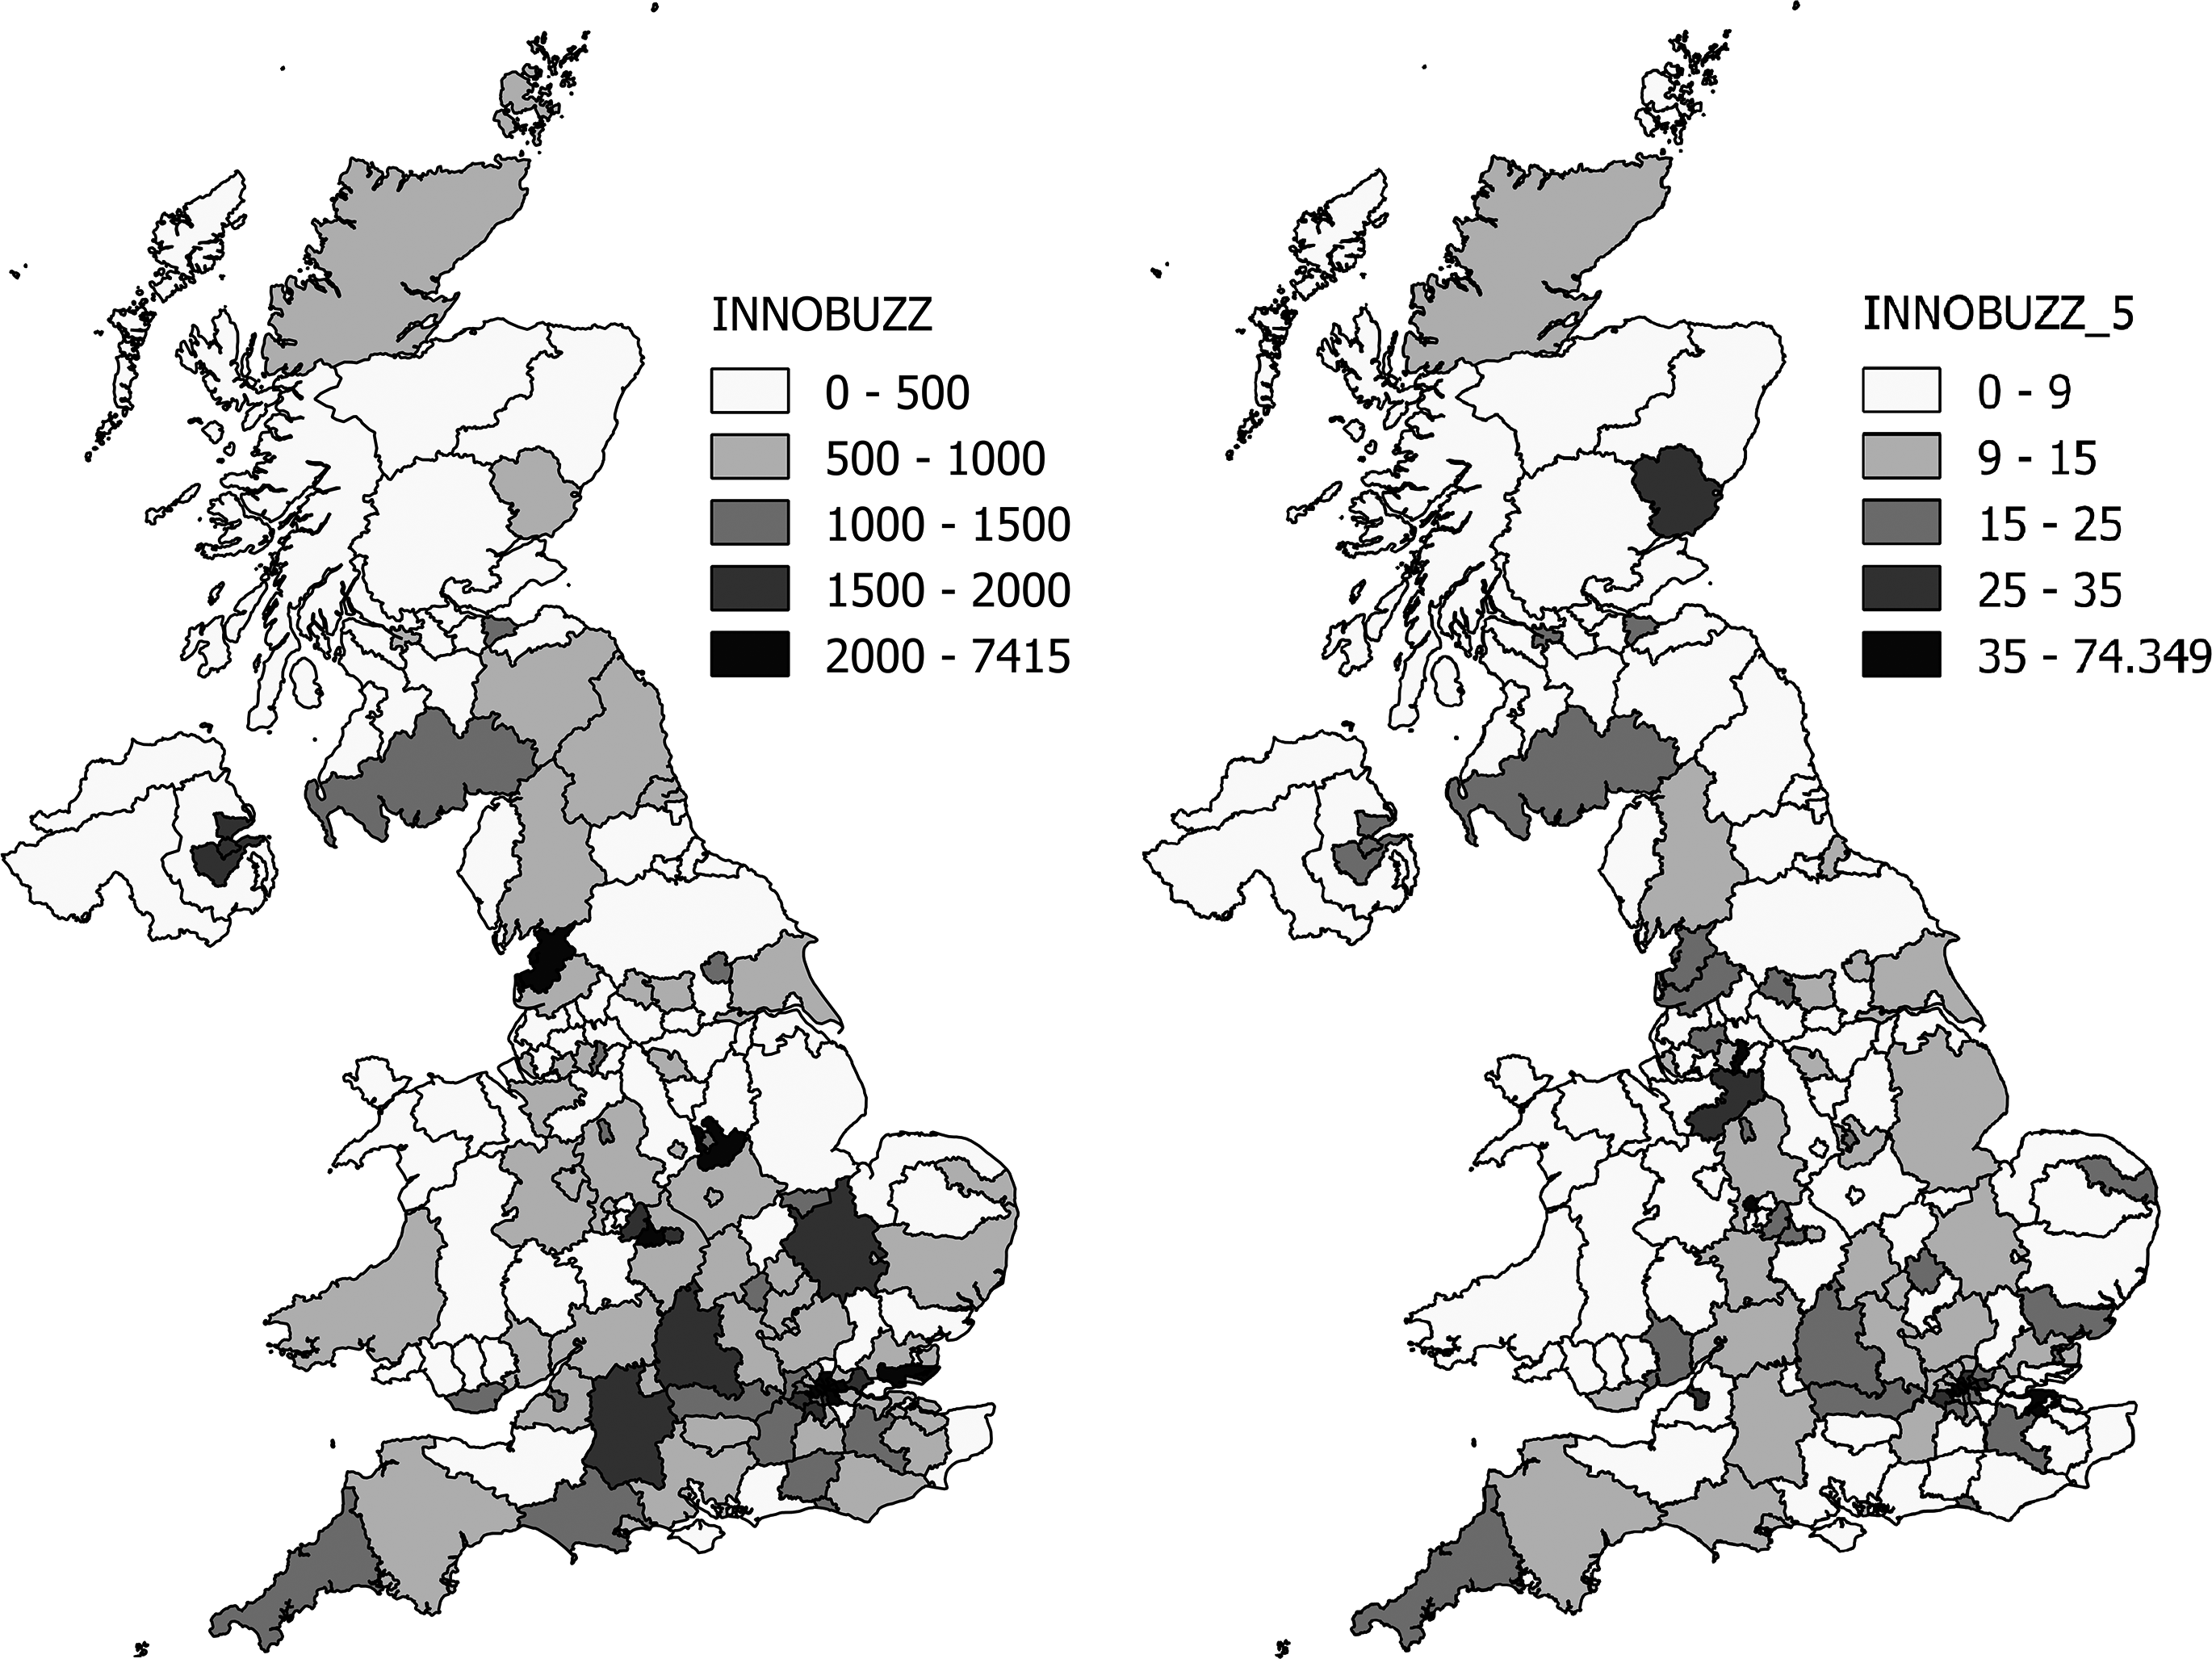
Spatial distribution of INNOBUZZ and INNOBUZZ_5 across NUTS3 regions.
Multivariate analysis
To disentangle the relationship between buzz about innovation and new firm creation from other confounding factors, we move to the results from OLS regression analysis. Estimates with cluster robust standard errors to control for heteroscedasticity are reported in Table 3. 10 In column 1, we include controls for traditional determinants of entrepreneurship reflecting factor conditions, proxied by GDP, knowledge endowments in the form of human capital, and population density to capture proximity effects. Looking at the coefficient for INNOBUZZ, we observe a significant and positive effect on FIRM ENTRY, suggesting an innovative atmosphere may be an important determinant of entrepreneurship, ceteris paribus. In column 2, we also introduce R&D expenditure and the share of people working in creative industries (CREATIVE INDEX) to further control for knowledge creation across regions. Interestingly, we find a negative and significant effect of R&D on entrepreneurship in column 4. A possible interpretation of this finding is that the other variables, in particular GDP but also INNOBUZZ, may already be picking up any variance due to knowledge spillovers in the region so that the residual effect of R&D may effectively reflect the presence of large companies in the area, which has been associated with a negative effect on firm entry in previous literature (Armington and Acs, 2002). Indeed, removing GDP from the model yields a statistically significant and positive effect for our measure of R&D. In contrast, CREATIVE INDEX is not significant in the model. This may reflect the discussion in the literature on the complementary aspects of traditional measures of human capital based on education and creative occupations (Boschma and Fritsch, 2009). However, when we use firm density instead of population density in column 3, the results for CREATIVE_INDEX turn positive and statistically significant in line with previous research, whilst EDUCATION is no longer significant. This likely reflects the higher correlation between these variables and population as opposed to firm density. GDP GROWTH is also significant and positive, in line with previous evidence on the role of demand growth across regional economic systems (Armington and Acs, 2002). Finally, our measure of sectoral dispersion, DIVERSIF, is not statistically significant, reflecting the sensitivity of regional diversity measures as found in previous studies on entrepreneurship (Bishop, 2012; Colombelli and Quatraro, 2018). Even after controlling for these elements, results for INNOBUZZ remain consistent.
OLS regression estimates.
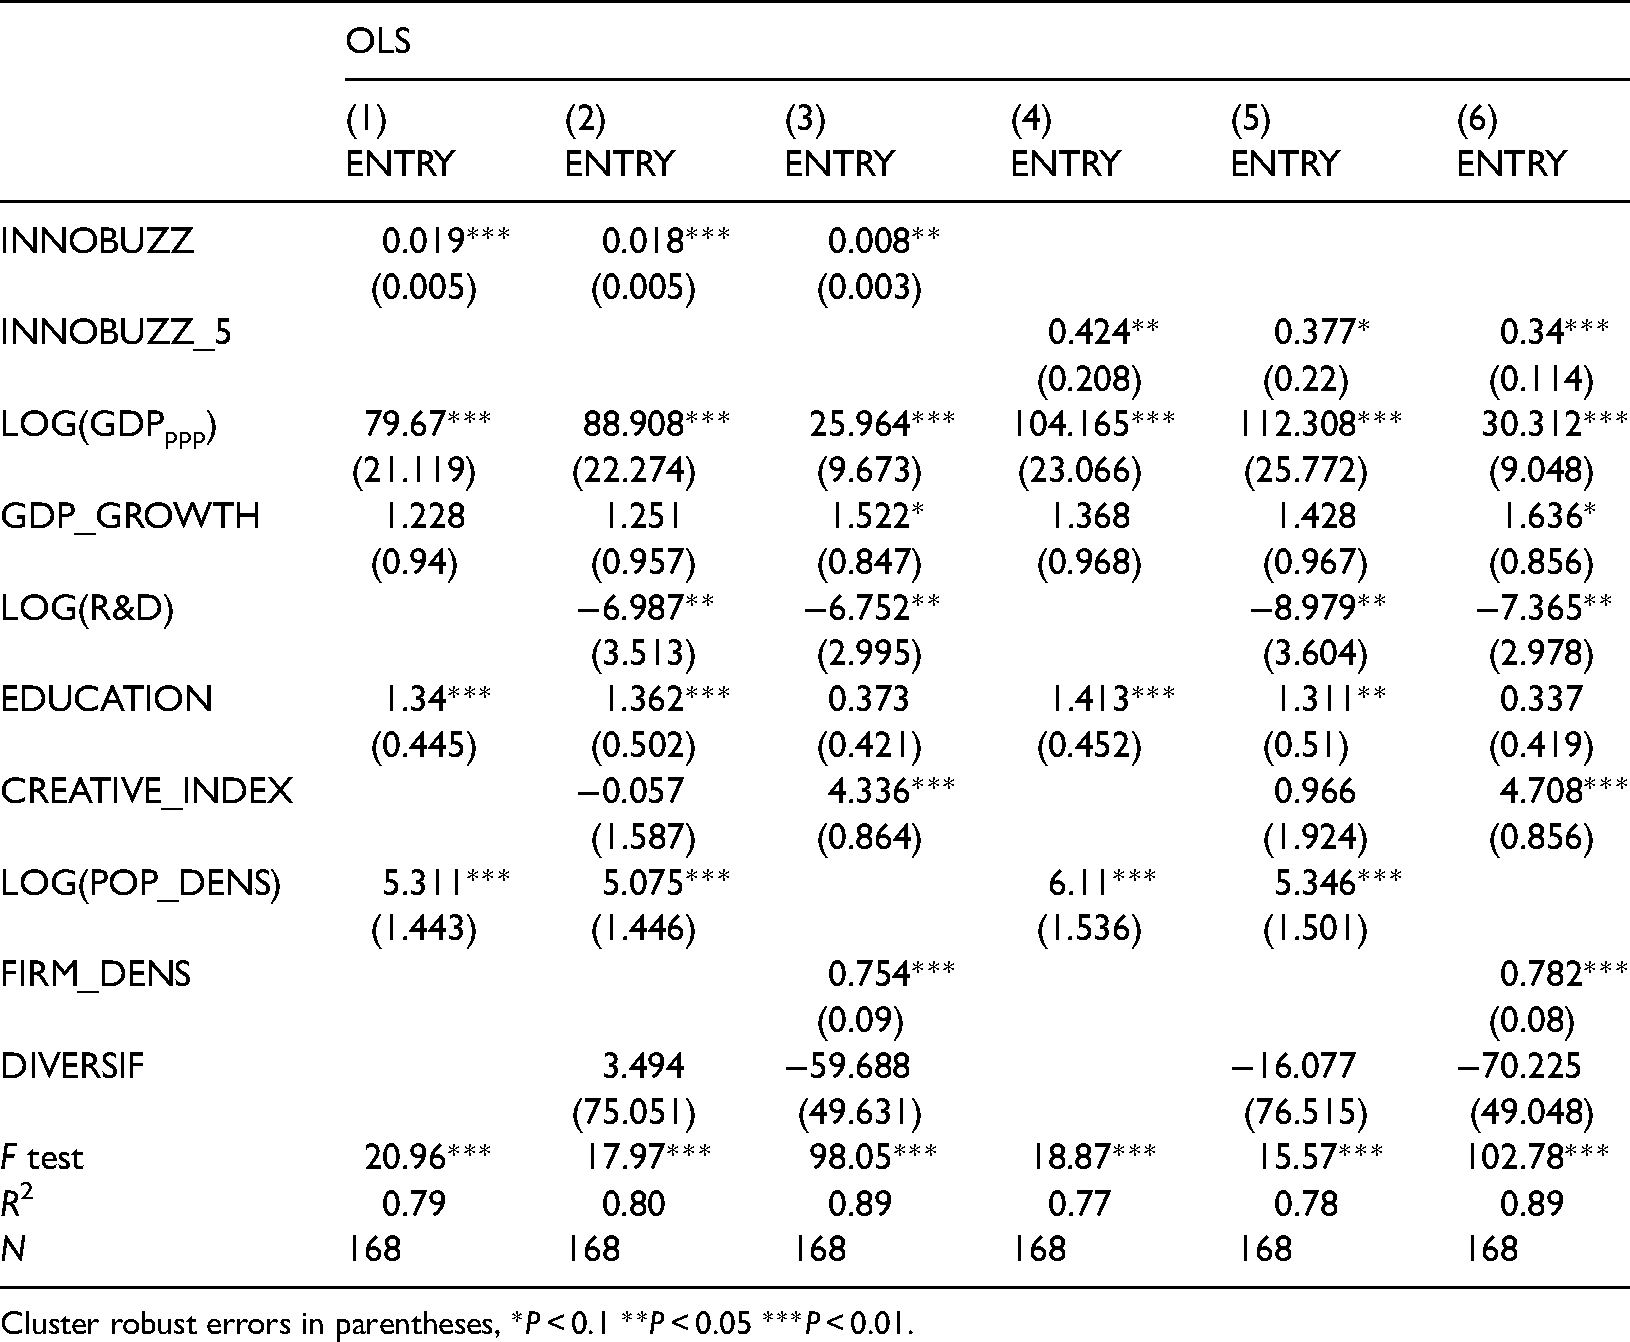
Cluster robust errors in parentheses, *P < 0.1 **P < 0.05 ***P < 0.01.
We report the results based on the alternative measure INNOBUZZ_5 in columns 4 to 6 of Table 3. Following this approach does not alter our findings on the relationship between buzz about innovation and new firm creation. Coefficients for INNOBUZZ_5 are found to be positive and statistically significant, though we note this holds only at the .10 level for the model reported in column 5. We argue this point to a trade-off in the construction of this index. On one side, this measure is less sensitive to the occurrence of specific keywords within the Twitter corpus. At the same time, this implies it captures a broader conceptualisation of buzz about innovation, including aspects that are more connected to other variables for localised knowledge. We find further support for this interpretation exploring INNOBUZZ across different threshold levels of word similarity. We report in Table 4 estimates for INNOBUZZ, alongside coefficients based on a 0.6, 0.5, 0.3 threshold as well as including all words in the Twitter corpus. We observe that as the weighted average underlying the index encompasses a greater set of words, the precision of the estimates reduces. 11 Whilst the results remain statistically significant, we note the magnitude of the coefficients and the R2 are also lower.
Estimates across different thresholds for INNOBUZZ.
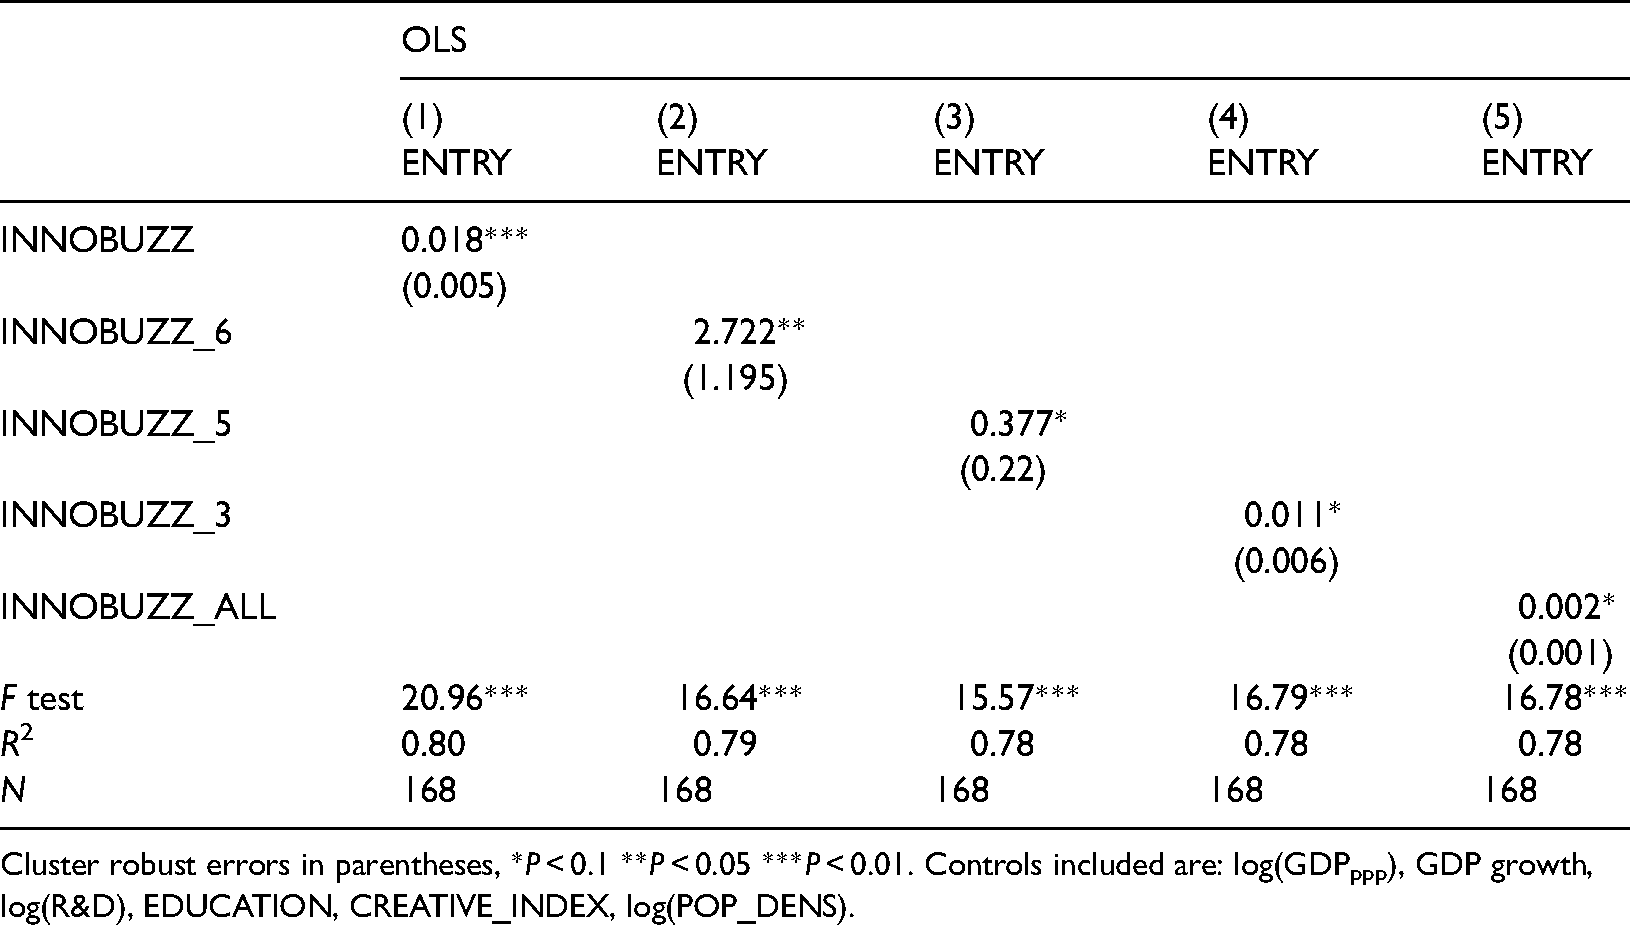
Cluster robust errors in parentheses, *P < 0.1 **P < 0.05 ***P < 0.01. Controls included are: log(GDPppp), GDP growth, log(R&D), EDUCATION, CREATIVE_INDEX, log(POP_DENS).
Overall, these results confirm previous evidence on the knowledge spillover theory of entrepreneurship, pointing to the level of economic development, human capital in its various forms, and the intensity of localised interactions as significant determinants of entrepreneurial processes (Acs et al., 2012; Qian et al., 2013). Yet, even whilst controlling for other traditional determinants of firm entry including creative industries (Boschma and Fritsch, 2009), our measures of buzz about innovation remain consistently significant. We argue that this points to INNOBUZZ reflecting differences in norms, attitudes and propensity to discuss topics related to innovation across places with a similar economic structure. An alternative interpretation could be that this variable is reflecting other aspects of human capital and knowledge creation that are not effectively captured by traditional variables by such as education level, economic development or employment in creative industries. Thus, in this interpretation, INNOBUZZ allows us to look into the functional structure of regions by bringing to the fore the extent of unobserved innovative content in the regional economy.
Robustness analysis
In this section, we complement our main findings considering the heterogeneous nature of entrepreneurial activities across sectors and possible spatial effects for buzz about innovation along with further robustness checks. We start by exploring our model looking at new firms in manufacturing (MANUF) as opposed to service (SERVICE) industries. Results are reported in columns 1 to 4 in Table 5. We note that the results for manufacturing sectors are not significant. Here, we also point out a negative coefficient for density, suggesting these industries may not be connected to proximity effects of buzz. Thus, we also look at as well as an alternative classification separating innovative to traditional sectors. Accordingly, we consider firm entry in low knowledge intensive (L_KI) and high knowledge intensive (H_KI) industries 12 in columns 5 to 8. For low knowledge intensive sectors results are significant only when looking at INNOBUZZ, but not for INNOBUZZ_5. Even in this case, the magnitude of the coefficient is much smaller than in the case of knowledge intensive sectors. In line with the literature on knowledge-based entrepreneurial activity (Audretsch and Belitski, 2013; Qian et al., 2013), these findings suggest the atmosphere captured by INNOBUZZ is mostly conducive to new firms in knowledge intensive industries.
Estimates across manufacturing and service, low and high knowledge intensive sectors.
Cluster robust errors in parentheses, *P < 0.1 **P < 0.05 ***P < 0.01.
We also explore potential spatial lags in the effect of buzz. Results are reported in Table 6 for INNOBUZZ as well as INNOBUZZ _5 and INNOBUZZ_ALL. Spatial thresholds are defined at 50 and 100 km from centroids of NUTS3 regions. In line with the literature on knowledge spillovers (Fang, 2020; Jaffe et al., 1993; Sonn and Storper, 2008), we find the presence of spatial spillovers across different measures of INNOBUZZ. However, these are quite localised reflecting insights on the localised nature of buzz in supporting exchange of uncodified knowledge (Storper and Venables, 2004). The size of the effect is much reduced at a 50 km distance, and spatial lags are no longer significant once we move beyond the 50 km threshold.
Estimates with spatial lags across different threshold distances.
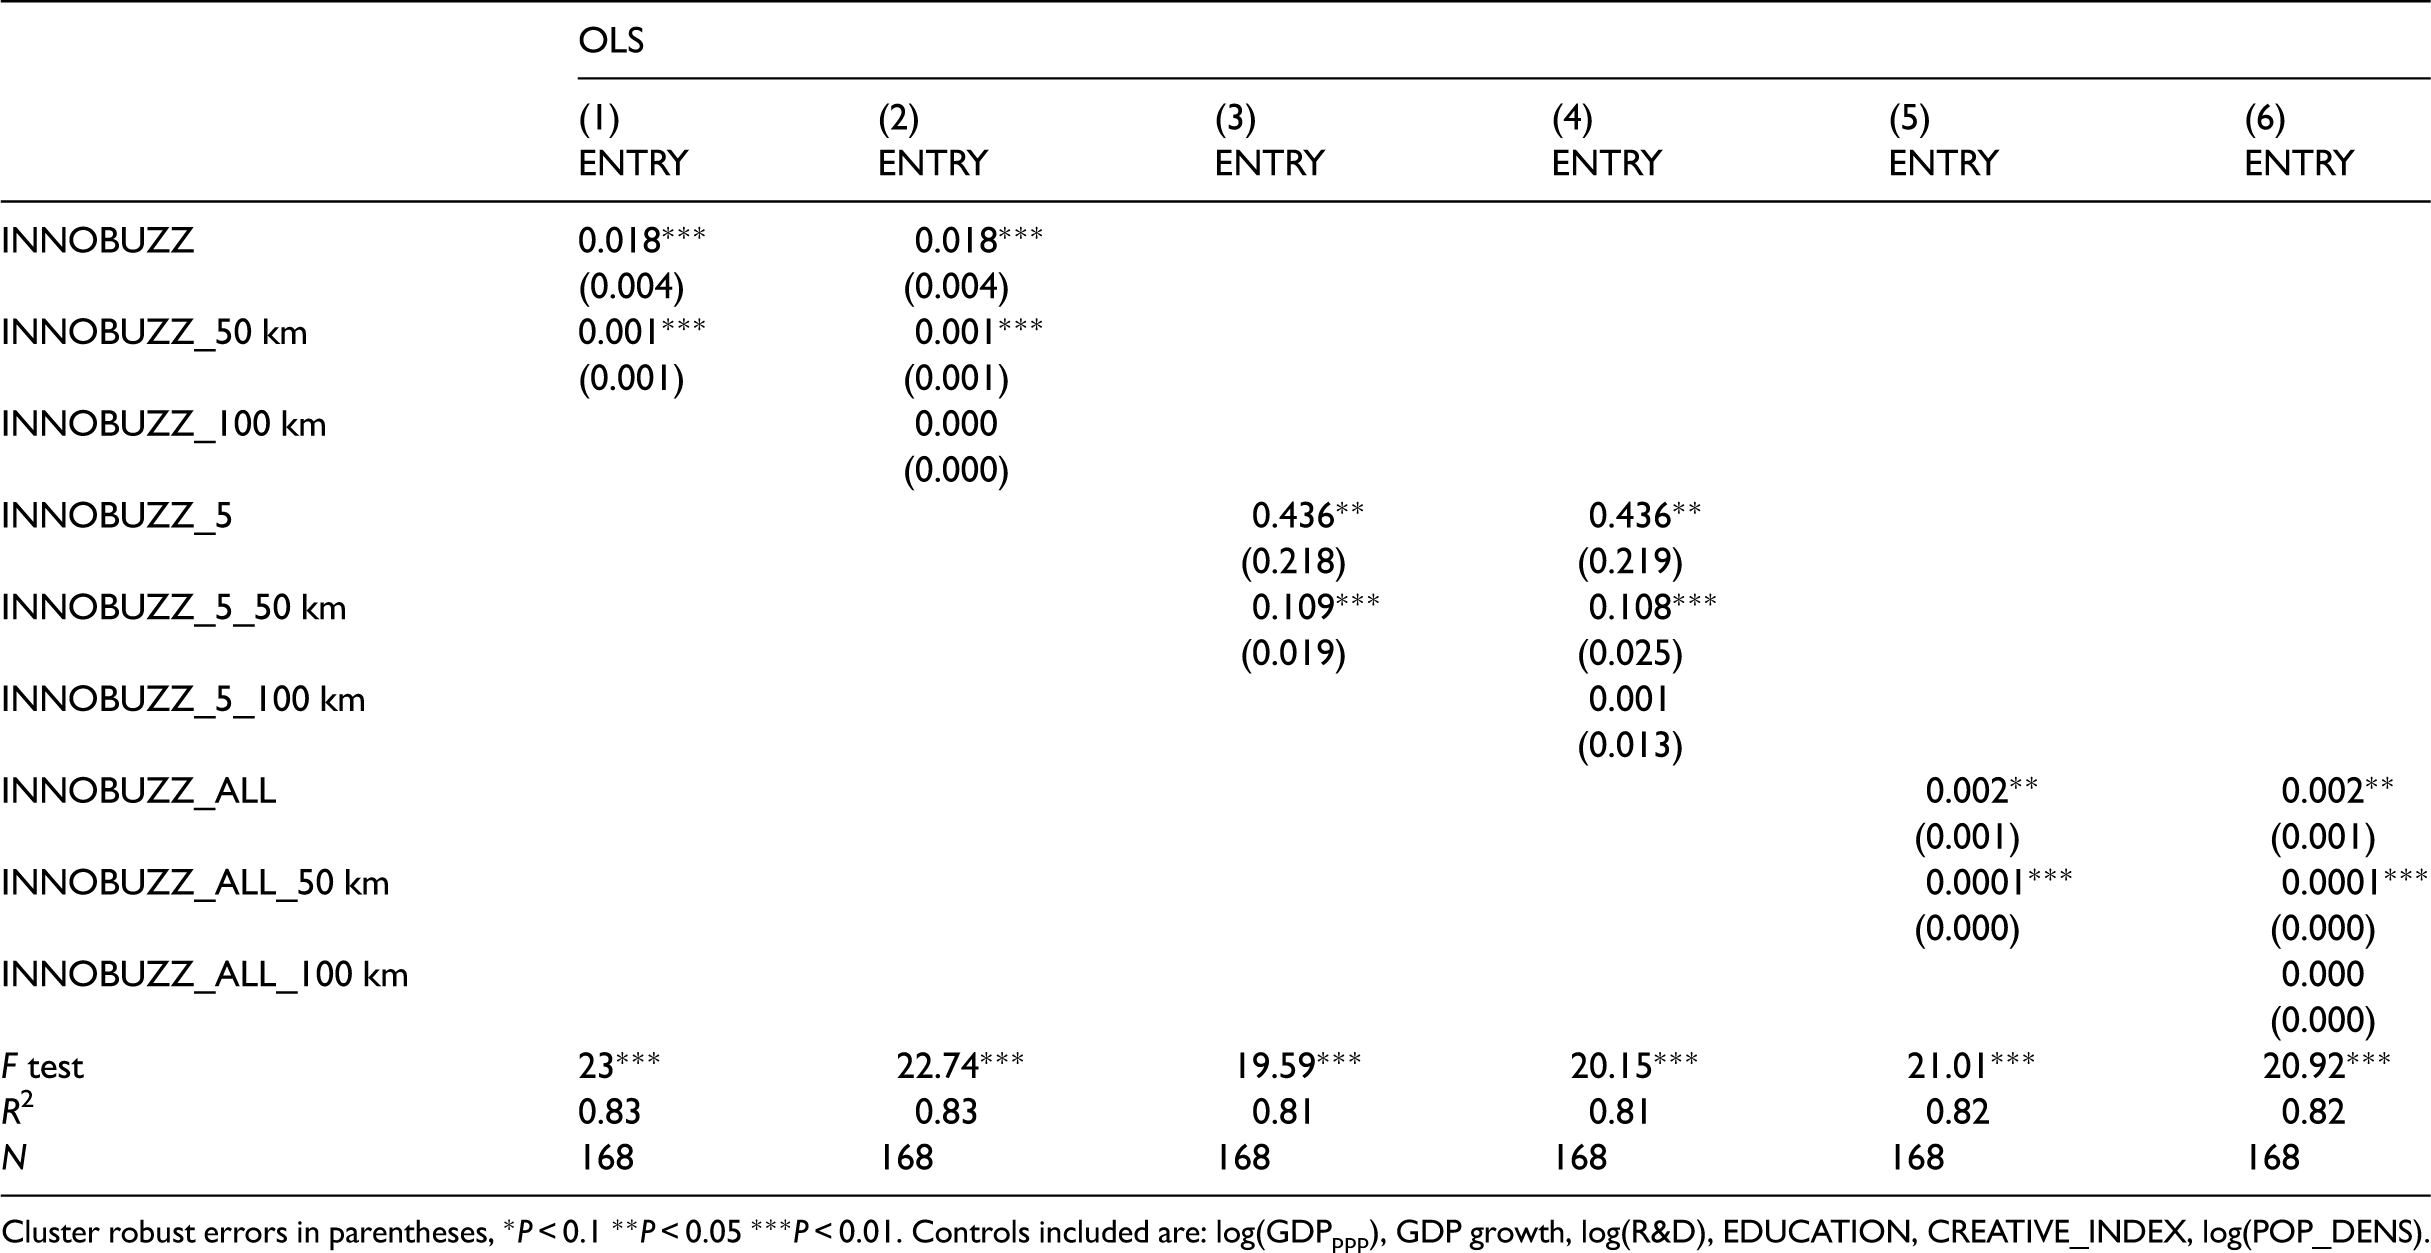
Cluster robust errors in parentheses, *P < 0.1 **P < 0.05 ***P < 0.01. Controls included are: log(GDPppp), GDP growth, log(R&D), EDUCATION, CREATIVE_INDEX, log(POP_DENS).
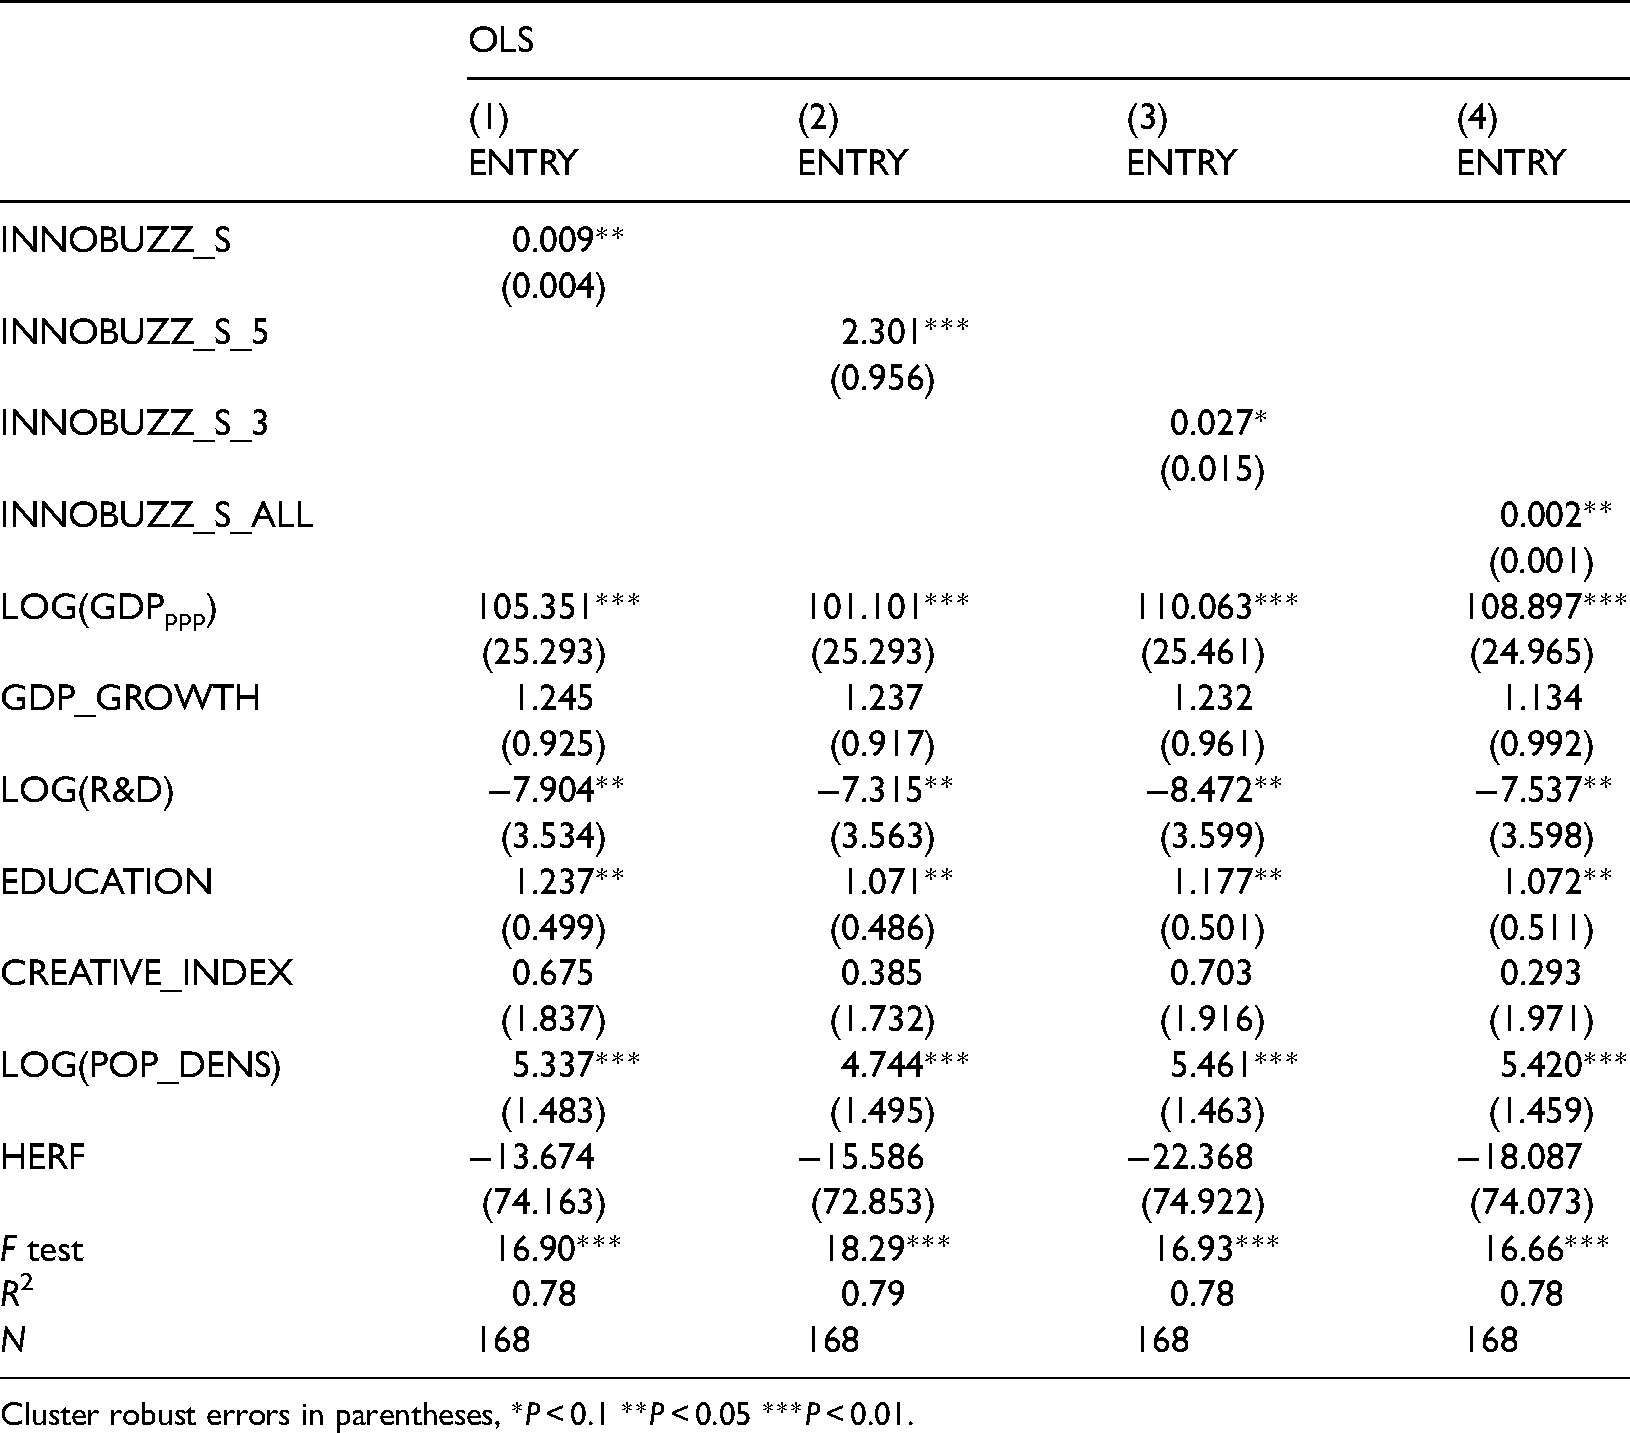
Finally, we performed two further robustness checks. Previous studies have highlighted the relationship between more wealthy and educated demographics and the uneven spatial distribution of content creation (Crampton et al., 2013; Sloan and Morgan, 2015), as reflected in recent studies showing Twitter activity to be a valid proxy for GDP (Indaco, 2020). Thus, it is important to check INNOBUZZ may not be capturing confounding effects due to the volume of Tweets, which may represent a significant determinant of new business creation on its own. By design, our measure of INNOBUZZ is based on the relative frequency of keywords in the Twitter corpus and should not reflect overall Twitter activity. We also control for GDP level and growth in our analysis. However, we further test for this including an additional variable (TWEET_DENSITY), defined as the number of Tweets per population. Results are reported with and without INNOBUZZ and INNOBUZZ_5 variables for models with population and firm density measures in columns 1 to 6 of Table A2 (in the Appendix). TWEET_DENSITY does not yield significant coefficients, which likely reflects the correlation between Twitter volume activity and GDP variables in the model. At the same time, our main results are robust to the inclusion of this control.
Results are also robust to the inclusion of a dummy variable for London, whose significant weight in the UK economy may affect the average values in the sample (Lee and Rodríguez-Pose, 2014). Estimates are reported in columns 7 to 10 of Table A2 in the Appendix. While education and population density variables are no longer significant, reflecting their high correlation with the London region, results for both INNOBUZZ or INNOBUZZ_5 remain consistent in both models with population and firm density measures.
Conclusions
This paper contributes to our understanding of the role that regional context plays in entrepreneurial action offering an exploratory analysis on the opportunities available in big data to listen to the buzz – the vibrancy and knowledge exchange propensity of localised informal communication flows. Renewing theoretical insights indicating buzz encapsulates more than just density of interaction (Asheim et al., 2007; Storper and Venables, 2004), we propose looking at the content of buzz to capture the presence of a localised innovative atmosphere. In particular, we argue the presence of buzz about innovation may comprise an informative dimension conducive to exchange of novel ideas and entrepreneurial opportunities as well as a normative dimension of innovative attitudes and behaviour encouraging entrepreneurial processes.
We provide a novel quantitative measurement of buzz based on local language patterns and natural language processing and test its relationship with entrepreneurship rates using data on 180 million geolocated Tweets across NUTS3 regions in the UK for the year 2014. Controlling for established determinants of firm entry such as economic development, traditional measures of human capital and density, we find that regions which are characterised by higher levels of buzz reflecting an innovative atmosphere – more discussion and vibrancy about topics related to innovation – do have higher levels of entrepreneurship. In line with a knowledge-based view of localisation economies (Fang, 2020; Malmberg and Maskell, 2002), we also find buzz about innovation matters more for encouraging start-ups in high knowledge intensive sectors than in low knowledge intensive sectors and its effect is markedly localised, dissipating beyond the 50 km threshold.
Our research underlines that by listening to the buzz we can deepen our understanding of how co-location of economic actors matters. It is not just their co-presence, but the content of their informal communication that contributes to the emergence of ‘innovative milieus’. Looking at the content of buzz may also reveal a discursive dimension that has consequences for what is ‘in the air’ in localized communities. Similarly, listening to the buzz may allow us to capture normative aspects in the relational infrastructure revealing social norms that define the innovative character of places. By highlighting the role of an innovative atmosphere in the exchange of ideas and knowledge conducive to the diffusion and exploitation of entrepreneurial opportunities, our results could inform the literature on informal institutions within entrepreneurial ecosystems (Audretsch and Belitski, 2013; Qian, 2018; Spigel, 2017). At the same time, this paper advances theories of buzz as intangible infrastructure shaping both knowledge spillovers and social norms by connecting research on creativity and innovative endowments of regions (Boschma and Fritsch, 2009; Florida, 2012; Sleuwaegen and Boiardi, 2014) with economic geography perspectives on the relational dimension of localised learning dynamics (Bathelt et al., 2004; Gertler, 2003; Storper and Venables, 2004).
Our results build on previous insights on the potential in using big data from social media for spatial analysis (Graham and Zook, 2011; Indaco, 2020; Tranos, 2020; Wang et al., 2017). In particular, by providing a novel approach based on text analysis of geo-located tweets to capture the content of buzz, the paper points to opportunities in merging big data, applied linguistics and natural language processing methods in economic geography as well as entrepreneurship research (Corradini, 2021; Obschonka et al., 2020). We note this interdisciplinary approach may be especially valuable for exploring informal and intangible aspects of localised regional structures. This may be also useful for innovation policy, as such elements have been difficult to capture with traditional and survey data.
At the same time, the results presented must be interpreted considering various limitations of this study. Similarly to recent papers exploring big data from social media (Casadei and Lee, 2020; Obschonka et al., 2020), the lack of longitudinal Twitter data does not allow us to control for potential unobserved heterogeneity across regions or shed light on the dynamics of buzz. Thus, while our results indicate regions characterised by a stronger buzz about innovation - as reflected by language patterns in social media – also show higher entrepreneurship rates, we cannot address causality in their relationship. This is a critical element that requires further investigation. Indeed, our contribution is explorative in nature and several questions remain open. Potential routes for future research could include using big data to capture more nuanced insights on the specific mechanisms within buzz, disentangling its role as knowledge exchange infrastructure from the effects of localised descriptive norms. Also, our analysis would benefit from complementary perspectives exploring the evolution and trends of topics and discussions across different time spans and lower levels of spatial aggregation (Bathelt and Henn, 2014; Crampton et al., 2013). Future studies may also investigate linkages and potential synergies between the content of local buzz defined within spatially embedded communities and virtual buzz across digitally mediated interactions (Tranos, 2020; Wang et al., 2017). Finally, while our approach allows to consider all the information within the word corpus available, it relies on prior selection of keywords for the analysis. Further research may investigate alternative methods from natural language processing such as unsupervised learning algorithms and recent advances in topic modelling. More broadly, we point to significant opportunities from applied linguistics and big data analytics for the development of novel indicators to track tangible and intangible dimensions in the geography of innovation. This could allow to understand their evolution and design more comprehensive policies to stimulate their development.
Footnotes
Acknowledgments
The statistical data used here is from the Office of National Statistics (ONS) and is Crown copyright and reproduced with the permission of the controller of HMSO and Queens Printer for Scotland. The use of the ONS statistical data in this work does not imply the endorsement of the ONS in relation to the interpretation or analysis of the statistical data. The analysis upon which this paper is based uses research datasets which may not exactly reproduce National Statistics aggregates.
Declaration of conflicting interests
The authors declared no potential conflicts of interest with respect to the research, authorship and/or publication of this article.
Funding
The author(s) disclosed receipt of the following financial support for the research, authorship and/or publication of this article: This research was funded by the British Academy/Leverhulme Trust under the Small Research Grants scheme (SG171674). Dr Corradini also acknowledges funding by a Leverhulme Trust research fellowship (RF-2020–505\7).