
Abstract
Over the last decade, the local government finance system in England has experienced ‘genuinely revolutionary change’: overall revenues have declined and councils are now more reliant on locally raised taxes. Importantly, the nature of change has varied geographically: urban councils serving poorer communities have experienced the biggest declines in their service spending. This paper considers the impact of these spatially uneven changes on the voluntary sector. We follow through time charities known to be in receipt of local government funding at the time of peak council budgets in 2009–2010 and describe trends in the income of these charities until 2016–2017. We show that, just as the pattern of change in local government financing has been spatially uneven, so the trend in charities’ income has varied geographically. Indeed the spatially regressive nature of recent change in charities’ income is remarkable: while the median charity in the least deprived decile of the local authority distribution experienced little change in their income, the median charity in the most deprived decile experienced a 20% decline. The results provide the strongest evidence to date that, in countries with a history of partnership between government and the voluntary sector, voluntary organisations in more deprived areas are particularly vulnerable to sizeable reductions in the level of local government spending. Indeed, by illustrating for the first time the sizeable reductions in the income of charities in disadvantaged communities, the results demonstrate an important mechanism through which ‘austerity urbanism’ becomes salient in the lives of individuals in deprived areas.
Introduction: The geographical nature of ‘revolutionary’ changes in local government financing
Over the last decade, the local government 1 finance system in England has been experiencing ‘genuinely revolutionary change’ (Amin-Smith et al., 2016: 1). In the post-second world war period local government services have been funded by a mixture of central government grants and local tax revenues. Importantly, before recent changes, this system was highly centralised: from 1948 central government grants sought to adjust for differences between local authorities in the ability to raise local tax revenues; from 1958 these grants sought to adjust for differences between local authorities in social need; from 1990 the revenue from local business rates was redistributed nationally according to spending need (Hendry, 1998). The underlying principle was to ensure a certain common level of service provision across local government irrespective of the nature of the local tax base or of the extent of social need. However since 2010, the trend towards centralisation has been reversed. Most significantly there have been sizeable cuts to central government grants to local authorities: between 2009–2010 and 2016–2017 grant funding declined by 70.5% in real terms (Amin-Smith et al., 2016). Meanwhile, under the Business Rates Retention Scheme, local councils now keep up to 50% of the business rates raised from new developments. Therefore, compared to a decade ago, councils are now much more reliant on locally raised revenues. The principle underlying this shift has been to provide financial incentives for local authorities to grow their own local tax bases. The shift has taken place within the context of an overall decline in revenue: measured on a consistent basis, councils saw an average real terms revenue cut of almost 26% between 2009–2010 and 2016–2017 (Amin-Smith et al., 2016).
Importantly, the impact of these unprecedented changes in local government financing has varied geographically. This reflects differences in the initial share of council revenues accounted by central government grants at the time of peak council budgets in 2009–2010 (see Figure 1). While in affluent local authorities (like Surrey, Windsor and Maidenhead and Wokingham), central grant funding represented less than a third of council revenue, in more deprived local authorities (including many urban areas in the North and Midlands and most London boroughs) central government funding accounted for more than 70% of revenue (Amin-Smith et al., 2016). As Harris et al. (2019) report, decisions about cuts in central government grants after 2009–2010 did not fully account for these differences in the extent to which local councils relied on such funding 2 . Therefore, councils that were more reliant on central grants have seen a larger cut in their spending power than other local authorities (see Figure 2). Indeed councils that were among the top decile of grant-reliant local authorities saw an average cut in their service spending of 33% between 2009–2010 and 2016–2017, while those in the bottom decile saw a much smaller average cut of 9%. These spending cuts have been urban in character: councils that were more grant reliant tended to be deprived urban areas, such that urban councils serving poorer communities have experienced the biggest spending declines 3 . Indeed the average cut in service spending in London boroughs and in metropolitan district councils – which both serve large urban areas – has been around 30%, compared to a less sizeable average decline of 15% in county councils. Importantly, there are clear and sizeable spatial gradients in the nature of change according to the level of local authority deprivation: council service spending cuts in the most deprived decile of local authorities have averaged 31%, compared to 16% in the least deprived decile (Harris et al., 2019).
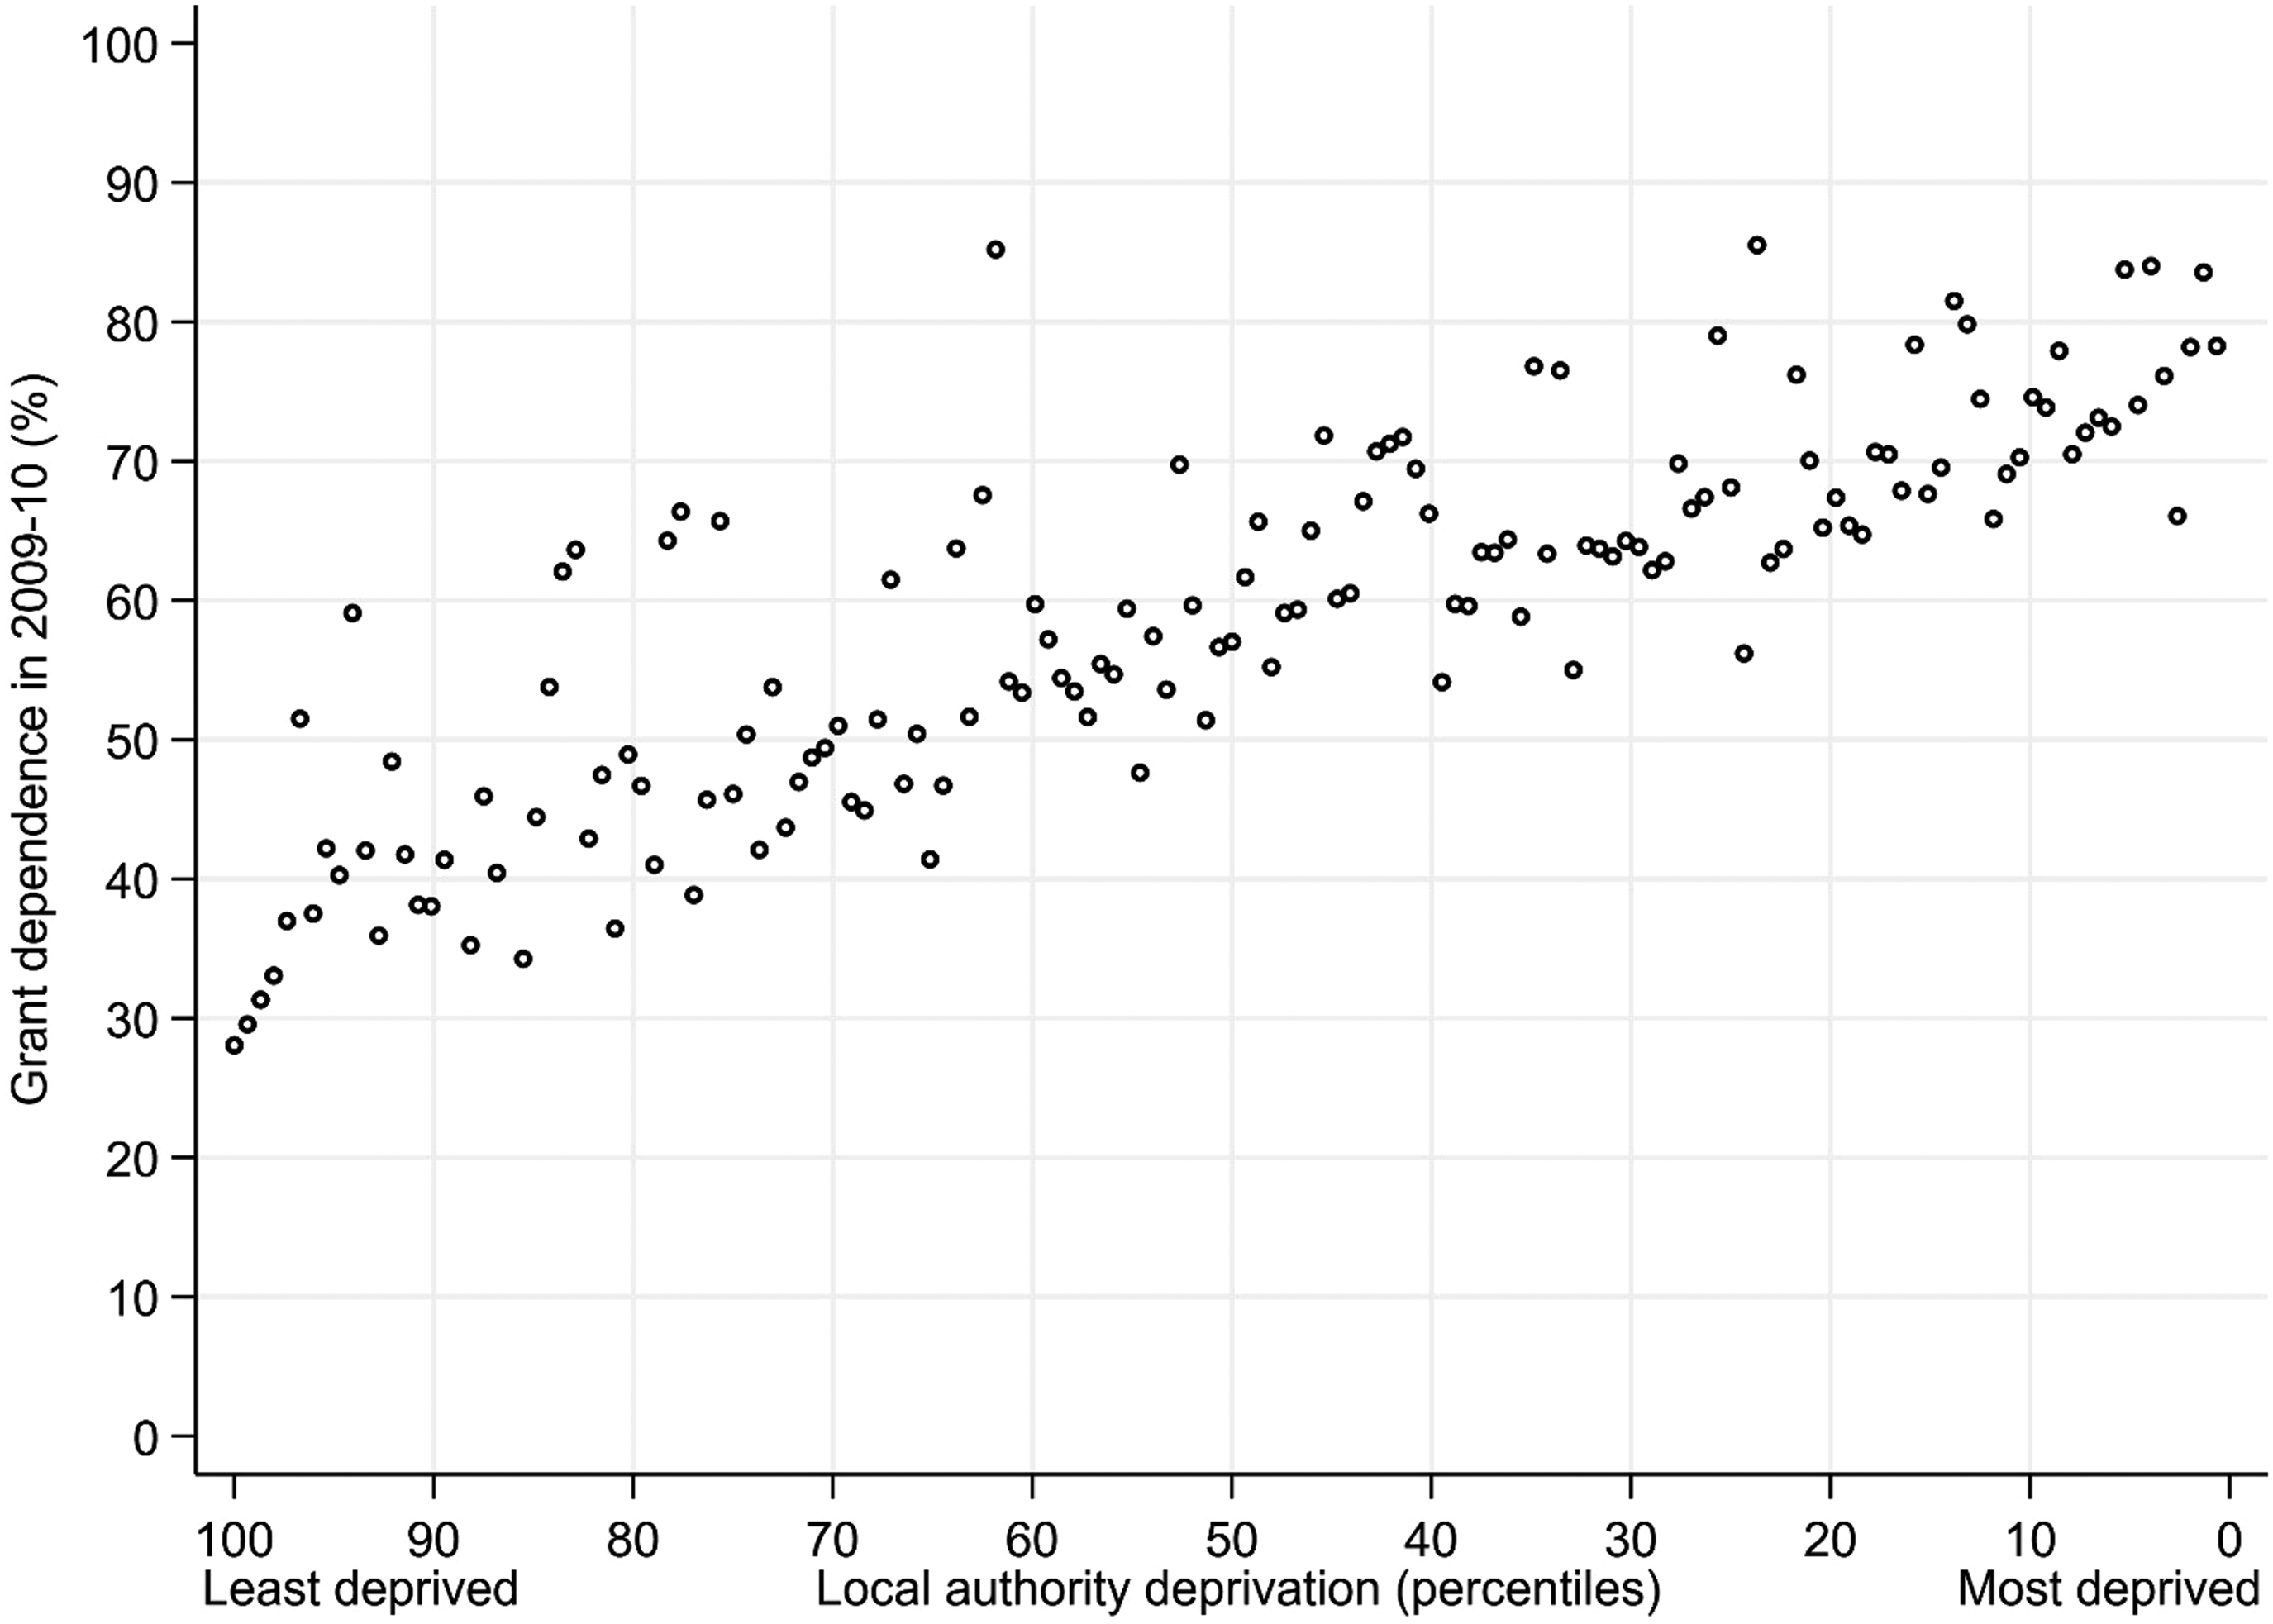
Grant dependence in 2009–2010 by local authority deprivation.
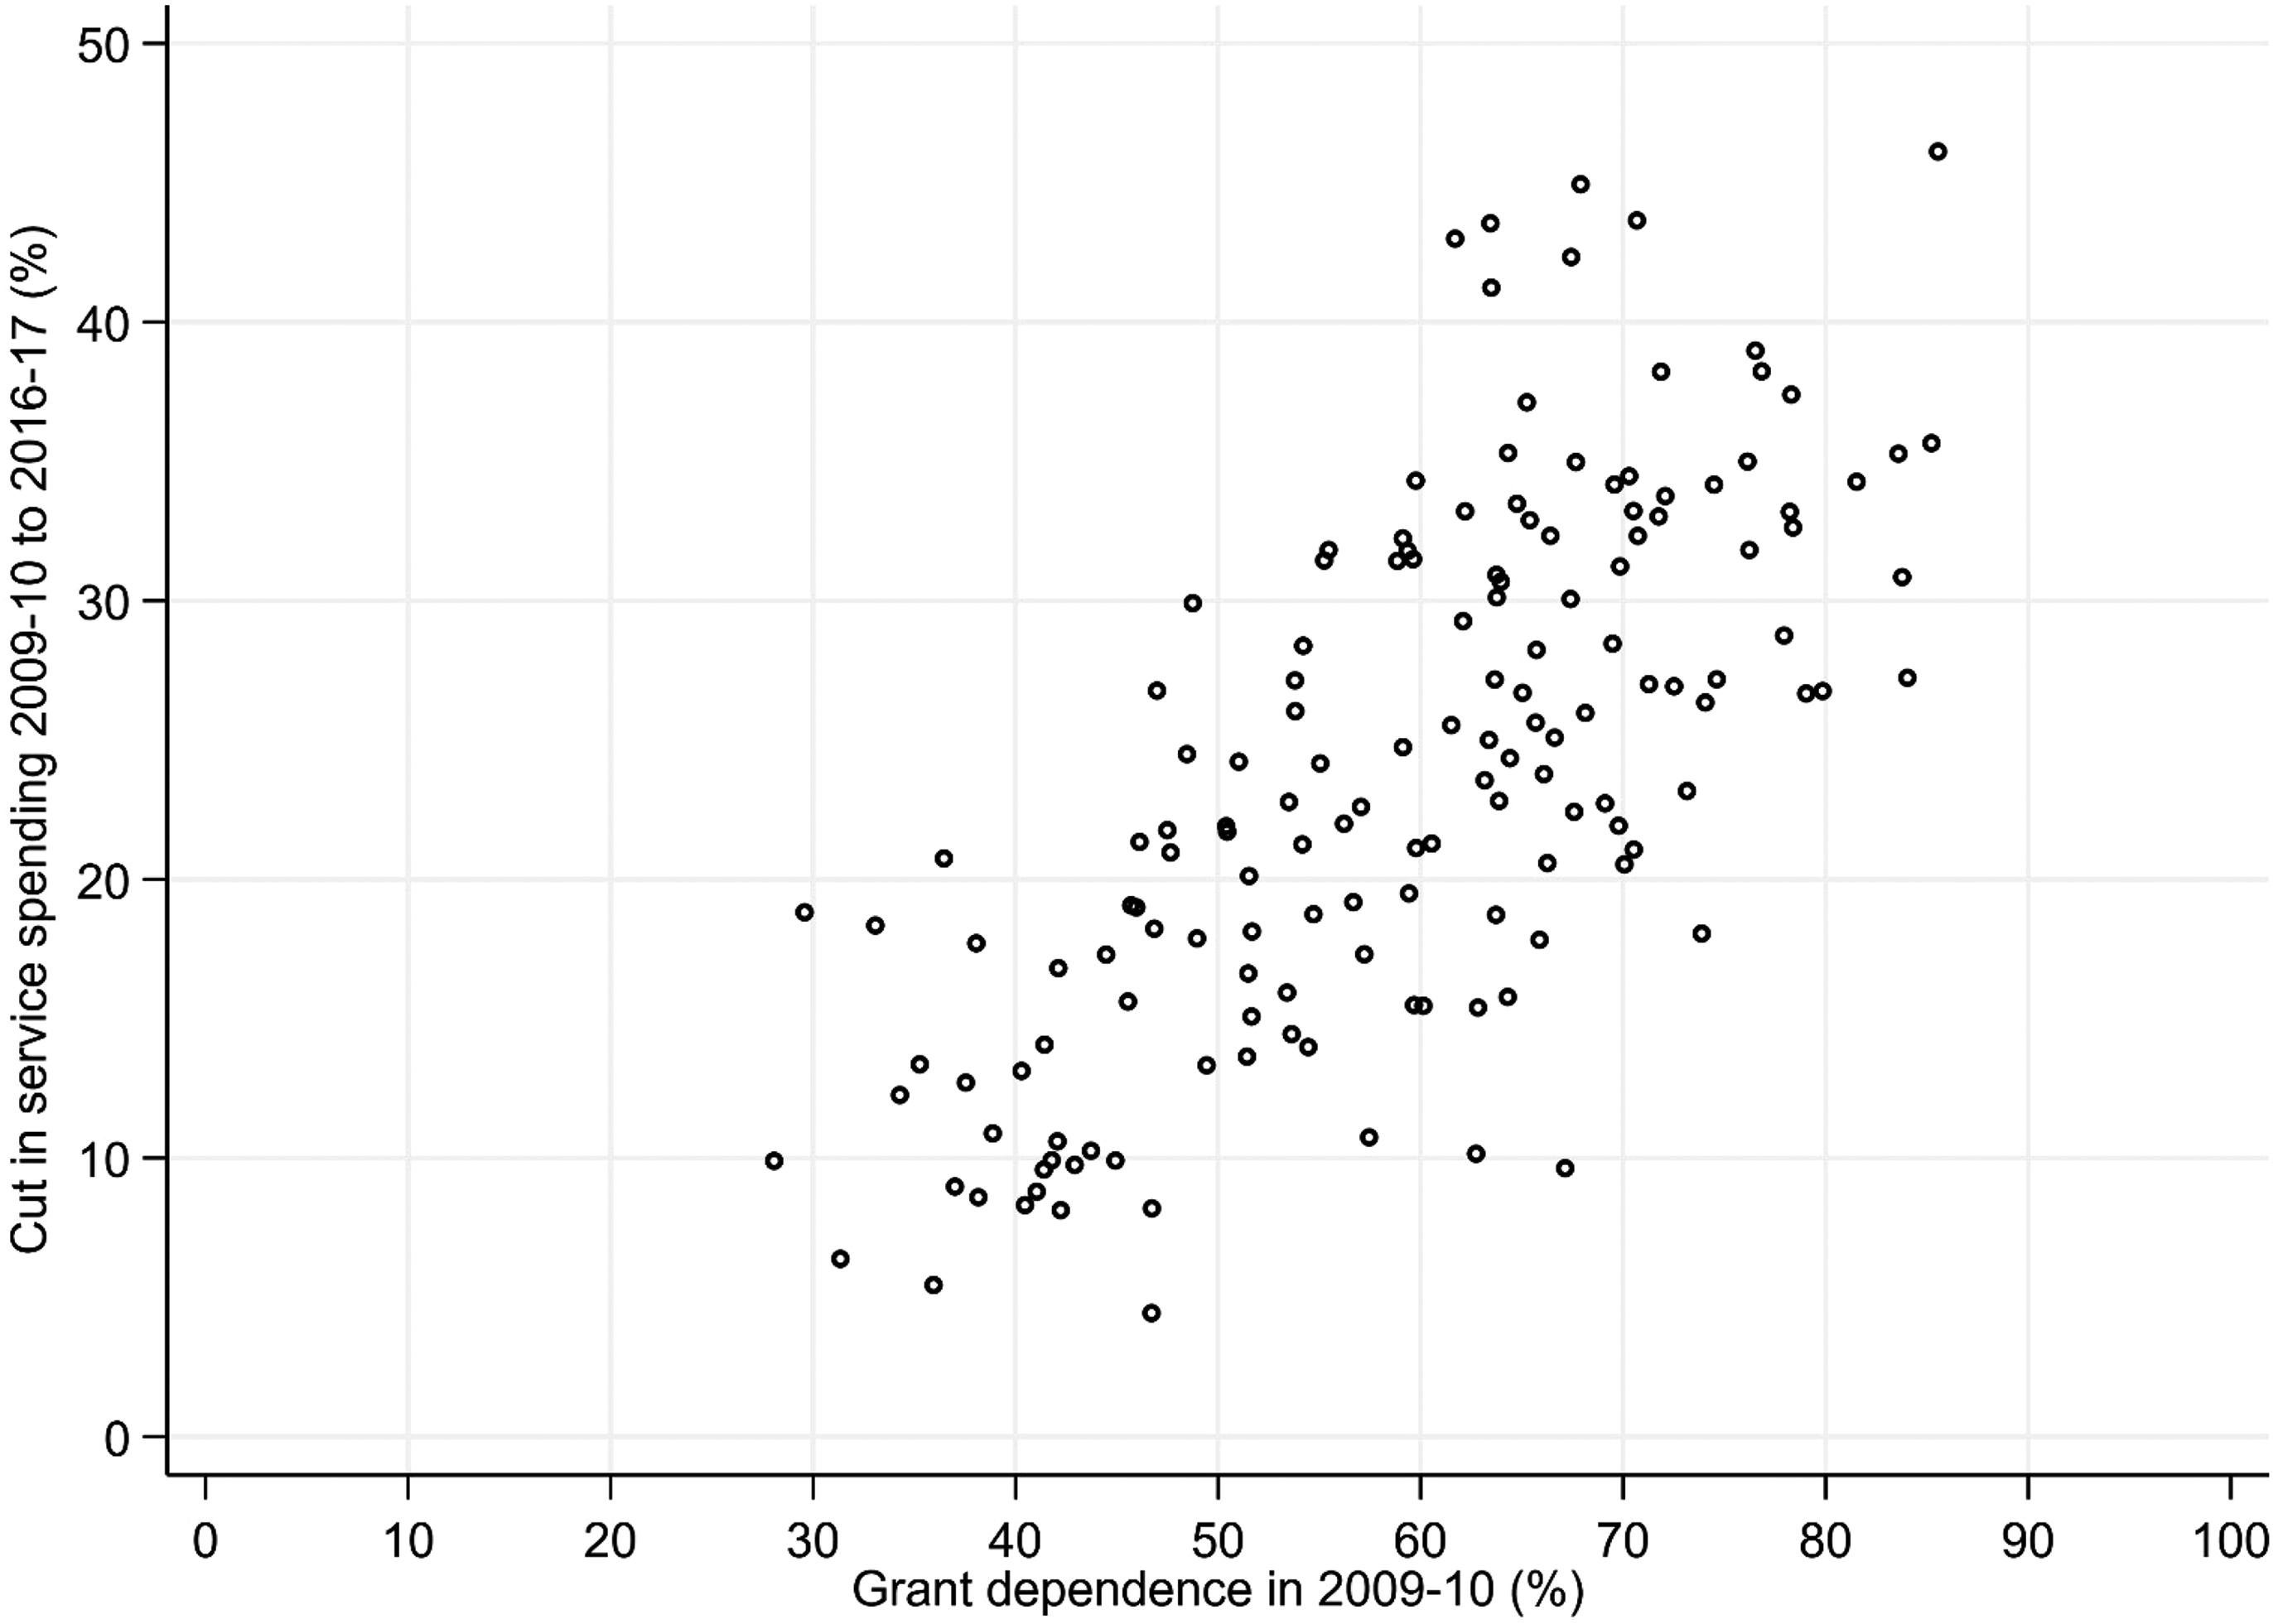
Cuts in local authority total service spending 2009–2010 to 2016–2017 by grant dependence in 2009–2010.
Overall these shifts represent a ‘revolution’ and the ‘biggest set of changes’ in local government financing since the immediate post-second world war period (Amin-Smith et al., 2016: 7, 47). An important body of research documents the nature of the changes and describes the way in which local authorities have responded (Amin-Smith and Phillips, 2019; Bailey et al., 2015; Fitzgerald and Lupton, 2015; Hastings et al., 2017). In particular, the ‘austerity urbanism’ thesis articulates how, as in the United States (Peck, 2012, 2014), recent local government spending changes in England have disproportionately impacted poorer urban areas. However, there is a pressing need to consider the wider social and economic implications of these changes beyond local government. In particular, given the spatially uneven nature of change in the level of local authorities’ service spending, there is a pressing need to consider how the implications of the ‘revolutionary’ changes in local authority financing vary geographically.
This paper – for the first time – considers the spatially uneven impact on the voluntary sector. Indeed there is a particular substantive basis for expecting the unprecedented changes in local government finance to have had a significant impact on the income of voluntary organisations, given that local government is the most important source of public funding for the voluntary sector (Rees, 2014). However – thus far – no studies have been able to examine this issue empirically. This is a serious omission given the extent of concern expressed by voluntary organisations about emerging shortfalls in their funding from local government in recent years (Kendall et al., 2018; Mohan et al., 2018). It is also a particularly serious omission given Hastings et al. (2017)'s emphasis on the importance of considering the mechanisms through which ‘austerity urbanism’ becomes ‘downloaded’ to the poor. Indeed a reduction in the capacity of the local voluntary sector, as manifest in a sizeable reduction in charities’ incomes, may be an important and as yet undocumented means through which ‘austerity urbanism’ becomes salient in the lives of individuals in deprived urban areas.
Empirical context: The role of charities in England
In this paper, we consider voluntary organisations registered as charities in England. Charitable status is the primary legal framework for voluntary activity in the United Kingdom. Under the structural/operational definition of the voluntary sector, charities are formal organisations which are non-profit distributing, constitutionally independent of the state, self-governing and which benefit from voluntarism (Salamon and Anheier, 1992). Therefore, their role in the provision of welfare is distinguished from the role of the state by its private nature, from the role of the market by its non-profit orientation, and from the role of households by its formality (Evers, 1995). Charitable status is also underpinned by the specific criterion of ‘public benefit’ – that an organization should ‘benefit the public in general or a significant section of the public’.
Charitable organisations in England play an important role in the ‘mixed economy of welfare’ through their involvement in a diverse range of activities conducive to the welfare and wellbeing of individuals. Billis and Glennerster’s (1998) theory of comparative advantage helps to explain the distinctive role of charities in the provision of human services. Compared to the median voter and shareholder interests of the public and private sectors, charitable organisations are characterised by stakeholder ambiguity – where there is a less clear-cut differentiation between employer and employee, provider and recipient, management committee and staff. Importantly, this can lead to a reduced gap between users and those in authority and can also enhance the potential for ‘greater motivation, sensitivity to and knowledge about client need’ (Billis and Glennerster, 1998: 91). Billis and Glennerster argue that this gives charitable organisations a comparative advantage compared with other sectors when providing services for certain disadvantaged groups: the ‘personally disadvantaged’ (those who require others to act on their behalf since they are not able coherently to articulate their preferences); the ‘societally disadvantaged’ (stigmatised individuals and groups); and those suffering from ‘community disadvantage’ (since they live in areas ‘where the market, political and civil structures have broken down’ (p. 88)). This underscores the important role of English charities in, for example, the provision of social services for children and families, for the elderly, for people with disabilities, people with learning difficulties and for ethnic minorities; in the provision of legal services offering advice and advocacy for vulnerable groups and citizens; in the promotion of economic, social and community development, including through community centres and associations; in the provision of shelter and housing assistance for those with low incomes or age-related needs; and in the provision of education, including for those with particular educational needs. Alongside their role in the provision of services, in advocacy and in community building, charities also have an ‘expressive’ function, reflected in the prominent role of charities in culture and the arts (Kendall, 2003).
The role of charities in England in the ‘mixed economy of welfare’ has evolved over time (Alcock, 2016). First, in the 19th century when state welfare provision was limited, their role can be characterised as direct providers of services to fill the gaps created by state and market ‘failure’. Second, in the early 20th century as state welfare provision expanded, charities played a complementary role to these new state providers. Third, as more comprehensive state welfare provision emerged from the 1940s onwards, charities played a supplementary role to state provision. Finally, recent decades have seen an important trend towards partnership between government and the charitable sector in the United Kingdom (Deakin, 2001), as government increasingly becomes the purchaser rather than the provider of public services (Lewis, 1993). Indeed, under the 1990 National Health and Community Care Act, local authorities in the United Kingdom increasingly became purchasers of services from independent private or charitable organisations rather than directly providing services themselves. This shift in social policy has seen significant increases in government funding of charitable organisations (Rees, 2014): by 2009–2010 total government funding to the charitable sector was £13.9bn, a real term increase of 61% from 2000 to 2001, with local government funding of £7.0bn representing the majority of this total (Clark et al., 2012; Jones et al., 2016). Importantly, this increase in public funding in England has taken place across a variety of different ‘vertical fields’ of charitable activity (Kendall, 2003).
This increase in the public funding of the charitable sector in England is distinctive internationally. Indeed, as Kendall (2003: 216) argues, ‘the overall situation [in England] is unique internationally to the extent that it involved, especially from the 1990s onwards, a new order of financial dependence on the state’. While the voluntary sector in other countries, particularly in Europe, receives significant public sector funding, this represents continuity with long established financial settlements. In contrast, ‘all the evidence points to the extent to which the [English] voluntary sector has undergone exceptionally rapid economic change by … international standards’ (Kendall, 2003: 39). Therefore, the English charitable sector is hard to classify as similar to other country contexts. On the one hand, Salamon and Anheier (1998) identify the United Kingdom alongside the United States as an example of a ‘liberal’ non-profit regime characterised by relatively low government social welfare spending and a relatively large voluntary sector – in contrast to a ‘social democratic’ regime characterised by extensive government welfare provision and a relatively limited service providing voluntary sector, a ‘corporatist’ regime characterised by sizeable government welfare spending and a sizeable voluntary sector, and a ‘statist’ regime characterised by limited government welfare spending and a relatively small voluntary sector. On the other hand, the importance of public funding to the voluntary sector in England provides similarity to the ‘corporatist’ regime represented by continental countries including Germany and the Netherlands. Overall the role of charities in England is distinctive, sharing some similarities with the United States and some with countries in Europe (Kendall, 2003). Importantly, one implication of the distinctive increase in partnership between government and the charitable sector over recent decades in England, which has seen an increased role for charitable organisations in service delivery and associated significant increases in government funding, is the subsequent vulnerability of charitable organisations to precipitous changes in the level and organisation of public spending (Smith and Lipsky, 1993; Wilding, 2010).
Substantive focus: The spatially uneven impact on the voluntary sector
We would expect the impact of local government financing changes on the voluntary sector to vary spatially. In particular, for two reasons, we would expect a more significant impact on charitable organisations in more deprived local authorities. First, more deprived local authorities were more dependent on central government grants (Figure 1) and therefore, as central grants declined after 2010 leaving local authorities more dependent on locally raised revenue, have seen more significant changes in their spending power than less deprived local authorities. Therefore, charitable organisations in more deprived areas are likely to have been exposed to a particularly challenging environment for obtaining income through grants or contracts from their local authority. Indeed in a case study comparing two local authorities in England, Jones et al. (2016) show that the voluntary sector in Liverpool, where the decline in council revenue spending power was more severe, experienced a more sizeable aggregate cut in its local authority funding than the voluntary sector in Bristol, where the decline in council revenue spending was still significant but less severe.
Second, in more deprived local authorities charitable organisations tend to be more dependent on statutory funding. Salamon’s (1987) theory of ‘voluntary sector failure’ provides a theoretical basis for this increased dependence. According to Salamon, one of the weaknesses of the voluntary sector is ‘the inability to generate resources on a scale that is both adequate and reliable enough to cope with the human services problems of an advanced industrial society’ (p. 39). Importantly, this ‘philanthropic insufficiency’ is particularly evident in certain geographical areas ‘since the resources are frequently not available where the problems are most severe’ (p. 40). In particular, opportunities for charitable organisations to benefit from private income, including fees and voluntary donations from individuals, may be more limited in more deprived areas. Indeed ‘serious gaps’ in coverage may emerge because ‘private charitable resources may or may not be available where the need for them is greatest’ (p. 45). This provides a strong reason for partnership between government and the voluntary sector: where voluntary contributions are inadequate, government funding of voluntary organisations is needed. Therefore, theory provides a rationale for expecting charitable organisations in more deprived local authorities to have a greater dependence on government funding than in less deprived areas. This is indeed what we observe. Clifford et al. (2013), using data for 2008, show that the local authorities with the highest proportion of charitable organisations receiving public funds are deprived urban areas 4 . These include Liverpool, Knowsley, Manchester and Salford in the northwest, Kingston upon Hull and Hartlepool in the northeast, Tower Hamlets and Islington in London, and Nottingham and Luton.
Overall there are dual reinforcing reasons for expecting the effect of changes in local authority financing to be spatially uneven and to have a particular impact on the voluntary sector in more deprived areas: more deprived local authorities were more dependent on central government grants than less deprived local authorities (Figure 1) and have therefore seen more significant changes in their spending power since 2010; charitable organisations in more deprived local authorities have on average been more reliant on public funding than in less deprived local authorities. However, despite this substantive context, up to this point very little research has sought to assess the impact of changes in local government financing on the voluntary sector. Therefore, basic questions remain unanswered in existing empirical work. How have charitable organisations in receipt of local government funding in 2009–2010, at the time of peak council budgets, fared during an era of significant cuts to local authority revenue through to 2016–2017? In particular, given the spatially uneven nature of changes in local authority financing since 2010, how has the average rate of growth or decline in the income of these organisations varied geographically? We have two specific research questions on this geographical theme. First, how has the growth rate of charitable organisations varied according to the level of local authority deprivation? Second, how has the growth rate of charitable organisations varied according to the urban character of the local authority? This paper answers these questions for the first time.
We adopt a distinctive empirical approach. We use longitudinal data to follow through time those charities known to be in receipt of local government funding at the time of peak council budgets in 2009–2010. We describe trends in the income of these charities between 2009–2010 and 2016–2017, the period of most significant and most regressive cuts to central grant council funding, and explore how these trends in charities’ income differ geographically according to the level of deprivation and the type of local authority.
Data and method
Our analysis is based on bringing together two unique datasets. The first is the Register of Charities (RoC), which contains key information on the activity of all registered charities in England and Wales. This administrative data, originally provided through the annual returns that charities are required to file as part of the Charity Commission's regulatory process, includes longitudinal data on charities’ headline annual income. It also includes structured geographical information on each charity's ‘area of operation’ – the local authority (or the overseas country) ‘where the charity does its work or provides its benefit’. The area of operation data includes 152 ‘upper tier’ local authority areas in England. Charities can indicate operation in one or multiple local authorities. Charities whose work is not spatially focused/geographically bounded, or that work across more than ten local authorities, are coded ‘throughout England’.
The second dataset is a Sample of Charity Accounts (SCA), providing key financial information on charitable organisations. Importantly, financial data in the RoC is limited in detail and does not enable us to identify those charities in receipt of funding from local government. Therefore, the SCA is designed to complement the information in the RoC by providing detailed information on the sources of charities’ income. The sample contains information on around 10,000 charities each financial year. The sampling frame is the RoC and the sample is designed to be representative of the population of registered charities in England and Wales. The data are collected from the accounts that charities provide to the Charity Commission alongside their annual return as part of the regulatory process. The SCA data collection involves both the capture and classification of financial information from these accounts such that income can be identified according to income source. Kane et al. (2013) provide further details of the data collection process.
This paper's substantive interest is in assessing the impact on the voluntary sector of the unprecedented changes in local government financing after 2009–2010. However, examining income trends from 2010 onwards for the population of c.160,000 registered charities in England and Wales would provide limited insight into this issue. This is because the charitable sector, which has been described as a ‘loose and baggy monster’ (Kendall and Knapp, 1995), contains a huge variety of different kinds of organisation – from small community groups to large international development NGOs. The majority of charitable organisations have never had any funding from local government, and including the income trends of these organisations in our analysis would preclude an assessment of the specific impact of changes in local government financing on the voluntary sector. The key advantage that the SCA data provides is in facilitating the identification of those charities known to be in receipt of local government funds at the time of peak council budgets in 2009–2010. We can then follow the fortunes of this specific group of charities and explore how the trends in their income differ geographically according to the type of local authority and the level of local authority deprivation.
Therefore, we identify our target population of charities according to the following criteria:
Charities in England. We exclude charities registered in Wales since the measure of local authority deprivation that is available for Wales is not directly comparable to the English measure. Charities that operate in one specific local authority in England. We use the RoC area of operation data to exclude charities that work across a variety of areas – regionally, nationally or internationally. Note that, by focusing specifically on charities operating in one local authority area, we exclude a sizeable number of nationally orientated charities headquartered in London: almost half of charities operating across at least 10 local authority areas are registered in London. In general, locally orientated charities, operating in one local authority area, are similar to the population of charities as a whole in terms of their distribution according to field of charitable activity – though a lower proportion of locally orientated charities are involved in culture and arts, and a higher proportion are involved in economic, social and community development, than the population of charities as a whole. Charities with at least £100,000 in annual income at the start of the analysis period (2009–2010). Therefore, the focus is on mid-sized and larger charities rather than smaller charities. This is to ensure data quality when using the SCA data. Smaller charities with an income of less than £100,000 are less likely to submit detailed charitable accounts. This makes it more challenging to unambiguously identify charities in receipt of local government funding from their accounts. The focus on charities with an income of at least £100,000 is also in keeping with substantive concern about the impact of changes in local authority financing on ‘medium-sized’ charities, seen as most likely to be dependent on grants and contracts from local authorities and therefore especially vulnerable to reductions in local authority funding (Taylor et al., 2012). Charities in receipt of local government funding in 2009–2010.
There are 891 charities in the sample SCA data that fulfil each of these criteria. This sample is representative of the estimated c.4500 charities in our target population: those charities in England operating in one local authority, with at least £100,000 in annual income at the beginning of the analysis period, which were in receipt of local government funding in 2009–2010.
We use information on each charity's local authority area of operation to link to our key geographical covariate of interest: the level of local authority deprivation (DCLG, 2016). The level of local authority deprivation is a summary measure of relative multiple deprivation at the lower super output area (LSOA) level. We use the summary measure based on the population weighted ranks of LSOAs within a local authority. We consider higher tier local authorities since this is the level of data collected in the Charity Commission's annual returns. We use the 2015 version of the local authority deprivation data but our results are robust to whether we use the 2010 or 2019 measures.
We also link information on each charity's local authority area of operation to a covariate indicating the type of local authority (county council/London borough/unitary authority/metropolitan district). The 36 metropolitan districts cover six large urban areas in Greater Manchester, Merseyside, South Yorkshire, Tyne and Wear, the West Midlands, and West Yorkshire. The 32 London boroughs and 55 unitary authorities 5 are also mainly urban in character. In contrast, the county councils include many areas which are significantly or predominantly rural (Defra, 2014).
We examine change in the income of charities over our analysis period 2009–2010 to 2016–2017. The choice of this period is informed by substantive concerns: 2009–2010 is the time of peak council budgets while most of the cuts in local authority spending took place between 2009–2010 and 2016–2017. Since estimators based on organisational-level measures of income change are sensitive to transitory variations in income, we smooth charities’ income over a 3-year period: our measure for income in 2009–2010 is actually an average of annual income in 2008–2009, 2009–2010 and 2010–2011, while our measure for income in 2016–2017 is an average of annual income in 2015–2016, 2016–2017 and 2017–2018. Therefore, we present trends for 2009–2010 to 2016–2017 based on a decade of data from 2008–2009 to 2017–2018. We adjust for inflation using the Retail Price Index. Therefore, all trends in income are real rather than nominal.
In our analysis, we consider relative income change g in annual income y, defined here as
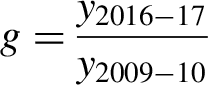
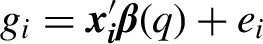
We use two complementary measures to summarise this relative growth distribution. First we consider the median value of g. This is considered a more helpful measure of average growth than the mean, because of the positively skewed nature of the relative growth distribution, and represents the relative growth of the ‘typical’ (middle-performing) organisation. We use quantile regression to examine how the median relative growth of charities varies according to our covariates (see Koenker, 2005). The quantile regression model is defined as
The second measure we use to summarise the relative growth distribution is to consider charities that experienced a sizeable (≥25%) decline in their income between 2009–2010 and 2016–2017. We create a variable which indicates whether charities have experienced relative growth of 0.75 or below. Using this 0/1 indicator variable as our outcome, we define a logistic regression model

Results
Median charity relative growth rates
The results from the quantile regression show sizeable geographical differences between local authorities, according to the level of local authority deprivation, in the median charity relative growth rate. Figure 3 (Model A1, before controlling for other covariates) illustrates these results graphically, while online Supplemental Table A1 (Model A1) lists the model coefficients. Charities in the least deprived decile have a median relative growth rate of 1.01 (95% confidence interval (CI) 0.97–1.05). Therefore, the median charity in the least deprived local authorities had a similar headline income in real terms in 2016–2017 as in 2009–2010. In contrast, charities in the most deprived decile have a median relative growth rate of 0.80 (95% CI 0.75–0.85). Therefore, the median charity in the most deprived local authority experienced a 20% real terms reduction in their headline income between 2009–2010 and 2016–2017. There is a sizeable gradient according to local authority deprivation: the median growth rate in the most deprived local authorities is 0.79 times that in the least deprived (95% CI 0.72–0.87)
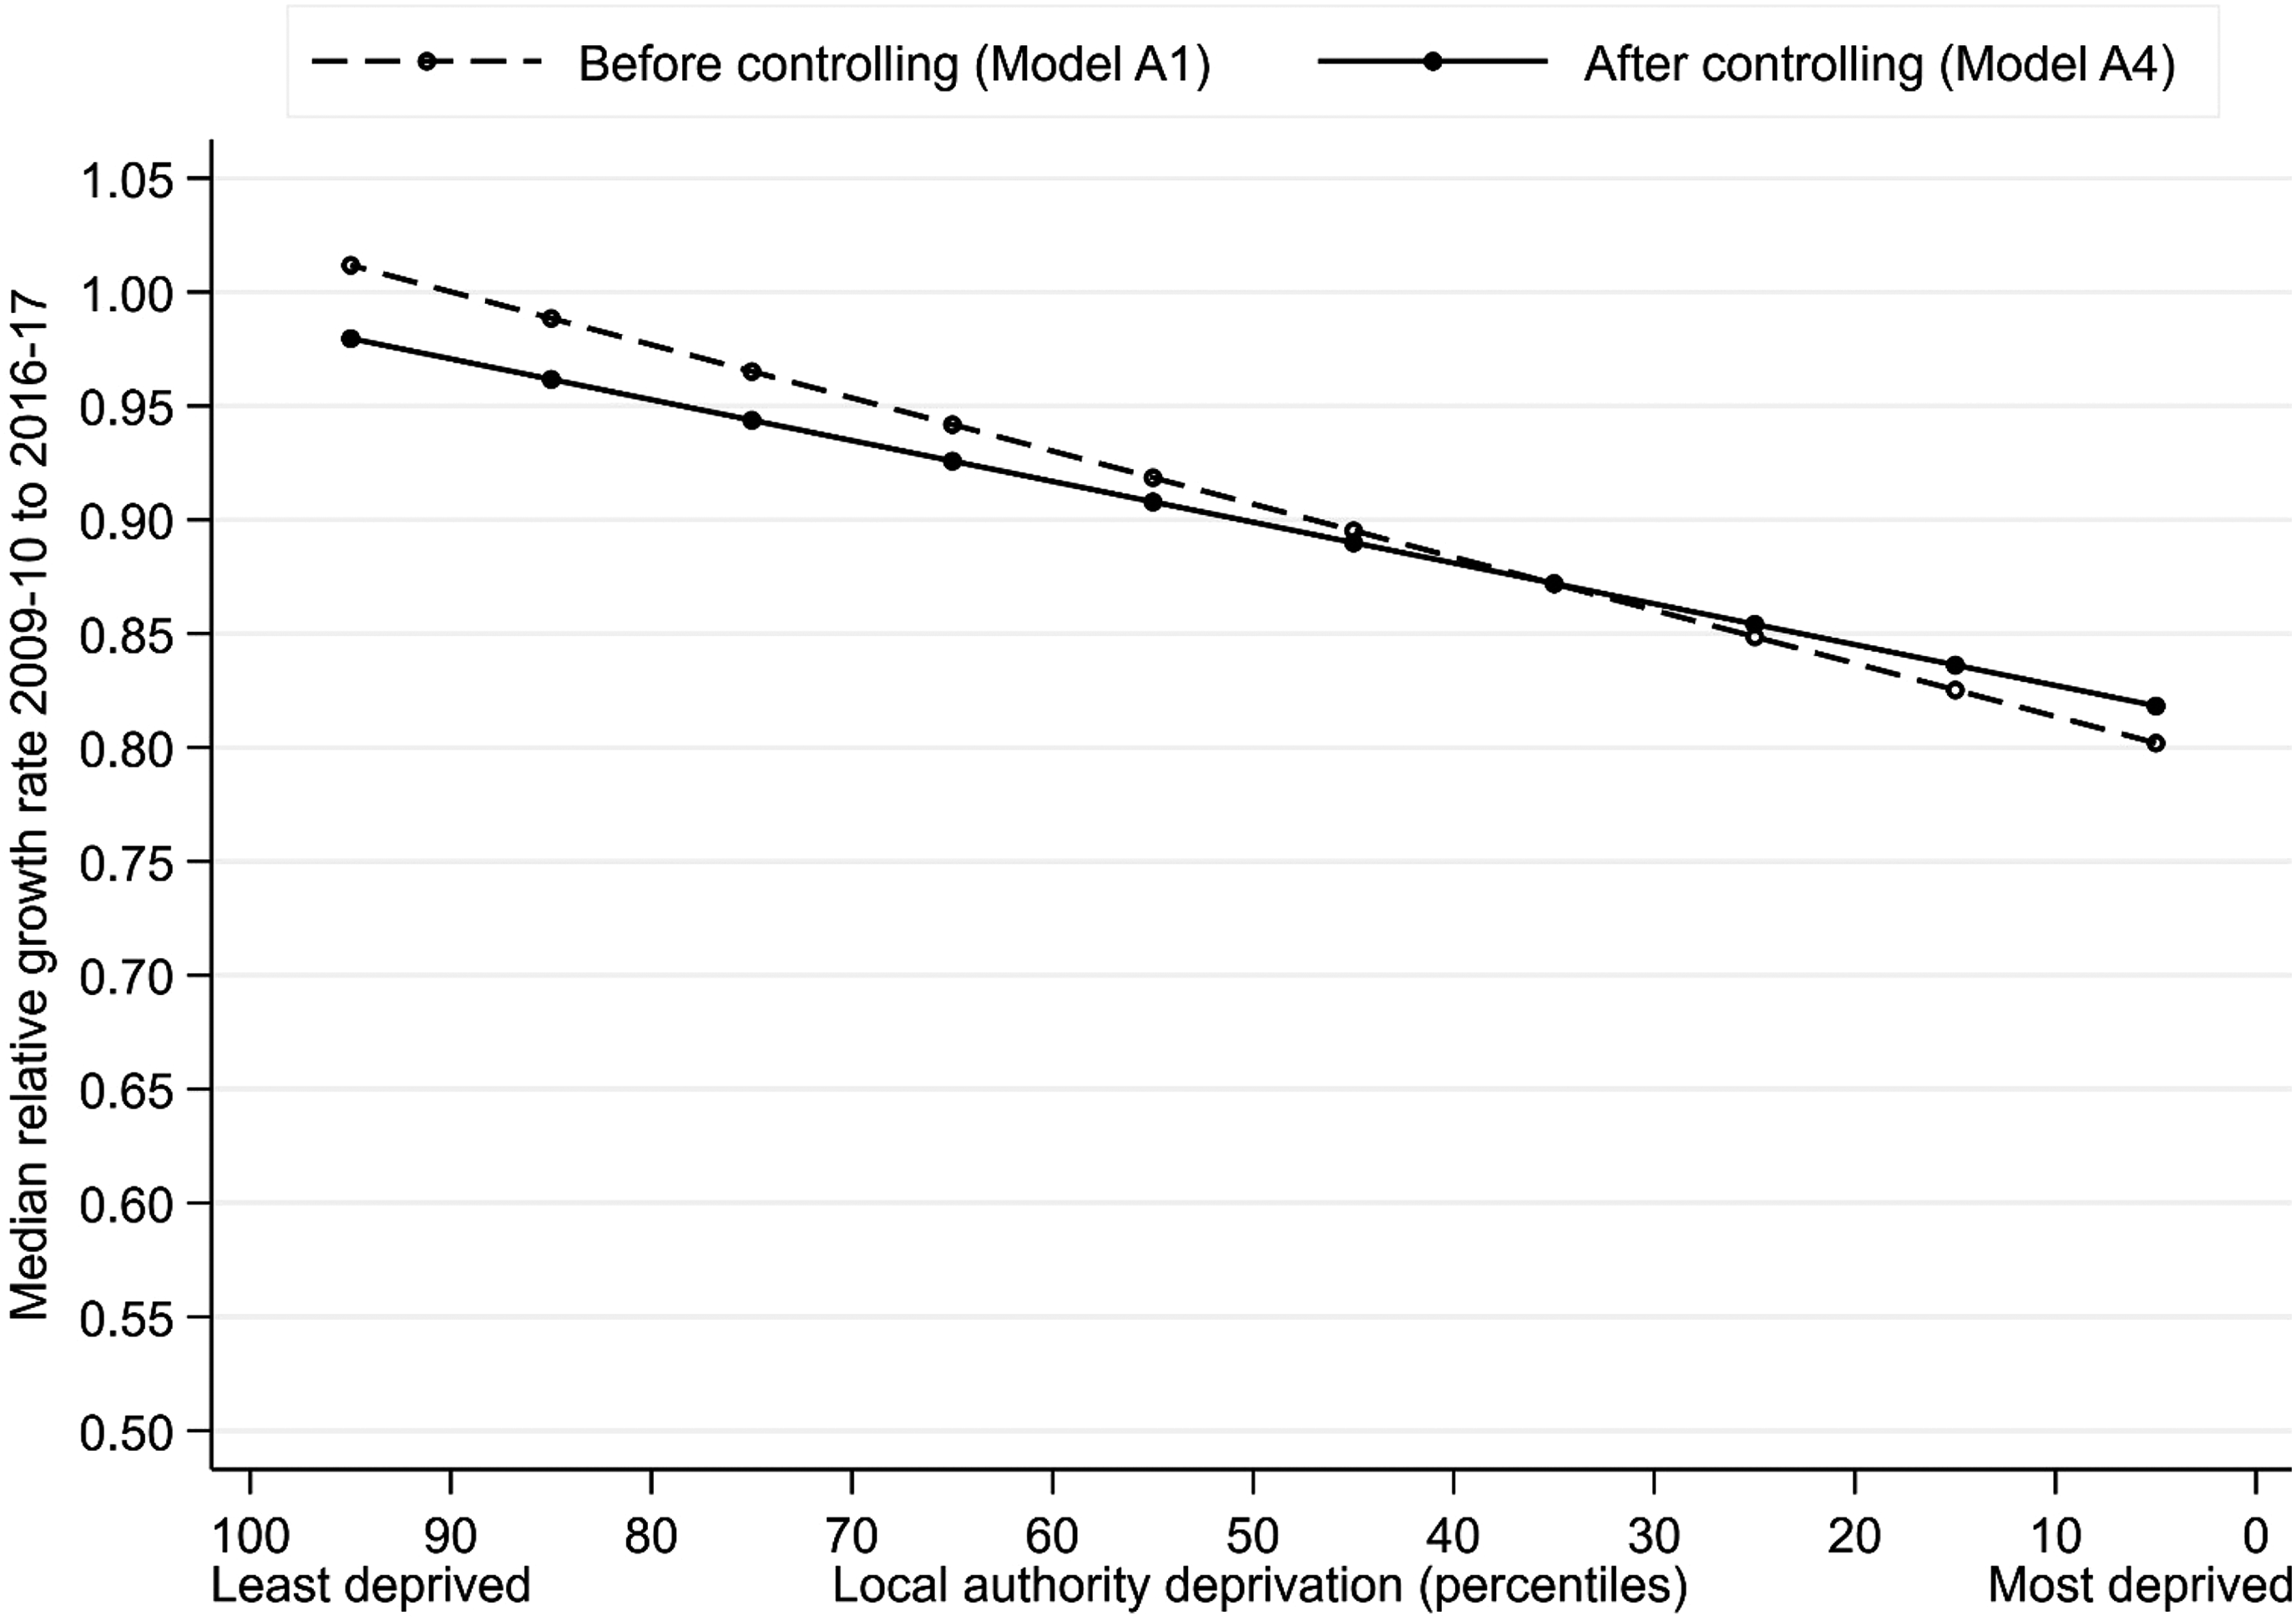
Median charity relative growth rate by local authority deprivation, before and after controlling for covariates.
The quantile regression results also show sizeable differences according to the type of local authority (online Supplemental Table A1, Model A2; Figure A1). The median charity operating in a county council had a similar income in 2016–2017 as in 2009–2010 (median relative growth rate: 0.97; 95% CI 0. 94–1.01). In contrast, the median charity operating in a London borough experienced a 9% reduction in income (median relative growth rate: 0.91; 95% CI 0.84–0.97) and the median charity in a unitary authority experienced a 12% decline in income (median relative growth rate 0.88; 95% CI 0.82–0.94). Charities in metropolitan districts saw the biggest income declines with the median charity experiencing a 20% decline in income (median relative growth rate 0.80; 95% CI 0.74–0.86). Therefore, the median growth rate in metropolitan districts is 0.83 times that in county councils (95% CI 0.76–0.90).
The differences in median relative growth rate according to local authority deprivation do not simply reflect differences in the type of local authority. The majority of the most deprived local authorities are metropolitan districts, and the majority of the least deprived local authorities are county councils. However, even when we control for type of local authority, there remain sizeable differences in the median charity growth rate according to the level of deprivation (Supplemental Table A1, Model A3).
Importantly, the differences in median relative growth rate according to local authority deprivation do not reflect compositional differences in the type of charity in different local authorities (Supplemental Table A1, Model A4). We use the International Classification of Non-profit Organisations (ICNPO) as a basis for categorising charities operating in different ‘vertical fields’ of charitable activity (Kendall, 2003). We find sizeable differences in median relative growth according to the field of charitable activity. The median charity working in primary or secondary education had a similar headline income in real terms in 2016–2017 as in 2009–2010 (median relative growth rate 1.01; 95% CI 0.90–1.11). The median charity working in culture and arts (median relative growth rate 0.98; 95% CI 0.91–1.06) and the median charity in the field of housing (median relative growth rate 0.97; 95% CI 0.88–1.07) also experienced little change in income. In contrast, the median charity working in economic, social, or community development experienced a 21% decline in income (median relative growth rate 0.79; 95% CI 0.69–0.88) and the median charity working as a philanthropic intermediary experienced a 42% decline in income (median relative growth rate 0.58; 95% CI 0.47–0.70). The median charity in social services (median relative growth rate 0.93; 95% CI 0.88–0.98) and the median charity in law and legal services (median relative growth rate 0.85; 95% CI 0.75–0.97) also experienced income declines. Note that there are compositional differences between local authorities in the type of charity in terms of field of charitable activity. However, even when we control for field of charitable activity, there remains a sizeable gradient in charitable growth according to local authority deprivation: holding type of local authority, size of organisation 6 and field of charitable activity constant and averaging over our sample observations, the median relative growth rate is 0.82 in the most deprived decile (95% CI 0.75–0.89) and 0.98 in the least deprived decile (95% CI 0.92–1.03). Therefore, there remains a sizeable gradient according to local authority deprivation: after controlling for these variables, the median growth rate in the most deprived local authorities is 0.84 times that in the least deprived (95% CI 0.72–0.95) (see Figure 3: Model A4, after controlling for other covariates).
Charities experiencing a sizeable (≥25%) income decline
The logistic regression models show sizeable geographical differences between local authorities, according to the level of local authority deprivation, in the probability of a charity experiencing a sizeable (≥25%) income decline between 2009–2010 and 2016–2017. Figure 4 (Model B1, before controlling for other covariates) illustrates these results graphically, online Supplemental Table A2 (Model B1) lists the model coefficients. Charities in the least deprived decile have a predicted probability of 0.20 of experiencing sizeable income decline (95% CI 0.15–0.24) while charities in the most deprived decile have a probability of 0.46 (95% CI 0.39–0.53). Therefore, the probability of sizeable decline in the most deprived local authorities is 2.34 times that in the least deprived (95% CI 1.61–3.09). The logistic regression results also show sizeable differences in the probability of sizeable decline according to the type of local authority (online Supplemental Table A2, Model B2; Figure A2): while charities in county councils have a probability of 0.23 of sizeable income decline between 2009–2010 and 2016–2017 (95% CI 0.19–0.27), charities in metropolitan districts have a probability of 0.45 (95% CI 0.37–0.52).
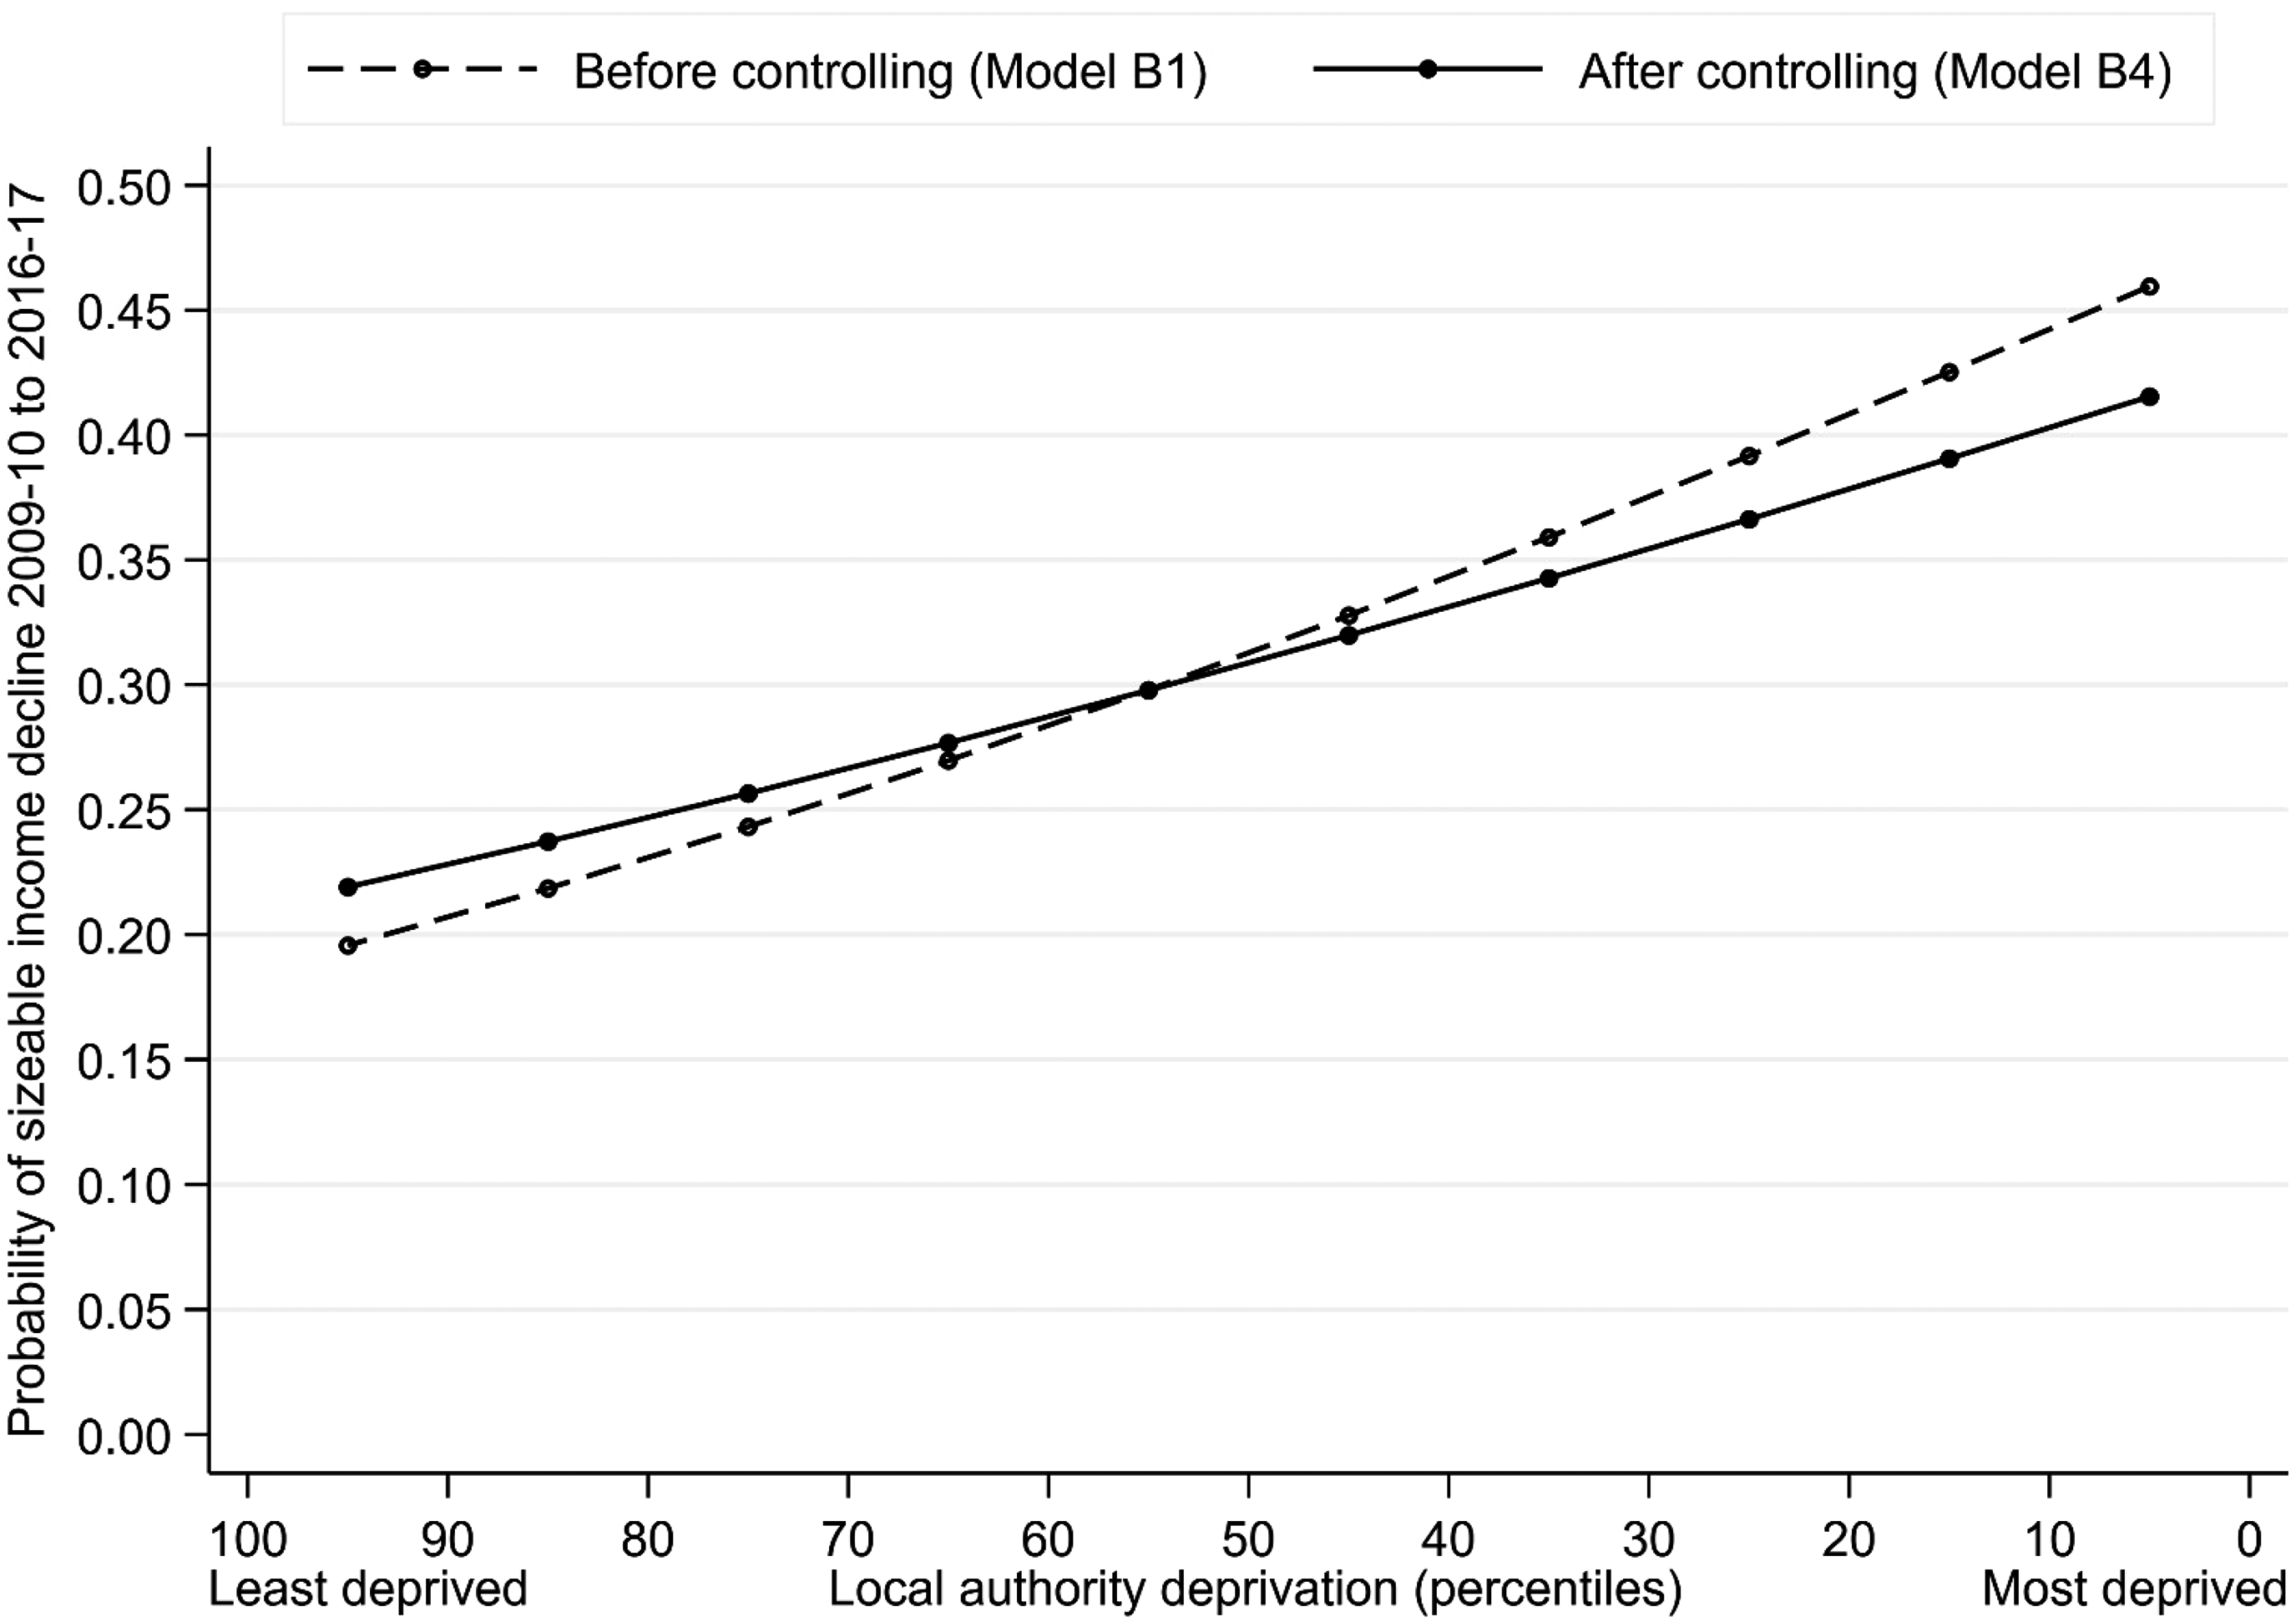
Probability of a charity experienced a sizeable (≥25%) income decline by local authority deprivation, before and after controlling for covariates.
Note that the differences in the probability of sizeable income decline according to local authority deprivation do not simply reflect differences in the type of local authority: when we control for type of local authority, there remain sizeable differences in the probability of sizeable decline according to deprivation (Supplemental Table A2, Model B3). The differences according to local authority deprivation are also not the result of compositional differences in the type of charity (Supplemental Table A2, Model B4). There are significant differences in the probability of sizeable decline according to the field of charitable activity. The probability of sizeable decline is 0.19 (95% CI 0.08–0.29) for charities in the field of primary and secondary education, 0.19 (95% CI 0.09–0.28) for charities in housing, and 0.20 for charities in culture and arts (95% CI 0.12–0.27) – compared to 0.26 (95% CI 0.14–0.38) for charities in law and legal services, 0.29 for charities in social services (95% CI 0.23–0.35), 0.41 for charities working in economic, social or community development (95% CI 0.29–0.53) and 0.66 for charities working as a philanthropic intermediary (95% CI 0.52–0.80). However, even when we control for the type of charity in terms of field of charitable activity, the probability of sizeable decline is 0.42 in the most deprived decile (95% CI 0.32–0.51) and 0.22 in the least deprived decile (95% CI 0.16–0.28). Therefore, there remains a sizeable gradient according to local authority deprivation: the probability of sizeable decline in the most deprived local authorities is 1.89 times that in the least deprived (95% CI 1.03–2.76) (see Figure 4: Model B4, after controlling for other covariates).
Discussion
The changes in local authority financing in England since 2009–2010 are ‘revolutionary’ and are the most significant since the immediate post second world war years (Amin-Smith et al., 2016). As Amin-Smith and Phillips (2019) argue, this is not only because local authority spending has fallen – although it has significantly, with per capita expenditure having fallen by a quarter. More fundamentally it is also because the funding system has changed: with the reduction in central government grant funding, the trend towards centralisation has been reversed and councils are now much more reliant on local tax revenues. Importantly, the nature of change has been inherently spatially uneven: local authorities more dependent on central grant funding in 2009–2010 have seen more sizeable declines in their spending power. Therefore, the pattern of change has been spatially regressive and urban in character: councils that were more grant reliant tended to be deprived urban areas, and it is these kinds of authorities that have experienced the biggest funding declines. The changes are unprecedented and have far reaching implications. As Amin-Smith et al. (2016: 47) argue, ‘change of this scale … needs to be subject to public scrutiny and rigorous independent analysis’. An important body of literature has outlined the nature of changes and the ways in which local authorities have responded (Amin-Smith and Phillips, 2019; Bailey et al., 2015; Fitzgerald and Lupton, 2015; Hastings et al., 2017). However, there is also an important need to consider the wider geographical implications of these changes beyond local government.
This paper is the first to consider the geographical impact on the voluntary sector. There is a substantive basis for this particular focus: the increased partnership between local government and the voluntary sector in recent decades, and associated increase in local government funding of voluntary organisations, makes the voluntary sector potentially vulnerable to significant changes in the level of local government spending (Deakin, 2001; Kendall, 2003; Macmillan and Ellis Paine, 2021; Rees and Mullins, 2016). We use longitudinal financial data to describe – for the first time – trends in the income of charitable organisations known to be in receipt of local government funding at the high point of council budgets in 2009–2010. We show that, just as the pattern of change in local government financing has been spatially uneven, so the nature of the trend in charities’ income has varied geographically. We emphasise two important aspects of this geographical variation. First, the size of the differences according to local authority deprivation is remarkable: while the median charity in the least deprived decile experienced little change in their headline income between 2009–2010 and 2016–2017, the median charity in the most deprived decile experienced a 20% decline; while charities in the least deprived decile had a probability of 0.20 of experiencing sizeable (≥25%) income decline (95% CI 0.15–0.24) over this period, charities in the most deprived decile had a probability of 0.46. We show that these spatially regressive differences are not simply a reflection of compositional differences in the type of charity in different kinds of local authorities. On the contrary, sizeable differences according to local authority deprivation persist even when controlling for relevant covariates. Second, charities in urban areas – and in particular charities in metropolitan districts, large urban areas in the North and Midlands – have seen the most sizeable income declines.
These results are not only empirically significant: they also have important theoretical relevance. The results are consistent with the dual vulnerability of charities in more deprived local authorities. First, since more deprived local authorities have seen more sizeable decreases in their spending power than less deprived local authorities, voluntary organisations in more deprived areas are likely to have faced a more challenging funding environment for obtaining income from their local authority. Second, according to Salamon’s (1987: 40) theory of voluntary sector failure, the voluntary sector weakness of ‘philanthropic insufficiency’ is particularly evident in more deprived areas since philanthropic resources ‘are frequently not available where the problems are most severe’. This means that the ability of voluntary organisations to provide services in more deprived areas of the country depends to a significant extent on government funding (Clifford, 2012; Fyfe and Milligan, 2003). Therefore, the opportunities for charities to mitigate the effect of reductions in local authority funding by diversifying their income portfolio – through benefiting from private income from individuals in the form of fees and/or voluntary donations to replace lost or reduced public funding – are more limited in more deprived areas. Note that this paper does not seek to provide support for the theory of voluntary-sector failure, or the voluntary sector weakness of ‘philanthropic insufficiency’, per se: we are not able to assess the sufficiency of voluntary resources directly since we do not measure the extent of social need or how need has changed over time in different kinds of local authorities. Nevertheless this paper finds support for a prediction based on this theory: since voluntary organisations in more deprived local authorities have a greater dependence on government funding than in less deprived areas, we would expect the effect of recent changes in local authority financing to have a particular impact on the voluntary sector in more deprived areas. This paper's results represent important empirical evidence consistent with this prediction. Indeed we are not aware of any other study, in any country, that has been able to provide such detailed evidence documenting spatially regressive trends in charities’ income in the context of public spending retrenchment. The results therefore have a wide international relevance: they provide the strongest evidence to date that, in countries with a history of partnership between government and the voluntary sector (Smith and Lipsky, 1993), voluntary organisations in more deprived areas are particularly vulnerable to sizeable reductions in the level of local government spending. Indeed they are consistent with Fyfe and Milligan’s (2003: 2084) predictions that – given the importance of government funding to voluntary organisations in areas of high social deprivation – ‘any cutbacks in … local state spending may weaken the voluntary sector fabric in these areas’ and therefore ‘increase the difficulties faced by vulnerable populations’ that they serve.
The paper’s results resonate with discussions of ‘austerity urbanism’, which emphasise that cities in Europe and North America have been particularly affected by contemporary public spending reductions (Peck, 2012, 2014). Indeed, through illustrating the sizeable reductions in the income of charities in disadvantaged local authorities in the context of reductions in the level of local government spending, this paper illustrates an important mechanism through which ‘austerity urbanism’ becomes salient in the lives of individuals in more deprived areas (see Hastings et al., 2017). Therefore, the paper makes an important conceptual contribution: it shows that under ‘austerity urbanism’ not only is austerity ‘downloaded’ from central to local government – but also how, in turn, austerity may be ‘downloaded’ from local government to the charitable sector. Thus, while Peck (2014: 19) and Hastings et al. (2017) describe how, in a process of ‘regressive redistribution’, the consequences of austerity are concentrated on deprived urban local authorities as austerity is ‘devolved’ to the local level, this paper complements these analyses by showing the knock-on implications for the charitable sector. Indeed, in a context of ‘third party government’ involving a partnership between local government and the charitable sector in the provision of public services (Deakin, 2001; Salamon, 1987), local authorities have ‘few alternatives’ (Peck, 2012: 648) but to themselves offload austerity onto the charitable sector. This aspect of ‘austerity urbanism’ therefore represents an offload of risk and of funding cuts from financially pressed local authorities onto the voluntary sector (Dagdeviren et al., 2019). It is the nature of ‘austerity urbanism’ that these downloaded financial pressures are not spatially uniform (Peck, 2012): it is in the urban and most deprived local authorities, that have experienced the largest cuts in their spending power and where the charitable sector has a greater dependence on public funding, where charities have experienced the most sizeable income declines – with implications for the individuals and communities that they serve (Van Lanen, 2017). Therefore, from a methodological perspective, for research on ‘austerity urbanism’, this paper’s results underscore the importance of empirical work which not only examines levels of government spending, but also considers organisations with financial links to government – particularly the impact on the voluntary sector within the ‘mixed economy of welfare’.
The analysis in this paper has its limitations. It describes the effect of changes in local government financing for only a part of the voluntary sector. The results apply to the c.4500 charities in our target population: those charities in England operating in one local authority, with at least £100,000 in annual income at the beginning of the analysis period, which were in receipt of local government funding in 2009–2010. However, we are unable to examine changes for charities under the £100,000 size threshold since it is more challenging to identify local authority funding in their accounts. We are also unable to examine geographical patterns in charities’ income trends for those charities that operate at a regional or national, rather than local, level: it would not be meaningful to link charities to covariate data on local area deprivation where they operate across a variety of different local authority areas. Therefore, our analysis is based on only a partial picture of charitable activity – particularly in large city regions where charities may operate across several local authorities. Note that the RoC area of operation data is cross-sectional rather than longitudinal, based on charities’ geographical focus at the end of the analysis period. It is possible that under ‘austerity urbanism’, where charities operating in deprived urban areas face a particularly challenging funding environment for obtaining income from their local authority, charities might choose to extend their geographical reach to operate in other local authority areas. However, since our data do not measure changes in charities’ area of operation, we are not able to examine this issue empirically. Note too that we do not consider the impact of the Covid pandemic on the charitable sector. Macmillan (2020: 130–131) argues that during the pandemic charities have faced an acute ‘three-dimensional crisis’ of resourcing, demand and operation: income streams have become more vulnerable; certain areas of need have intensified and become more complex; and public health measures designed to mitigate the impact of the virus have affected charities’ ability to meet their objectives. However, examining these changes, and describing the role of charities in responding to the pandemic, is beyond the scope of this paper.
This paper sets an important agenda for future geographical research. Under government policy, local authorities in England will soon move from retaining 50% of business rates revenues to retaining 75% 7 , with further cuts in central grant funding to ensure that this reform is revenue-neutral at the national level (Amin-Smith and Phillips, 2019). This represents further decentralisation: in coming years the vast majority of local authorities’ income will be from locally raised revenue in the form of council tax and business rates. Therefore, in contrast to a centralised system of funding, councils as a group will be self-funding and individual councils will bear ‘far more spending and revenue risk’ (Amin-Smith et al., 2016: 1). Meanwhile spending pressures for local authorities will heighten further as social care costs continue to increase. Amin-Smith and Phillips’ (2019) judgement is that councils will struggle to meet these increasing costs using locally raised revenue. Moreover, the capacity for local authorities to increase their income from locally raised revenue varies geographically according to the extent of local area deprivation: more deprived areas have smaller council tax bases and are less able to raise revenue through business rates. Given the importance of local government funding to many charitable organisations, it will be important for future research to examine whether these further developments and spending pressures – in what is already a challenging local authority funding environment for the voluntary sector – lead to an intensification of the geographically uneven and spatially regressive character of recent trends in charities’ income.
Supplemental Material
sj-docx-1-epn-10.1177_0308518X211034869 - Supplemental material for Disparities by deprivation: The geographical impact of unprecedented changes in local authority financing on the voluntary sector in England
Supplemental material, sj-docx-1-epn-10.1177_0308518X211034869 for Disparities by deprivation: The geographical impact of unprecedented changes in local authority financing on the voluntary sector in England by David Clifford in Environment and Planning A: Economy and Space
Footnotes
Acknowledgements
The author is grateful for the continued support of Prof John Mohan, director of the Third Sector Research Centre, University of Birmingham. Many thanks to the Charity Commission for providing access to data from the Register of Charities and to David Kane for making available the classification of English and Welsh charities according to the ICNPO. The Sample of Charity Accounts data are collected through a collaboration between the Third Sector Research Centre (TSRC) and the National Council of Voluntary Organisations (NCVO).
Declaration of conflicting interests
The author declared no potential conflicts of interest with respect to the research, authorship, and/or publication of this article.
Funding
The author disclosed receipt of the following financial support for the research, authorship, and/or publication of this article: This research is funded by the award to the author, by the Leverhulme Trust, of the Phillip Leverhulme Prize for Social Policy (£100,000; 2018–2021).
Supplemental material
Supplemental material for this article is available online.
Notes
References
Supplementary Material
Please find the following supplemental material available below.
For Open Access articles published under a Creative Commons License, all supplemental material carries the same license as the article it is associated with.
For non-Open Access articles published, all supplemental material carries a non-exclusive license, and permission requests for re-use of supplemental material or any part of supplemental material shall be sent directly to the copyright owner as specified in the copyright notice associated with the article.