
Abstract
Scholars have attributed various beneficial outcomes to the presence and density of the voluntary, third or non-profit sector in communities. One way in which the distribution of such organizations may benefit communities is through providing opportunities for volunteering. We hypothesize that the distribution of third-sector organizations has an influence, after controlling for relevant individual and area characteristics, on the likelihood of engaging in formal volunteering (defined as unpaid help given through, and to, third-sector organizations, rather than directly to individuals). Using administrative data from the Charity Commission, we classify organizations in terms of their geographical scale of operation. We then construct indicators of the distribution of charities, and their expenditures, for local authorities in England. We obtain data on volunteering by individuals from the Citizenship Survey and link this to administrative data contained in the Charity Commission register on the distribution of charities. We find that there is a positive relationship between the numbers of charities operating locally and the likelihood of volunteering. Other measures, however, including the distribution of charities operating either regionally or nationally, have no statistically significant effects. We find no relationship between a measure of the size of charities (the median expenditures of charities within local authorities) and the likelihood of volunteering. These findings are relevant beyond the UK to debates about the understanding of variations in voluntary action, and to discussions about the impact of the third sector upon communities.
Introduction
Scholarship has established that significant and enduring variations in the pattern of voluntary organizations and their resources exist at various spatial scales. But do such uneven distributions have broader consequences for communities? Here, we need to distinguish between direct and latent benefits (Kamerade, 2015). Researchers have argued that the presence of non-profit organizations provides a range of community-level benefits including contributions to quality of life (Ott, 2001; Wolpert, 1993), catering for marginalized groups and for those who have been overlooked by government and/or the market (Musick and Wilson, 2008) and providing outlets for socially oriented and/or religiously motivated initiatives (Ben-Ner and Van Hoomissen, 1992; James, 1987). However, in addition to the direct benefits to communities, it has been argued that there are also latent benefits for the functioning of communities from a strong voluntary-sector presence (e.g. the formation of social capital) (Salamon et al., 2000). Awareness of this possibility is evident in recent British discussions of geographical variations in the pattern of charitable organizations (Centre for Social Justice, 2014), which suggested that communities lacking such entities were missing out, both on opportunities for volunteering and on the wider social benefits that might then accrue. The motivation for this paper is thus an attempt to explore whether the distribution of opportunities to volunteer is indeed associated with variations in the likelihood of volunteering.
This concern connects the argument developed in this paper to broader debates about neighbourhood effects, which explore spatial opportunity structures thought likely to affect socioeconomic outcomes for individuals and communities. Galster and Sharkey’s (2017) review of such opportunity structures did not explicitly consider the impacts of variations between neighbourhoods in the distribution of voluntary organizations, although they made reference to the relevance of local networks and their ability to affect the quality and quantity of information that an individual could access.
Others have made more explicit references to the organizational base of community life. Sampson (2012: ch. 8) saw variations in the distribution of non-profit organizations across Chicago as part of an area’s infrastructure, which could be appropriated by community members in the service of emergent collective action. Such initiatives linked individuals together in unintended ways that enhanced tasks oriented towards the public good (Sampson, 2011: 233). For example, Sampson et al. (2005) developed the argument that variations in non-profit density were associated with the presence and strength of forms of collective action, such as mobilization of demands for improved public services. Greve and Rao (2012) similarly contended that the density of non-profit organizations, and its stability over time, undergirds the civic capacities of communities – evident in variations in the formation of consumer cooperatives. What they term the ‘institutional infrastructure’ constituted ‘key nodes in a network that supplie[d] nascent community organisations with resources’. Sharkey et al. (2017) have also argued that growth in the non-profit sector across over 264 urban areas was associated with expressions of collective efficacy, such as reductions in the incidence of violent crime. These authors have also emphasized the stability in the distribution of non-profit organizations over time. This suggests that we can regard these distributions as an enduring feature of neighbourhoods.
These are academic debates, but the issue has recently attracted practitioner concern in the UK, where current and plausible future scenarios for public finances create an expectation that more responsibilities for public service delivery will come to be shouldered by communities. But is it the case that all communities will be equally able to respond to such calls for action? An answer to that question must encompass a discussion of community-level variations in the likelihood of citizen engagement in voluntary action.
The paper first reviews the literature on community-level variations in volunteering, including references to the possible effects on volunteering of variations between places in the distribution of organizations. We then turn to a discussion of how we might measure variations in the distribution of voluntary organizations. We describe how we approached the development of local authority-level measures of the distribution of registered charities in England. We then consider the available survey data on volunteering (our outcome indicator) and on our other independent variables, including both individual-level and community-level characteristics. Our analytical strategy is to model the likelihood of volunteering as a multilevel combination of individual and area characteristics. The former include a number of established predictors of voluntary action (cf. Musick and Wilson, 2008). The latter include measures of material circumstances of neighbourhoods, their urban/rural location and the distribution of third-sector organizations. Our conclusions, and wider implications, are discussed at the end of the paper.
Geographies of volunteering and voluntary organizations
Community-level variations in voluntary action are substantial. If we take formal volunteering – that is, actions undertaken through a formal organizational context (as opposed to tasks done directly for people in one’s immediate community) – then typically volunteering rates between the most deprived and the most prosperous areas of England and Wales vary by a factor of at least 2.5, with one-fifth of the population volunteering in the former and just under three-fifths in the latter (McCulloch et al., 2012). Much of this variation is accounted for by individual characteristics (Bekkers, 2016; Bennett, 2014; Musick and Wilson, 2008; Wilson, 2012). Thus, community-level variation is largely attributable to the mix of individuals in different parts of the country (e.g. an area with higher proportions of educated, middle-class individuals will exhibit higher rates of volunteering). British studies suggest this is generally the case (Bennett, 2014; McCulloch et al., 2012; Mohan et al., 2006).
In some ways, the limited evidence for community-level influences may be thought surprising. Volunteering largely takes place locally: most people travel short distances to volunteer, serve local organizations, and become involved through social networks that are local in focus (e.g. school, church or other voluntary groups), or in response to solicitation from a local organization (Musick and Wilson, 2008: 319). In response, Musick and Wilson (2008: 323–341) consider a range of community-level influences on engagement, some of which (population density, population heterogeneity) are also discussed in the present paper; they find that the effects are small. But in a study that cautions against viewing volunteers in isolation from the wider social and cultural context, Rotolo and Wilson (2012: 454) hypothesize that ‘without a robust not-for-profit sector, fewer volunteers will be mobilized’. They find, for states in the USA, that the likelihood of volunteering increases positively with the distribution of non-profit organizations (Rotolo and Wilson, 2012: 466–467). Deri-Armstrong et al. (2016) also find a small but significant increase in the likelihood of voluntary action as the numbers of charities within a defined distance of a survey respondent’s place of residence increases. Wollebaek and Stromsnes (2008: 253) plausibly account for such findings by arguing that the number of voluntary organizations in a neighbourhood will have an effect not only on those directly affiliated with the organizations, it will also raise awareness in the wider community of the opportunities to become involved. However, there are (to our knowledge) no other studies of the relationship between organizational distributions and the likelihood of volunteering.
As with volunteering, we know that voluntary organizations are not evenly distributed. We define such organizations, in line with widely used international terminology, as entities which are: organizations, private, self-governing, non-compulsory and totally or significantly limited from distributing any profits or surpluses to external stakeholders such as shareholders (Salamon and Sokolowski, 2016). Established theories of the origin and distribution of such organizations would lead us to expect variations between communities in their numbers and characteristics. Accounts lay varying emphases on: the nature of the non-distribution constraint (the inability of non-profits to distribute surpluses to external stakeholders), which is said to overcome challenges of assuring trust between users of services and the providers of them in circumstances of market failure; population heterogeneity and the absence of democratic endorsement for statutory provision, so that non-profits are the initial means whereby the needs of minorities are met and whereby initiatives are generated in relation to causes that are not widely endorsed (e.g. programmes for drug users); and the distribution of those with the entrepreneurial capacities to establish such initiatives (Hansmann, 1980; James, 1987; Weisbrod, 1975). Non-profit organizations typically rely, at least initially, on donations from individuals, but given variations in economic conditions, and in perceptions of social need, that support is highly variable. This led Salamon (1987) to codify four inherent weaknesses of voluntary activity in relation to particularism, paternalism, amateurism and insufficiency. It is the last which concerns us most directly here. Voluntary organizations tend not to generate sufficient resources to meet the demand for services in all communities. This is partly a result of free-rider problems, but it is also driven by economic fluctuations and by the differential availability of resources between communities.
It is therefore known that affluent communities have extensive and diverse non-profit landscapes (Bielefeld, 2000; Wolch and Geiger, 1983; Wolpert, 1993), while in contrast low-income communities have fewer organizations and these have lower levels of resources (Allard, 2009; Gronbjerg and Paarlberg, 2001; Joassart-Marcelli and Wolch, 2003; McDougle and Lam, 2013). British work has shown similar patterns both historically (Mohan, 2003) and in the contemporary period (Clifford, 2012; Mohan and Breeze, 2016). Scholars have therefore warned about geographical unevenness, and suggested that this may lead to inequities and inefficiencies in how non-profit services are accessed (Clotfelter, 1992; Wolch, 1999). Analysis of whether these variations affect the likelihood of individual engagement in voluntary action requires consideration of how best we might measure them.
Under the broad heading of an interest in social capital, an extensive literature has sought indicators of spatial variations in the social environment, in order to investigate the impact of that environment on outcomes for individuals and communities. A small number of analyses use the distribution of voluntary organizations as an independent measure of community social context. The challenges these face concern construct validity and spatial scale.
In terms of construct validity, measures operationalized in previous research included: ratios of civic or social organizations, and of non-profit organizations, to population (Putnam, 2000: 291; Rice and Sumberg, 1997; Rupasingha et al., 2006; Sabatini, 2008: 493; Sampson, 2012), non-profit expenditures (Snyder and Freisthler, 2010), the rate of foundation of new non-profits (Saxton and Benson, 2005) and non-profit employment (Scheffler et al., 2008). In the UK, Andrews and Wankhade (2014; see also Andrews, 2011) investigated the connection between the distribution of community organizations and neighbourhood-level outcomes, taking as a measure of organizational density the numbers of community, social and personal service associations registered for value added tax (VAT) per 1000 population.
These economic measures (employment, expenditure or numbers of VAT-registered businesses) capture some aspects of the distribution of voluntary organizations, though they are not necessarily informative about whether or not the organizations provide opportunities to volunteer. In the case of Andrews and Wankhade’s measure, this was not restricted to non-profit legal forms, selects only larger organizations with a turnover of at least £79,000 (the VAT threshold at the time of their study) and which were making significant volumes of purchases of VAT-eligible goods and services, and is not stable over time (the VAT threshold varies). Measures of voluntary-sector employment will emphasize large organizations often with significant contracts for public service delivery but relatively low levels of voluntary engagement (Milligan and Fyfe, 2005) and, if used for analysis of change over time, would be vulnerable to transfers (as has been the case in the UK recently) of significant public agencies to voluntary control. The rate of foundation of new organizations may capture short-term characteristics (such as rapid population growth or injections of public funds to meet previously unacknowledged social needs) rather than enduring properties of the community.
Studies also vary in terms of the spatial scale at which they measure variations in the distribution of voluntary organizations. In the studies cited above, indicators are constructed from the level of US states down to ZIP codes. States seem rather large units to have contextual influences on individual pro-social behaviours, particularly if we recall Musick and Wilson’s (2008) argument that voluntary action is a largely local matter. Few US states have populations comparable to or lower than that of the largest English local authority (Birmingham at 1.1 million), for example. Smaller-scale units seem intuitively more plausible, as in the case of Sharkey et al.’s (2017) study of the relationship between non-profit density and crime reductions in 264 urban areas for a 20-year period. Crucially, assigning organizations to spatial units on the basis of administrative addresses makes the assumption that organizations located in an area only carry out their activities within it. We seek to go beyond this, using administrative data to refine our measures of the distribution of organizations by identifying only those entities that work within specific administrative units.
Measuring the distribution of registered charities for English local authorities
We are interested in voluntary organizations in general, and the core of the English voluntary sector, accounting for by far the greater part of the total number of voluntary organizations, consists of registered charities. There are 13 categories of ‘charitable purpose’ defined in the 2006 Charities Act, as set out in Table 1.
Charitable purposes for the public benefit as defined in the 2006 Charities Act.
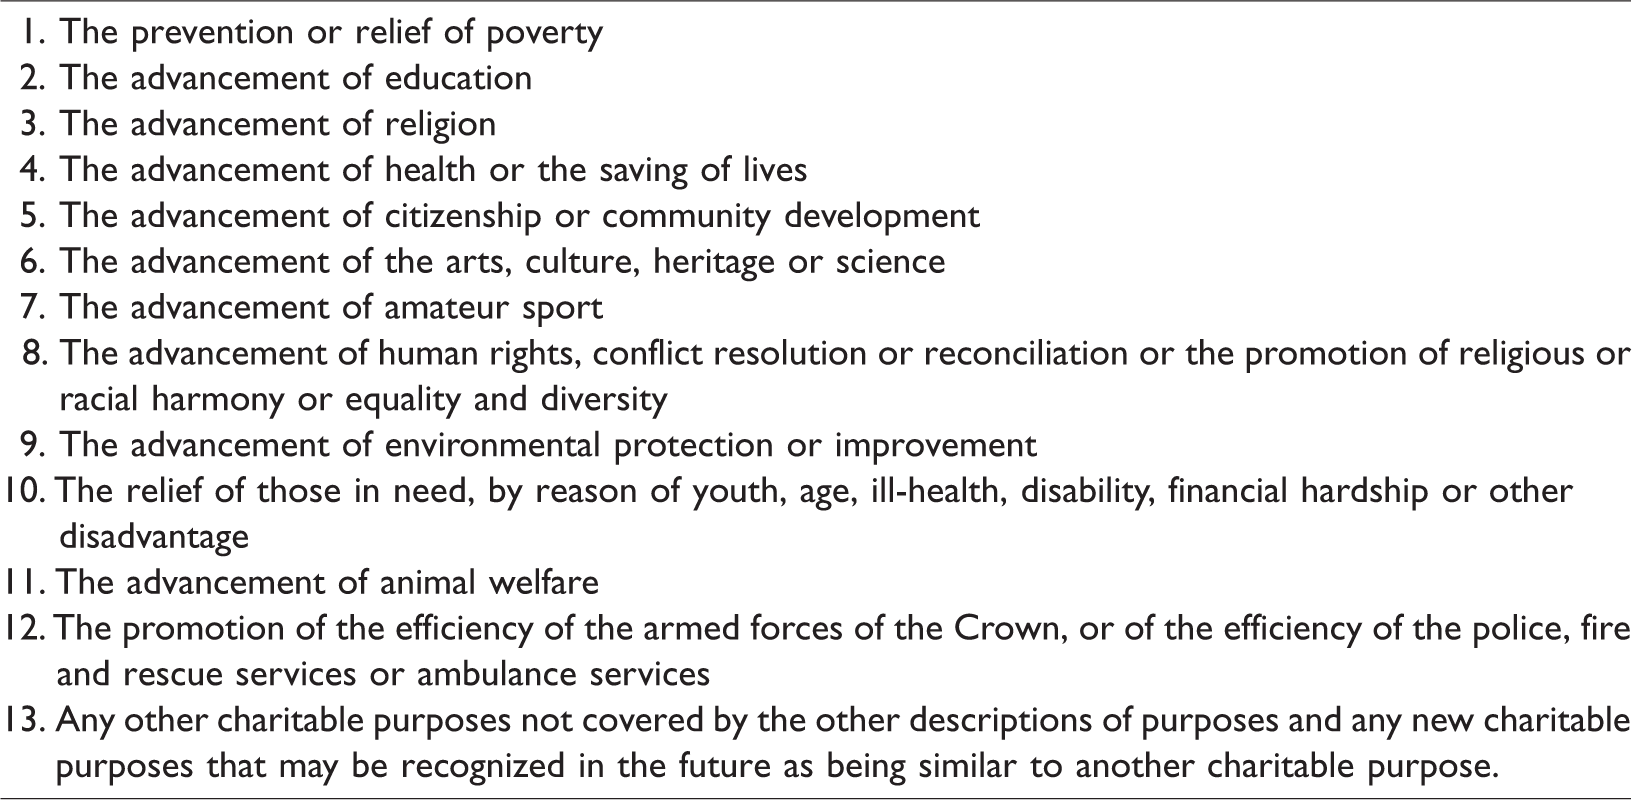
Few purposes are explicitly excluded from this list, although public-benefit tests generally prevent charities being set up to serve only their own members. Other legal forms are available to third-sector organizations, such as companies limited by guarantee (CLGs), industrial and provident societies (IPSs) and community interest companies (CICs). The 2008 and 2010 national surveys of third-sector organizations and social enterprises in England (e.g. Ipsos MORI, 2008) estimated that the numbers of organizations taking other third-sector legal forms added approximately 25% to the total number of charities. Therefore it is reasonable to suppose that the distribution of registered charities captures the great majority of opportunities to volunteer, at least in formal organizational contexts.
Our focus is upon providing local indicators of the distribution of registered charities in England. The process of registration with the Charity Commission, which is required for organizations above a certain size/turnover (currently £5000) generates data on: location; income and expenditure; the nature of their activity by sector (e.g. health, disability, overseas aid); function (how they carry out their charitable purposes, such as grant-making, service provision); and beneficiaries (e.g. particular demographic groups). Organizations can be classified in some detail using the International Classification of Nonprofit Organisations (ICNPO) typology (Salamon and Anheier, 1996), but because the survey data do not allow us to differentiate the organizations to which voluntary help is being given, we do not look at the relationship between type of volunteering and type of organization in this analysis. For subsets of larger organizations (those with incomes greater than £500,000, which are required to report financial data in more detail than are smaller organizations) there are also more data on income sources, expenditure and assets, but again that is not deployed here. The availability of postcodes for the registered offices of charities permits matching to socioeconomic data at various geographical scales. There are substantial community-level variations: the ratio of charities to population varies between local authorities (which, in England, have populations of between 80,000 and 1 million) by a factor of nearly 10, even discounting the outlier of the City of London, which has several hundred registered charities but a population of only 7000; many charities are registered through solicitors’ offices, which are numerous in the City.
The administrative address of a charity may not refer to where it operates – many charities operate over very large geographical areas. To refine our indicators we explore two items of spatially referenced data captured by the Charity Commission: the area of benefit (AOB) of a charity, and the areas in which it operates. On registration with the Charity Commission, an organization must provide a main contact address and they may (but are not required to) specify their geographic AOB. If they do so, they must restrict their activities to that area, though (related to the concern of this paper) of course this does not prevent them from recruiting volunteers from outside it. AOBs may be defined in terms of administrative units (which may no longer exist due to administrative reorganizations), the names of places, individual buildings or parcels of land (such as parks or sports grounds). An AOB may bear little relationship to modern settlement patterns or the distribution of social need and it can, incidentally, influence access to philanthropic resources at the local scale in communities that may have changed greatly since a charity was established (for examples, see Bryson et al., 2002; Obler, 1981).
The Charity Commission also gathers information about the ‘area of operation’ of charities, offering them the opportunity to report the names of the local authorities in which their activities take place. They can identify a single authority, 2–10 named local authorities, a ‘wide’ area of operation (more than 10 local authorities, not named), ‘England and Wales and international’ and ‘international only’. Using this information, we define three classifications of scale of operation. The first, local charities, which in practice accounts for the majority of organizations, is charities that operate only within one local authority. This accounts for three-fifths of all charities, of which some 40% were accounted for by the following subsets of the ICNPO classification: economic, social and community development (7600; this is a broad category that includes several thousand Women’s Institutes as well as community centres); parent–teacher associations (9800); playgroups (5800); uniformed groups (Scouts, Guides, Cubs and so on) (4800); village halls (4800); sports and recreational groups (5000). The second, the within-region charities, includes those that say they operate within 2–10 named local authorities. The third is charities that operate on a ‘wide’ basis, that is across more than 10 local authorities, including organizations operating nationally and internationally, which we have termed ‘national’ charities. We also need to consider whether we wish to include all charities, or subsets of them. Two relevant points here are whether charities are active, and whether we wish to identify only those charities that would in principle provide opportunities to everyone from the community to become engaged in them. Determining whether a charity is active can be problematic because organizations can remain dormant on the register for some years after their effective closure. Thus, the absence of a financial return does not indicate closure. This would exclude those charities that run entirely on voluntary labour and that remain on the Charity Commission Register for reputational reasons – signalling to potential volunteers and supporters that they have the brand of charitable status. We therefore define an ‘active’ charity as one that made at least one non-zero financial return to the Charity Commission in the five-year period 2007–2011. This may underestimate the numbers of active charities, but until a charity is formally removed from the register there is no decisive test that can be employed to determine whether it has formally ceased to operate.
There are also important public-benefit questions about charities, which might prompt exclusion of some organizations on the grounds that they do not conform to criteria that form part of widely used definitions of the third sector (Salamon and Sokolowski, 2016), such as public purpose, ability to benefit all members of the community and freedom from government control. For instance, one might exclude independent schools (on the grounds that their charitable status has been questioned), ‘benevolent’ charities (whose benefits are confined to limited sections of the population, e.g. particular occupations), ‘government controlled’ charities, such as those that exist to raise funds to support public services, like the charitable arms of NHS hospital trusts (on the grounds that they are not independent of government control) and non-departmental public bodies (e.g. the Arts Council), which exist to fulfil a mandated government purpose. The National Council for Voluntary Organisations (NCVO) have used these criteria in their ‘general charities’ definition, which removes around 20,000 organizations for one or more of the above reasons, and we use it in this analysis.
As an illustration of the effects of potential exclusions, around 162,000 charities in England appeared on the register of charities in the five-year period, 2007–2011 (including charities that either joined or left the register in this period); 147,000 were deemed ‘active’ because they made at least one non-zero financial return; of these, 128,000 were ‘general’ charities. For each local authority we generated counts of: (1) the total number of registered charities; (2) charities that were registered and active; and (3) general charities that were both registered and active. We also subdivided these by geographical scale as indicated above: local, operating within a single region (and therefore including all the ‘local’ charities) and national. The resultant counts were expressed as ratios per 1000 population.
We also considered the possible inclusion of non-charitable sports organizations, since sport is a major focus for voluntary action. The law governing charities does not regard the promotion of sport, in and of itself, as a charitable purpose, though participation in sport may be encouraged as a means to various charitable ends (such as the promotion of health). Partly as a consequence, relatively few sports organizations take a charitable legal form. There is no reliable source for the numbers and distribution of sports clubs, let alone one that would permit unambiguous identification of those with potential for voluntary involvement. Some 6000 charities (∼4% of the total) are classified as being concerned with sport; they account for up to 10% of charities in some local authorities, although generally the proportion is 2–3%. Removal of these made no difference to our substantive results and we do not report that analysis here.
To complement our data on the distribution of organizations, we used the median expenditures of the various categories of charities, taking this to be an approximation of the resources available to a typical charity in each local authority. We considered using geographical information to generate estimates of the level of charitable expenditure by local authorities. However, approximately two-thirds of all expenditure by charities is accounted for by organizations that operate across at least 10 local authorities or on a national or international basis, so we are unable to specify precisely where the spending and activity of these entities takes place. Note that we do not have granular data that are of relevance to significant debates about the identity of voluntary organizations, such as the extent to which there has been a bifurcation between large, professionalized, service delivery organizations and small-scale, volunteer-led groups (Knight, 1993; see also Fyfe and Milligan, 2003; Milligan and Fyfe, 2005). Essentially, not all voluntary organizations provide opportunities for volunteering in the same way; Milligan and Fyfe (2005) contend that large, ‘corporatist’ voluntary organizations, run largely by paid professionals, actually squeeze out opportunities for volunteering. We acknowledge their reminder that mere organizational presence is not a guarantee of opportunities to volunteer, but there is no feasible or economical way of obtaining detailed data on the extent to which the organizational ecology of each local authority is characterized by volunteer-led – as opposed to large, professionalized and bureaucratic – organizations.
Data and methods
We analyse data from the 2009–2010 Citizenship Survey (CS2009), which features a large representative sample of approximately 9300 adults from England and Wales. Respondents from Wales are removed because of our interest in the relative influence of the distribution of charities and of social deprivation: the Index of Deprivation we have used is calculated differently between the two countries. The data capture self-reported demographics, attitudes and behaviours of respondents including questions on civic engagement. Respondents were only selected for whom complete data for the dependent and independent variables were available, accounting for 7872 respondents living in 278 local authorities in England.
Dependent variable
The dependent variable is a dichotomous measure of whether or not a respondent reported formal volunteering (that is, volunteering through organizational structures rather than informal or ‘direct’ volunteering, that is directly supporting individuals in one’s immediate community) in the previous month. We choose formal volunteering as our outcome measure because the survey question specifically relates to giving unpaid help to one of a number of possible types of formal organization. The distribution of this variable can be found in Table 2. We have previously discussed whether our focus on charities means that sports clubs are underrepresented. For the same reason we considered excluding those voluntary acts that were concerned with sport, but we cannot unambiguously identify those who volunteer only in sports organizations. About half of those reporting volunteering in the survey stated that they ‘take part in’ sports groups, but that could include playing sport as well as volunteering. There is no way, from the survey data, of determining whether unpaid help was given to particular types of organizations. We therefore concluded that removal of sports-related volunteering was not feasible. Descriptive statistics for our measures of the distribution of charities are given in Table 2, which also includes our other independent variables, and our dependent variable, the likelihood of engagement in formal volunteering.
Descriptive statistics of dependent and independent variables (N = 7872).
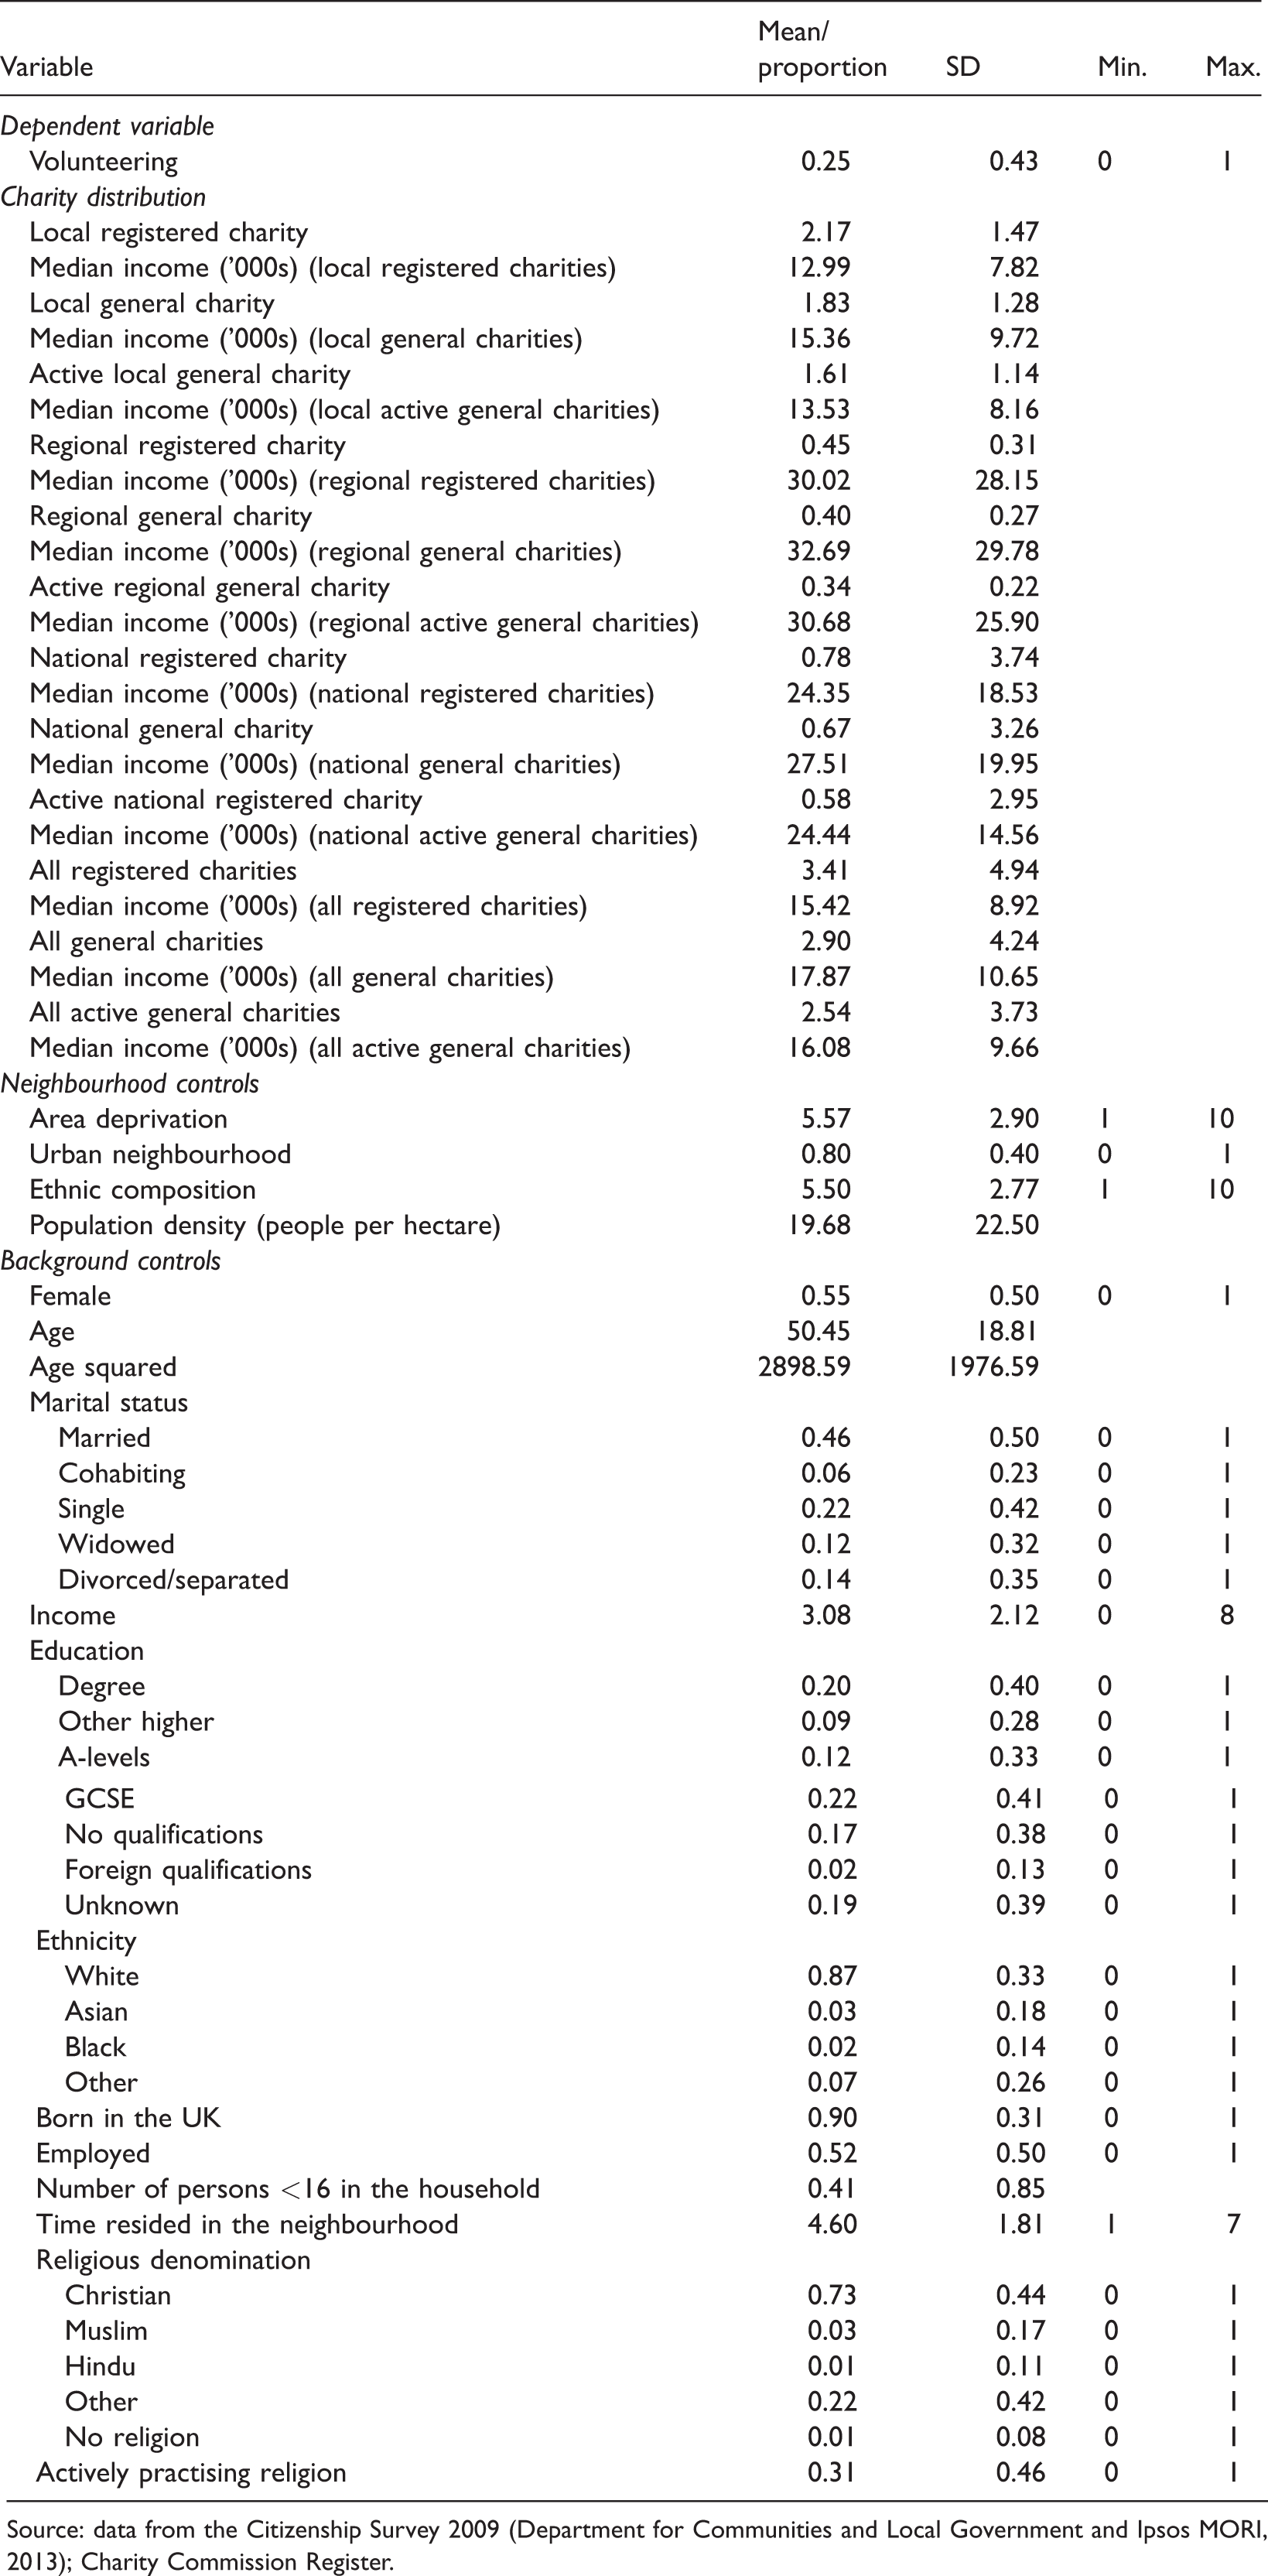
Source: data from the Citizenship Survey 2009 (Department for Communities and Local Government and Ipsos MORI, 2013); Charity Commission Register.
Independent variables
We merge the individual-level data contained in the Citizenship Survey with data contained in the Charity Commission Register. For each local authority we have 24 measures of charity distribution (the derivation of which has been described above): there are three classifications of charities (all registered; active; active general charities) and four measures of scale (local; regional; national/international; all charities in the local authority). For each of the 12 combinations of these we have the ratio of organizations per 1000 population, and the median expenditure.
We give an overview of the data on charity distributions in general terms and the following refers to the whole of England, not to the 278 local authorities included in the analysis. The ratio of organizations per 1000 population ranges from over 15 to under 1.5, with 11 local authorities more than two standard deviations above the mean of 3.31, including some London boroughs (Westminster; Camden; Islington) and six rural areas (Eden, Cotswold, South Lakeland, Derbyshire Dales, West Dorset and West Somerset). Locations with high levels of registered charities tend to be either large urban areas with significant numbers of charity HQs, or smaller rural districts. If we emphasize regional and national organizations, then the rankings and the distributions are very different: the pattern of organizations operating nationally or internationally is heavily dominated, as one would expect, by London local authorities, where organizations that say they operate nationally or internationally can account for over two-thirds of the total number of charities. The measures of the distribution of organizations operating at the within-local authority, within-region and national scales are correlated (see Table 3), and there is evidence, particularly for charities operating within one local authority, of very strong negative correlations with deprivation, echoing Clifford (2012) on the distribution of neighbourhood organizations.
Correlations between key variables in the analysis (N = 278).
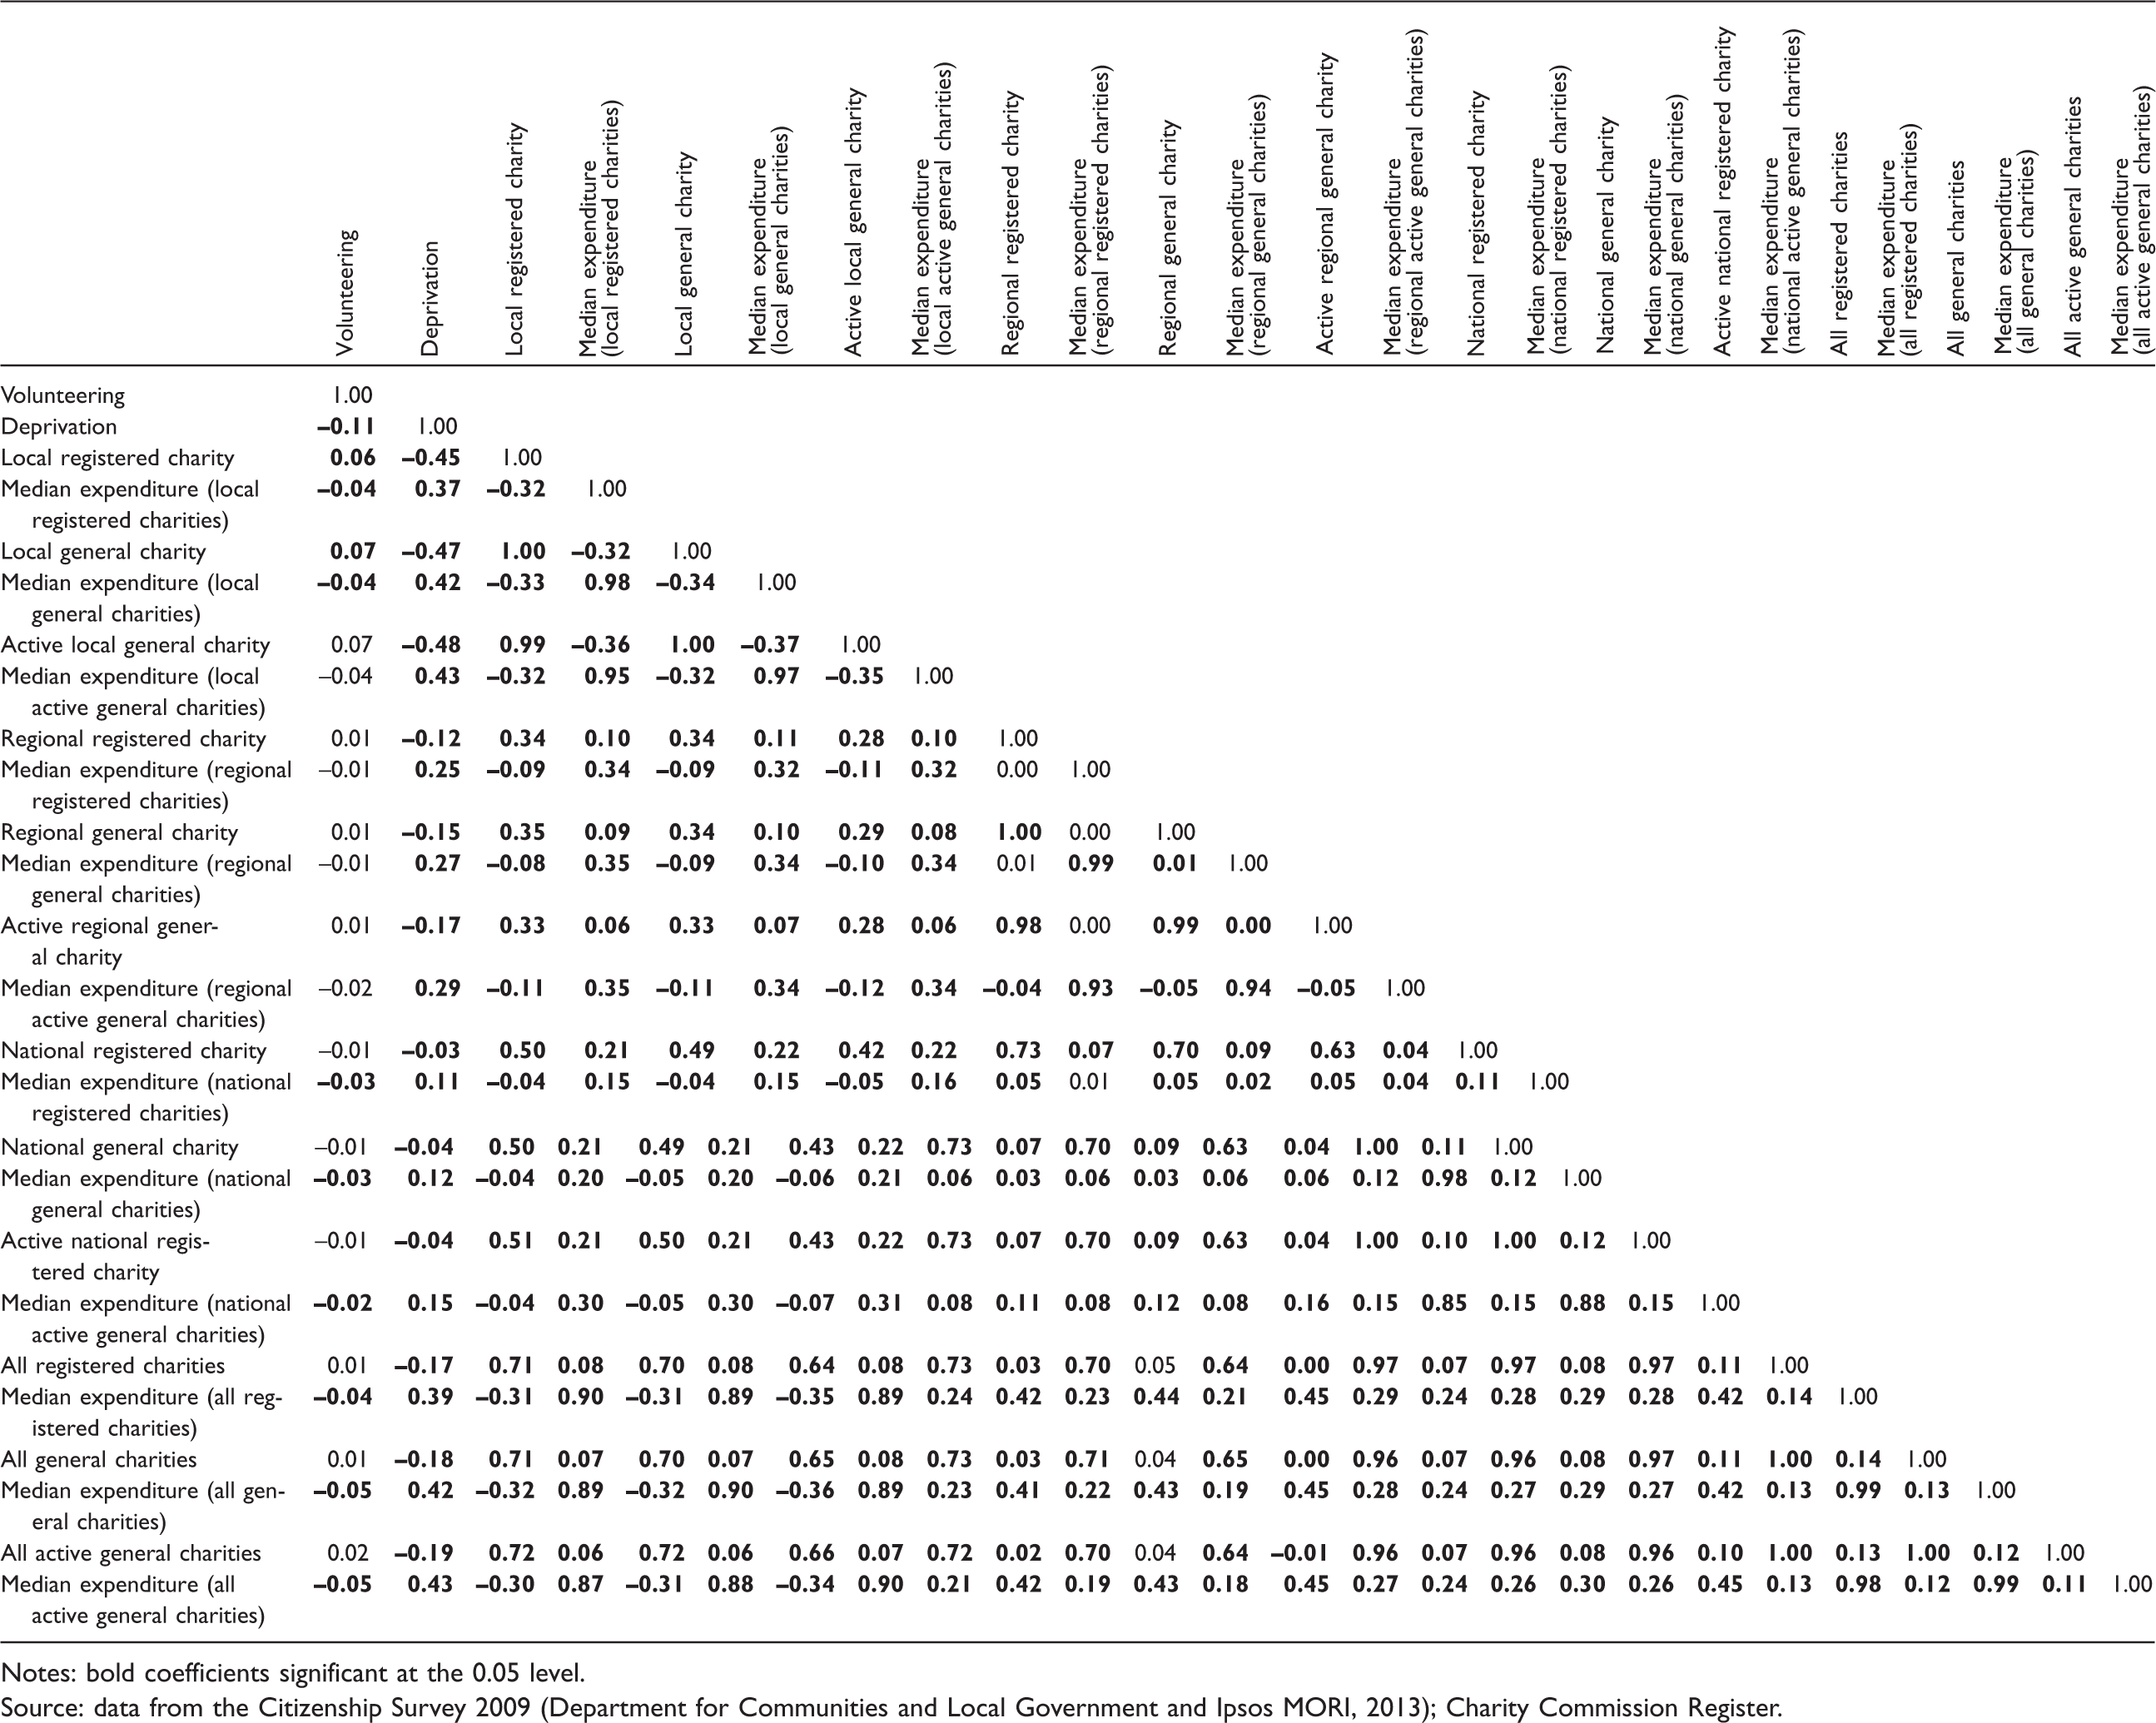
(continued)
In addition to measuring the distribution of registered charities, we also include the median expenditure of charities as a proxy for the level of resources available to a typical charity in each local authority. We also add other measures of socioeconomic context for local authorities: the level of deprivation, population density (people per hectare), ethnic composition and a dichotomous variable indicating whether the local authority is urban or rural. The urban–rural indicator classifies a place as ‘urban’ if it is a continuous built-up area with a population of greater than 10,000. We include this variable along with population density because they are measuring different aspects of context that may both influence voluntary engagement. The Index of Multiple Deprivation (IMD) is used to indicate contextual-level deprivation. The IMD is a composite measure created from data on the following characteristics: income; employment; health deprivation and disability; education skills and training; barriers to housing and services; crime; and the living environment. Previous studies find that it is a strong and robust negative predictor of most social cohesion indicators compared to other contextual measures (Laurence, 2011; Letki, 2008; Wiertz et al., 2015). Ethnic composition is measured as the percentage of minority ethnic households in the area and is introduced to allow testing of the influence of ethnic heterogeneity.
These contextual measures were matched to the local authority codes for each survey respondent. Local authorities are configured in relation to local community boundaries as well as physical features. The average population size of a local authority is around 160,000 people. This gives units that are much smaller in population terms than states of the USA, but we know that the great majority of voluntary organizations are local in focus (e.g. Clifford, 2012), suggesting that analysis at the within-local authority scale would be appropriate. We could link our survey responses to small-area census data (such as middle-level super output areas (MSOAs), which have average populations of about 10,000 people) to provide a better measure of local contextual conditions, but the implied assumption – that charities located in a MSOA act only within it – is much less tenable than if we use local authorities; moreover, when charities report where they operate, they name local authorities, not small-area units such as MSOAs. We were able, with permission and the cooperation of the Secure Data Service, to link the information on survey respondents to data for ratios of charitable organizations to population for local authorities in England. The number of respondents in each local authority ranges from 2 to 159, with a mean of 29. We also follow previous studies and conduct sensitivity checks in the analyses (Mohan et al., 2006: 272), restricting samples to at least 25 people per local authority; however, the results do not change (see Appendix A)
Individual-level variables
We also control for relevant individual-level demographic variables that have been associated with volunteering in past studies, capturing the respondent’s sex, age, marital status, income, educational level, social class, ethnicity, birth location, employment status, number of people in the household, number of children in the household, health status, religious affiliation, housing tenure, length of residence in an area and whether the respondent is actively practising their religion. Age is a continuous variable that ranges from 16 to 69, and a squared term is also included to account for the curvilinear relationship reported by the majority of previous studies (Wilson, 2000). Controls for marital status, level of education, income, ethnic groups, whether or not the respondent was born in the UK or the Republic of Ireland, religious affiliation, whether the respondent was actively practising their religion and employment status all take the form of dummy variables coded 1 for each separate category of these variables. Income is controlled for using an ordinal scale that reflects the eight categories of gross annual income provided in the survey. We control for the number of people in the respondent’s household, which ranges from 1 to 10, and the number of children below the age of 16 in the household. We also include the length of time spent in a neighbourhood (‘less than a year’, ‘1–2 years’, ‘3–5 years’, ‘6–10 years’, ‘11–20 years’, ‘21–30 years’ and ‘more than 30 years’).
Analytical strategy and results
Our dichotomous dependent variable is estimated using multilevel logistic regression to account for the clustering of respondents in local authorities (Snijders and Bosker, 1999). All continuous independent variables were mean-centred.
Each contextual measure capturing the distribution of charities is estimated in a full model alongside all individual-level and contextual-level variables. We have 12 separate measures for the distribution of charities across local authorities (local registered charities; local general charities; active local general charities; regional registered charities; regional general charities; active regional general charities; national registered charities; national general charities; active national general charities; all registered charities; all general charities; and all active general charities).
Our interest is in whether or not, once we control for individual-level and contextual-level characteristics, it is possible to detect any significant effects of the distribution of charitable organizations on the likelihood of engaging in voluntary action.
Bivariate relationships
We first present the bivariate relationship between the proportion of volunteers and the distribution of local (Figure 1), regional (Figure 2) and national (Figure 3) charity organizations per local authority, with a best-fit line to aid interpretation. The figures depict a substantively large positive relationship between the distribution of local charities and the proportion of volunteers per local authority (r = 0.32, p < 0.001), and a substantively small positive relationship between regional charities (r = 0.06, p < 0.001) and the proportion of volunteers per local authority. The relationship between the distribution of national charities and the proportion of volunteers per local authority is substantively small but negative (r = –0.03, p < 0.001).
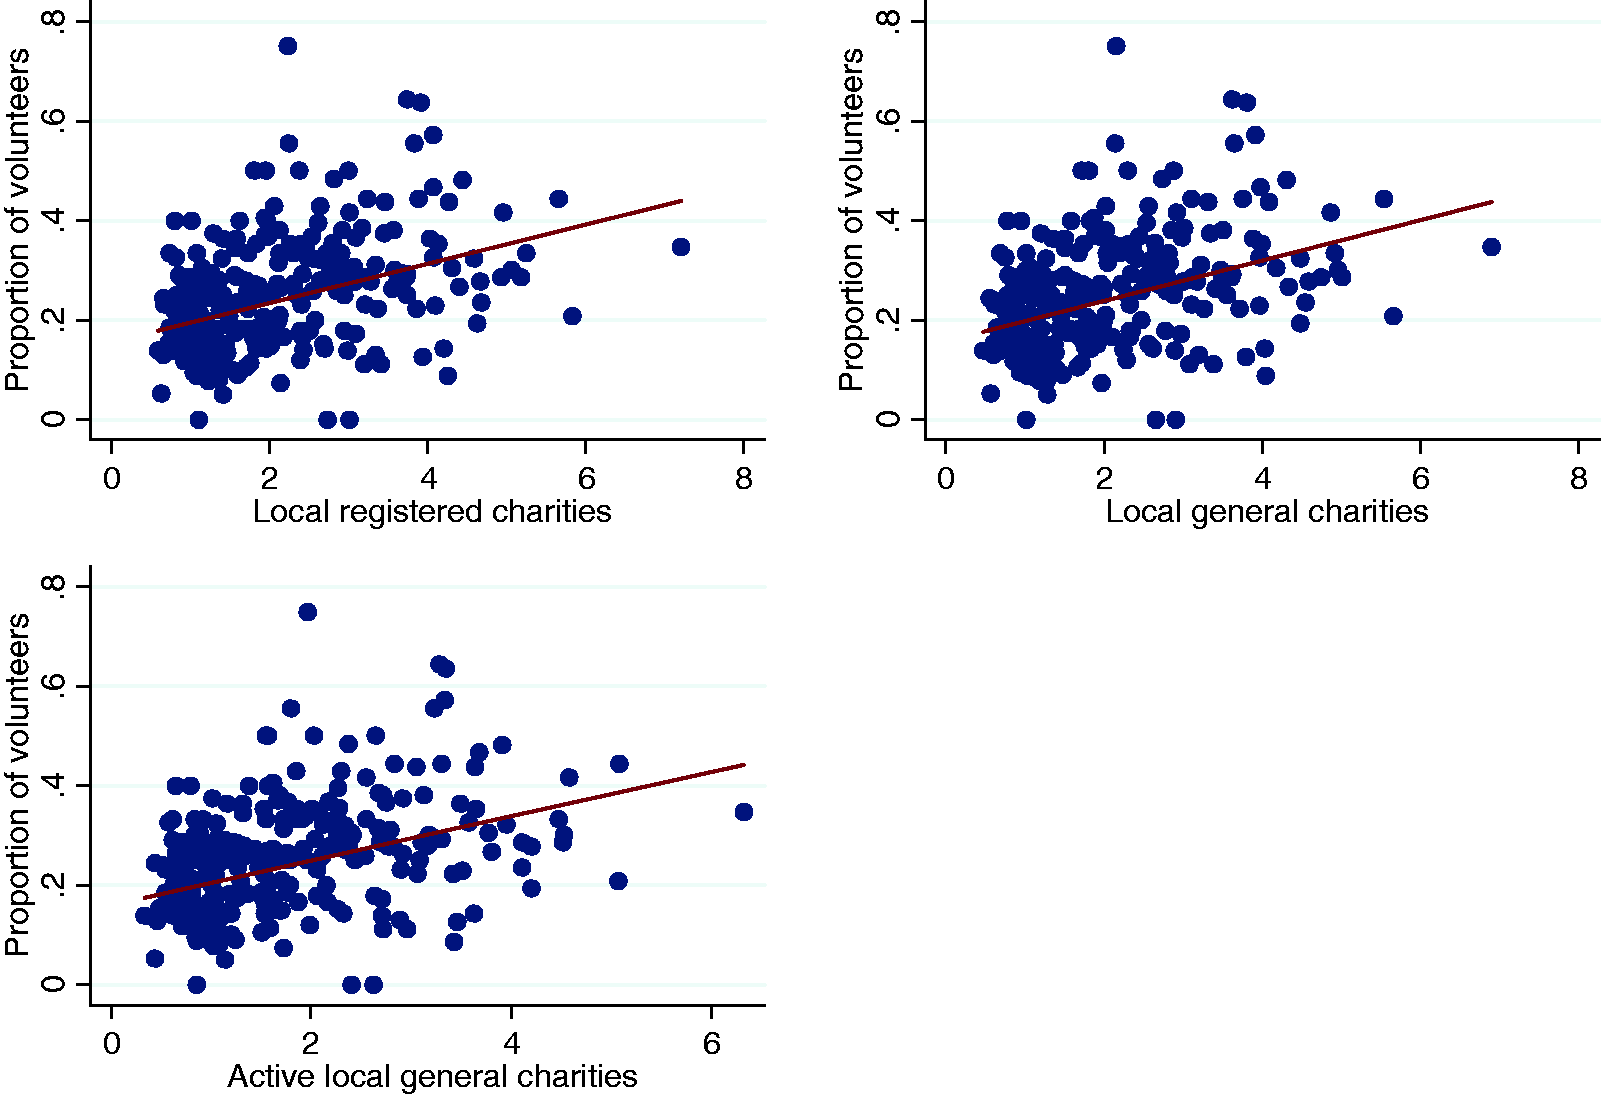
Bivariate relationship between volunteering and the distribution of local charities across local authorities in England.
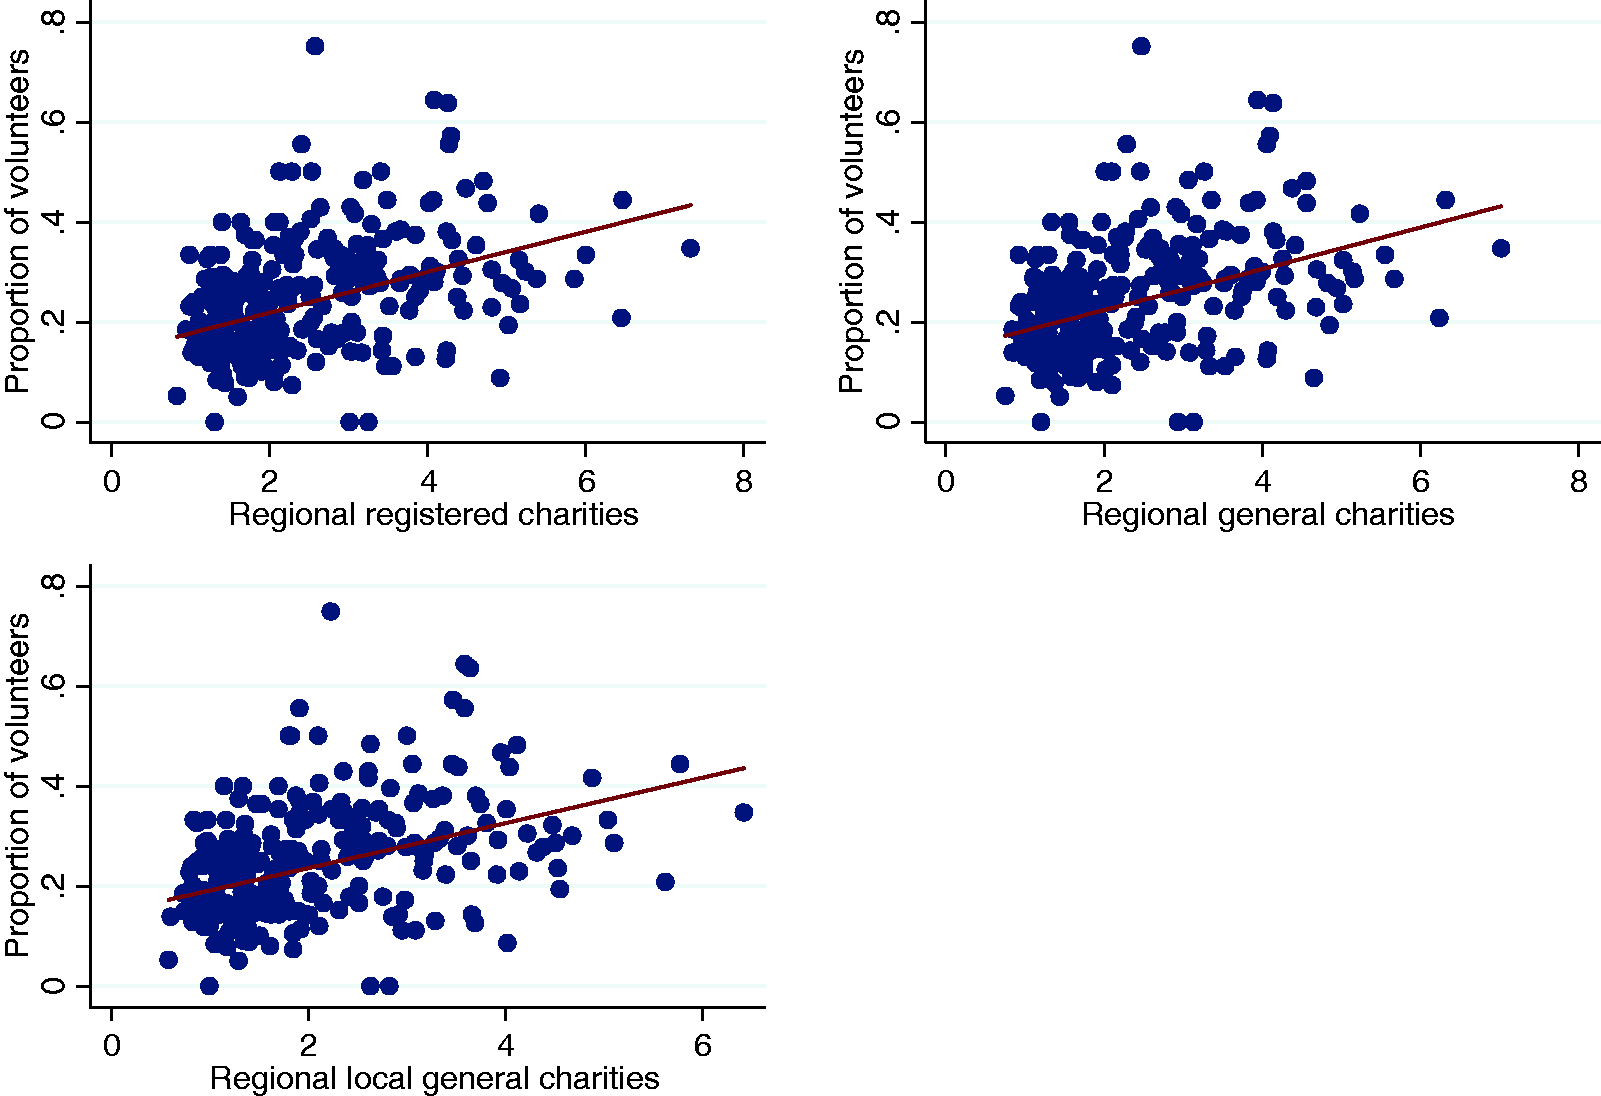
Bivariate relationship between volunteering and the distribution of regional charities across local authorities in England.
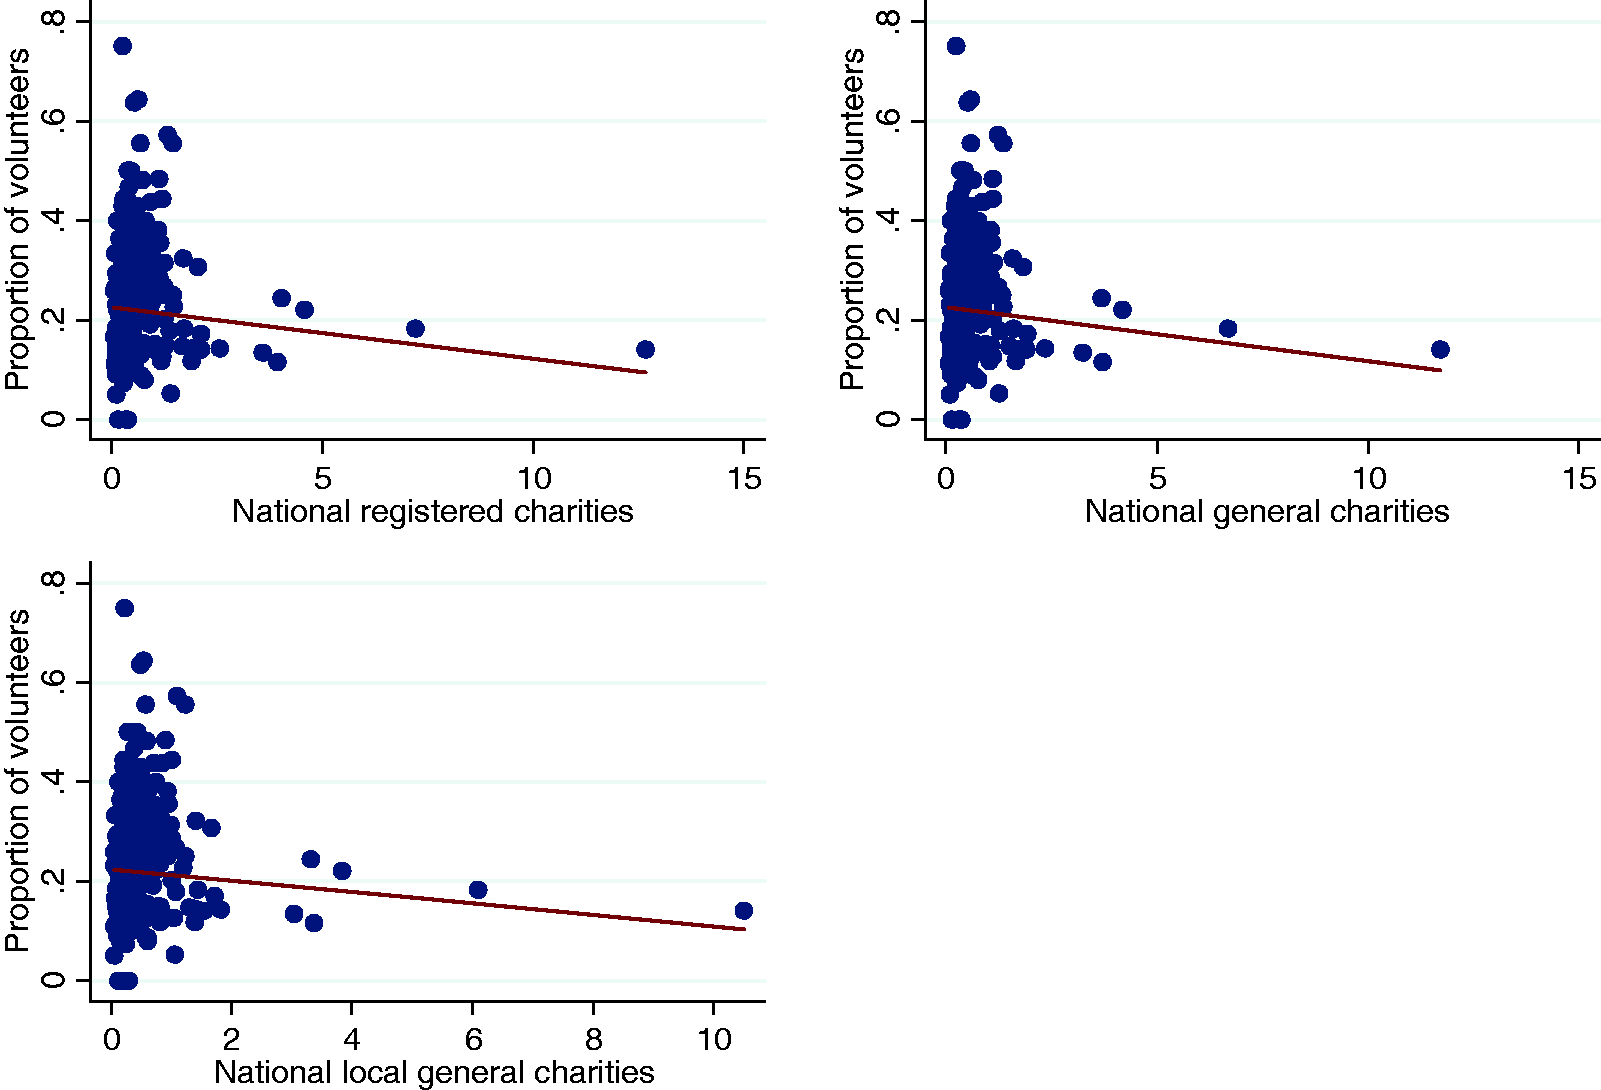
Bivariate relationship between volunteering and the distribution of national charities across local authorities in England.
We also use a measure that combines all charities of a certain type into a single measure (for example all registered charities combines all registered charities at the local, regional and national levels). Figure 4 demonstrates that there is a positive relationship between this measure and the proportion of volunteers in the local authority (r = 0.08, p < 0.001). Previous British studies have demonstrated a strong relationship between levels of area deprivation and levels of volunteering (McCulloch et al., 2012; Mohan et al., 2006; Williams, 2003). Our analysis echoes these findings; Figure 5 depicts this clear negative relationship between the level of area deprivation and the proportion of volunteers per local authority (r = –0.52, p < 0.001).
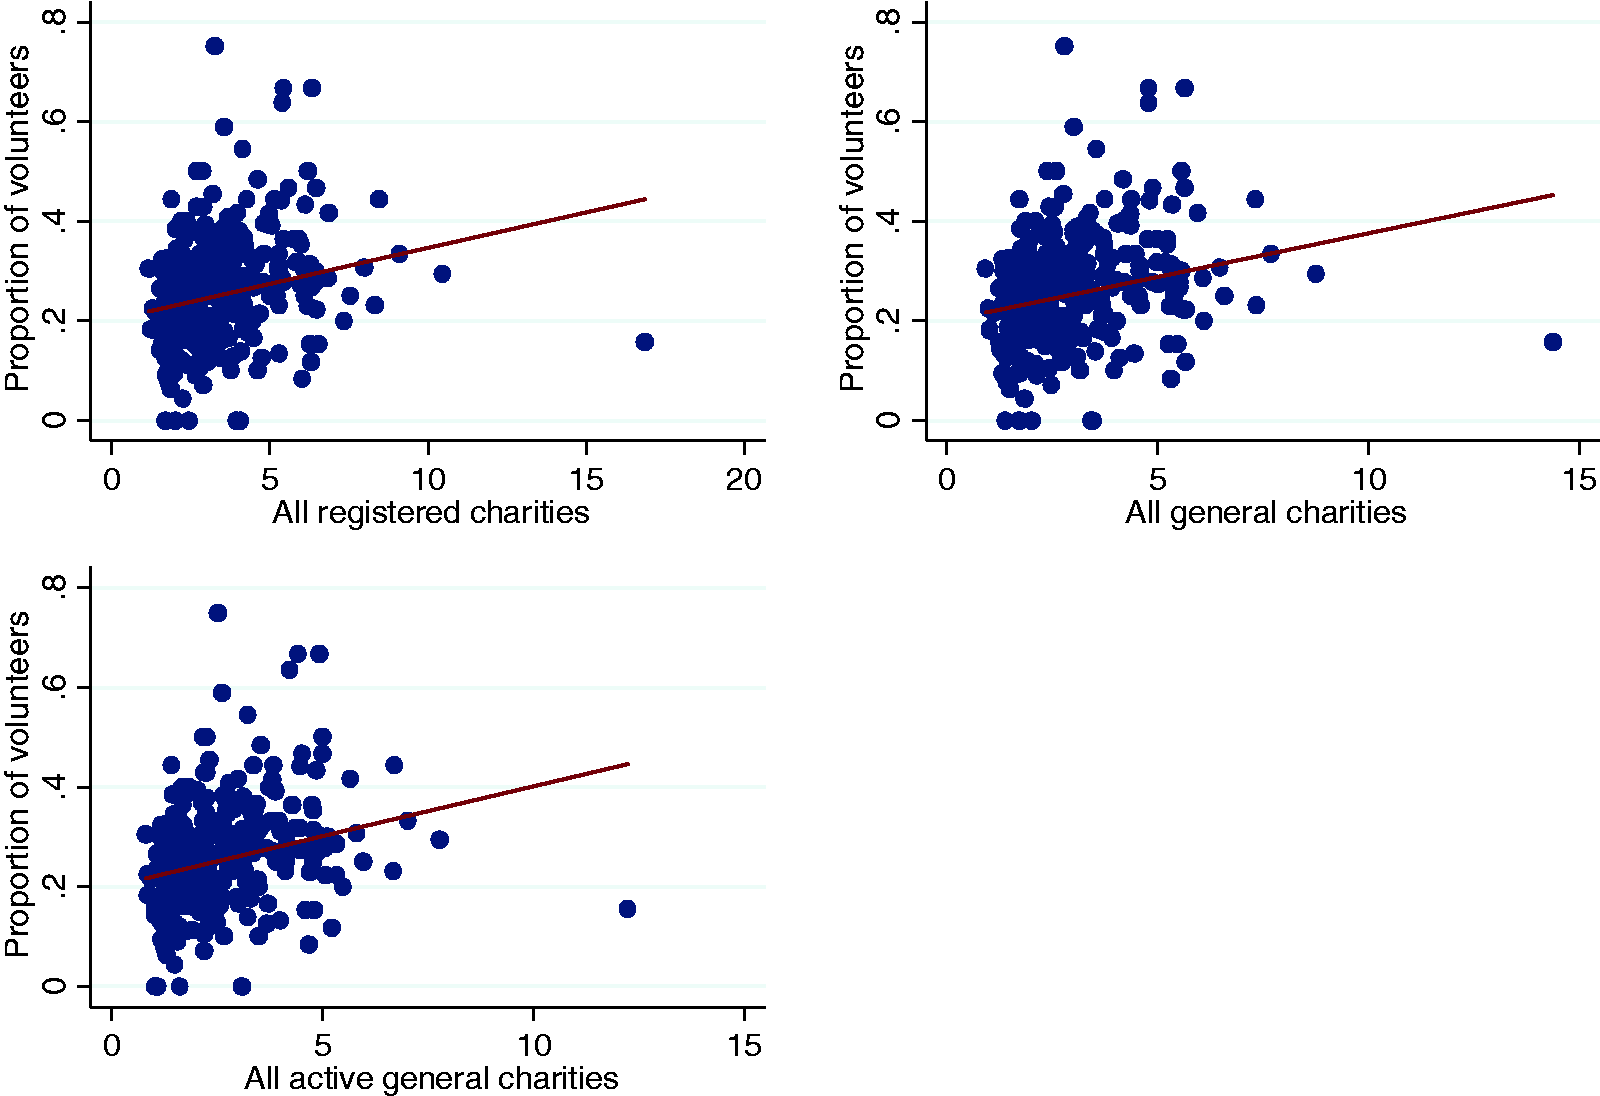
Bivariate relationship between volunteering and the distribution of all charities across local authorities in England.
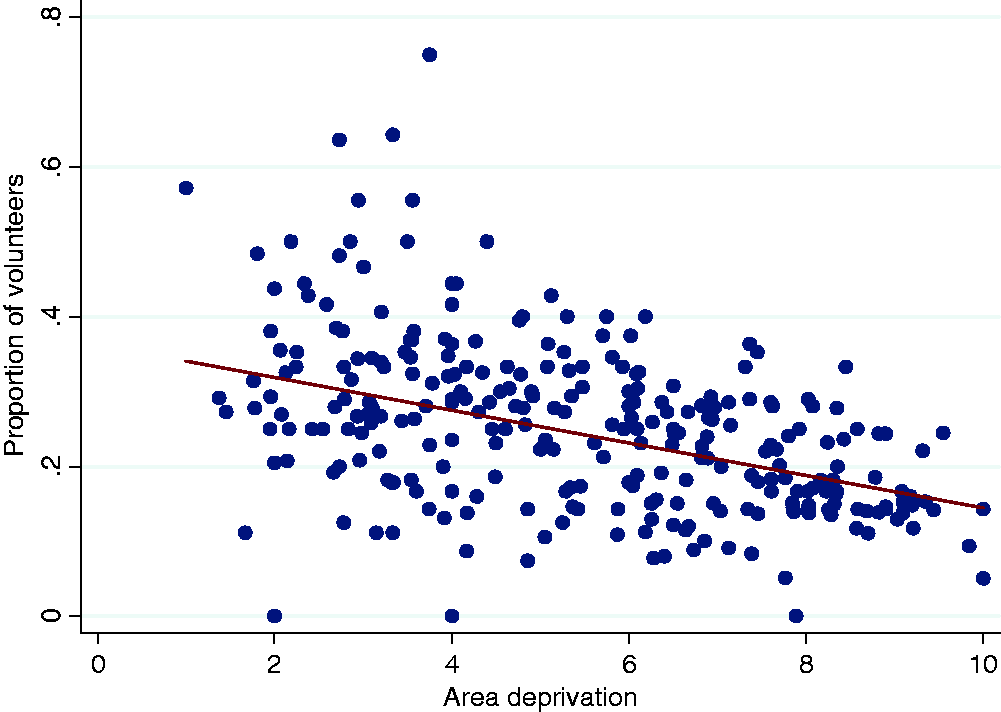
Bivariate relationship between volunteering and area deprivation across local authorities in England.
These illustrations are the first of their kind in England because it has not hitherto been feasible to calculate measures of volunteering for local authorities using nationally representative survey data. Generally we find a positive association between the distribution of voluntary organizations that operate at either the within-local authority (substantively big), or within-region scales (substantively small), and the level of volunteering. There is no such association with the distribution of charities operating at the national or international scales. The relationship between volunteering rates and the level of deprivation in a local authority is also strongly negative: in disadvantaged areas volunteering rates are lower. What community-level influences might account for these differences? In our presentation, we focus not on the effects of individual characteristics where our analyses are consistent with the wider body of literature on volunteering (results available on request); instead, we discuss the independent effects of contextual predictors, particularly the distribution of charitable organizations.
Multilevel logit regression results
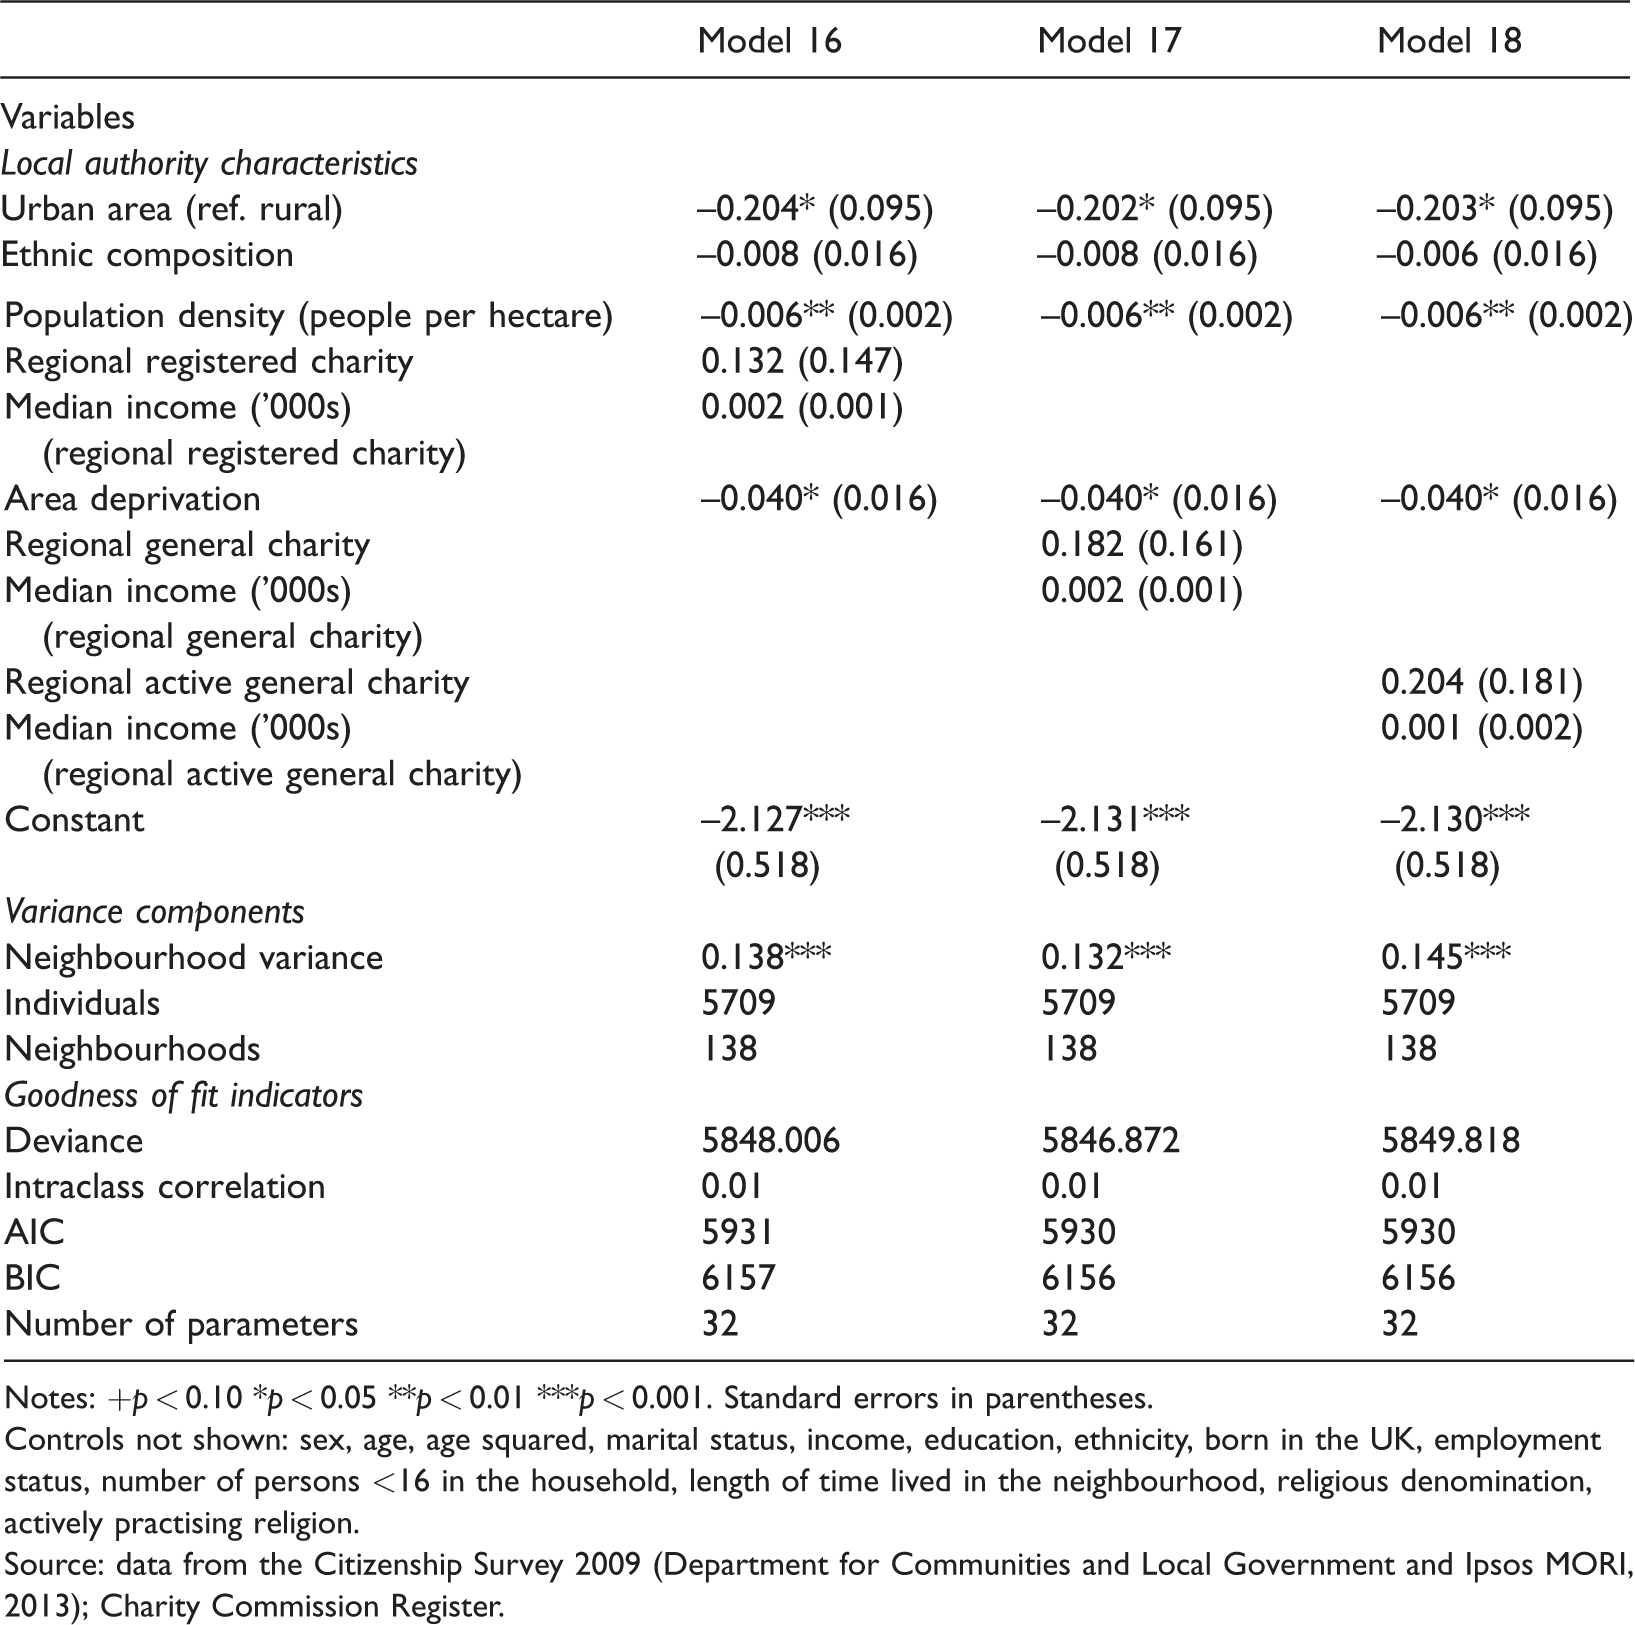
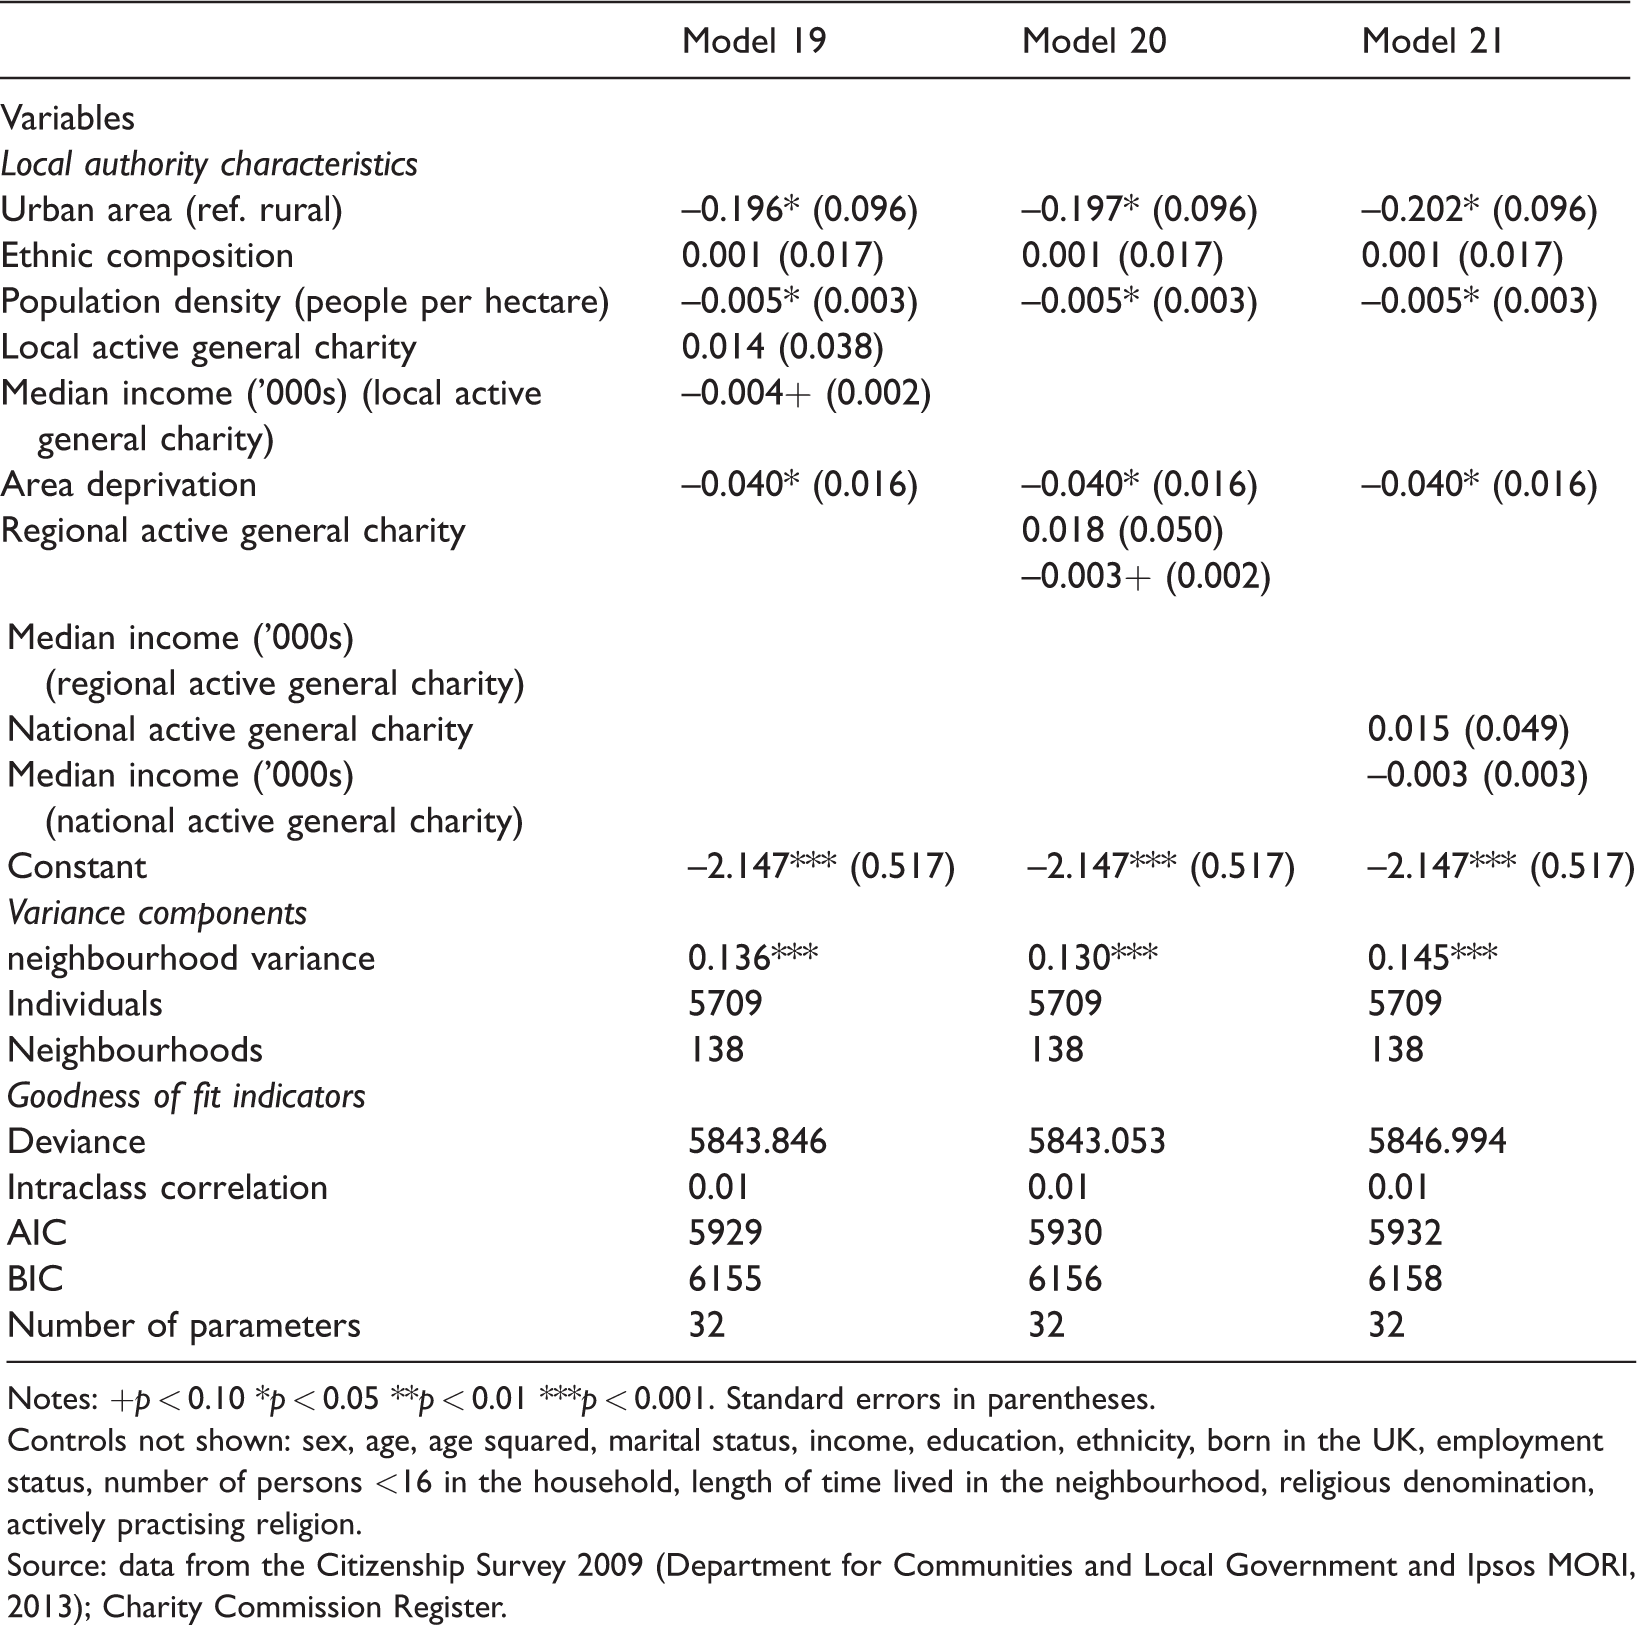
Tables 4 and 5 present the multilevel logit regression results for the distribution of local, regional and national charities, and aggregated charities, respectively. As can be seen, for the three models featuring measures of charities operating locally (models 1, 2 and 3), increases in the ratio of charities to population are associated with an increased probability of volunteering. The logit coefficients across these models range from 0.036 and 0.060, accounting for between 1.037 and 1.062 greater odds of volunteering (exp(0.036) and exp(0.060), respectively). It is noteworthy that the largest effect is that for the active, general charities, which (as argued above) offers a better approximation to the number of organizations that are likely to be recruiting volunteers. Conversely, there was not a statistically significant effect on volunteering of the distribution of regional charities, national charities and the entire universe of charities (models 4–12) in a local authority. Figure 6 depicts this relationship. Substantively, Figure 6 indicates that levels of volunteering increase substantially as the ratio of local charities to population increases. The indicators of median charity expenditures for local authorities were not associated with the likelihood of volunteering.
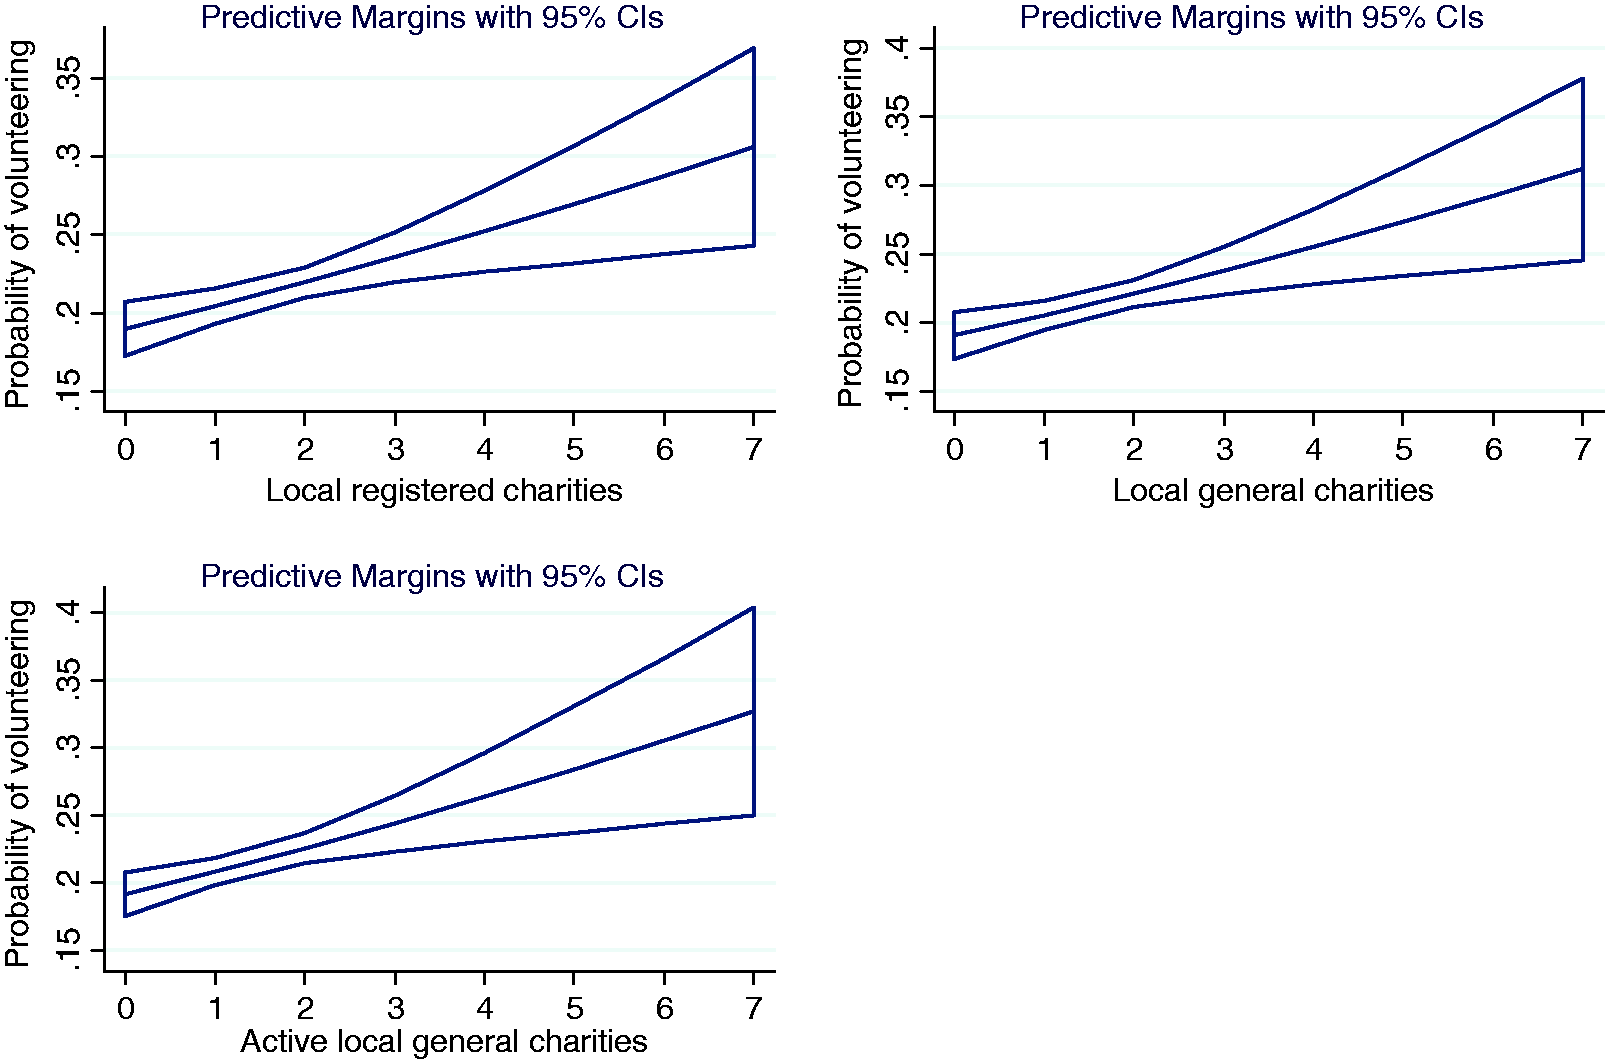
Estimated effect of the distribution of local charities in local authorities on the probability of volunteering.
Multilevel logit regression models predicting the instances of volunteering in the past month according to the distribution of charities operating at the local authority (models 1–3) and regional (models 4–6) scales for local authorities in England.
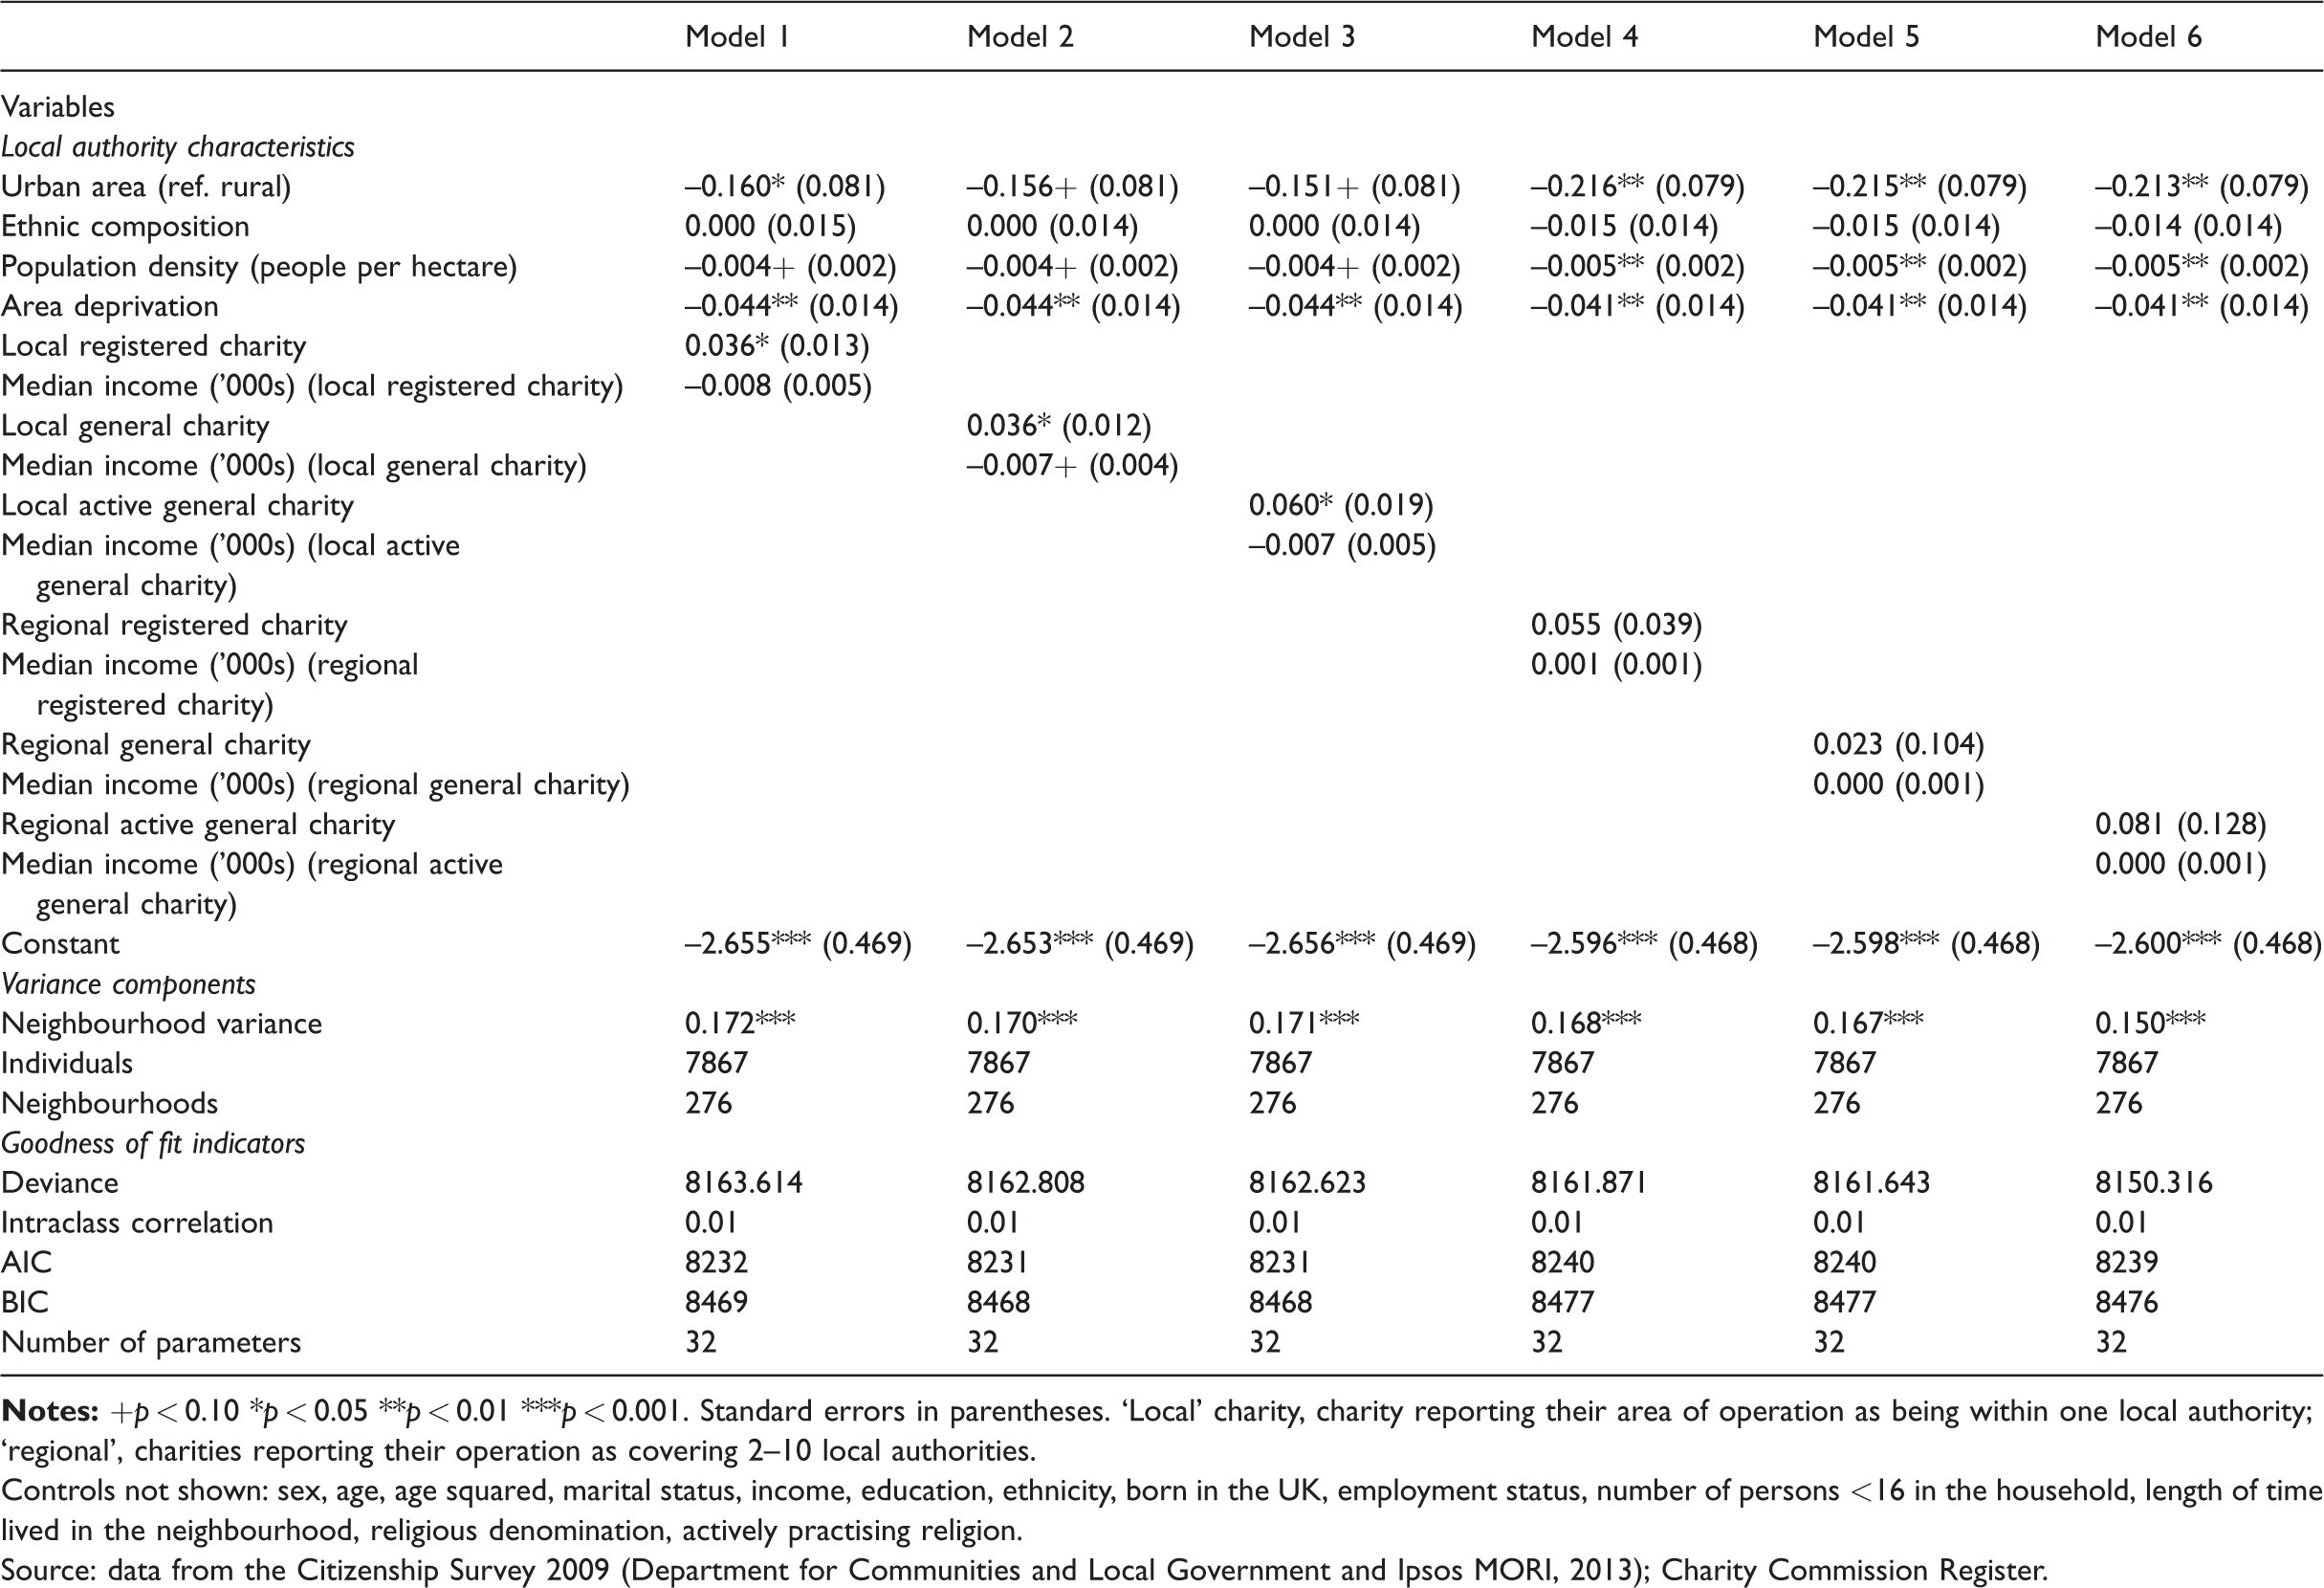
Controls not shown: sex, age, age squared, marital status, income, education, ethnicity, born in the UK, employment status, number of persons <16 in the household, length of time lived in the neighbourhood, religious denomination, actively practising religion.
Source: data from the Citizenship Survey 2009 (Department for Communities and Local Government and Ipsos MORI, 2013); Charity Commission Register.
Multilevel logit regression models predicting the instance of volunteering in the past month according to the distribution of (1) charities operating at the national or international scales (models 7–9) and (2) all charities combined (models 10–12), for local authorities in England.
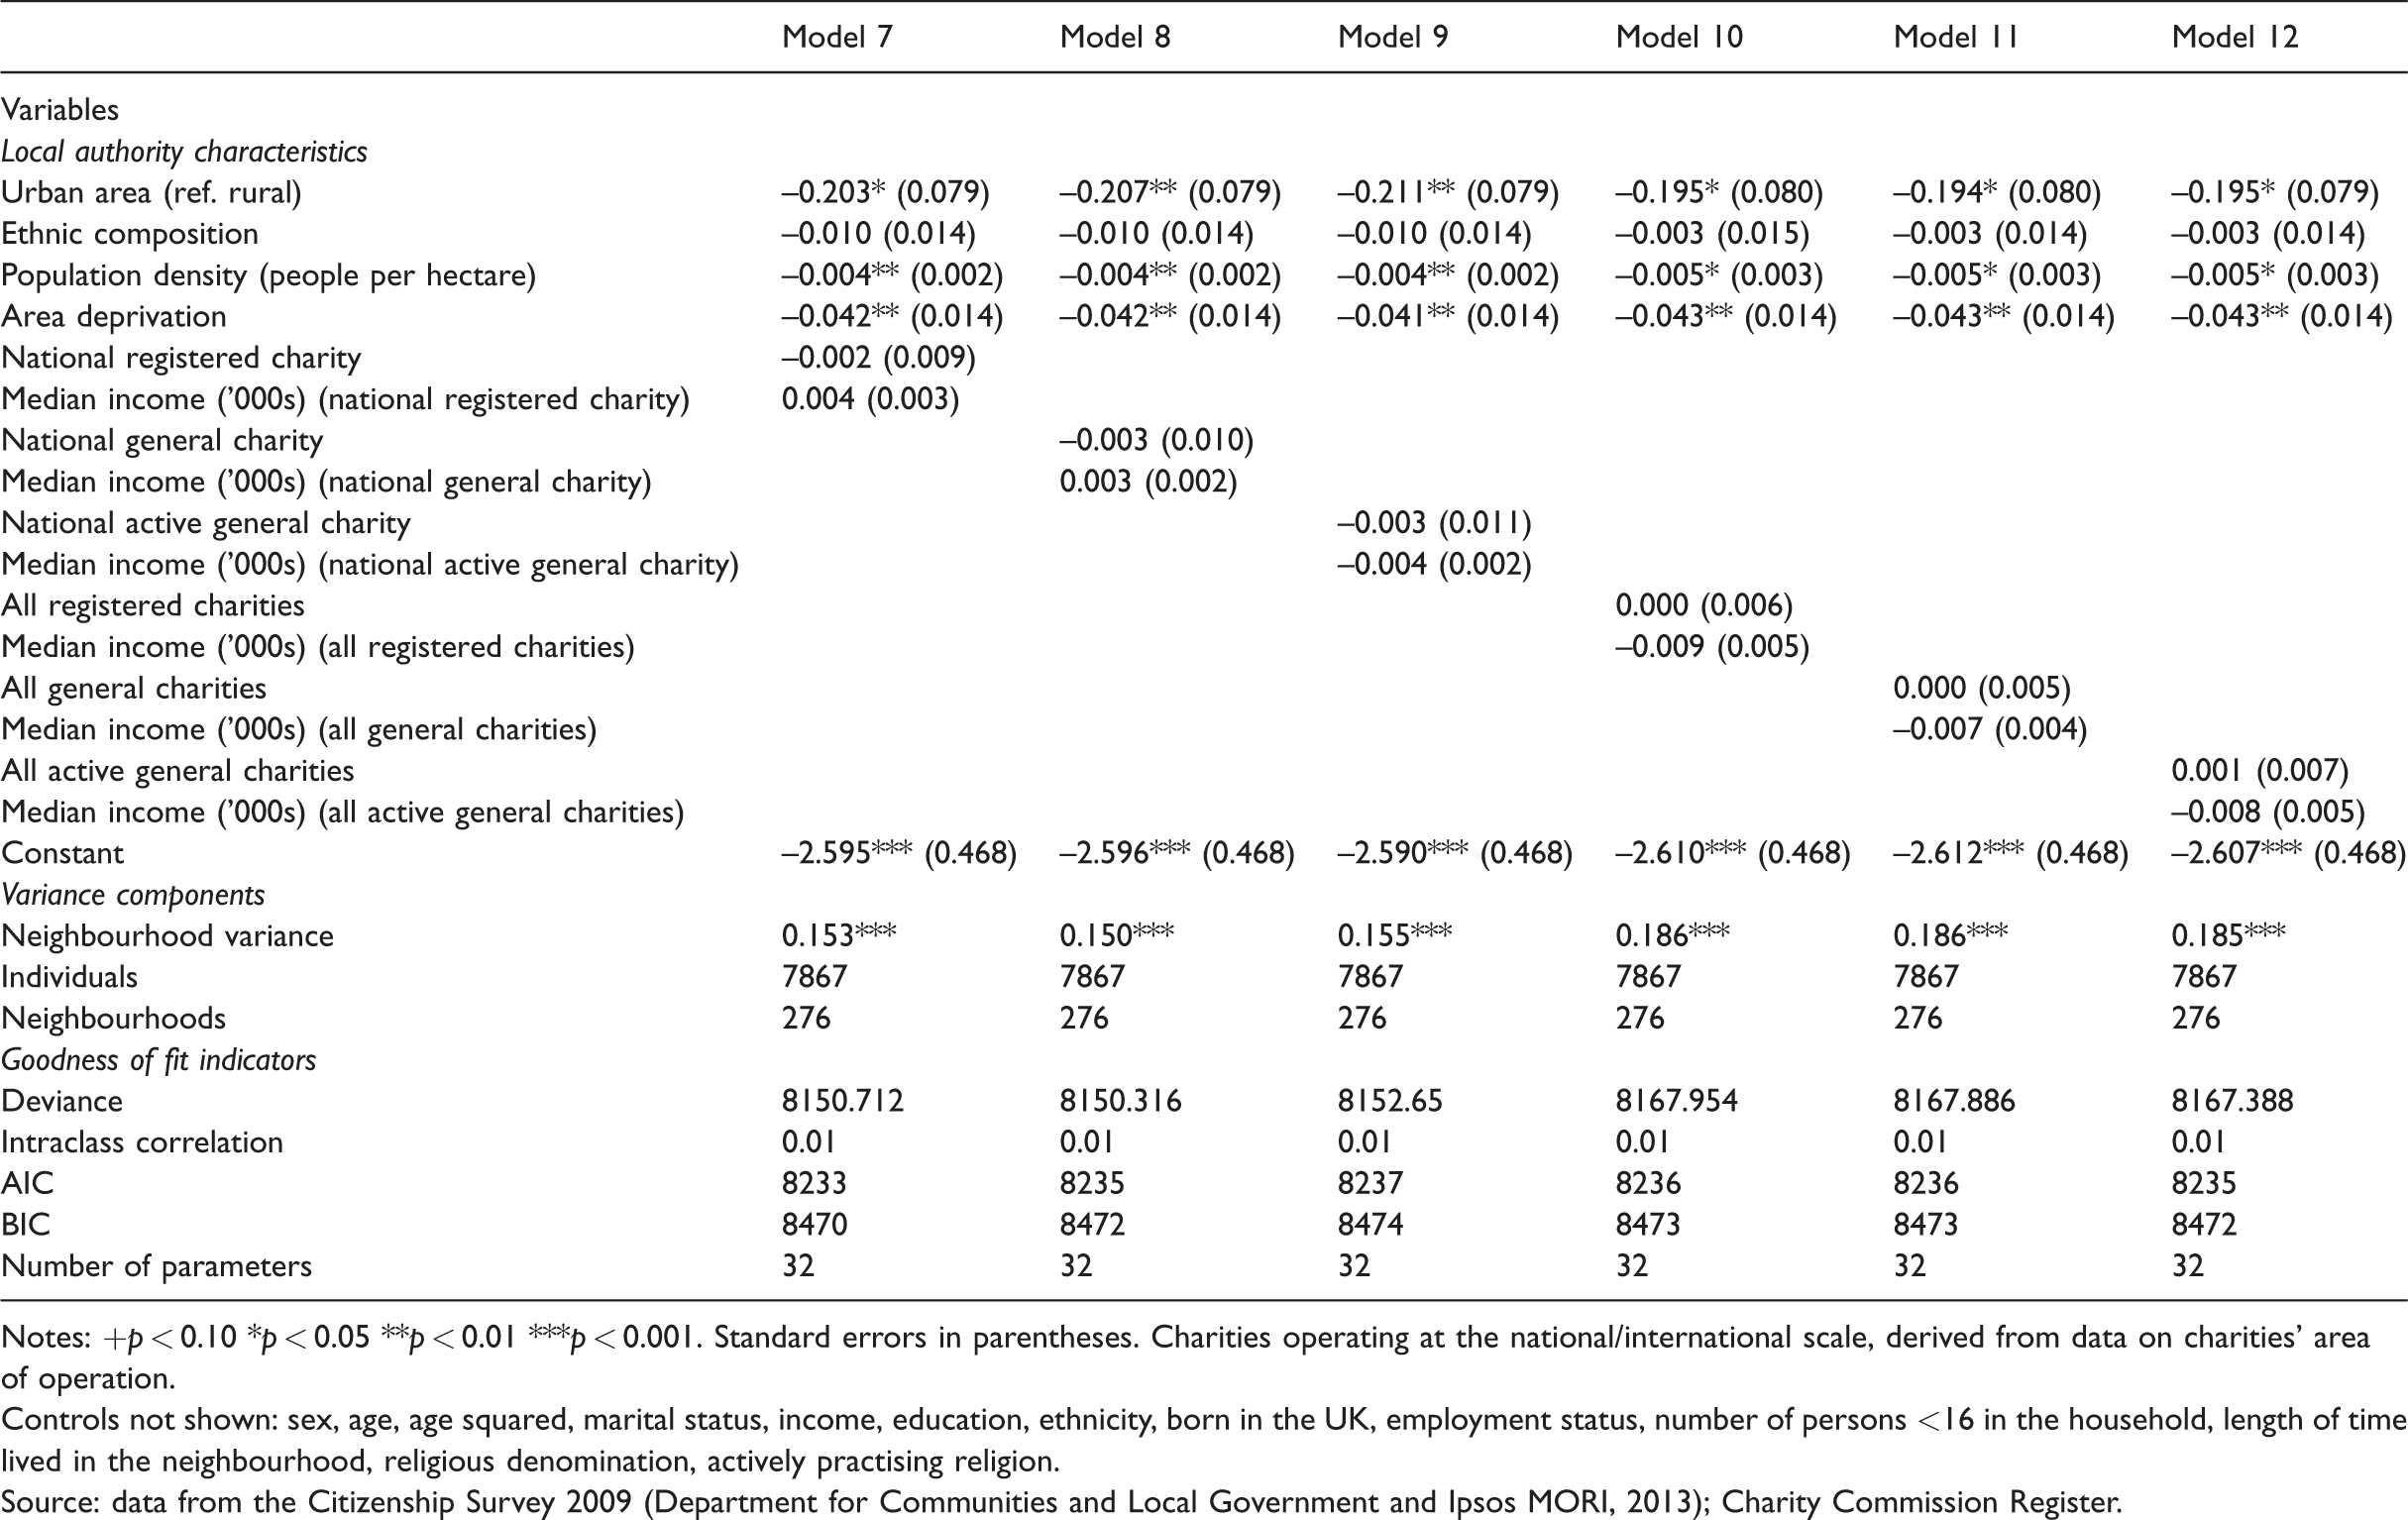
Notes: +p < 0.10 *p < 0.05 **p < 0.01 ***p < 0.001. Standard errors in parentheses. Charities operating at the national/international scale, derived from data on charities’ area of operation.
Controls not shown: sex, age, age squared, marital status, income, education, ethnicity, born in the UK, employment status, number of persons <16 in the household, length of time lived in the neighbourhood, religious denomination, actively practising religion.
Source: data from the Citizenship Survey 2009 (Department for Communities and Local Government and Ipsos MORI, 2013); Charity Commission Register.
Robustness checks with at least 25 observations per local authority. Multilevel logit regression models predicting the instance of volunteering in the past month according to the distribution of local charities in local authorities in England.
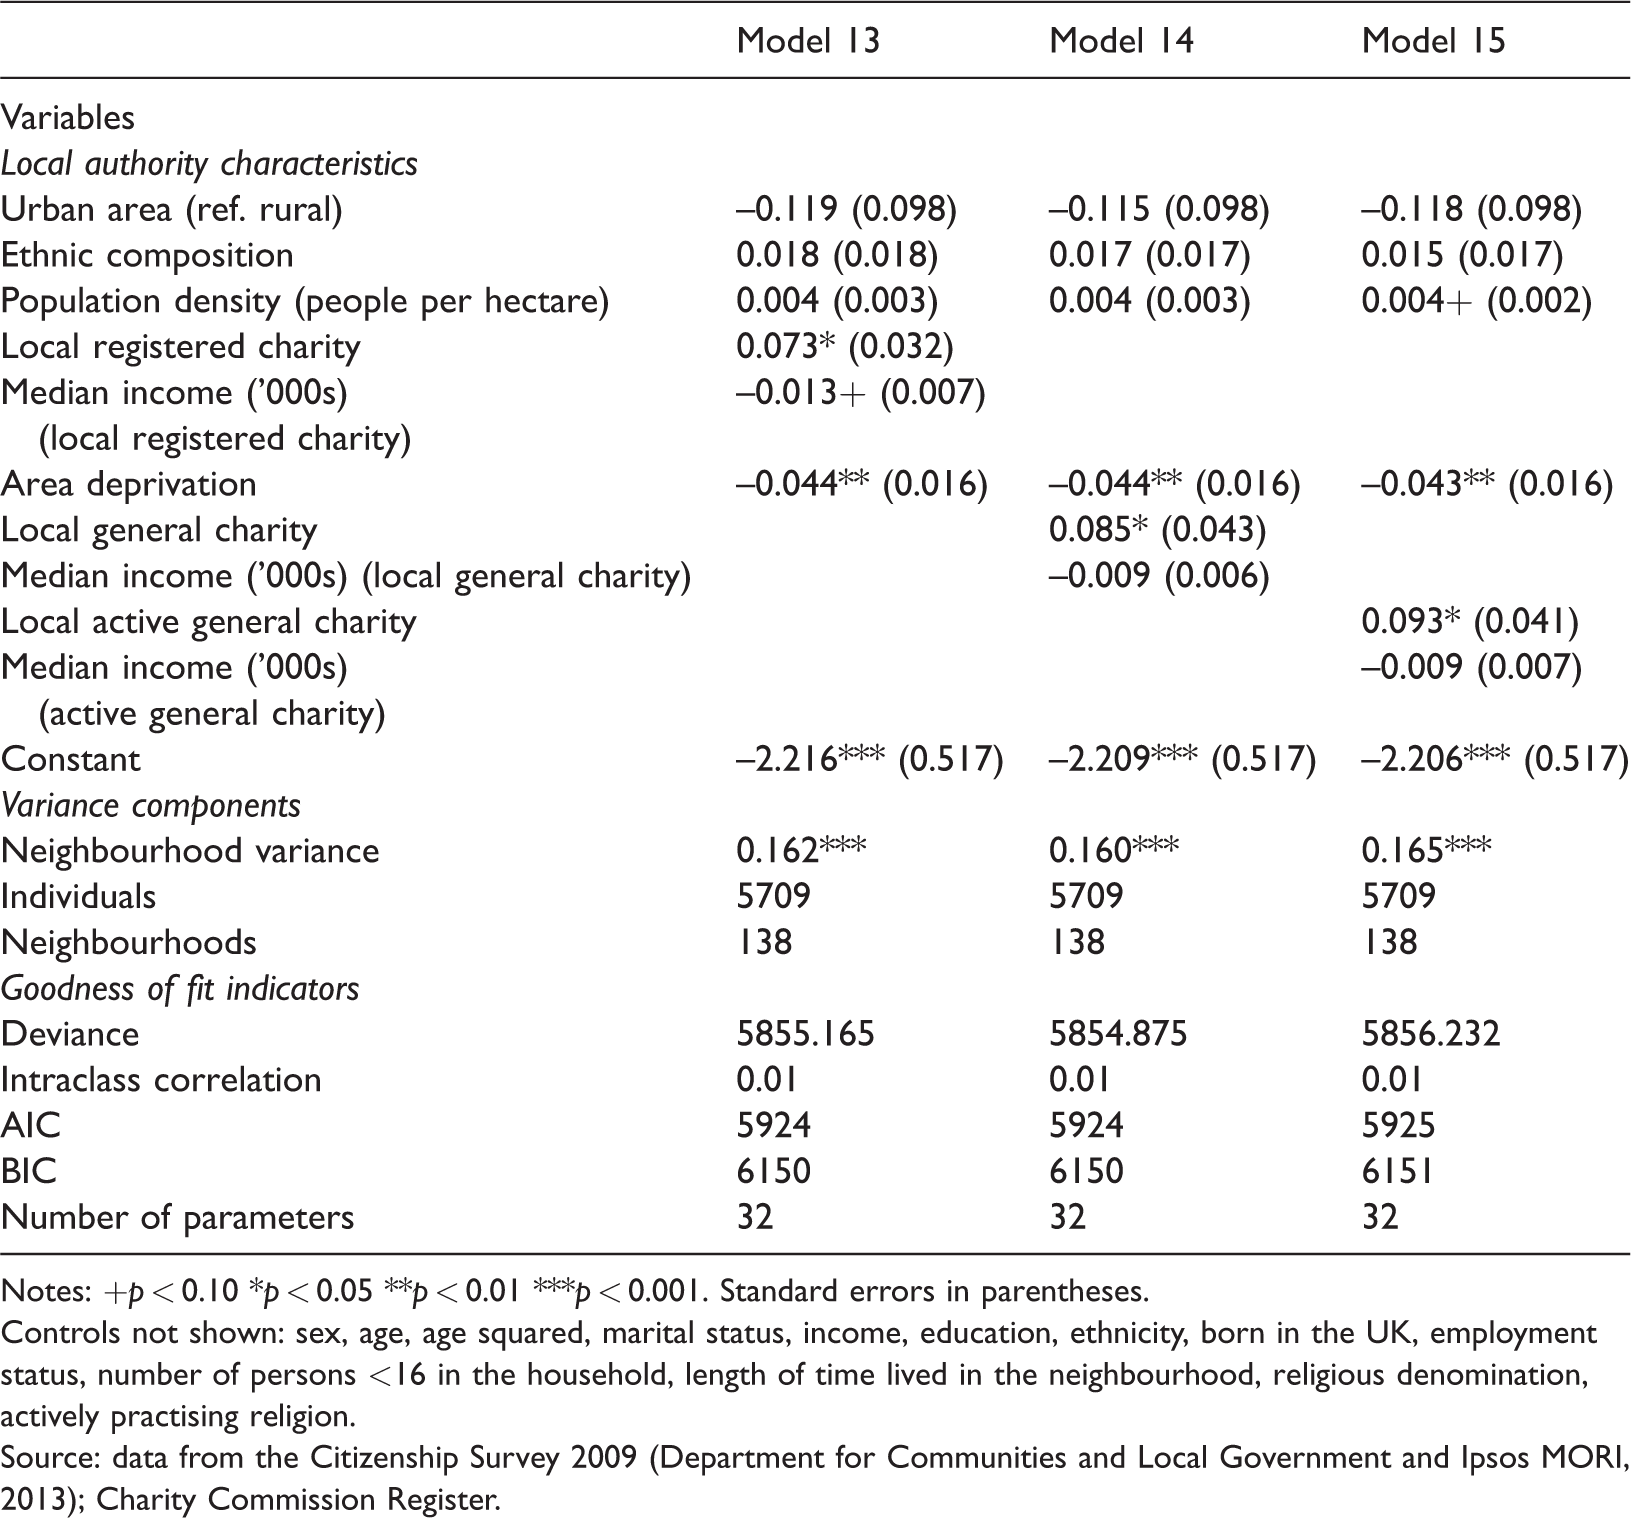
Notes: +p < 0.10 *p < 0.05 **p < 0.01 ***p < 0.001. Standard errors in parentheses.
Controls not shown: sex, age, age squared, marital status, income, education, ethnicity, born in the UK, employment status, number of persons <16 in the household, length of time lived in the neighbourhood, religious denomination, actively practising religion.
Source: data from the Citizenship Survey 2009 (Department for Communities and Local Government and Ipsos MORI, 2013); Charity Commission Register.
Robustness checks with at least 25 observations per local authority. Multilevel logit regression models predicting the instance of volunteering in the past month according to the distribution of regional charities in local authorities in England.
Notes: +p < 0.10 *p < 0.05 **p < 0.01 ***p < 0.001. Standard errors in parentheses.
Controls not shown: sex, age, age squared, marital status, income, education, ethnicity, born in the UK, employment status, number of persons <16 in the household, length of time lived in the neighbourhood, religious denomination, actively practising religion.
Source: data from the Citizenship Survey 2009 (Department for Communities and Local Government and Ipsos MORI, 2013); Charity Commission Register.
Robustness checks with at least 25 observations per local authority. Multilevel logit regression models predicting the instance of volunteering in the past month according to the distribution of national charities in local authorities in England.
Notes: +p < 0.10 *p < 0.05 **p < 0.01 ***p < 0.001. Standard errors in parentheses.
Controls not shown: sex, age, age squared, marital status, income, education, ethnicity, born in the UK, employment status, number of persons <16 in the household, length of time lived in the neighbourhood, religious denomination, actively practising religion.
Source: data from the Citizenship Survey 2009 (Department for Communities and Local Government and Ipsos MORI, 2013); Charity Commission Register.
These models also demonstrate that people living in urban areas have a significantly lower probability of volunteering compared to those living in a rural area. Population density was also associated (though only at the 10% level of significance in one of the models) with volunteering. Both of these are intuitively what would be expected and this result is consistent with previous literature – residence in smaller communities, where individuals are more likely to know their co-residents better, is likely to result in elevated levels of engagement; the measures are both capturing this phenomenon in slightly different ways. The ethnic composition of local authorities was not associated with volunteering.
Social deprivation has a negative association with the likelihood of volunteering, over and above the effect of individual-level characteristics. The results demonstrate that the likelihood of volunteering is greatest in an area of low deprivation and lowest in an area of high deprivation. This effect is independent of compositional effects in the model, that is the social class, education and income of individuals, which, for the most part, are also significant predictors of volunteering. The logit coefficients for social deprivation across these models range from –0.041 to –0.043, accounting for between 0.960 and 0.958 smaller odds of volunteering (exp(–0.041) and exp(–0.043), respectively). Figure 7 gives an example of the negative effect of deprivation on the probability of volunteering. The effect of community-level deprivation is likely to operate through low levels of resources, weaker social networks and limited (bridging) connections to the wider society (McCulloch et al., 2012).
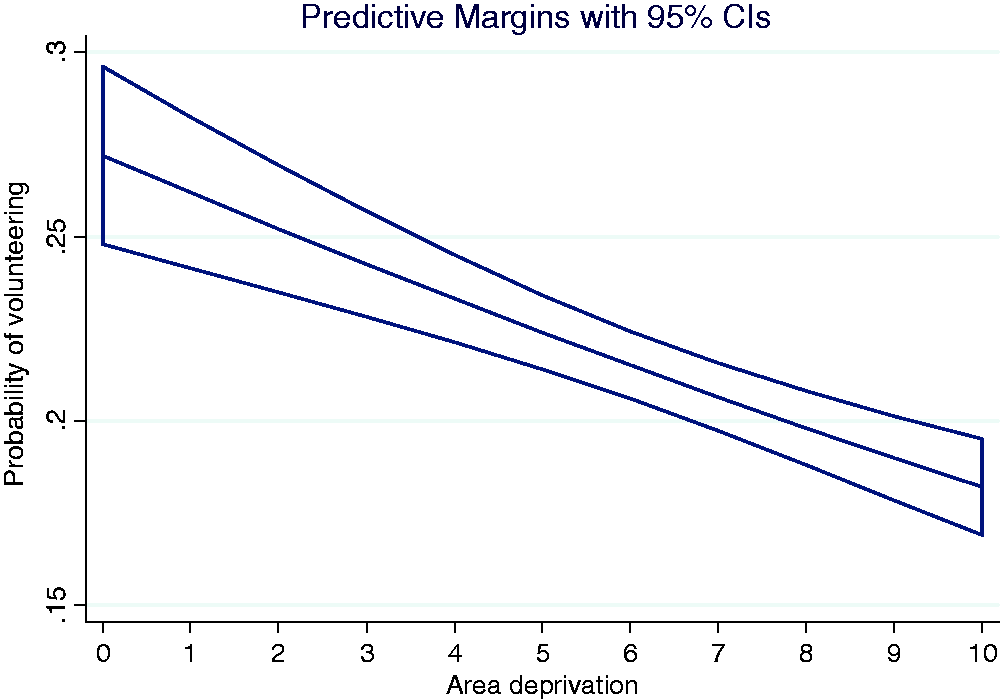
Estimated effect of area deprivation in local authorities on the probability of volunteering.
The intraclass correlation is relatively low, indicating that less than 2% of the variation in volunteering is attributed to variations between local authorities. The inclusion of area deprivation does not change the effects of the distribution of local, regional, national and aggregated charity organizations in the previous models. The results are robust to sensitivity checks, in which we restricted the analyses to include a minimum of 25 observations in a local authority (Appendix A); the results do not change.
Discussion and conclusion
Our novel findings are that the distribution of charitable organizations is significantly and positively associated with the likelihood of volunteering, but not all organizations are relevant. We differentiate between local entities (operating entirely within one local authority) and regional- and national-oriented organizations. The local organizations are positively associated with elevated likelihood of volunteering but the presence of regional or national entities is not. For local organizations, more refined measures of their presence are associated with a greater influence on the likelihood of engagement (see Table 4): including only those organizations that are active, and those that fall under the category of ‘general’ charities has a detectable effect – as can be seen from the increase in the coefficient for the influence of local charities on the probability of volunteering from 0.036 to 0.06 when we restrict consideration only to active general charities. Local organizations are likely to have a more visible presence in their communities, and (based on other findings: Clifford, 2012; Clifford et al., 2013) are more likely to draw entirely on voluntary sources of funds. In contrast, larger regional and national organizations tend to be more reliant on paid staff, often drawn from outside the immediate locality in which the organization is operating (Lindsey, 2013).
We do not find that the median expenditure of organizations is associated with the likelihood of volunteering. We had thought that this indicator might capture community-level variations in resources, and thus the capacity of organizations to recruit volunteers, but that does not seem to be the case. One possible argument, which we were unable to test with the particular survey dataset that we used, is that there is no relationship between the size of a charity (measured in terms of expenditure) and the number of volunteers that it recruits. Since 2013 the Charity Commission has required more information from charities about the latter but prior to that date information is sparse, so could not be used in our study. That will be the subject of further research. A further argument, developed by Knight (1993) and Milligan and Fyfe (2005), is that larger, professionalized and more bureaucratic organizations are likely to squeeze out volunteers in favour of running activities through paid staff. Were this to be the case, we might expect a negative relationship between median expenditure and volunteering, but we find no relationship.
One possible criticism of these findings is that our measures of the distribution of charities do not capture the universe of opportunities to volunteer. However, charities account for over three-quarters of organizations captured in the large national surveys of the third sector undertaken in 2008 and 2010 (for analyses of the survey data, see Clifford, 2012; Clifford et al., 2013). There has been recent growth in the numbers of social enterprises – indexed by an increase in the registration of CICs – but these are numerically small (accounting for less than 10% of the number of charities) and their distribution is closely related to the pattern of existing charities (Thirlaway et al., 2015). However, the data to which we have access on these organizations does not provide any means of identifying those that offer opportunities to all of the public to volunteer, rather than being entities that exist purely through trading in public service markets. Other potential inclusions, such as sports clubs, are not feasible because of the lack of a reliable source of comprehensive data on such entities in England.
Furthermore, ours is a cross-sectional analysis and that limits what can be said in terms of inferring causality. However, the uneven distribution of voluntary organizations has been well documented over a long time period. Spatial variations have been remarked upon by several commentators over the past 170 years. Prominent public figures who have noted this range from John Stuart Mill (‘charity lavishes its bounty in one place and leaves people to starve in another’ (1848)) to Aneurin Bevan and his Parliamentary observation that hospital resources were a function of the ‘caprice of charity’. 1 More recent enquiries (Hatch, 1980; Hatch and Mocroft, 1977) underpinned the important Wolfenden Committee’s (1978) observation that the ‘soil for voluntary action …[was] more fertile in some areas than others’, and over the past 10 years the Conservative Party’s Social Justice Policy Group has focused on the idea of ‘charity deserts’ (Centre for Social Justice, 2014; Conservative Party, 2008: 21). In addition, the rate of formation of new charitable organizations is relatively low – typically around 3–5% per annum – so the local distribution will change little over the short term. For these reasons we consider our area-level measures of charity distribution to be a relatively stable feature of neighbourhoods and thus our work adds weight to observations such as those of Sampson (Sampson, 2012; Sampson et al., 2005) and Sharkey et al. (2017) about the contribution of established networks of voluntary organizations to community-level variations in collective efficacy. Analyses of change over time in the relationships we discuss are not possible with the survey source we have used (because spatial identifiers differ between waves of the Citizenship Survey), but longitudinal extensions may be possible as waves of data are accumulated from the UK Household Longitudinal Study.
The findings from this work have implications for debates about the wider benefits of the third sector for citizen engagement. On the one hand, it could be argued that this analysis supports calls for infrastructural investment in support of local organizations in their early years of operation, with an emphasis on enabling organizations in disadvantaged areas to achieve a stable basis for their activities. On the other hand, there are substantial and enduring variations in the distribution of organizations, which appear to be stable and strongly related to patterns of social deprivation. Adjustments to the pattern of charitable organizations will clearly take a long time and considerable investment. Moreover, most of the variation in voluntary action relates to individual characteristics, so changes in the distribution of organizations will have some, but limited, impacts. If the aim of public policy is to engineer higher levels of participation, both for the direct benefits (services delivered) and latent benefits (e.g. to individuals in the form of improved personal well-being), then infrastructural support for third-sector organizations would need to be complemented by economic policies aimed at reducing disparities between places; in this way, more communities would have the resources that would enable them to support stronger local networks of charitable organizations.
Footnotes
Acknowledgments
Earlier versions of this paper were presented at the ISTR conference, Stockholm, 2016, and the ARNOVA conference, Washington DC, 2016, and we gratefully acknowledge the suggestions of participants in those conferences. We acknowledge the data collectors and principal investigators of the Citizenship Survey – the Department for Communities and Local Government and Ipsos MORI respectively. The secure access version of the data is available through the UK Data Service: Citizenship Survey, 2009-2011: Secure Access [computer file]. Colchester, Essex: UK Data Service [distributor], October 2013. SN: 7403 , ![]() Finally, we are grateful to the staff of the Secure Data Service for facilitating access to the survey data and for their assistance in linking our data on registered charities to it.
Finally, we are grateful to the staff of the Secure Data Service for facilitating access to the survey data and for their assistance in linking our data on registered charities to it.
Declaration of conflicting interests
The author(s) declared no potential conflicts of interest with respect to the research, authorship and/or publication of this article.
Funding
The author(s) disclosed receipt of the following financial support for the research, authorship, and/or publication of this article: This article was produced as a part of the ‘Third Sector Impact’ research project which received funding from the European Union’s Seventh Framework Programme for research, technological development and demonstration under grant agreement no. 613034. We also acknowledge funding from the Economic and Social Research Council (award number ES/G028877/1).