
Abstract
We investigate the effect of urban network connectivity on the growth of financial centres. While existing research recognises the importance of network connectivity to firms, clusters as well as city regions, large-sample empirical evidence is currently scarce, particularly in the context of financial services. We contribute to this debate by studying underwriting of equity and debt securities, which represent some of the core activities of financial centres. We operationalise our analysis using a proprietary dataset collated from Dealogic Equity Capital Market and Debt Capital Market databases covering over 1.7 million interactions of investment banks with issuers across 540 cities globally during the 1993–2016 period. We estimate our regression equations using the system generalised method of moments estimator, which allows us to obtain consistent coefficient estimates on potentially endogenous regressors, including network connectivity variables. We identify a clear pattern of a positive association between network centrality of financial centres and their growth. We distinguish between intracity and intercity network connectivity and find that financial centres with a larger number of intercity network ties and assortative intracity networks grow faster, while intracity network density does not appear to affect financial centre growth. Our results on intercity network ties are broadly consistent with established knowledge of cluster networks. In contrast, our findings on financial centres' intracity networks contradict previous research that suggests that dense and disassortative intracluster networks aid economic performance of clusters.
Introduction
Both anecdotal and empirical evidence suggests that financial services firms cluster in leading metropolitan areas and from these focal points of the financial system they serve clients worldwide. This holds in particular for investment banking (IB), corporate finance and asset management (Clark and Monk, 2017; Haberly et al., 2019; Wójcik et al., 2018). Clusters of financial services firms, conceptualised as financial centres (FCs) have been studied by economic geographers (Cook et al., 2007; Pandit et al., 2001; Pažitka and Wójcik, 2019) and historians alike (Cassis, 2010) have been shown to develop through a long-running path-dependent process, which generally lags behind the political and economic development of their countries. Once established, leading FCs display a great deal of stability and continue to function successfully, even after the economic and political power of their home countries fades away. In fact, history teaches us that it typically took revolutions and wars to make FCs decline considerably or disappear (Spufford, 2006).
Geographers studying financial and business services (FABS) firms have long been interested in the phenomenon of clustering of FABS firms in urban areas (Shearmur and Doloreux, 2015), their networks (Taylor and Derudder, 2016) and the macroeconomic, urban and institutional factors driving the development of FCs (Wójcik et al., 2018). Despite considering a plethora of factors affecting FC development including complementarities among services (Clark, 2002), spatial externalities (Cook et al., 2007), access to the labour force and institutional factors (Wójcik et al., 2018), research on FCs and urban networks have only very recently begun to intersect (Gemici and Lai, 2019; Pan et al., 2020; Pažitka et al., 2021). Despite a substantial effort being devoted to mapping urban networks formed by the offices of FABS (Taylor and Derudder, 2016), ownership ties among parent and subsidiary companies (Alderson and Beckfield, 2004), flows of foreign direct investment (Bathelt and Li (2014) and inter-organisational projects (Pažitka et al., 2021), empirical research on FCs still lacks statistical evidence linking the positioning of FCs in urban networks to their economic performance. The time is therefore ripe to study how urban network connectivity influences the growth of FCs. This is of course not the first study in economic geography that aims to link network connectivity and economic performance. We could go as far back as the works of Marshall (1920) or Amin and Thrift (1992) to find pre-eminent examples of research that explicitly link network connectivity and economic performance. Economic geographers have studied these links empirically for a variety of non-financial sectors including electronics manufacturing (Giuliani et al., 2019), winemaking (Giuliani, 2011), software development (Trippl et al., 2009) and have fruitfully applied a variety of methods from social network analysis (Glückler and Doreian, 2016). Substantial progress has also been made with conceptualisations of the relationship between network connectivity and economic performance (Bathelt et al., 2004; Eisingerich et al., 2010; Ter Wal and Boschma, 2011).
We contribute towards filling the remaining research gap by focusing our analysis on clusters of financial services firms involved in underwriting equity and debt securities, which represent one of the core activities of FCs. We estimate econometric models of growth of FCs and consider a range of explanatory factors including macroeconomic, institutional, localisation and urbanisation economies, market structure, and urban network connectivity. While several variables representing these factors have been considered in prior research (Cook et al., 2007; Pandit et al., 2001; Wójcik et al., 2018), we contribute primarily by investigating the effects of urban network connectivity. We capture intercity network ties among FCs as well as the structure of their intracity networks. We operationalise our analysis using a proprietary dataset collated from Dealogic Equity Capital Market (ECM) and Debt Capital Market (DCM) databases covering over 1.7 million market interactions of investment banks (IBs) with issuers between 1993 and 2016. We aggregate these transactions at the level of metropolitan statistical areas (MSAs), which gives us a sample of 540 MSAs – 121 in Americas, 281 in Europe, Middle East and Africa (EMEA) and 138 in Asia-Pacific. Our sample period covers multiple financial crises and recessions including the 1997 Asian financial crisis, the dot.com bubble, global financial crisis and the Eurozone crisis. To estimate our models, we use the system generalised method of moments (GMM) estimator (Arellano and Bover, 1995). This allows us to account for the dynamics of FC growth and to obtain consistent coefficient estimates on potentially endogenous variables, including network structural variables.
Our results indicate that FCs with a more central positioning in IB networks and assortative 1 intracity network structure 2 grow faster. In contrast, the density of intracity networks or the concentration of revenue at the level of individual IBs is not statistically significantly related to FC growth. This does not mean that economies of scale and scope are not important. We in fact do find a positive relationship between size and growth of FCs and that FCs benefit from localisation and urbanisation economies. Instead, our results highlight the role of external economies of scale and scope through clustering of a larger number of well-connected IBs, which co-produce their services with peers within their FCs as well as IBs in other FCs. Our analysis also corroborates earlier work stressing the role of institutional factors in FC development by showing that countries that rank higher in rule of law and offer a lower cost of contract enforcement provide an additional competitive advantage to their FCs. Finally, our results highlight the positive impact of emerging economies on FC growth.
The rest of this paper is organised as follows. In the next section, we review relevant literature on FCs, IB, urban networks, and relate the positioning of FCs in IB networks to their growth and development. In the research design section, we provide an overview of our dataset and econometric methodology. The results section presents our econometric estimates and quantifies the effect of our explanatory variables on FC revenue growth. We then provide an interpretation of our results and relate them to the research on FCs and urban networks in the discussion section. We finish with conclusions and recommendations for future research.
FCs in IB networks
The state-of-the-art in research on FCs suggests that a broad variety of factors may influence the development of FCs and the performance of their resident firms. These can be broadly divided into macroeconomic and institutional factors, localisation and urbanisation economies, market structure and urban network connectivity. While macroeconomic and institutional factors, localisation, urbanisation economies and market structure have been considered in empirical research (Clark, 2002; Cook et al., 2007; Pandit et al., 2001; Wójcik et al., 2018), evidence on urban network connectivity is currently limited to studies that describe networks (Gemici and Lai, 2019; Pan et al., 2020) and studies at a firm level (Pažitka and Wójcik, 2019). The effect of urban network connectivity on the economic performance of FCs therefore remains an important research gap. To isolate the effects of network connectivity, we must control for other known factors that have been linked to the development and growth of FCs in related research. We proceed to review related studies, identify known determinants of FC growth and derive testable hypotheses. These relate to both previously investigated factors (H1–H4) and our novel results (H5–H7).
Macroeconomic and institutional factors
Macroeconomic factors can be argued to set the tone for the opportunities afforded to FCs. Rapidly growing economies with ample investment opportunities and a high number of companies seeking access to investment capital are likely to be more conducive to FC growth and development than economies in decline (Cassis, 2010). Recent trends in IB revenue indicate that while FCs in the United States and Europe have not reached their pre-crisis (2008–2009) revenue levels yet, FCs in Asia and particularly China have enjoyed sustained growth during the last two decades and are becoming more significant internationally (Cassis and Wójcik, 2018). Thinking more broadly, FCs in emerging economies are currently benefiting from their developing stock markets and the demand of their domestic companies for stock exchange listing and access to capital markets. In addition, companies in emerging economies, which used to buy complex financial services from foreign firms and FCs, are gradually turning to domestic providers and FCs (Wójcik et al., 2019b).
FCs require suitable institutional foundations, which offer protection for creditors and shareholders and thus encourage participation in financial markets (Clark and Wójcik, 2007; La Porta et al., 1997). Political stability, rule of law and protection of property rights are essential institutional pillars for the development of financial markets and FCs (Beck et al., 2003; Rajan and Zingales, 2003). Legal foundations of institutional environment rely just as much on the laws themselves, as they do on a reliable and predictable judiciary capable of a cost- and time-efficient enforcement of contracts (Chinn and Ito, 2006). Once these essential ingredients are in place, countries hosting FCs can further gain competitive advantage through flexible and predictable financial regulation (Lai, 2012). Currently available empirical evidence suggests that countries that rank higher in rule of law and offer more cost-efficient enforcement of contracts tend to host larger FCs (Wójcik et al., 2018) and tend to have higher financial services exports (Milsom et al., 2020).
Localisation and urbanisation
The provision of FABS is highly concentrated in the world's leading FCs (Wójcik et al., 2019b). Firms located in these FCs have been documented to benefit from co-location with potential clients as well as co-producers and competitors (Clark, 2002; Cook et al., 2007; Urban, 2019). Clustering of financial services firms in FCs has been linked to higher firm growth (Pažitka and Wójcik, 2019) and market entry (Pandit et al., 2001). FCs are generally located within large metropolitan areas, which offer a large and suitably qualified labour force (Clark, 2015) as well as the necessary physical and digital infrastructure necessary for operating in a global marketplace (Cook et al., 2007; Wójcik et al., 2018). Firms located in FCs enjoy positive as well as negative locational externalities and incur significant expenses. The substantial cost of office space in central business districts of leading FCs and severe competitive pressures present a challenge, in particular for new entrants and smaller firms (Cook et al., 2007).
Market structure
To investigate the effect of the market structure of FCs on their growth, we need to complement the financial geography literature with a nuanced understanding of how IB and capital markets operate. Capital markets connect owners of capital (investors) with organisations that seek capital (issuers), typically in exchange for debt or equity claims in the form of tradeable securities. IBs operate as intermediaries in capital markets and facilitate capital flows between investors and issuers. Arjaliès et al. (2017) conceptualise these ties among financial intermediaries that ultimately connect investors and issuers as a vertically differentiated investment chain, which features IBs and asset managers as the key actors facilitating market interactions on behalf of their clients. The role of IBs in the investment chain is to facilitate the access of issuers to the securities markets by underwriting issues of securities and allocating them to asset managers. Asset managers on the other hand are responsible for allocating the investment capital of their clients to a portfolio of investment opportunities (Clark and Monk, 2017). These intermediation relationships put IBs in a position of considerable power, given that they serve in parallel as gatekeepers for both issuers and asset managers and exercise considerable discretionary power over the allocation of newly issued securities to asset managers (Jenkinson and Jones, 2009). To maximise their revenue potential, IBs aim to diversify their portfolio of clients across a variety of industries and geographical areas. This gives them access to a variety of market segments and allows them to respond more flexibly to variation in demand for their services across different industries and countries. Such efforts to cover multiple market segments has led to the rise of bulge-bracket IBs and the argument that economies of scale and scope are essential for the profitability and competitiveness of IBs (Dunbar, 2000; Ljungqvist et al., 2009; Shipilov, 2006).
Urban network connectivity
Geographers have mapped and described urban networks formed by FABS using a variety of methods, from examining geographically distributed networks of offices (Taylor and Derudder, 2016), ownership ties among parent and subsidiary companies (Alderson and Beckfield, 2004), flows of foreign direct investment (Bathelt and Li, 2014) to collaboration on inter-organisational projects (Pan et al., 2020; Pažitka et al., 2021). The primary focus of studies on urban networks has been on intercity network connectivity, although survey-based evidence indicates that localised ties among FABS are also important (Cook et al., 2007) and that they are instrumental to the co-production of financial services within FCs (Clark, 2002). The purpose of intercity network ties is mainly to connect FABS with related companies, their own offices and subsidiaries in other cities, and to facilitate seamless service provision across borders (Alderson and Beckfield, 2004; Pažitka et al., 2021; Taylor and Derudder, 2016).
In addition to the vertically differentiated investment chains connecting issuers and investors, IBs are also part of complex horizontal networks of syndication ties, connecting them to other IBs through common membership in underwriting syndicates (Pichler and Wilhelm, 2001). IBs with central positions in syndication networks enjoy privileged access to underwriting syndicates formed by their business partners and can exercise considerable power over the membership of underwriting syndicates that they lead (Ljungqvist et al., 2009; Pollock et al., 2004). Coupled with the segmented nature of markets for securities underwriting and barriers related to financial, network, reputational and human resources available to individual banks, the positioning of IBs in syndication networks shapes their access to a variety of market opportunities (Fernando et al., 2005; Shipilov, 2006). Underwriting syndicates are currently the dominant form of securities underwriting (Pažitka et al., 2021) and despite being dissolved upon deal completion, they exhibit a high degree of persistence of network ties across time (Xiao and Rowley, 2002). Bookrunners are generally responsible for selecting other syndicate members on behalf of the issuer and behave as network architects when constructing syndication networks (Pollock et al., 2004). Despite the fact that leading IBs often have the capacity to underwrite deals individually, they typically prefer to involve other IBs to improve access of their clients to institutional investors willing to make long-term investments in the client's shares as well as to contribute to the pricing of the issue (Jenkinson and Jones, 2004; Pollock et al., 2004).
It has been hypothesised that integration into global networks can enhance the performance of clusters (Bathelt et al., 2004), particularly during economic downturns (Ter Wal and Boschma, 2011). Network ties with IBs in other geographically distant FCs are particularly valuable, given that they give IBs access to new market segments, including those beyond their immediate reach (Pažitka and Wójcik, 2019) and can reduce the effect of information frictions in international trade (Milsom et al., 2020). That being said, empirical evidence suggests that the benefits of inter-cluster network ties may not be readily shared by well-connected firms with lesser connected firms in their proximity (Giuliani et al., 2019). In fact, it has been documented that financial services firms with strong intercity network ties enjoy enhanced growth and can stifle the growth prospects of their co-located competitors (Pažitka and Wójcik, 2019).
The internal structure of networks within FCs is likely to be equally important to their growth performance. The importance of the internal network structure of FCs is rooted primarily in its potential to facilitate the co-production of services within FCs (Clark, 2002). As FCs grow, they accumulate resources and become more interconnected. The high density of intracluster networks is however linked to cognitive and technological lock-in, thus potentially compromising future performance (Martin and Sunley, 2011). In addition to network density, the core/periphery network structure (network assortativity) has been identified as critical to the performance of clusters (Suire and Vicente, 2014). FCs can either display assortative or disassortative internal network structures. The disassortative network structure is characterised by a higher propensity of nodes with many ties (core) to connect to lesser connected nodes (periphery), rather than to other highly connected nodes. Conversely, assortative network structures are characterised by a highly connected core of the network and few ties between its core and periphery. It has been documented that there is a high degree of persistence in the membership of underwriting syndicates due to the importance of trust-based business relationships. Similarly, the potential for reputational damage caused by failed or mismanaged issues of securities is likely to result in a competitive advantage of assortative network structures (Pollock et al., 2004; Ljungqvist et al., 2009).
Research design
Data
To measure the revenue of FCs as our dependent variable we use fees earned by IBs from underwriting of equity and debt securities offerings. We aggregate fees at the level of MSAs. 3 We initially sample all capital market deals available in Dealogic ECM and DCM databases for the period 1993–2016. This yields 584,680 deals in total, 100,777 for ECM and 483,903 for DCM. For each deal, we identify the issuer as well as the underwriting syndicate members at the bank subsidiary level. Our dataset contains 15,032 bank subsidiaries and 91,879 issuers and features 1,727,111 market interactions among them. The revenue data available in the Dealogic ECM and DCM databases is apportioned among individual banks conditional on their role, share of the securities underwritten and is representative of the revenue earned by banks from deals with a given industrial, geographical and size characteristics. Dealogic employs a designated data science team to manage their data on apportioning revenue to individual banks and their models are periodically calibrated and provide revenue estimates earned from individual deals with a 5% margin of error. To allocate bank subsidiaries to MSAs, we hand-collect data on their addresses of operational headquarters from a variety of sources, including Orbis, Amadeus, FAME, Bloomberg, Nexis UK and corporate websites. This allows us to obtain addresses of 12,827 bank subsidiaries, while the remaining 2,205 we could not identify. These typically relate to very small subsidiaries with typically fewer than five deals and without a traceable online footprint. The resulting missing data problem is negligible, given that 1,716,394 of 1,727,111 (99.4%) of market interactions in our dataset are covered by bank subsidiaries for which we have data on headquarter location. This yields a panel dataset of 540 MSAs for 1993–2016. They represent a global sample with 121 MSAs in the Americas, 281 in EMEA and 138 in Asia-Pacific. Table 1 presents our explanatory variables, their definitions, descriptive statistics, data sources, and relates individual variables to hypotheses.
Variable definitions, descriptive statistics and data sources.
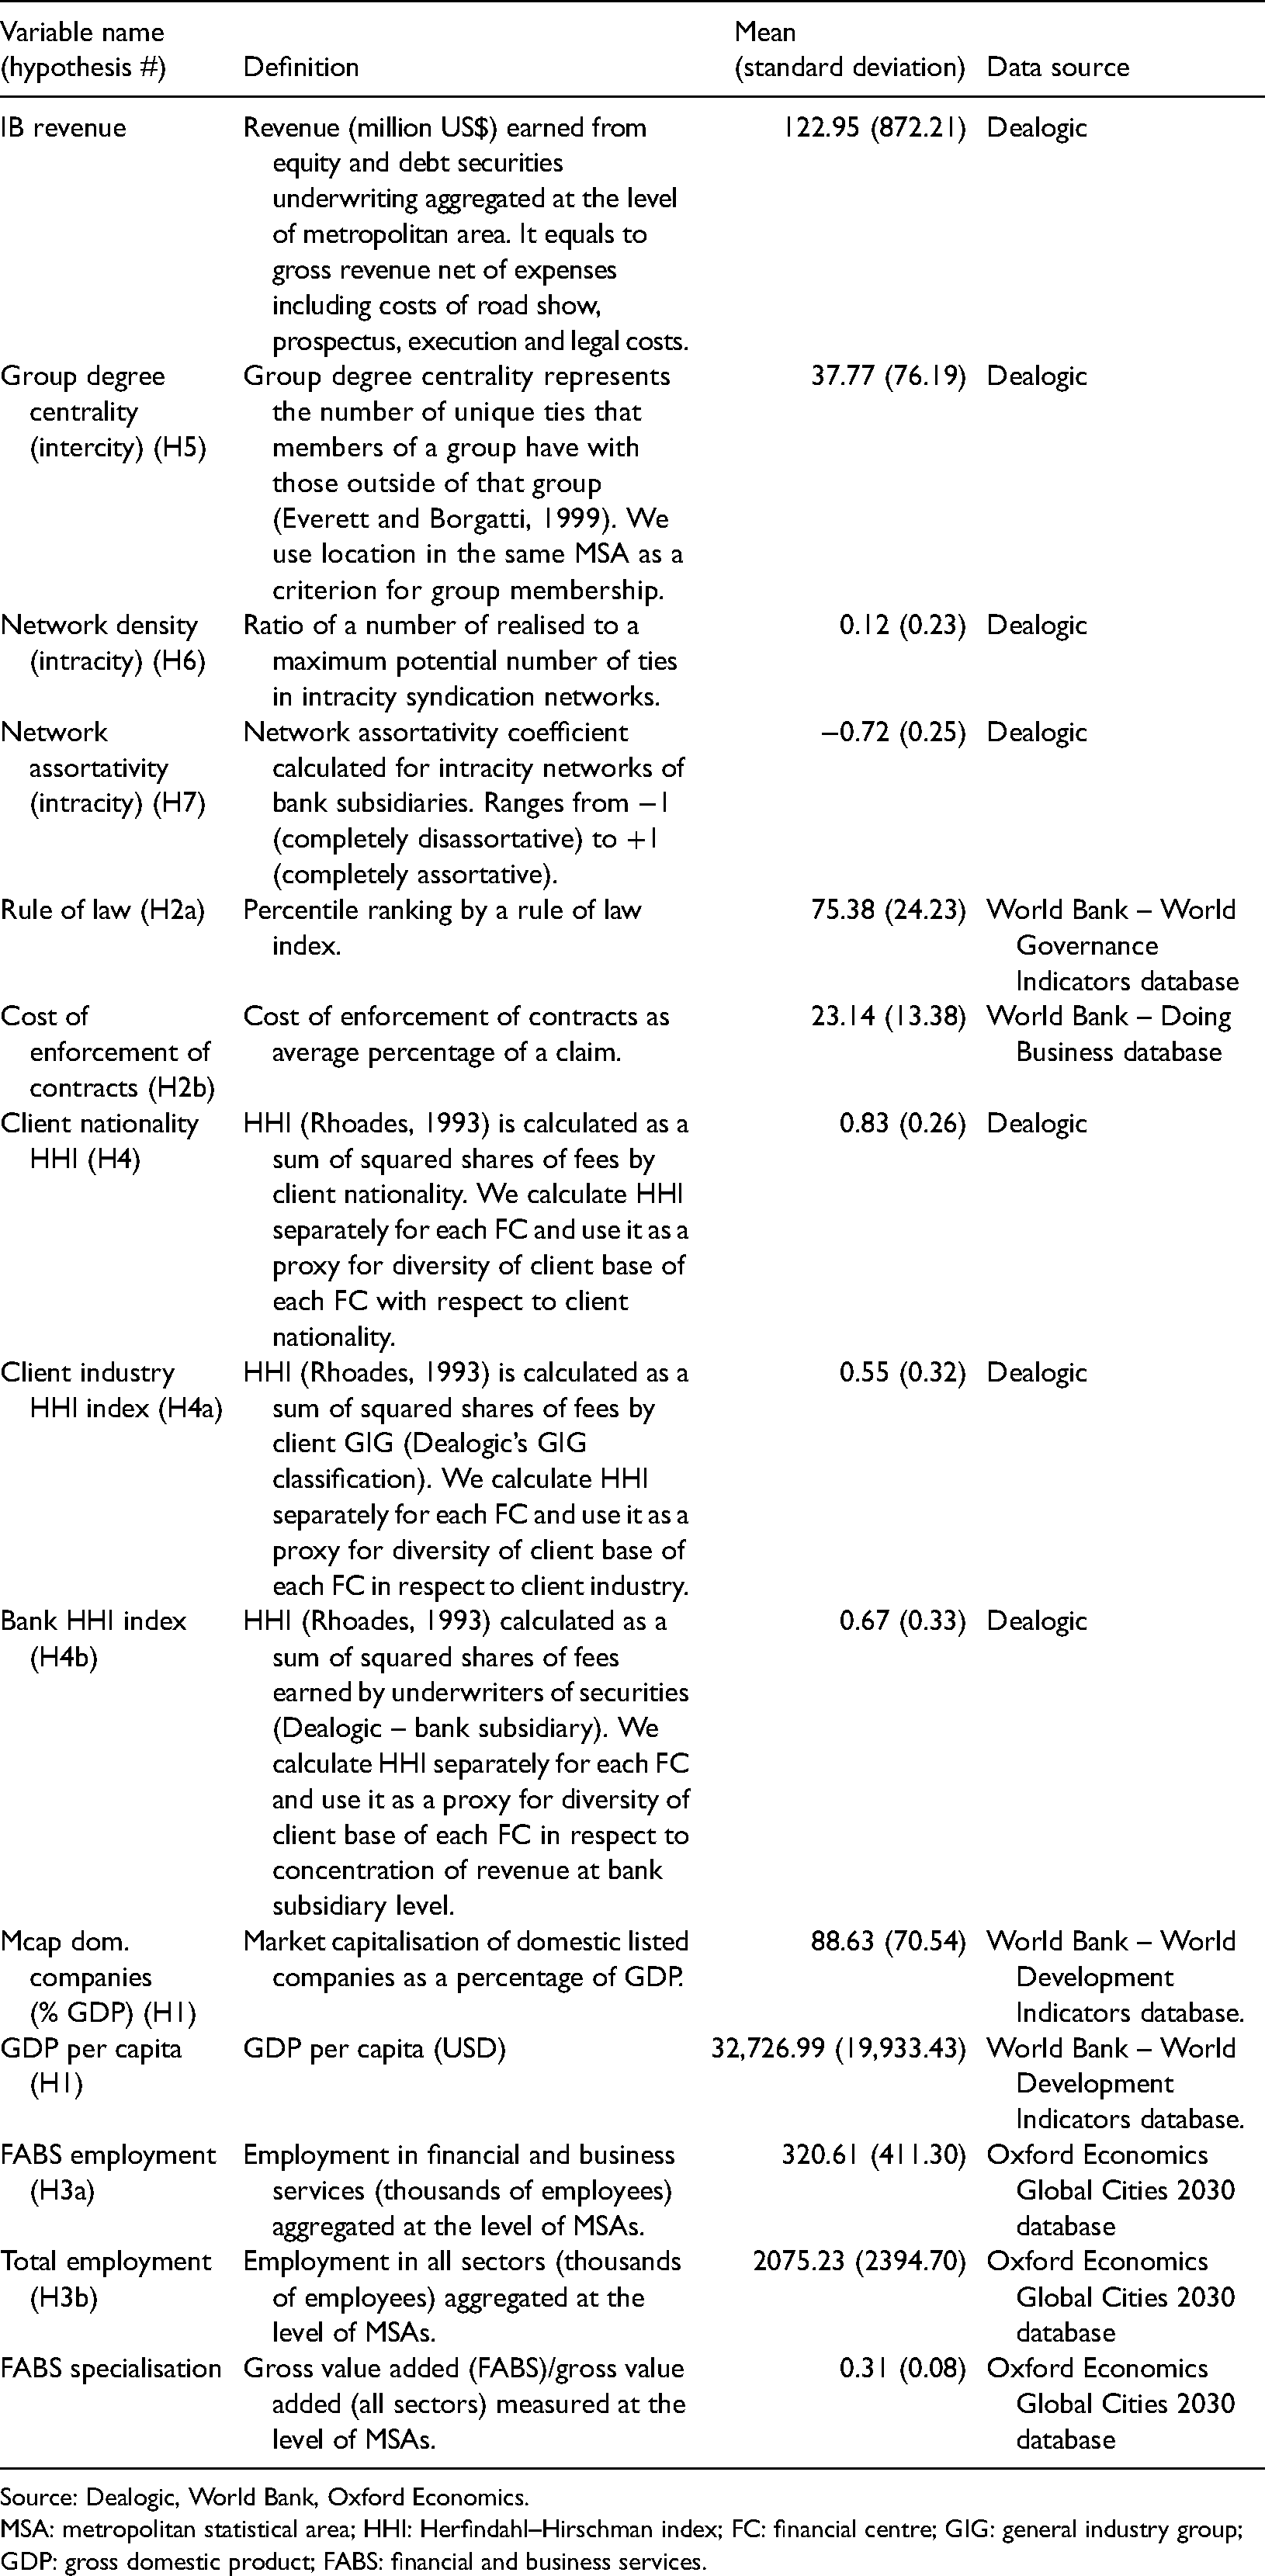
Source: Dealogic, World Bank, Oxford Economics.
MSA: metropolitan statistical area; HHI: Herfindahl–Hirschman index; FC: financial centre; GIG: general industry group; GDP: gross domestic product; FABS: financial and business services.
Econometric modelling methodology
We specify a dynamic panel data model as shown in equation (1). This model allows us to study the effect of FC network structural variables (nj) on FC revenue, while controlling for various determinants of FC revenue (xk) that have been suggested by related research. Estimating a dynamic panel data model allows us to account for the dynamics of FC revenue by including the first and second lag of the dependent variables yi,t−1 and yi,t−2. We use the Arellano and Bover (1995) System GMM to jointly estimate equations (1) and (2). This approach allows us to obtain consistent coefficient estimates even for endogenous explanatory variables, and benefits from considerably lower standard errors than more commonly used Difference GMM estimator, when modelling highly auto-correlated series. A system GMM estimator can utilise a set of instrumental variables (IVs) composed exclusively of internal instruments. This eliminates the need for external instruments and allows us to create valid instruments using second- and higher-order lagged values of potentially endogenous explanatory variables. There is generally a trade-off between efficiency and finite sample bias. Using a larger number of IVs typically leads to lower standard errors, while more parsimonious sets of instruments lead to lower finite sample bias. We report the lag structure of GMM instruments used in our tables presenting regression results and conduct robustness checks using alternative lag structures of GMM instruments. We perform diagnostic tests for the validity of GMM instruments – the Sargan test of over identifying restrictions and AR(2) auto-correction test (Arellano and Bond, 1991):

Results
Evolution of FCs in IB networks
The landscape of FCs in the early 1990s was dominated by New York, the world's largest and most connected FC with significant ties to second-tier FCs in the United States including Chicago, Boston, San Francisco, St. Louis as well as internationally. New York and London formed the network's key dyad, termed the NY–LON axis (Wójcik, 2013). New York also had significant ties with Toronto, Paris, Frankfurt and Tokyo among others. London and Tokyo acted as the regional hubs for EMEA and Asia-Pacific, respectively (Figure 1), and Tokyo's tie with London served as the main link between Europe and Asia, helping to plug the region into global financial networks. While London was the largest FC in Europe by revenue and maintained important intercontinental ties with both New York and Tokyo, continental Europe's IB network was clearly polycentric with Frankfurt, Paris and Zürich playing key roles. Asia-Pacific was peripheral in IB networks of the early 1990s and only two of the region's regional hubs—Tokyo and Hong Kong were among the largest 20 FCs. Latin America, Africa, Middle East and Central Asia hosted only smaller and lesser connected FCs.
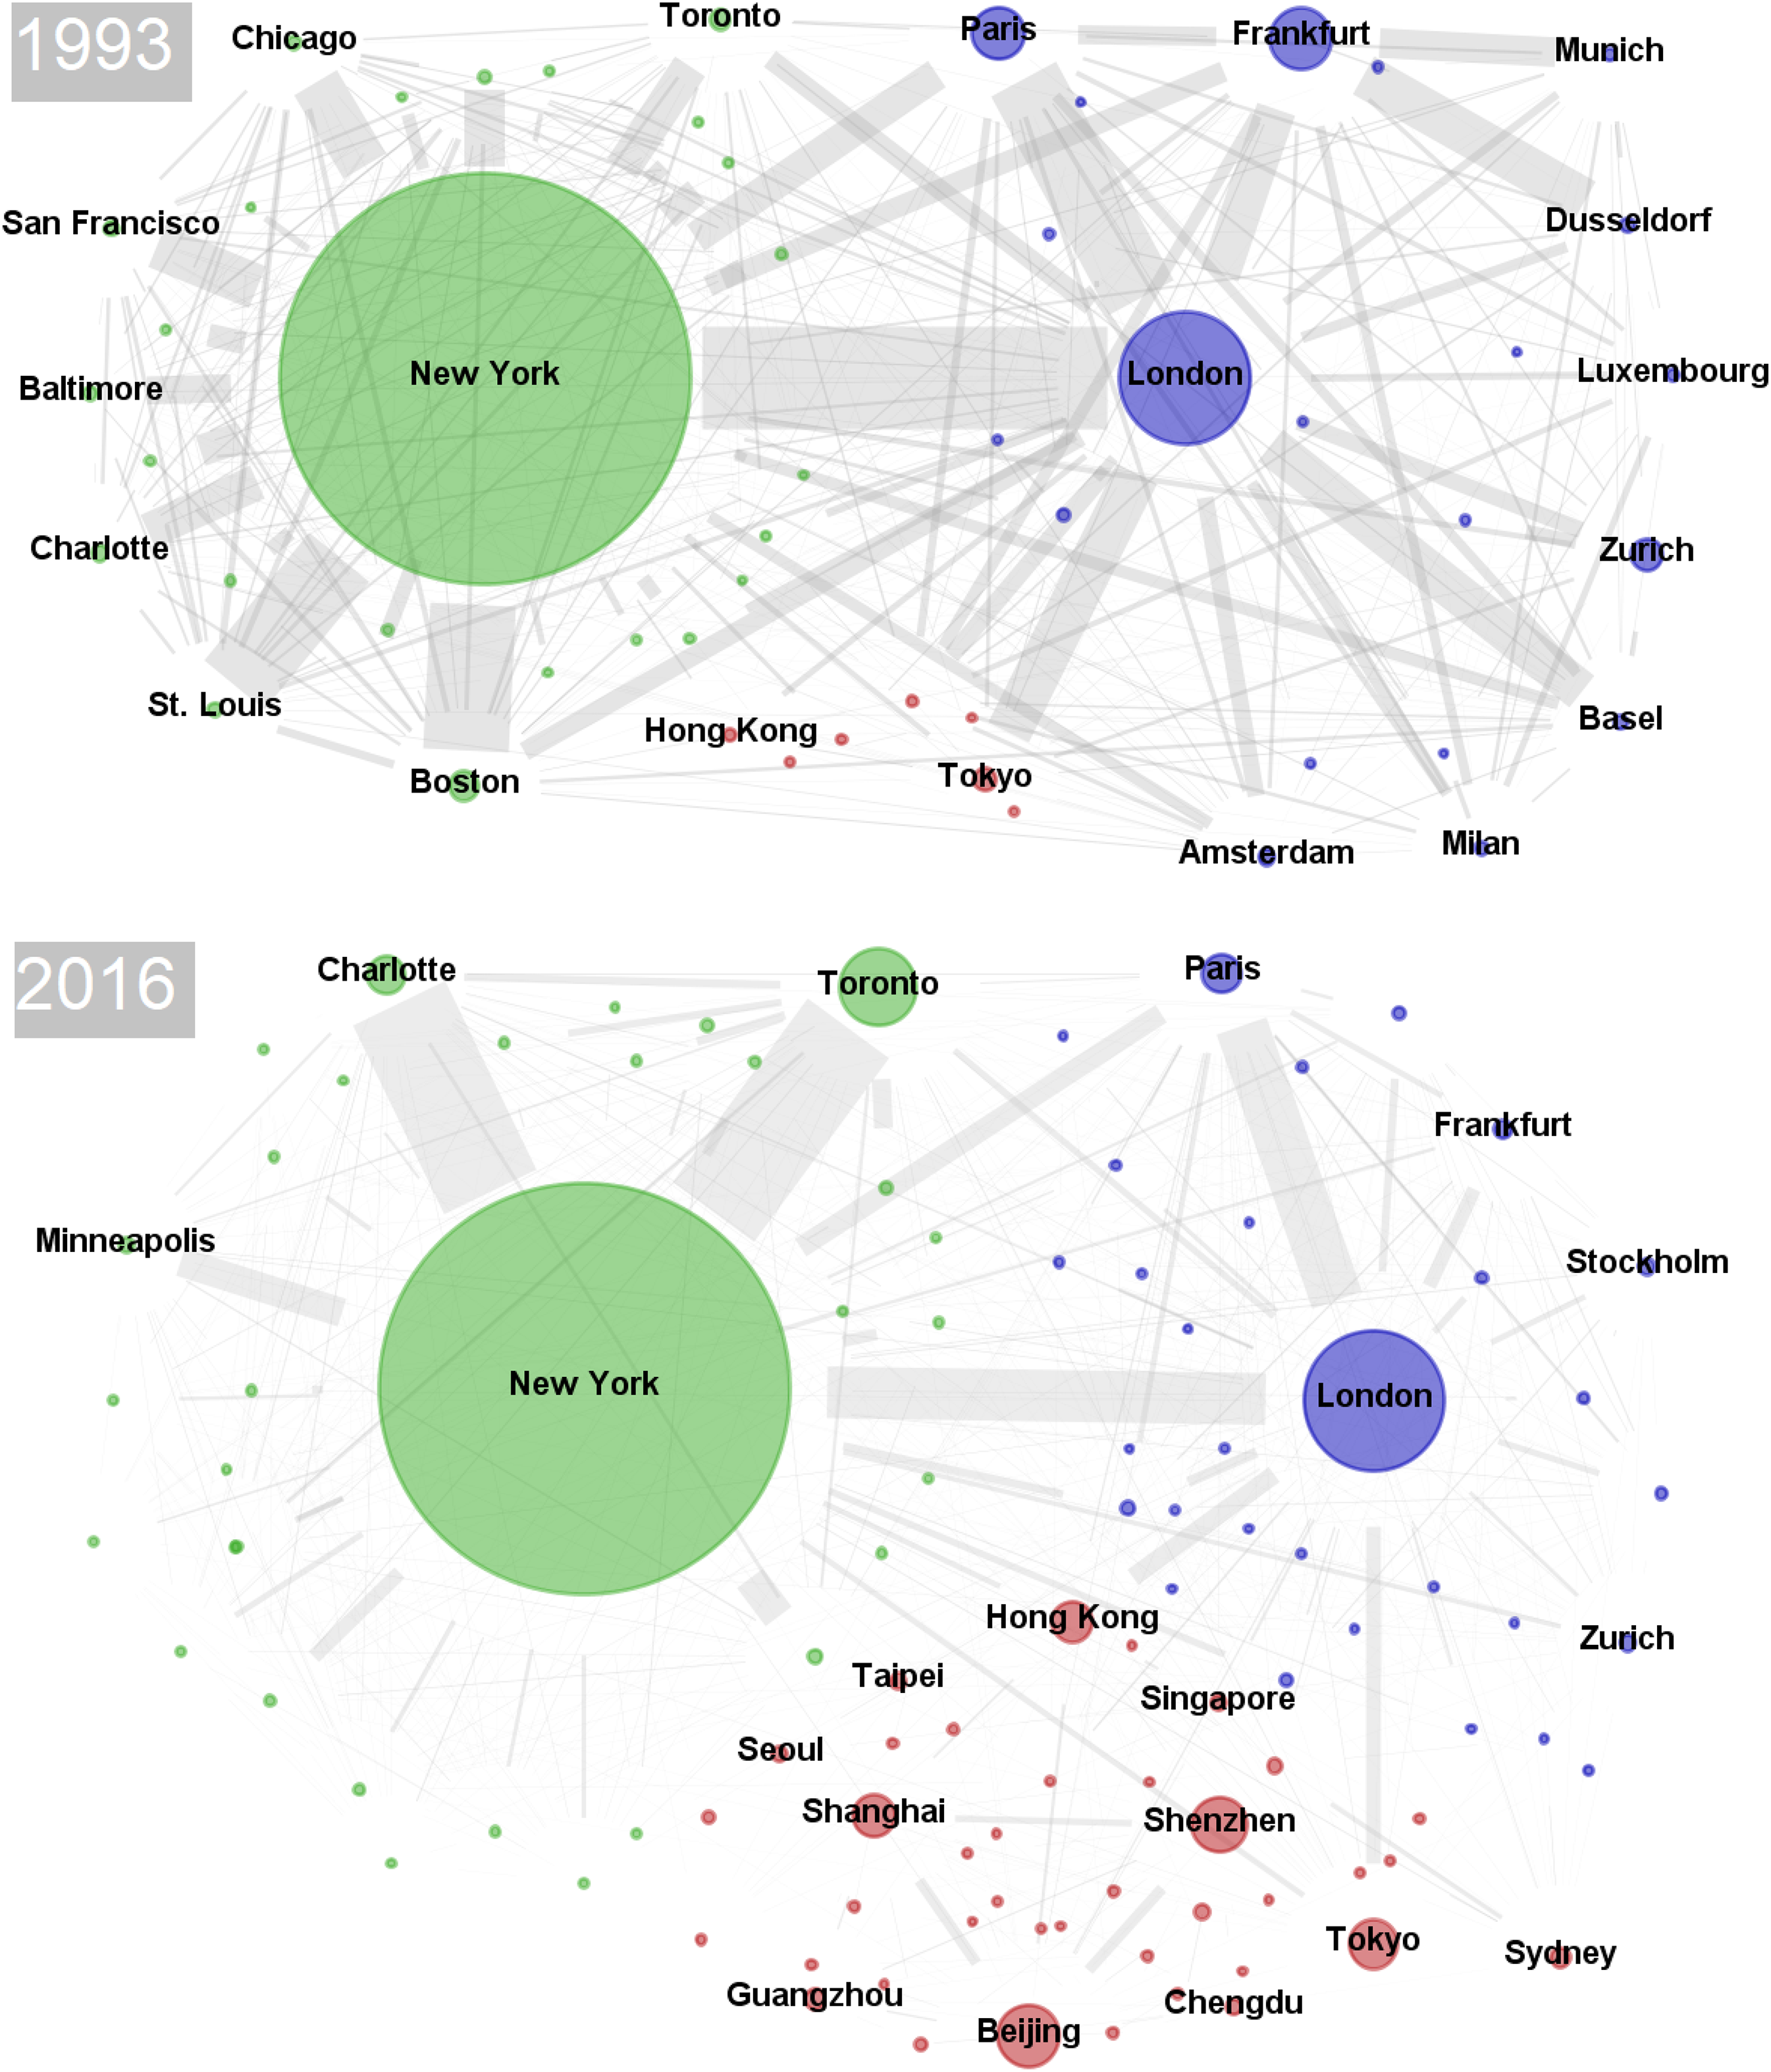
Financial centres (FCs) in investment banking networks.
The next two decades have been truly transformative to the global IB network. We have witnessed a meteoric rise of FCs across Asia-Pacific and significant reshuffling in Northern America and Europe. Northern America experienced a decline of its second-tier FCs including Chicago, Boston and St. Louis. Meanwhile, New York consolidated its networks across a reduced number of strategically important FCs, namely Charlotte, Minneapolis, Toronto, London and Paris. Europe has also seen a stark decline of its second-tier FCs, particularly Frankfurt, Zurich, Basel and Munich. London on the other hand came to dominate Europe's IB subnetwork and maintained important ties with New York and Paris, while its ties to Frankfurt and Zurich have become less significant. In Asia-Pacific, we observe the rise of a polycentric network of Chinese FCs with Beijing, Shanghai, Shenzhen and Hong Kong in the lead. Outside of China, we see Singapore, Taipei, Seoul and Sydney joining the top 20 FCs globally and a relatively slower growth of Tokyo, which however remains one of the dominant FCs of the region. London's previously important ties with Frankfurt, Amsterdam, Zurich and Basel among others have now been overtaken by more significant ties with Hong Kong and the network tie between London and Hong Kong has now become the most significant link between Europe and Asia, surpassing that between London and Tokyo.
A pattern emerges from this descriptive analysis and network visualisations presented in Figure 1, which suggests that growth (decline) of FCs has coincided with an increase (decrease) in their urban network connectivity. To investigate the relationship between urban network connectivity and FC growth further, we now proceed to formal econometric modelling, which controls for other relevant factors that influence the growth of FCs.
Macroeconomic and institutional factors
Our results on the gross domestic product (GDP) per capita are consistent with an emerging market effect, meaning that FCs in developing and emerging economies grow faster. Our coefficient estimate on GDP per capita in Table 2/model 5 (T2/M5) indicates that a 10% reduction in GDP per capita leads to a 2.0% increase in IB revenue. We also consider the market capitalisation of domestic listed companies as a percentage of GDP, a measure of stock market development (T2/M4). Our coefficient on this variable is however not statistically significant.
Dynamic panel data models of FC growth.
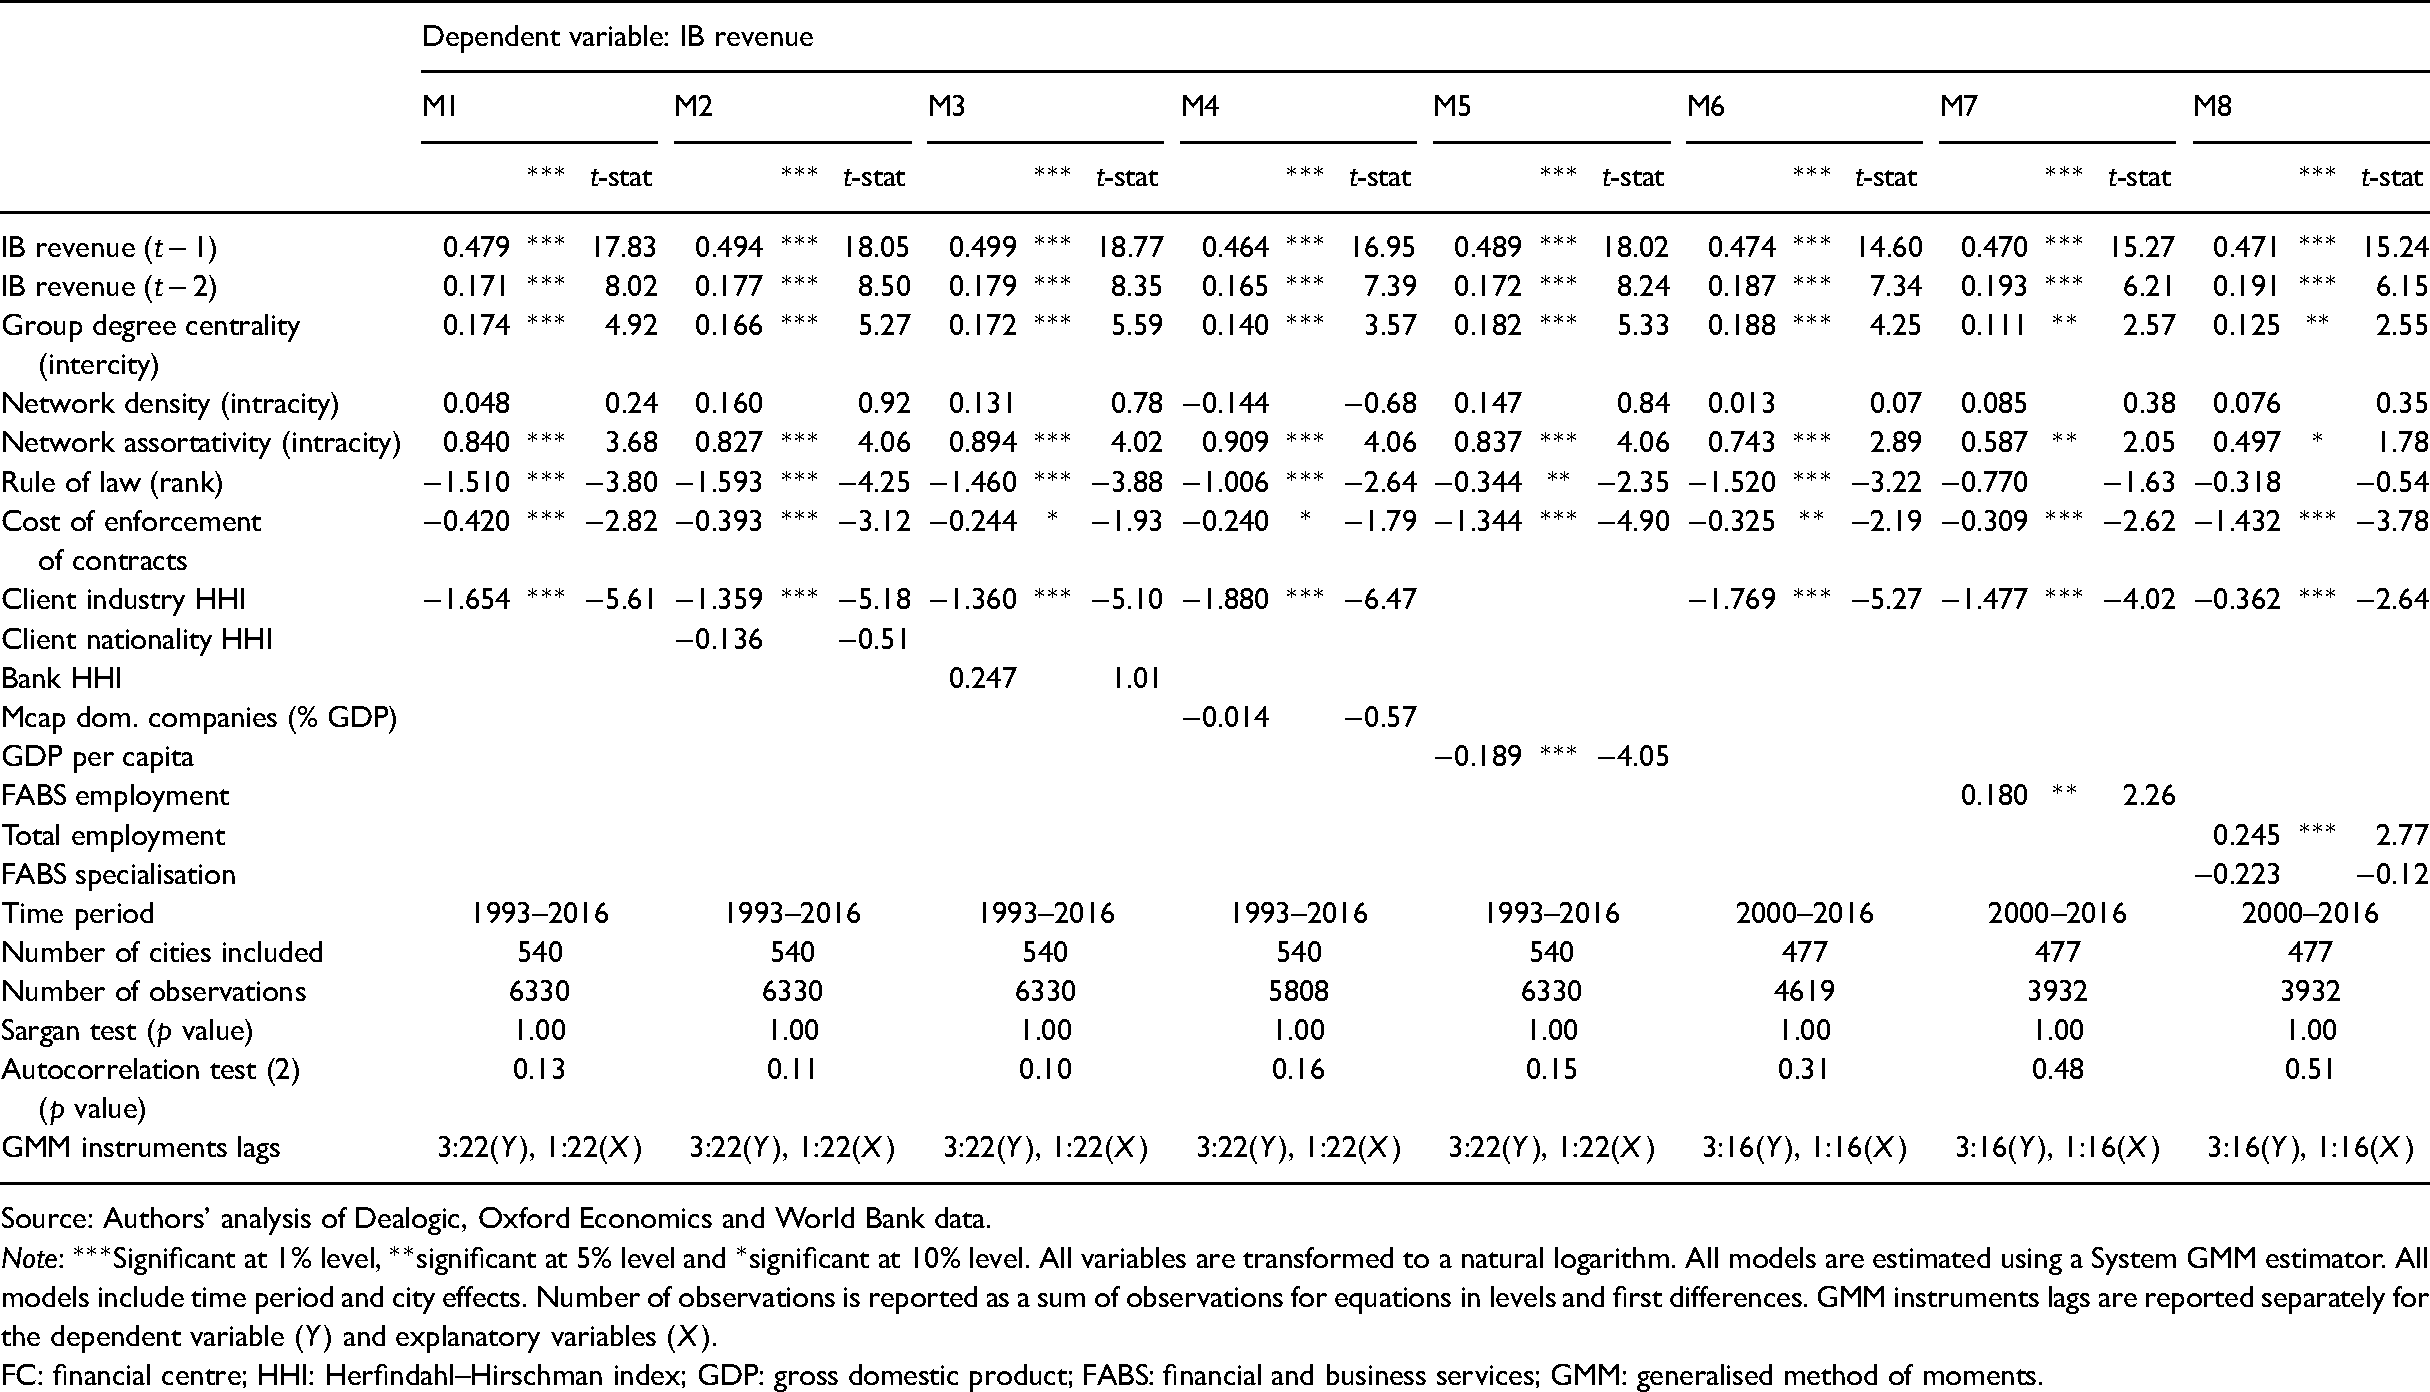
Source: Authors’ analysis of Dealogic, Oxford Economics and World Bank data.
Note: ***Significant at 1% level, **significant at 5% level and *significant at 10% level. All variables are transformed to a natural logarithm. All models are estimated using a System GMM estimator. All models include time period and city effects. Number of observations is reported as a sum of observations for equations in levels and first differences. GMM instruments lags are reported separately for the dependent variable (Y) and explanatory variables (X).
FC: financial centre; HHI: Herfindahl–Hirschman index; GDP: gross domestic product; FABS: financial and business services; GMM: generalised method of moments.
The conditional mean of IB revenue increases by an estimated 17.2% per 10% increase in rule of law ranking 4 (T2/M1). Given that rule of law is correlated with factors including the stock market and economic development, it is conceivable that the coefficient estimate on rule of law may be inflated, when these factors are not controlled for. When we control for market capitalisation of domestic listed companies (proxy for stock market development) in T2/M4, the estimated effect of rule of law falls to an 11.2% increase in IB revenue for a 10% improvement in rule of law ranking. Similarly, when we control for GDP per capita (T2/M5), the estimated effect of rule of law further falls to a 3.7% increase in IB revenue per 10% improvement in rule of law ranking.
We estimate that a 10% decrease in the cost of enforcement of contracts leads to a 4.5% increase in the conditional mean of IB revenue (T2/M1). We repeat the exercise of adding market capitalisation of domestic listed companies and GDP per capita to verify how this effects our coefficient estimate on the cost of enforcement of contracts. We find that our estimated effect on the cost of contract enforcement declines from a 4.5% to 2.6% increase in IB revenue per 10% decrease in the cost of enforcement, when we also control for the stock market development (T2/M4). In contrast, controlling for the GDP per capita leads to an estimated effect of a 15.2% increase in IB revenue per 10% decrease in the cost of contract enforcement.
Localisation and urbanisation
To account for the benefits of localisation, we include FABS employment in a metropolitan area encompassing an FC. Our results indicate that a 10% increase in FABS employment leads to a 1.7% growth in IB revenue (T2/M7). We also conduct an additional test of this hypothesis by considering the relationship between growth and size of FCs, which can be derived from our coefficient estimates on a lagged-dependent variable. Positive and highly statistically significant coefficient estimates on lags of the dependent variable indicate that larger FCs grow faster. We test the effect of urbanisation economies by measuring city size by its total employment across all sectors. Our results indicate that a 10% increase in total city employment leads to a 2.4% increase in IB revenue (T2/M8). These results suggest that localisation and urbanisation economies are conducive to FC growth, rather than the specialisation in FABS, which is not statistically significant.
Market structure
We consider the concentration of revenue on both the supply side (IBs) and the demand side (clients). Our coefficient estimates on the client industry Herfindahl–Hirschman index (HHI) indicate that diversification of IB revenue, in terms of the industrial affiliation of their clients, leads to FC growth. We estimate that a 10% increase in the client industry HHI leads to a 19.0% increase in IB revenue (T2/M1). When we control for client nationality (T2/M2) and bank concentration (T2/M3), the estimated effect falls to 15.4%. In contrast, our results on the client nationality HHI and bank HHI are not statistically significant. This is perhaps the most noteworthy insignificant result that we obtain, suggesting that it is not essential to host large and dominant IBs to aid FC growth. We will return to this point in the discussion section.
Urban network connectivity
We now proceed to examine the effect of network connectivity among FCs as well as the network structure within FCs on the IB revenue. In contrast to macroeconomic, institutional, localisation and urbanisation, network connectivity is influenced directly by IBs located in a FC. We begin by examining the effect of intercity network connectivity among FCs. We use group degree centrality, which counts the number of unique IBs in other FCs that IBs within a given FC have formed syndication ties within the preceding 3 years. Our coefficient estimate on group degree centrality indicates that a 10% increase in group degree centrality leads to a 1.7% increase in the conditional mean of IB revenue (T2/M1). This effect is reduced to 1.3% (T2/M4), when we control for stock market development.
In addition to external network ties that span the boundaries of FCs, we consider the internal network structure of FCs, by including network density and network assortativity within FC intracity networks. While network density can be interpreted as an indicator of how well IBs within a FC are connected among themselves, network assortativity relates to how well network ties within a FC connect the core of the intracity network with its periphery. Our coefficient estimates on network density are typically positive, however, they are consistently statistically insignificant, thus implying that changes in network density do not affect FC growth. In contrast, our coefficient estimates on network assortativity are consistently positive and significant, implying that FCs with assortative network structures grow faster. The coefficient estimate on network assortativity in T2/M1 suggests that a 10% increase in network assortativity leads to an 8.3% increase in IB revenue. Put simply, FCs with highly connected cores and only sparse ties between the core and periphery of their intracity networks tend to grow faster, ceteris paribus. When we control for stock market development (T2/M4), the estimated effect of network assortativity increases to 9.1%.
To verify the robustness of our results on urban network connectivity, we perform the following three robustness checks. First, our main results are estimated using the maximum available number of lags of GMM instruments. This increases the precision of our estimates, but it may also lead to bias in coefficient estimates (Arellano and Bover, 1995). We therefore rerun our analysis using two and five lags of GMM instruments as alternative specifications (Table 3). Our results are only marginally affected by changing the lag structure of GMM instruments. The estimated effect of group degree centrality (intercity network ties) declines from a 1.67% increase in IB revenue per 10% increase in group degree centrality (T3/M1) to 1.65%, when we reduce the number of GMM instrument lags to five (T3/M2) and 1.59%, when we include two lags of GMM instruments (T3/M3). Similarly, the estimated effect of network assortativity declines from 8.34% (maximum number of lags of GMM instruments) to 7.42% (five lags) and 7.58% (two lags). Second, we split the time period used for our main analysis (1993–2016) into three sub-periods—1993–2000 (T3/M4), 2001–2008 (T3/M5) and 2009–2016 (T3/M6). We estimate that a 10% increase in group degree centrality leads to an average increase in IB revenue by 2.70% (1993–2000), 1.96% (2001–2008) and 1.03% (2009–2016). This is consistent with the estimated effect of 1.67% for the whole sample period and it suggests that the effect of intercity network connectivity is decreasing over time. We estimate that a 10% increase in network assortativity increases IB revenue on average by 10.42% (1993–2000), 10.45% (2001–2008) and 15.57% (2009–2016), compared with our estimate of 8.34% for the whole sample period. Third, we split our sample into Americas (121 MSAs), EMEA (281) and Asia-Pacific (138). Our estimated effect of group degree centrality is 1.79% for Americas (T3/M7), 1.18% for EMEA (T3/M8) and 0.90% for Asia-Pacific (T3/M9). Our results on network assortativity display a similar regional pattern with an estimated effect of 16.61% for Americas, 6.03% for EMEA and 1.17% (statistically insignificant) for Asia-Pacific.
Robustness checks.

Source: Authors’ analysis of Dealogic, Oxford Economics and World Bank data.
Notes: ***Significant at 1% level, **significant at 5% level and *significant at 10% level. All variables are transformed to a natural logarithm. All models are estimated using a system GMM estimator. All models include time period and city effects. Number of observations is reported as a sum of observations for equations in levels and first differences. GMM instruments lags are reported separately for the dependent variable (Y) and explanatory variables (X).
GMM: generalised method of moments; HHI: Herfindahl–Hirschman index.
Discussion
Macroeconomic and institutional factors
We confirm earlier observations that FCs in developing countries have grown on average faster over the last three decades than those in developed countries (Cassis, 2010; Cassis and Wójcik, 2018; Wójcik et al., 2019a, 2019b). This is likely due to ample investment opportunities in emerging economies and the appetite of their companies for accessing capital markets and raising funds from investors through local rather than western IBs. In addition, emerging economies that have historically relied on imports of capital markets services increasingly offer opportunities for domestic FCs through import replacement of such services. The People's Republic of China and Poland can be used as examples here. While they used to rely on overseas stock exchanges and foreign financial services providers to meet the financing needs of their large companies in the 1990s and early 2000s, they have since become more self-sufficient by developing their own capital markets and increasingly sophisticated domestic FCs (Busaba et al., 2015; Hashimoto et al., 2021; Korczak and Korczak, 2013).
Our results corroborate the argument that FCs not only rely on solid institutional foundations, but they in fact perform better, if the institutional environment in their country compares favourably to other countries. While previous studies consider the impact of rule of law and cost of contract enforcement on cross-border capital market transactions (Wójcik et al., 2018) and exports of financial services (Milsom et al., 2020), we extend this analysis to the growth of FCs. Providing such empirical evidence offers further support to the thesis advanced by Rajan and Zingales (2003), Beck et al. (2003) and Clark and Wójcik (2007) among others, who argue that institutional development is a key driving force behind financial development.
Localisation and urbanisation economies
Clustering of FABS in urban areas has been previously linked to positive spatial externalities associated with co-production of services (Clark, 2002) and co-location with competitors and potential clients (Cook et al., 2007). Our results indicate that FCs benefit from both localisation and urbanisation and corroborate those of Pažitka and Wójcik (2019) and Pandit et al. (2001), who find that financial services firms located in larger FCs grow faster. Interestingly, what we find is that it is the aggregate employment in FABS (localisation economies) and total city employment (urbanisation economies), rather than the specialisation in FABS, that drive FC growth. We can interpret this as evidence for the benefit of labour force pooling, which offers IBs access to suitably qualified employees and talent (Clark, 2015).
Market structure
Our analysis of the impact of market structure on IB revenue growth reveals that FCs with a more diversified client base grow faster. This helps to substantiate the argument that IBs that are better connected in investment chains (Arjaliès et al., 2017) and facilitate financial flows among a broader group of issuers and investors have an advantage in terms of access to market opportunities (Ljungqvist et al., 2009). We consider the concentration of revenue on both the supply side (IBs) and the demand side (clients) and find that not all dimensions of diversification of client base are equally important. While diversification by client industry has a substantial impact on FC growth, we do not find a statistically significant effect of diversification by country of the client. Perhaps even more importantly, we find that the concentration of revenue at the level of individual IBs does not have a statistically significant effect on FC growth. This finding sits uncomfortably with the argument that to reap the benefits of economies of scale and scope, it is necessary to have very large IBs (Dunbar, 2000; Shipilov, 2006). Our results suggest that it is not essential to host very large IBs that dominate a FC. This is however not to say that economies of scale and scope are not important. In fact, we find that larger FCs grow faster, which is consistent with the thesis on the co-production of services in FCs (Clark, 2002). Instead, our results highlight the significance of external economies of scale and scope in IB. External economies realise themselves at the level of FCs, meaning that FCs with a large number of smaller IBs can perform equally well as those with a small number of large IBs, while avoiding the pitfalls of hosting too-big-to-fail banks (Ioannou et al., 2019).
Urban network connectivity
Our results show that the concentration of revenue at the level of IBs is not conducive to the growth of FCs leads to the following question: What can IBs do to aid the growth and development of the FCs that host them? Prior research suggests that the positioning of IBs in syndication networks shapes their access to various opportunities in the marketplace and can even give them a degree of control over the membership of underwriting syndicates (Ljungqvist et al., 2009; Pollock et al., 2004). Our results indicate that both intercity network ties and intracity network structure of IB syndication networks affect FC growth. We find that FCs connected to a larger number of IBs in other FCs grow faster. This finding corroborates the argument that IBs with a more central positioning in syndication networks have better access to clients and are more likely to underwrite new issues of securities (Ljungqvist et al., 2009). This is at least in part because more connected IBs are better positioned to access a wider network of institutional investors through their syndication partners and consequently have more flexibility in placing their clients' securities with a diversified group of investors (Arjaliès et al., 2017; Pollock et al., 2004).
While the above result is consistent with what could be anticipated based on existing research, our results on the effect of the intracity network structure of FCs are at odds with some of the current understanding of cluster networks. We find that network density within FCs is not statistically significantly related to revenue growth and FCs with assortative networks grow faster. Taken together, these results suggest that connecting the core and periphery of IB networks within FCs is of limited value, in fact, detrimental to FC growth. Contrary to what may be expected, our results therefore indicate that in the context of IB, it is not essential for the most central IBs to co-syndicate deals with peripheral IBs. This does make sense, given that smaller and lesser connected IBs can rarely provide value added to underwriting syndicates and can in some instances even pose a reputational risk to the lead underwriters (Dunbar, 2000). Conversely, IBs benefit from reciprocal and repeated syndication ties with reputable peers, who can broaden the group of institutional investors that can be reached by the underwriting syndicate (Chuluun, 2015) and facilitate access to new clients (Ljungqvist et al., 2009). Consequently, it appears that the key to facilitating the growth of FCs is to have a well-connected and large enough core group of IBs, which do not just co-syndicate with their peers within their own FC, but form ties with IBs in other FCs and thus have access to a variety of market segments and opportunities through their syndication networks. These findings contradict the now established understanding that a dense network of intracluster ties that connects the core and periphery of a cluster's network works in tandem with intercluster linkages to aid the economic performance of clusters (Bathelt et al., 2004; Giuliani, 2011; Giuliani et al., 2019; Suire and Vincente, 2014). This is not to say that our findings directly challenge these conceptualisations and empirical results, but rather it shows that existing understanding of clusters based mainly on studies of knowledge intensive and manufacturing industries may not be readily applicable in the context of financial services.
Conclusions
The main objective of this paper was to investigate the effect of urban network connectivity on FC growth. To isolate the effect of various aspects of urban network connectivity, we build a model of FC growth that accounts for macroeconomic and institutional factors, localisation, urbanisation, market structure in addition to urban network connectivity. While most of these factors have been studied previously (Cook et al., 2007; Pandit et al., 2001; Wójcik et al., 2018), our study contributes to the literature by adding measures of intercity network ties and intracity network structure of FCs and provides large-sample evidence on a wide range of factors influencing FC growth. In doing so we extend studies of FCs (Pandit et al., 2001; Wójcik et al., 2018, Wójcik et al., 2019b) by considering the effect of urban network connectivity and contribute to studies of urban networks of FABS (Pažitka et al., 2021; Taylor and Derudder, 2016) by relating the positioning of cities in these networks to urban economic outcomes.
We find that FCs, which increase the number of ties with IBs in other FCs, grow faster as a result. This is because by expanding their syndication networks, IBs improve their access to new clients (Ljungqvist et al., 2009) as well as institutional investors, which helps them to place issuers' securities (Arjaliès et al., 2017; Pollock et al., 2004). While this result is consistent with what could be anticipated based on existing research on IB networks, our results on the intracity network structure are at odds with some of the current understanding of cluster networks. We find that intracity network density does not affect FC growth and FCs with assortative networks grow faster. These findings contradict the established wisdom that a dense network of ties within a cluster works in tandem with long-distance linkages to aid the economic performance of clusters (Bathelt et al., 2004; Giuliani, 2011; Giuliani et al., 2019; Suire and Vincente, 2014). We do not suggest that our findings invalidate previous research on cluster networks. Instead, we would like to highlight that the existing understanding of cluster networks in economic geography may not be readily applicable in the context of financial services. We therefore find it necessary to inform research on FCs with insights from the literature on IB networks, which provides us with the necessary microeconomic foundations to conceptualise FCs in IB networks.
The findings of this study have important implications for practitioners working in IB. Network ties that connect FCs are a double-edged sword. They help FCs grow by linking them to market segments in new geographical areas and aid to diversify their client base. This process can however be reversed, if FCs encounter barriers to cooperation at distance. One does not have to go far to find suitable examples. Brexit is currently posing numerous challenges to London's cross-border ties with European FCs. The coronavirus disease 2019 (COVID-19) pandemic has led to substantial barriers to international travel as well as face-to-face communication. Such barriers to urban network connectivity therefore pose a threat to future growth prospects of FCs, particularly those that rely heavily on their network ties with other FCs and overseas clients. This may therefore lead to a decline of international FCs, unless their IBs can find ways to overcome these barriers and to maintain their international connections and clientele.
Our results are subject to several limitations. While we are interested in the effect of positioning of FCs in urban networks on their growth, we investigate this phenomenon in a specific context of IB and syndication networks. Despite the previously cited role of IBs as indicator species within the wider ecosystem of FABS firms and their important function as gatekeepers of capital markets, our focus on IBs is nevertheless only one of several potential angles of approaching this research problem. As mentioned in the introduction, FCs evolve and grow over long periods of time, and therefore long-time series of data are more suitable to study the effect of factors that are proposed to influence their growth and development. Our data from 1993 to 2016 covers a variety of conditions in capital markets including several crises, but future research should ideally use a much longer time series, when suitable datasets become available. Finally, our network structural variables are constructed using data on underwriting syndicates, which is only one of several ways that has been used to model urban networks. It would certainly be a worthwhile exercise to consider other methods of modelling urban network connectivity.
There are several directions that could be pursued in future research. First, it would be very interesting to investigate network connections among different types of FABS, including accounting, law and management consultancy firms and their implications for FC development. Second, given that some of our results contradict the established knowledge on cluster networks, it would be invaluable to verify our results on network density and network assortativity using alternative datasets, time periods or types of financial services. Third, it would be also interesting to see future research to investigate the link between revenue concentration at the firm level and performance of FCs, particularly given that our findings suggest that hosting too-big-to-fail banks does not aid FC growth. We hope that future research will build on this study to further refine our understanding of FCs and urban networks.
Footnotes
Acknowledgements
The article reflects only the authors' views and the ERC or any of the above funding bodies are not responsible for any use that may be made of the information it contains.
Declaration of conflicting interests
The authors declared no potential conflicts of interest with respect to the research, authorship, and/or publication of this article.
Funding
The authors disclosed receipt of the following financial support for the research, authorship, and/or publication of this article: This project has received funding from the European Research Council (ERC) under the European Union's Horizon 2020 research and innovation programme (grant agreement number 681337). Dariusz Wójcik has also received funding for this project from the Australian Research Council's Discovery Projects funding scheme (project DP160103855).