
Abstract
We examine the relationship between finance and economic growth in the metropolitan areas of 75 countries at various stages of economic development in the period 2001–2015. Our analysis demonstrates an inverted-U shaped relationship between finance and growth. This relationship becomes even more significant in the areas of a country outside its largest financial centre, indicating that while these areas can benefit from financial development, they are also the most vulnerable. We show that large financial centres can have an impact on growth across their national economies, but in doing so they complement rather than replace local financial centres. Overall, our results highlight the risks associated with the excesses of financial development and lend evidence to support calls for more decentralised financial systems.
Introduction
In this article we revisit the finance and growth nexus at the sub-national (metropolitan) scale. Based on a sample of developed and developing economies, we examine the ways in which finance can influence economic growth in different types of cities. While several studies have engaged with the nexus between finance and growth at the sub-national level in the past, this has mostly been done in the context of a single or a very small group of countries. 1 The sub-national investigation of the relationship for a broader group of countries has thus gone largely unexplored (one notable exception is Lee and Luca, 2019).
Using sub-national data rather than national aggregates offers much more precision in empirical analysis, compared with existing macroeconomic studies. Such precision is essential considering that finance tends to be distributed unevenly across national economies. The very existence of financial centres testifies to this pattern, as does research demonstrating that capital flows, in whatever form, encounter considerable frictions even within national economies (Wójcik, 2011). On the other side of the finance–growth nexus, growing income inequality within many advanced economies and developing countries over recent decades also highlights the need for examining the nexus at the sub-national level (World Bank, 2016).
Our contribution is interdisciplinary, inspired in equal measure by economics and economic geography. The latter offers a long tradition of research showing the relevance of space, place and scale in finance (Martin and Pollard, 2017). According to Klagge and Martin (2005), for example, it is often the case that small and medium-sized enterprises (SMEs), particularly in economically lagging regions, struggle to access funding because of their distance from the leading financial centre(s) of the country. This distance can contribute to information asymmetries between them and potential lenders, and can lead to higher transaction, monitoring and borrowing costs. On the other hand, local banks can help alleviate credit rationing by collecting soft information about potential lenders and engaging more closely with them (Flögel, 2018; Flögel and Zademach, 2017). As argued in Flögel (2018), although the extensive use of quantitative rating systems limits to some extent the influence of soft information and face-to-face interaction, these aspects still matter, especially in credit provision to financially distressed SMEs and new lenders where rating assessments are often inconclusive. Another example of the importance of space in finance is highlighted by what Verdier (2002) calls ‘liability side haemorrhage’. This refers to the tendency of the saving resources of peripheral regions to bypass local banks and flow towards leading financial centres.
An additional contribution of the article is that we treat finance in broad terms, defining the financial sector as encompassing not just banks, insurers, real estate and other financial firms, but also other business services, with consulting, accounting and law in the lead. These firms play a key part in facilitating financial transactions in an economy, and work closely with financial firms (Wójcik, 2013). Major wholesale financial transactions, such as equity and debt issuance or mergers and acquisitions, invariably involve not only narrowly defined financial firms but also legal, accounting and other consulting firms. Even retail financial transactions such as mortgage issuance often, if not mostly, involve other advisors including lawyers. Following the literature established in economic geography, we refer to this complex of financial and advanced business services shortly as FABS (Coe et al., 2014).
This broad treatment of finance as FABS takes seriously the literature recognising the importance of the legal and accounting systems in financial and economic development (e.g. Haselmann et al., 2010; La Porta et al., 1998; Levine et al., 2000). It is also consistent with our focus on sub-national analysis, cities and financial centres. FABS are overwhelmingly concentrated in cities and constitute the core sector of any financial centre (Sassen, 2001). Within FABS, advanced business services other than finance typically employ many more people than finance itself (Cassis and Wójcik, 2018). It is thus the joint activity of the FABS complex that we investigate in relation to economic growth.
Illustrated briefly, our results suggest that the connection between finance and growth at the sub-national scale resembles an inverted U shape. Although local financial development can advance local economic growth, there comes a point beyond which the positive relationship between local finance and growth turns negative. This relationship seems to be mostly significant in cities outside large financial centres. Moreover, local finance retains its significance even after controlling for the impact of the largest financial centre of a country on the growth of smaller cities.
The rest of the article proceeds as follows. In the next section we provide a survey of relevant literature and discuss the theoretical background of our study. We then illustrate in detail our data and methodology. This is followed by a presentation and discussion of our results. In the last section we conclude and consider policy implications.
Literature and theory
The view from macroeconomics
There is a voluminous empirical literature in mainstream macroeconomics, investigating the long-run relationship between finance and economic growth. As developed since c. 1990, this literature can be broadly divided into two stages, the first starting in the early 1990s and continuing until the mid-2000s, and the second emerging in the aftermath of the global financial crisis of 2007–2008. 2
In its first phase, this literature depicts a positive and significant relationship, with a first-order effect of finance on growth. King and Levine (1992, 1993) represent seminal contributions of this period. Using cross-country data, King and Levine show that the positive impact of finance is robust to different ways of measuring finance. A similar finding comes from Levine and Zervos (1996) with respect to the impact of stock market development on growth.
Levine (2005) provides an in-depth review of this group of studies. According to his survey, the positive relationship between finance and growth can be traced at the level of cross-country comparisons, individual country studies, as well as in specific industries and firms. While there are macroeconomic studies pointing out a non-linear strength in the relationship (e.g. Deidda and Fattouh, 2002; Rioja and Valev, 2004; Rousseau and Wachtel, 2002) and even spotting occasions of a negative relationship (e.g. De Gregorio and Guidotti, 1995; Favara, 2003), the view that finance is positively associated with growth clearly prevails.
In the aftermath of the global financial crisis of 2007–2008, however, this literature exhibits a notable turn. Despite adherence to the principal thesis which views finance as a propeller of economic growth, a critical approach to finance has gained a more central place in the discussion. Employing similar methods to earlier research, the post-2008 studies have highlighted a concave relationship between finance and growth, with a positive relationship prevailing at lower levels of financial development but gradually turning negative as finance grows. This is a considerable step forward and one which brings this branch of literature a few steps closer to the critical analyses developed by heterodox economics and geography (these studies are often categorised under the overarching term ‘financialisation’; for discussion, see Ioannou and Wójcik, 2019, amongst others).
Some of the most recent and relevant articles include Cecchetti and Kharroubi (2012), Law and Singh (2014), Beck et al. (2014), Arcand et al. (2015), Cournède and Denk (2015), Sahay et al. (2015), and Samargandi et al. (2015). Arcand et al. (2015), for example, claim that finance starts to negatively affect economic growth once the ratio of credit to GDP reaches 100%. According to the authors, this result is robust even after controlling for other factors that can adversely affect growth, such as low institutional quality and differences in bank regulation and supervision. Sahay et al. (2015) provide a similar set of evidence, while also introducing a composite measure of financial development that encompasses banking and non-banking institutions and expands across three dimensions, namely depth, access and efficiency.
Overall, one of the common claims of these studies is that many advanced economies appear to have crossed the turning point in this inverted-U shaped relationship between finance and growth long ago.
Impacts of finance in regions and cities
The finance and growth nexus has also been investigated at the regional level. Carbó et al. (2003) argue that in comparison with cross-country studies, the interregional investigation for a single country offers the advantage of a more homogenous, and thus comparable, legal and cultural environment. In their paper, Carbó and his colleagues examine the link between regional bank competition and growth in the context of the five largest Spanish regions without, however, finding evidence in favour of the hypothesis that competition enhances regional growth. On the other hand, in a subsequent study of 17 Spanish regions (Comunidades Autónomas), Carbó et al. (2007) find that financial innovation has contributed positively to regional GDP. De Guevara and Maudos (2009) provide further evidence for Spanish provinces, using firm-level data. Their research suggests that firms in more financially developed provinces tend to grow faster, especially in the case of industries with high dependence on external finance. Özyildirim and Önder (2008) also discuss the topic in the context of Turkey. According to their results, finance’s impact on regional growth varies based on the distance between banking headquarters and regions, and the relative size of the latter. Furthermore, in a more recent paper, Chen et al. (2015) discuss the relationship between regional financial development and FDI in China and show that multinational firms prefer to invest in regions with higher levels of financial development.
Urban studies also have a long tradition of studying various consequences of financial development. In comparison with the above literature, they have capacity to engage with a wider variety of aspects, which are by construction omitted at the macroeconomic level. Some of the most important lines of exploration include the spatial unevenness in the distribution of finance and growth within cities, the impact of finance on urban infrastructure and governance, as well as its connection with gentrification. 3
One of the seminal contributions in the first direction is Dymski and Veitch (1996). According to this article, the way finance is organised in the city relates to the geographical structure of urban growth and the economic vitality of the different parts of the city. Investigating the trajectories of financial development in Los Angeles, Dymski and Veitch identify a structural transformation of finance into a two-tier system since the 1980s, with the formal banking sector increasingly pursuing upscale customers and second-tier financial firms conducting small-scale banking in low-income and minority neighbourhoods. Leyshon et al. (2004) describe a similar separation to that in Dymski and Veitch, matching these tiers with what they call ‘distinct ecologies’ of retail financial services. Among recent works, Aalbers (2009) highlights the spatial variegation of the consequences of the subprime crisis in the USA, showing how poorer cities and impoverished neighbourhoods were disproportionately affected by house foreclosures. Walks (2014) shows a negative relationship between the spatial distributions of household indebtedness and income at the neighbourhood level, across Canadian cities.
In the connection of finance with urban governance and infrastructure, Peck and Whiteside (2016) observe that, in the case of the USA, the growth of the municipal bond market went in tandem with the stagnation of redistributive financing and the sky-rocketing of financial innovation. Faced with an environment of increased dependence on private money markets, local authorities were gradually pushed by market institutions, such as the credit rating agencies, to adopt financial metrics and rationalities. More recently, financialisation of urban governance has also spread throughout Europe (Möller, 2015). As pointed out by Möller (2015) and O’Brien and Pike (2019), part of the explanation for this phenomenon lies in the low appetite for risk of the post-crisis era and the corresponding attraction of local-based assets, such as municipal bonds, as safe assets.
An additional connection made in the literature is between financialisation and gentrification. As argued for example in Lees (2000, 2003), global cities such as New York and London have been experiencing a new wave of gentrification since the 1990s, captured by the word ‘financification’. Financifiers, as the author calls high-salary finance employees, have been populating particular pockets of those cities, such as Brooklyn Heights in New York, pushing out the earlier generation of middle-class gentrifiers from the 1960s and 1970s. Another channel is identified by Fields and Uffer (2016) who link financialisation with rental housing and the pre-crisis, large-scale purchasing of houses by private equity investors.
Theory
At the level of theory, there are at least two explanations as to why finance can become a drag on economic growth. First, there is the suggestion coming from some scholars from mainstream macroeconomics, who claim that finance can absorb too many human resources. Second, there is Minsky’s theory of financial instability, a long-standing pillar of post-Keynesian theory.
Cecchetti and Kharroubi (2012) focus on the first of these narratives. According to their account, finance competes for resources, particularly for human capital, with the rest of the economy. In that sense, there is a point beyond which finance becomes a drag on economic growth by absorbing too many highly skilled and talented people. In their words: ‘[f]inance literally bids rocket scientists away from the satellite industry. The result is that people who might have become scientists, who in another age dreamt of curing cancer or flying to Mars, today dream of becoming hedge fund managers’ (2012: 1–2). This view is also endorsed by Beck et al. (2014), who link this overaccumulation of human capital with the highly specialised labour inputs required for the trading of complex financial instruments.
An alternative account comes from the theory of financial instability, originally developed by Hyman Minsky (Minsky, 1986). According to this theory, there is an endogenous tendency in the economic system in moving from a stable towards a fragile financial position. In a period of growth, good economic performance allows agents to build up their confidence and expectations. Gradually this drives borrowers towards higher financial exposures, compared with their actual economic capacity; in a similar way, lenders gradually reduce their standards of creditworthiness and expand their supply of credit. Based on the same logic, Minsky asserts that the provision of finance becomes too tight, and borrowers too reluctant to expose themselves to debt, when pessimism prevails in the economy. In essence, the financial instability theory focuses on the mutual interaction between finance and growth, working in both directions. In ‘good’ times the two variables feed positively into each other. There comes a point, however, when the economy becomes overheated – a situation in which finance becomes excessive compared with what would be required for sustainable economic growth.
Both of these narratives could be expected to hold in equal or even further strength at the sub-national level. First, a long-standing premise of the literature on urban hierarchies is that large cities tend to attract talented people in a disproportionate manner (Friedmann, 1967; Pumain and Rozenblat, 2018). Smaller cities with more limited pools of talented people could therefore be expected to experience the adverse effects of the over-concentration of highly qualified workforce in finance in a more acute way than the country as a total.
Second, the possibility of a fragile financial expansion pointed out by Minsky can become a more central consideration in areas outside the country’s largest financial centre. Perhaps the most indicative example here is the case of Northern Rock. As discussed in Marshall et al. (2012), there were two aspects that made Northern Rock a particularly local experience. First, partly as a response to the need to compete with London-based banks, Northern Rock engaged with a hyper-aggressive mortgage lending strategy in which it had little experience. Rather, people involved in key management functions exhibited a high element of amateurism in not fully understanding the mechanics and risks involved in securitised lending and Ponzi-type borrowing from international money markets. Second, the pre-crisis business euphoria was not only sustained by the broader economic climate of the country but also by a local feeling of self-confidence and success, attributed by the bank and the local elites to Geordie blood. 4 Northern Rock was not just another bank but was also the flag of the city’s business community as a symbol of success and post-industrial urban revival.
Another way of connecting Minsky with cities is by considering the relevance of the financial instability theory in explaining the subprime crisis in the USA. As pointed out by Dymski (2010), although Minsky himself mostly focused on corporate rather than household lending, the subprime crisis can be read from a Minskyan standpoint once Minsky’s theory is appropriately modified to include the household sector. Doing so in the subprime context grounds Minsky’s hypothesis of declining creditworthiness standards to the urban level of analysis, given the spatial specificity and unevenness of subprime lending in targeting low-income and ethnic minority groups (Aalbers, 2009; Dymski, 2010).
Data and methodology
To investigate the relationship between finance and growth, we use data on 75 countries, including 28 OECD member states and 47 non-OECD countries (also referred to as developed and developing economies, respectively). Our data set covers 614 cities in these countries and is based on the Global Cities database from Oxford Economics, a comprehensive resource of city-level macroeconomic, sectoral and demographic data. The database defines cities on the basis of urban agglomerations and metropolitan areas, incorporating the built-up areas outside the historical and administrative core of each city. All cities for which data are provided have 400,000 inhabitants or more (for details see Oxford Economics, 2014).
Appendix A (supplementary material, available online) lists the countries and the cities included. We match every country with the corresponding cities for which data are available. To decide on the composition of the sample, we follow two criteria. First, our aim is to construct a data set with a balanced representation not only of developed and developing economies but also of different continents. Of course, these weights change once we switch from countries to cities.
An ideal way of making our analysis at the sub-national level comparable with existing studies conducted at national level would be to replicate the data set and results of one of these, and then add a sub-national layer of analysis. This was not possible owing to the fact that data from Oxford Economics are available from 2000, while other relevant studies usually cover earlier periods of time, typically between 25 and 40 years long (see for example Cecchetti and Kharroubi, 2012; Sahay et al., 2015). As the second-best solution, we concentrate on a set of countries for which we were able to reproduce the inverted-U shaped relationship between finance and growth at the country level first.
The time-span of our study is from 2001 to 2015. Despite the relatively short horizon of our sample, the period examined is informative and up-to-date, given its coverage of the years before and after the crisis of 2007–2008. Like other recent studies (e.g. Cecchetti and Kharroubi, 2012) we calculate five-year non-overlapping averages for each of the variables in our data set. As a robustness check we also report some of our key regressions using three-year non-overlapping averages (Table 3).
In our formal categorisation of different types of cities, we flag locations that correspond to the largest financial centre of each country and to global financial centres (labelled as LFCs and GFCs, respectively). An LFC is defined as the city with the largest employment in FABS in a given country (2001–2015 average). Largely (in 60 out of 75 countries in the sample), LFCs coincide with capital cities. Examples of countries in which the two cities are not the same are the USA, where the largest financial centre is New York; Pakistan, where the largest centre is Karachi; and Australia, where Sydney ranks first (all LFCs are in italics in Appendix A, available online). Furthermore, we identify 63 cities which are formally classified as GFCs (underlined in Appendix A, available online), based on their inclusion in the Global Financial Center Index provided by the Long Finance Institute (see Yeandle, 2017).
Figure 1 highlights the importance of distinguishing between these types of cities. As expected, the share of FABS in total employment (referred to as FABS employment share) is typically higher in GFCs than in LFCs, and much higher than in other cities. On the other hand, economic growth in GFCs and LFCs is distributed in a much more concentrated and symmetric way compared with other cities. Its average value is also significantly lower (2.3% and 2.4% for GFCs and LFCs, respectively, versus 4.8% in other cities).
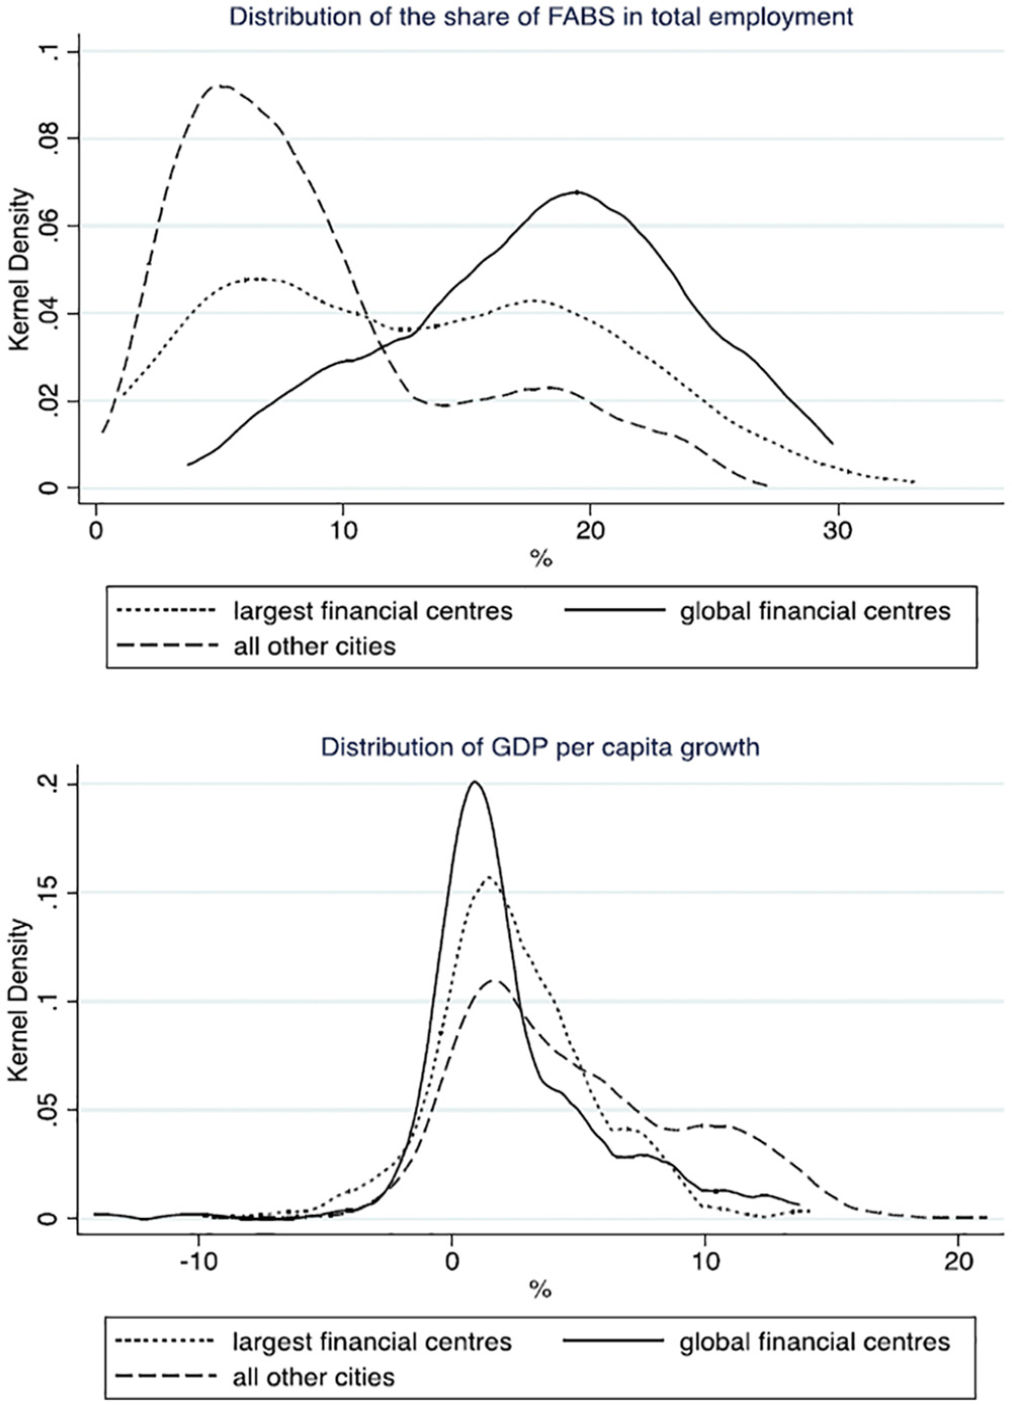
Distribution of FABS share in total employment and GDP per capita growth by city type.
For our econometric analysis we use the following panel model:

where
GDP per capita growth is our indicator for economic growth. In addition, the FABS employment share is taken as our proxy for financial development. On one hand, the use of FABS is related to data availability, as Oxford Economics does not offer data on the financial sector only. 6 Importantly, however, as explained in the previous section, the inclusion of other advanced business services allows us to measure more accurately the breadth and the depth of modern financial systems.
To test for concavity in our equation, we insert the FABS employment share in both level and square terms. For the relationship to be concave the
Vector
Table 1 elaborates the precise configuration of each of these variables and reports the relevant summary statistics and pairwise correlations.
Summary statistics and correlation matrices.
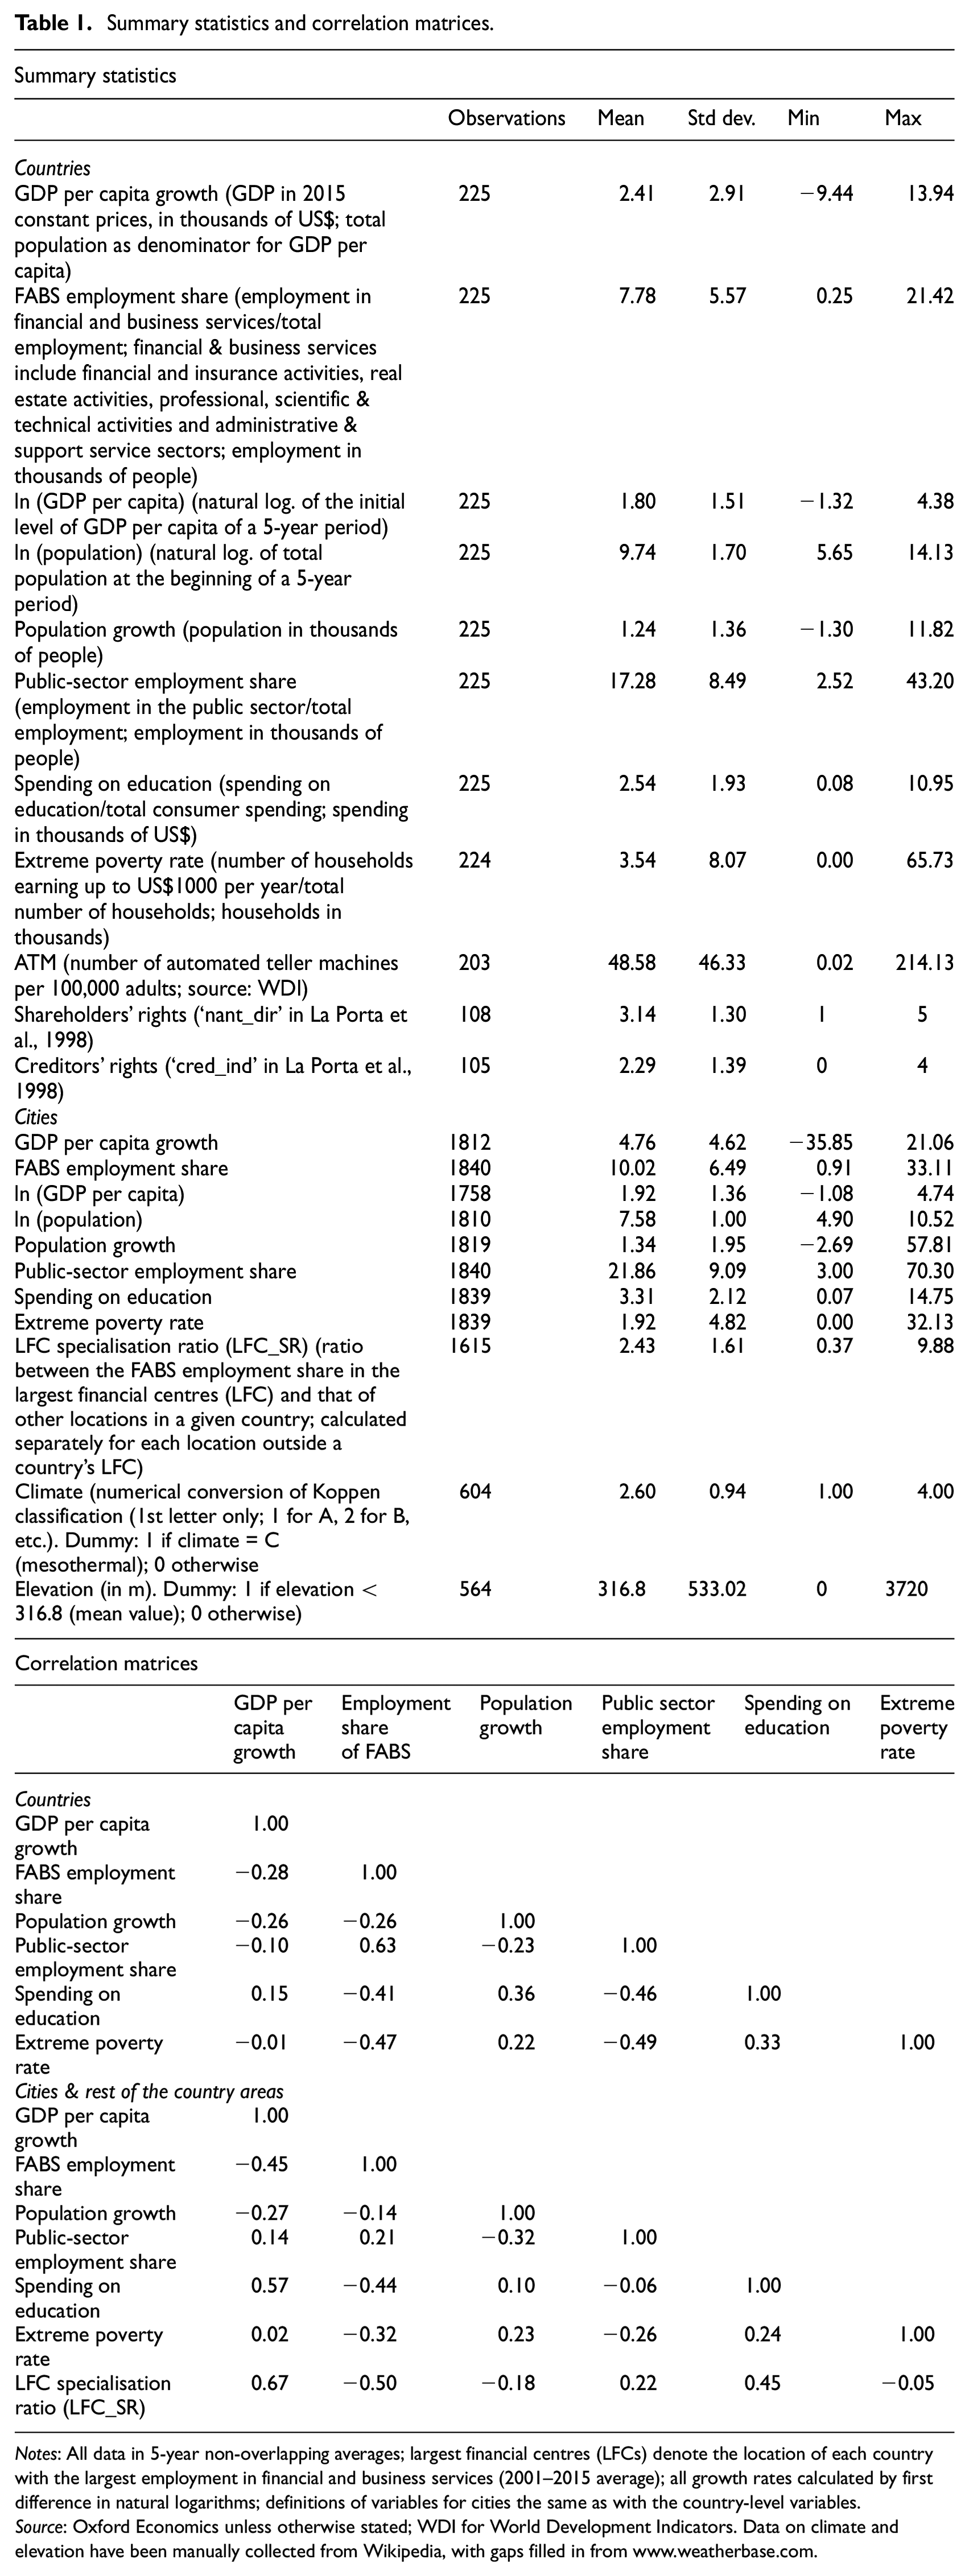
Notes: All data in 5-year non-overlapping averages; largest financial centres (LFCs) denote the location of each country with the largest employment in financial and business services (2001–2015 average); all growth rates calculated by first difference in natural logarithms; definitions of variables for cities the same as with the country-level variables.
Source: Oxford Economics unless otherwise stated; WDI for World Development Indicators. Data on climate and elevation have been manually collected from Wikipedia, with gaps filled in from www.weatherbase.com.
Results
In what follows we present three sets of results. First, we illustrate graphically the finance and growth relationship. Second, we present our main econometric findings. Third, we provide some additional robustness analysis, primarily aiming to deal with endogeneity.
Visual depiction
Figure 2 illustrates the city-level finance and growth relationship in two different ways (elaboration influenced by Cecchetti and Kharroubi, 2012: 3). In the upper part we break our raw sample into ten deciles, separated in terms of FABS employment share and ranked from the lowest to the highest share (1st and 10th deciles, respectively). In the lower part of the figure we fit a quadratic function to a scatterplot which puts together GDP per capita growth with (demeaned) FABS employment share data. In order to control for other factors that affect growth we first regress growth on all the variables of the main model (column 3 of Table 2) except FABS employment share. We then store the residuals of the model. These residuals, that is the remaining part of growth, which is expected to be associated with finance, is what is entered into the scatterplot.
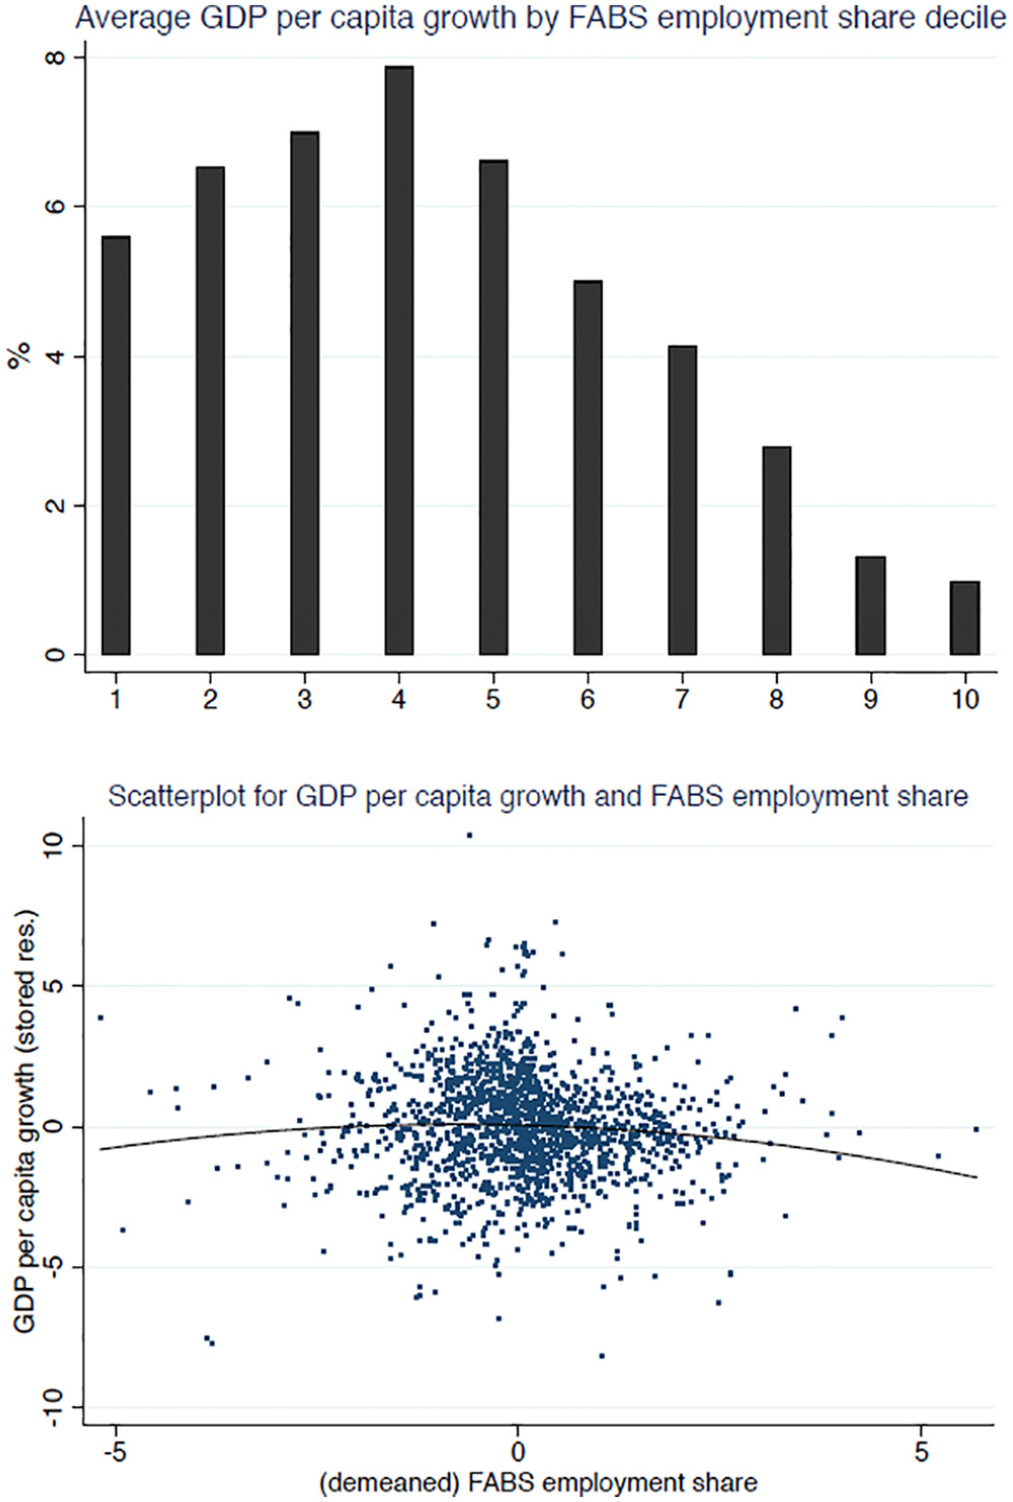
Illustration of the inverted-U shaped relationship between GDP per capita growth and FABS share in total employment. Upper graph depicts average GDP per cent growth by decile of share of FABS employment share, ranked from lowest to highest. In the lower graph, the vertical axis demonstrates the part of the basic model (column 3 of Table 2) not explained by FABS employment share, that is, the stored residuals after the model is run without the FABS level and squared terms. On the horizontal axis FABS employment share has been demeaned.
Basic models.
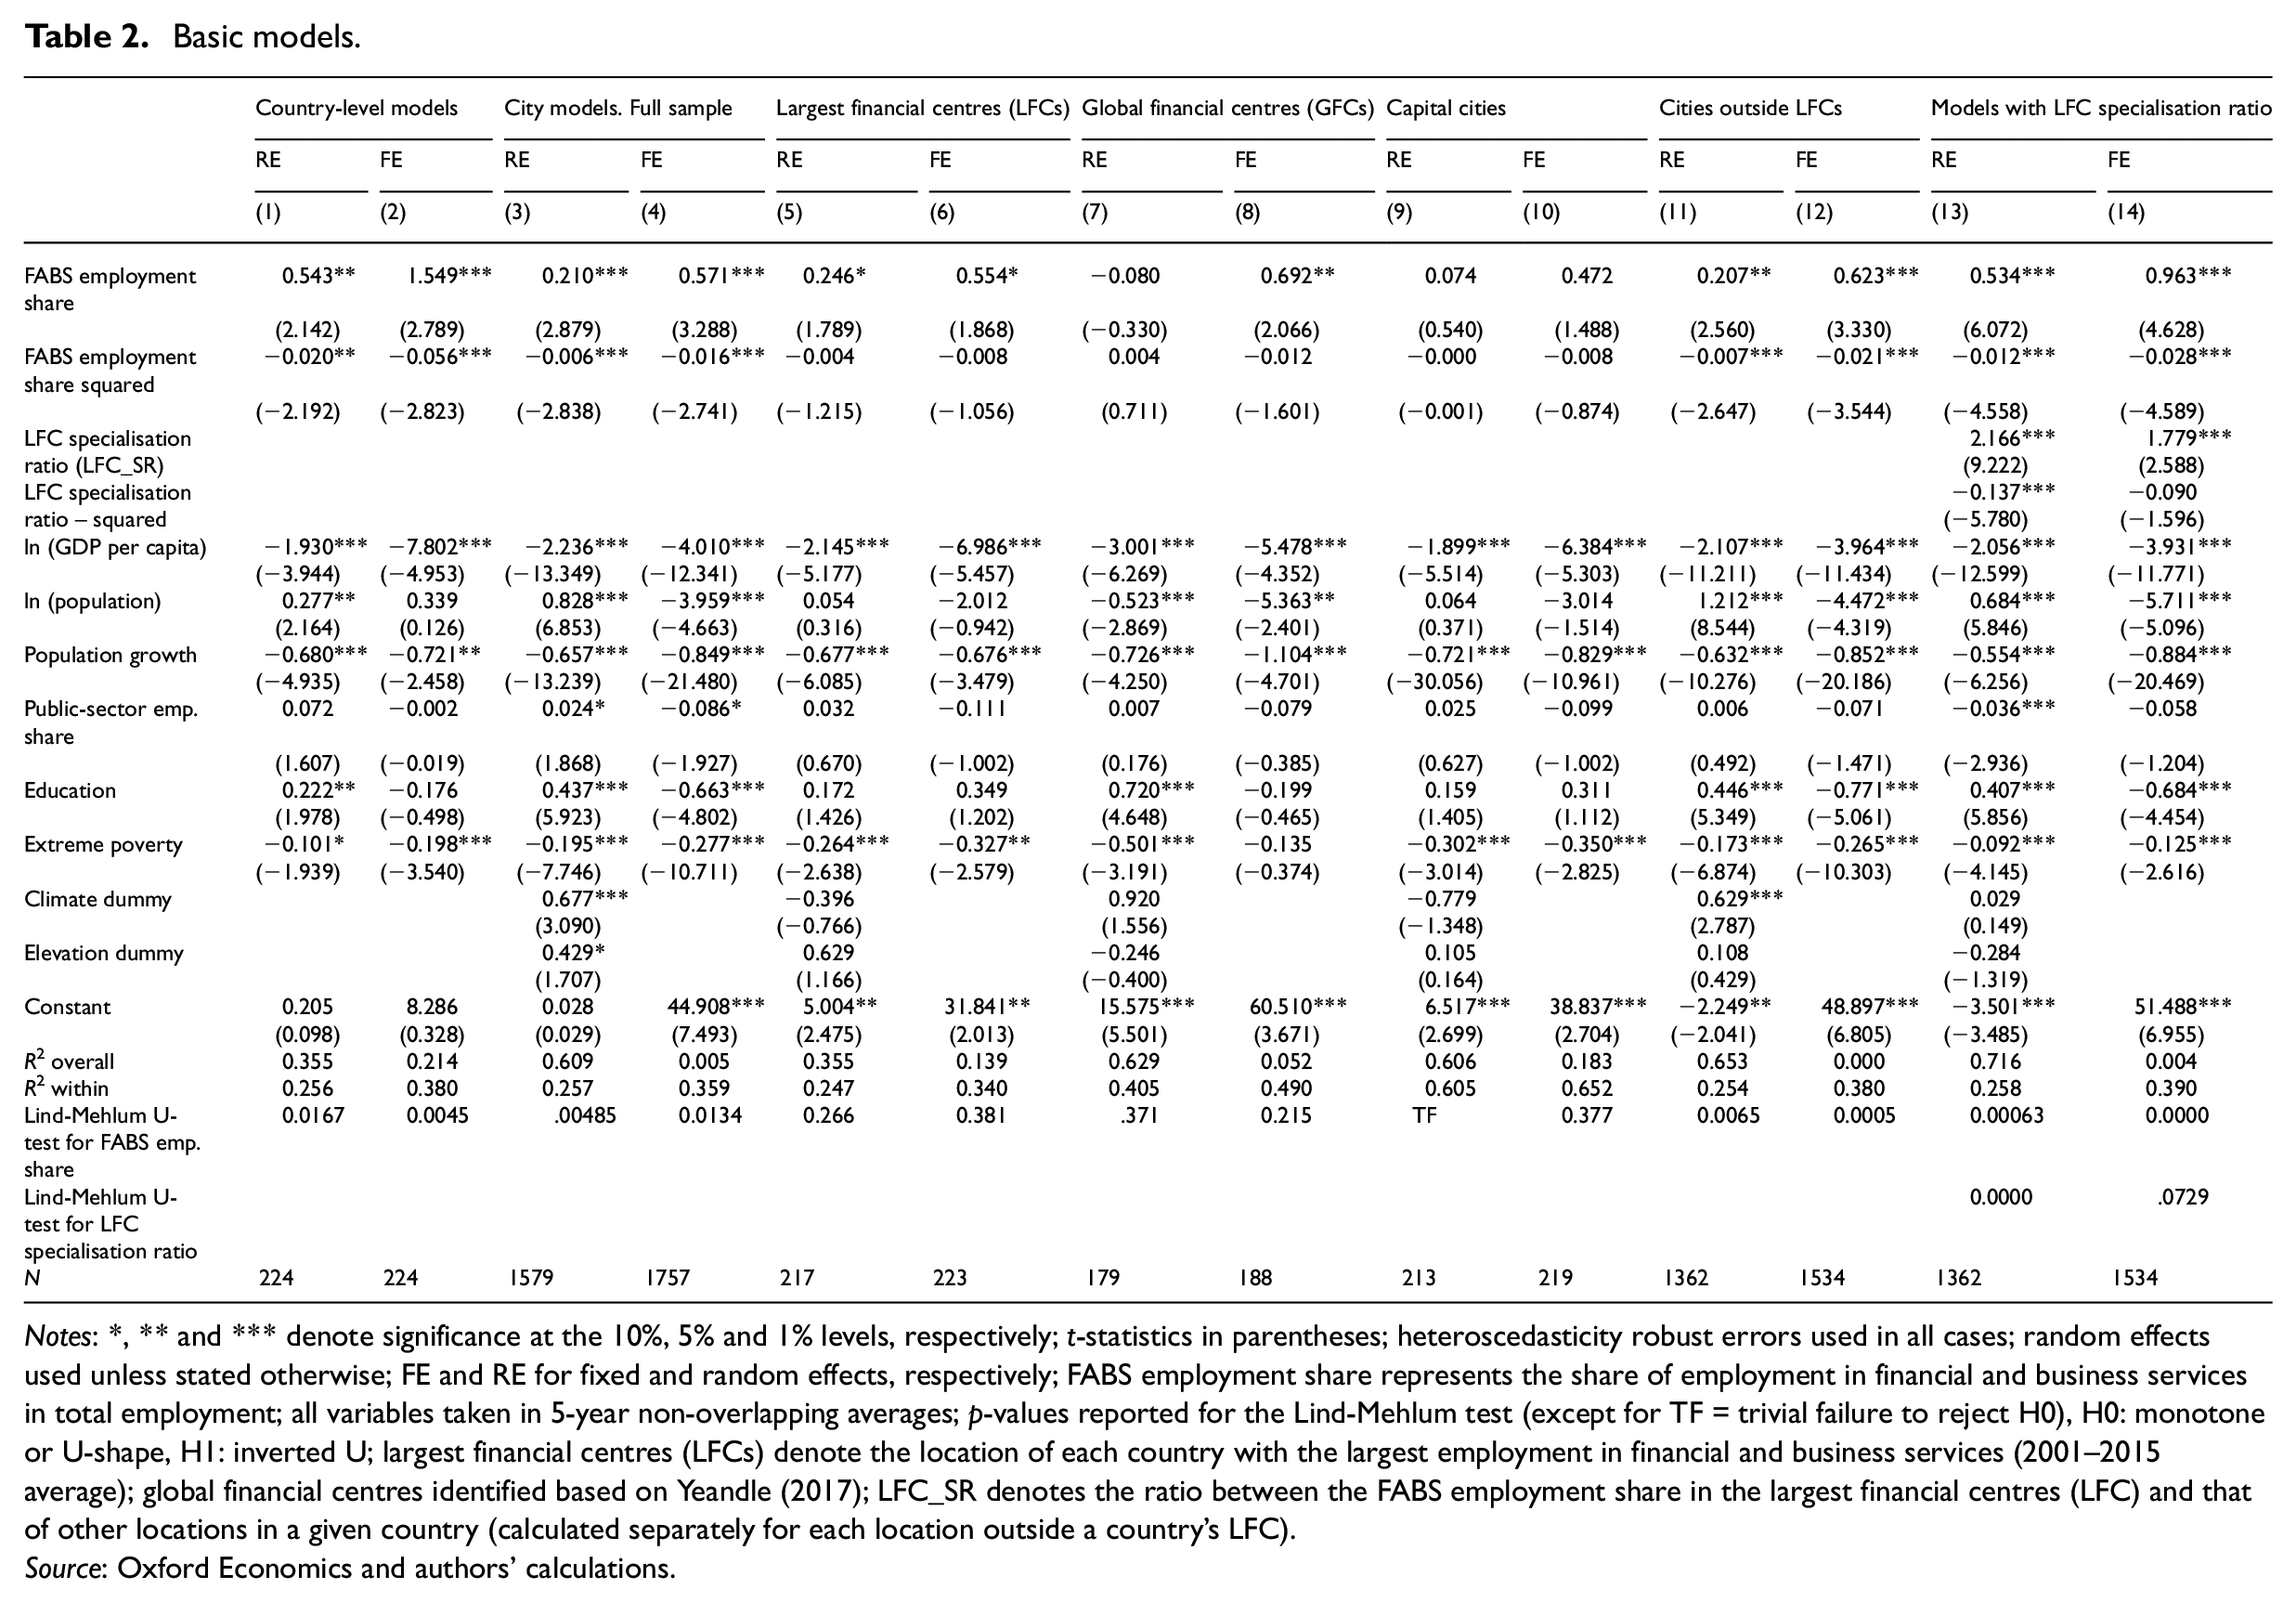
Notes: *, ** and *** denote significance at the 10%, 5% and 1% levels, respectively; t-statistics in parentheses; heteroscedasticity robust errors used in all cases; random effects used unless stated otherwise; FE and RE for fixed and random effects, respectively; FABS employment share represents the share of employment in financial and business services in total employment; all variables taken in 5-year non-overlapping averages; p-values reported for the Lind-Mehlum test (except for TF = trivial failure to reject H0), H0: monotone or U-shape, H1: inverted U; largest financial centres (LFCs) denote the location of each country with the largest employment in financial and business services (2001–2015 average); global financial centres identified based on Yeandle (2017); LFC_SR denotes the ratio between the FABS employment share in the largest financial centres (LFC) and that of other locations in a given country (calculated separately for each location outside a country’s LFC).
Source: Oxford Economics and authors’ calculations.
Although both graphs are useful for our purposes, they follow different approaches and hence are not comparable, for example, in terms of the precise concavity recorded. Having said this, both visuals are supportive of the assessment that the finance and growth nexus at the city level resembles an inverted U. According to the raw evidence presented in the upper graph, for example, the average growth increases for the first four deciles and steadily declines thereafter.
Principal econometric findings
Table 2 reports our main econometric results. To address the question of whether the relationship between finance and growth as observed at the national level holds at the metropolitan scale, the first four columns of the table contain the country-level models of our sample, as well as the full-sample results for cities. To investigate how this relationship compares between different groups of cities, the following eight columns report the estimation results for LFCs, GFCs and other cities. Furthermore, columns 13 and 14 present an expanded specification in which the financial activity in local centres and in LFCs is considered jointly.
As columns 3 and 4 of Table 2 show, the level and squared terms of the FABS share of employment appear with a positive and negative sign, respectively, in both the FE and RE varieties of the full-sample city model, and both are statistically significant at the 1% level. The Lind-Mehlum test results also confirm the concavity of the relationship. In most instances, control variables also appear with meaningful signs.
These findings demonstrate the persistence of the inverted-U shape in the finance and growth relationship as we move from the national to the metropolitan level of analysis. All else the same, the development of local finance can benefit the growth of urban economies to an extent. There is, however, a turning point beyond which the relationship becomes negative. Indicatively, according to the model in column 3, this turning point occurs when FABS employment reaches 17.5% of total employment.
Columns 5 to 12 of Table 2 take our analysis a step further by re-running our regressions separately for different types of cities. On the one hand, as seen in columns 5–10, the overall statistical significance of finance is diminished when we focus on LFCs, GFCs and capital cities. Some significance appears for the level term, albeit conditional on city type. Furthermore, the squared term turns out to be entirely insignificant. On the other hand, the inverted-U shaped relationship is largely maintained in the subsample associated with cities outside LFCs (columns 11 and 12). 8
It therefore appears that in both its positive and negative aspects finance matters mostly in cities outside LFCs. On the positive side, the local financial sector can be valuable for the growth of such areas as they often have hindered access to capital (Klagge and Martin, 2005). At the same time, these areas are the most vulnerable to the adverse effects of finance.
Despite the significance of local financial development in areas outside LFCs, one could argue that this relationship might become insignificant if considered jointly with the influence of the country’s largest financial centre on the growth of these areas. The hypothesis here is that the more an LFC specialises in finance in relation to the rest of the cities in a given country, the greater will be the spill-over effects from the former to the latter. Even though local financial centres might be able to accommodate the financing needs of local firms to some extent, these firms – particularly when big in size – might prefer to opt for the products and services offered by financial and related firms located in LFCs.
To test this hypothesis, we introduce an additional variable in our baseline regression models. Using the same proxy for financial development as before, we construct a ratio whereby for each city under consideration, we divide the FABS employment share of the LFC of the country in which the city is located, by the FABS employment share of this city. We refer to this variable as LFC specialisation ratio (

where
The last two columns of Table 2 report the results for the models using the
Identification and causality
To protect against endogeneity bias, we conduct a number of exercises. As a first step we run our basic, full-sample, model of Table 2 with lagged regressors. Second, we conduct an instrumental variables (IV) analysis, utilising two different country-level data sets. We first run a model in which the number of automated teller machines (ATMs) in a country is used as an instrument for local financial development. We then run an IV specification based on the tradition of La Porta et al. (1998), wherein creditors’ and shareholders’ legal rights are used as instruments for local financial development (for the 37 of the 75 countries of our sample for which data are available).9,10 Third, we repeat the above exercises with our data formatted in three-year averages. This allows for a larger time dimension and thus more efficient estimations, particularly in the case of lagged models. In order to test the overall robustness of our findings to this change of format, we also re-run some of the basic models of Table 2.
Table 3 summarises our results. As seen in the first two columns, our finance proxy remains significant even after lagging our regressors by one five-year period. In contrast to the basic regressions of Table 2, the main weakness is the partial loss of statistical significance for the squared term of FABS share of employment. Column 3 reports the model with the number of ATMs as an instrument for financial development. Results are positive, and according to the p-value of the under-identification test, ATMs appear to be a valid instrument. Results are also supportive when the legal rights of La Porta et al. (1998) are used as instruments, in columns 4 and 5. 11
Additional models for robustness analysis and endogeneity.
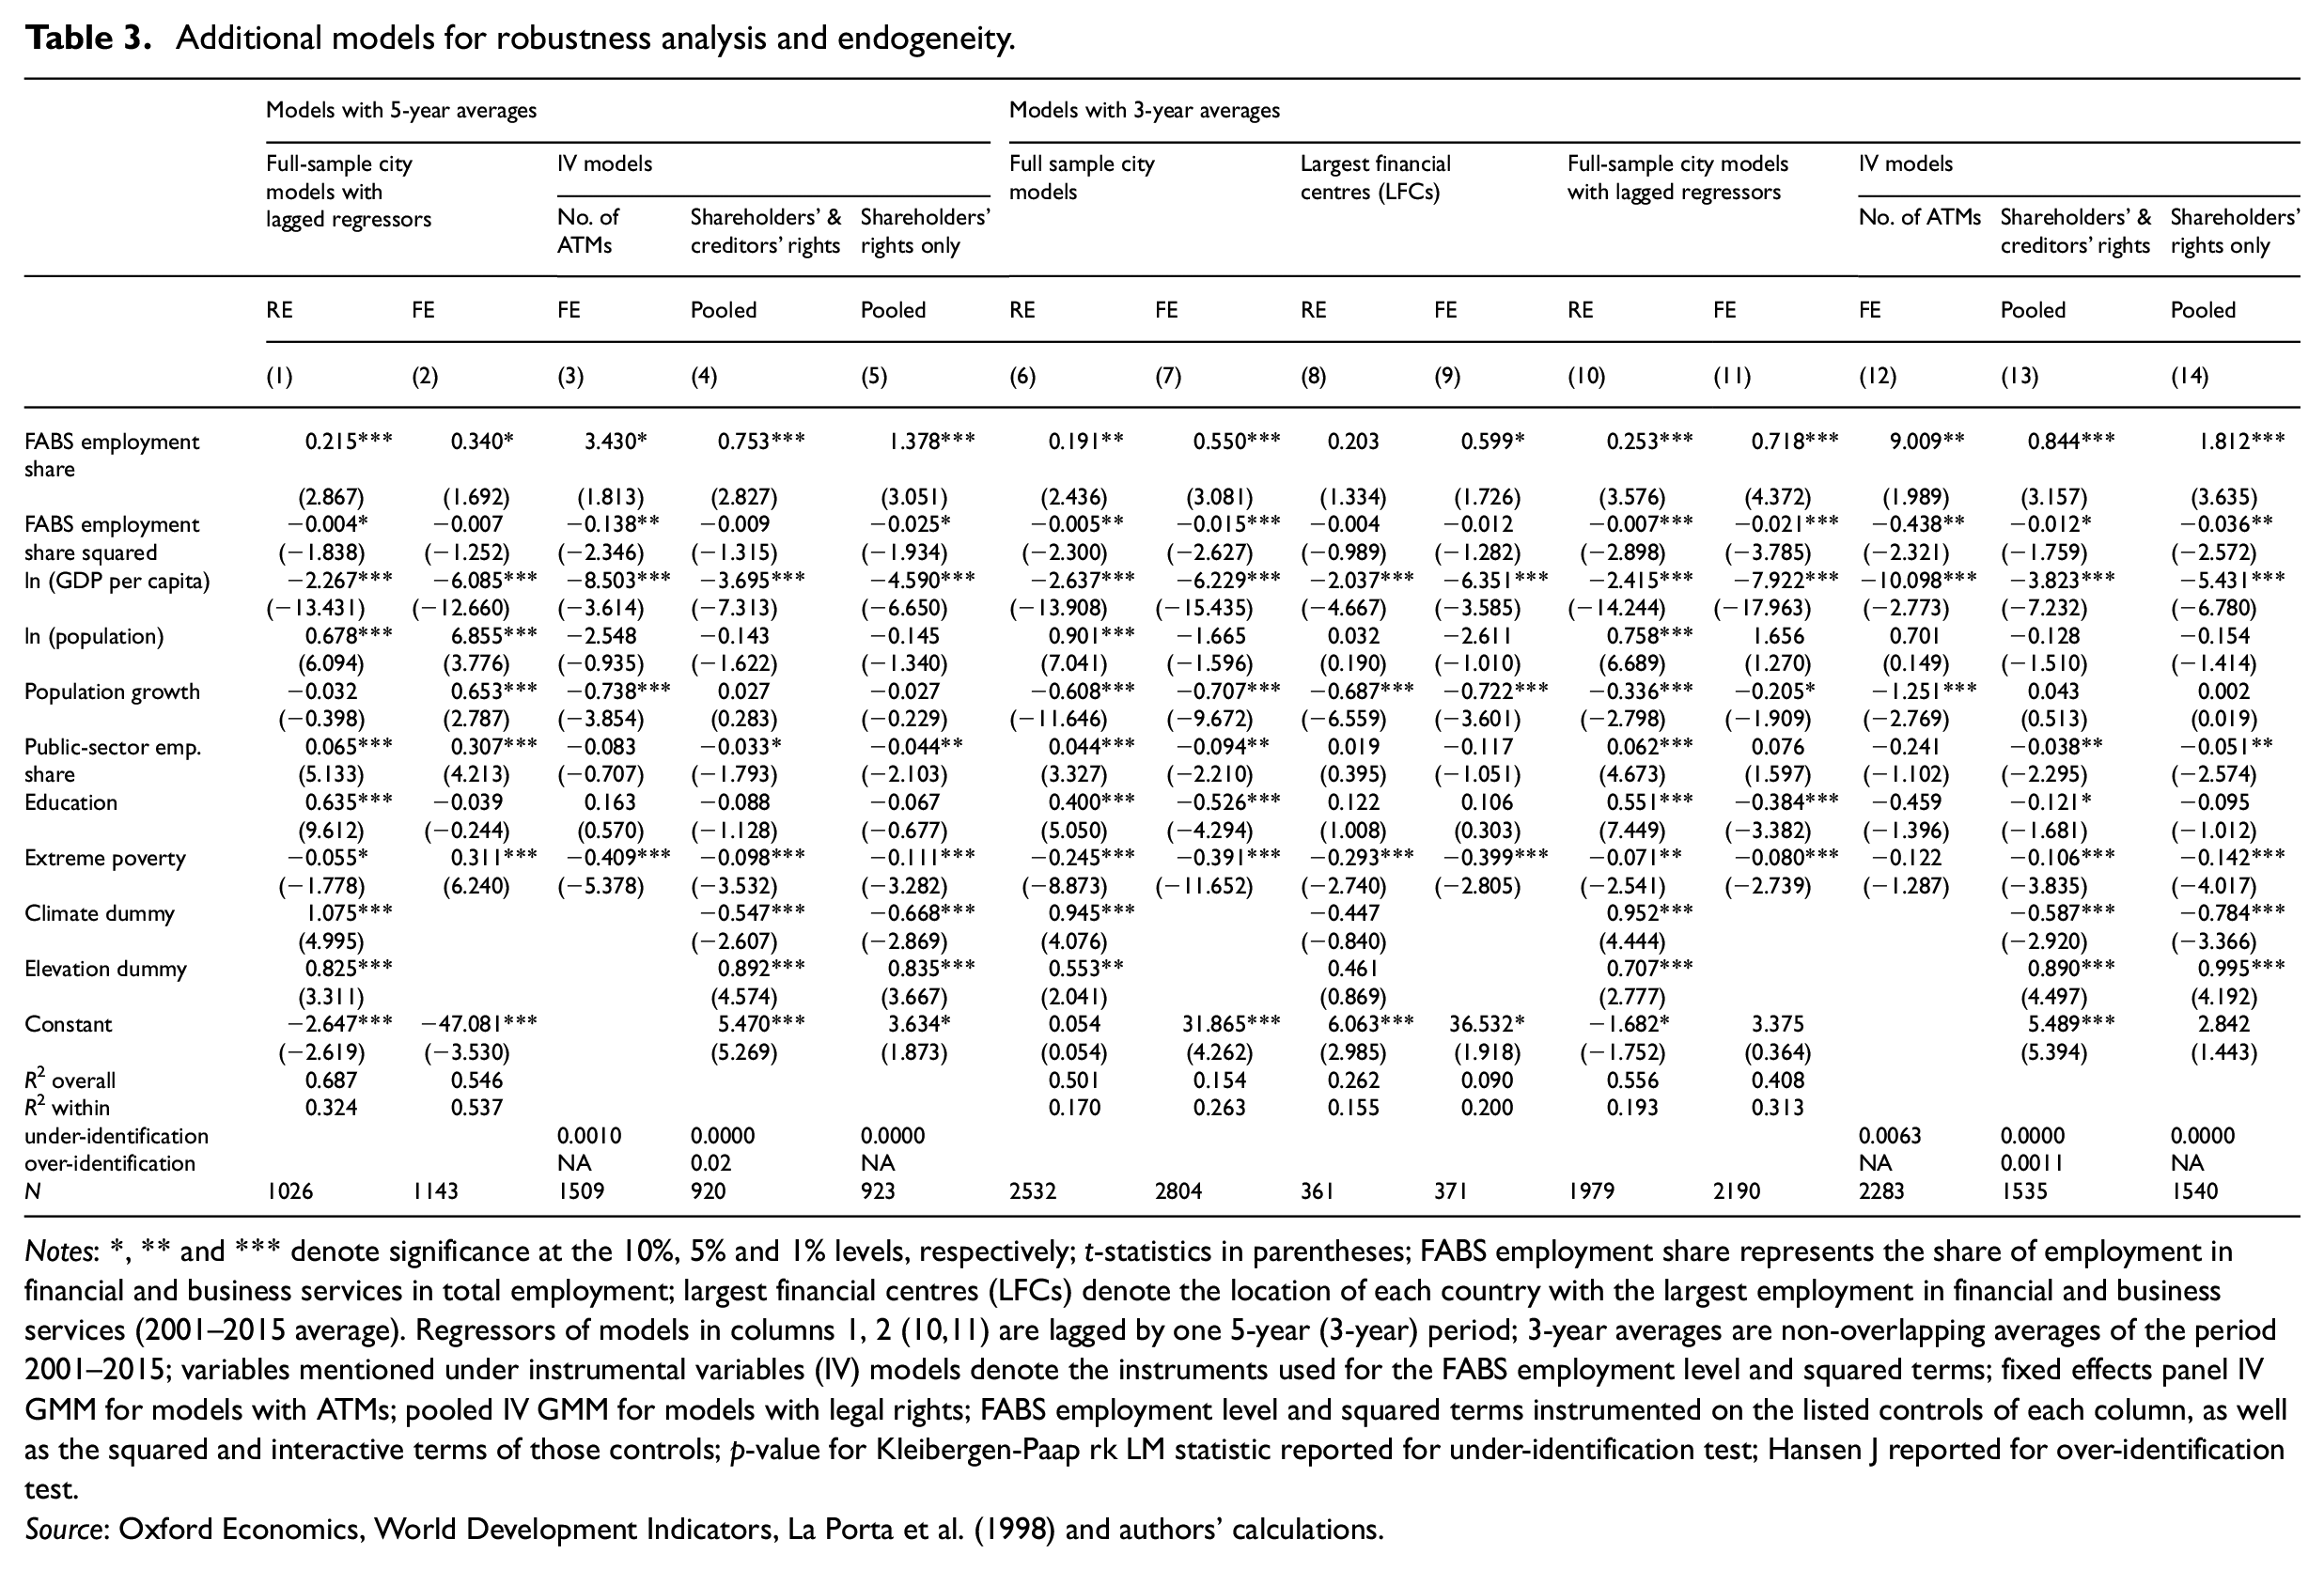
Notes: *, ** and *** denote significance at the 10%, 5% and 1% levels, respectively; t-statistics in parentheses; FABS employment share represents the share of employment in financial and business services in total employment; largest financial centres (LFCs) denote the location of each country with the largest employment in financial and business services (2001–2015 average). Regressors of models in columns 1, 2 (10,11) are lagged by one 5-year (3-year) period; 3-year averages are non-overlapping averages of the period 2001–2015; variables mentioned under instrumental variables (IV) models denote the instruments used for the FABS employment level and squared terms; fixed effects panel IV GMM for models with ATMs; pooled IV GMM for models with legal rights; FABS employment level and squared terms instrumented on the listed controls of each column, as well as the squared and interactive terms of those controls; p-value for Kleibergen-Paap rk LM statistic reported for under-identification test; Hansen J reported for over-identification test.
Source: Oxford Economics, World Development Indicators, La Porta et al. (1998) and authors’ calculations.
The rest of Table 3 presents models based on three-year averages. Columns 6 and 7 report the three-year version of the full-sample model of columns 3 and 4 of Table 2. As can be seen, all results are consistent with before. The models for LFCs (columns 8 and 9 of Table 3) also complement that reported earlier, in showing that the weaker impact of finance in these cities is less likely to be caused by the smaller sample size of these regressions (see discussion in footnote 8). Furthermore, columns 10 to 14 of Table 3 repeat the above-mentioned exercises for dealing with endogeneity. Results are maintained and even strengthened in almost all instances.
Conclusion
Our article focuses on the relationship between finance and growth at the level of cities. In line with the relevant macroeconomic literature we find evidence of an inverted-U shaped pattern. At lower levels of financial development financial expansion appears to promote economic growth. There is, however, a threshold and once it is crossed, finance becomes a drag on economic growth.
Both impacts of finance appear most strongly in areas located outside the largest financial centre of a country. Although smaller cities are the ones that stand to benefit the most from local financial development, they are also the ones that are the most vulnerable. Furthermore, local financial development retains its significance, even after controlling for the extra-local impact of leading financial centres.
In terms of policy implications, the robust significance of local finance shows that financial decentralisation can aid local economic growth. As argued in Klagge and Martin (2005) and Flögel (2018), decentralisation can help build trust and tackle information asymmetries. It can also help maintain wealth and investment within local economies by providing appealing, locally based financial assets to local investors (Klagge and Martin, 2005; Verdier, 2002).
At the same time, financial decentralisation needs to be promoted with great care. The particular vulnerability of the areas of a country outside its largest financial centre ought to remind us that decentralisation should not be confused with a policy of urban financialisation where cities come to be envisioned and reconstructed in the image and likeness of large financial metropoles.
Such lessons are important for all countries, but particularly for emerging and developing economies, where national financial systems, and their spatial structures, are still in a state of flux.
Supplemental Material
USJ889244_supplemental_material – Supplemental material for Finance and growth nexus: An international analysis across cities
Supplemental material, USJ889244_supplemental_material for Finance and growth nexus: An international analysis across cities by Stefanos Ioannou and Dariusz Wójcik in Urban Studies
Footnotes
Acknowledgements
The authors would like to thank the participants of the 5th Global Conference in Economic Geography (Cologne, July 2018) for their fruitful comments and feedback. We are also grateful to Manuel Ojeda Cabral, Michael Urban and Vladimir Pažitka for all the discussions held during the writing of this paper. An additional note of gratitude goes to three anonymous reviewers.
Declaration of conflicting interests
The author(s) declared no potential conflicts of interest with respect to the research, authorship, and/or publication of this article.
Funding
The author(s) disclosed receipt of the following financial support for the research, authorship, and/or publication of this article: The paper has benefited from funding from the European Research Council (European Union’s Horizon 2020 research and innovation programme; grant agreement No. 681337). The article reflects only the authors’ views and the European Research Council is not responsible for any use that may be made of the information it contains.
Notes
References
Supplementary Material
Please find the following supplemental material available below.
For Open Access articles published under a Creative Commons License, all supplemental material carries the same license as the article it is associated with.
For non-Open Access articles published, all supplemental material carries a non-exclusive license, and permission requests for re-use of supplemental material or any part of supplemental material shall be sent directly to the copyright owner as specified in the copyright notice associated with the article.