
Abstract
Since late January 2020 when the first coronavirus case reached England, United Kingdom, the coronavirus disease 2019 (COVID-19) has spread rapidly and widely across all local authorities (LAs) in England. In this featured graphic, we visualise how COVID-19 severity changes nationally and locally from 30 January to 23 November 2020. The geo-visualisation shows that there have been large regional disparities in the severity of the outbreak, and the epicentres have shifted from Greater London, Leicester, to the North of England and remained in the North during pre-lockdown, post-lockdown, easing lockdown and second national lockdown phases. We further find that the increase in the testing capacity may partially explain the sharp increase in the confirmed cases during the second wave of the pandemic. However, the disparities in the severity of COVID-19 (i.e., confirmed cases and deaths) among LAs in England become more significant over time. It further sheds light on the necessity of establishing decisive and timely responses to cope with local pandemic situations.
According to the latest figure from the World Health Organisation (2020), the worldwide pandemic of COVID-19 has reached 61 million confirmed cases and 1.4 million deaths. The global situation is still unfolding rather than relieving as spikes are being seen continuously across the world every day. The United Kingdom, especially England, has also been badly hit in the pandemic. As of 23 November 2020, there are more than 1.3 million confirmed cases and 49,000 deaths in England. The data from Office for National Statistics (2020) further shows that England has had the longest period of excess mortality rates (from all causes) in comparison with 21 European countries during the COVID-19 pandemic (Griffin, 2020).
To better understand how COVID-19 has developed both nationally and locally in England, we use the data from Public Health England (2020a), which reveals daily confirmed cases, tests processed, patients admitted to hospital, and deaths from 30 January to 23 November 2020, and visualise them in both graphical and geographical ways. Figure 1(a) shows the overall trend of COVID-19 pandemic in England with highlights of several key dates when government regulations were announced or placed (e.g., national lockdown, lockdown easing, local alert levels, second national lockdown). Compared to the first wave of the pandemic in March and April, there are soaring COVID-19 cases during the second wave while the positivity rate (i.e., percentage of tests that are positive) is much lower. However, it does not indicate that the second wave is way less severe than the first one as patients admitted to hospital and deaths are surging upward. Besides, the lag of deaths behind hospital admissions implies that the second peak of deaths may have yet to come even if hospitalisation abates.
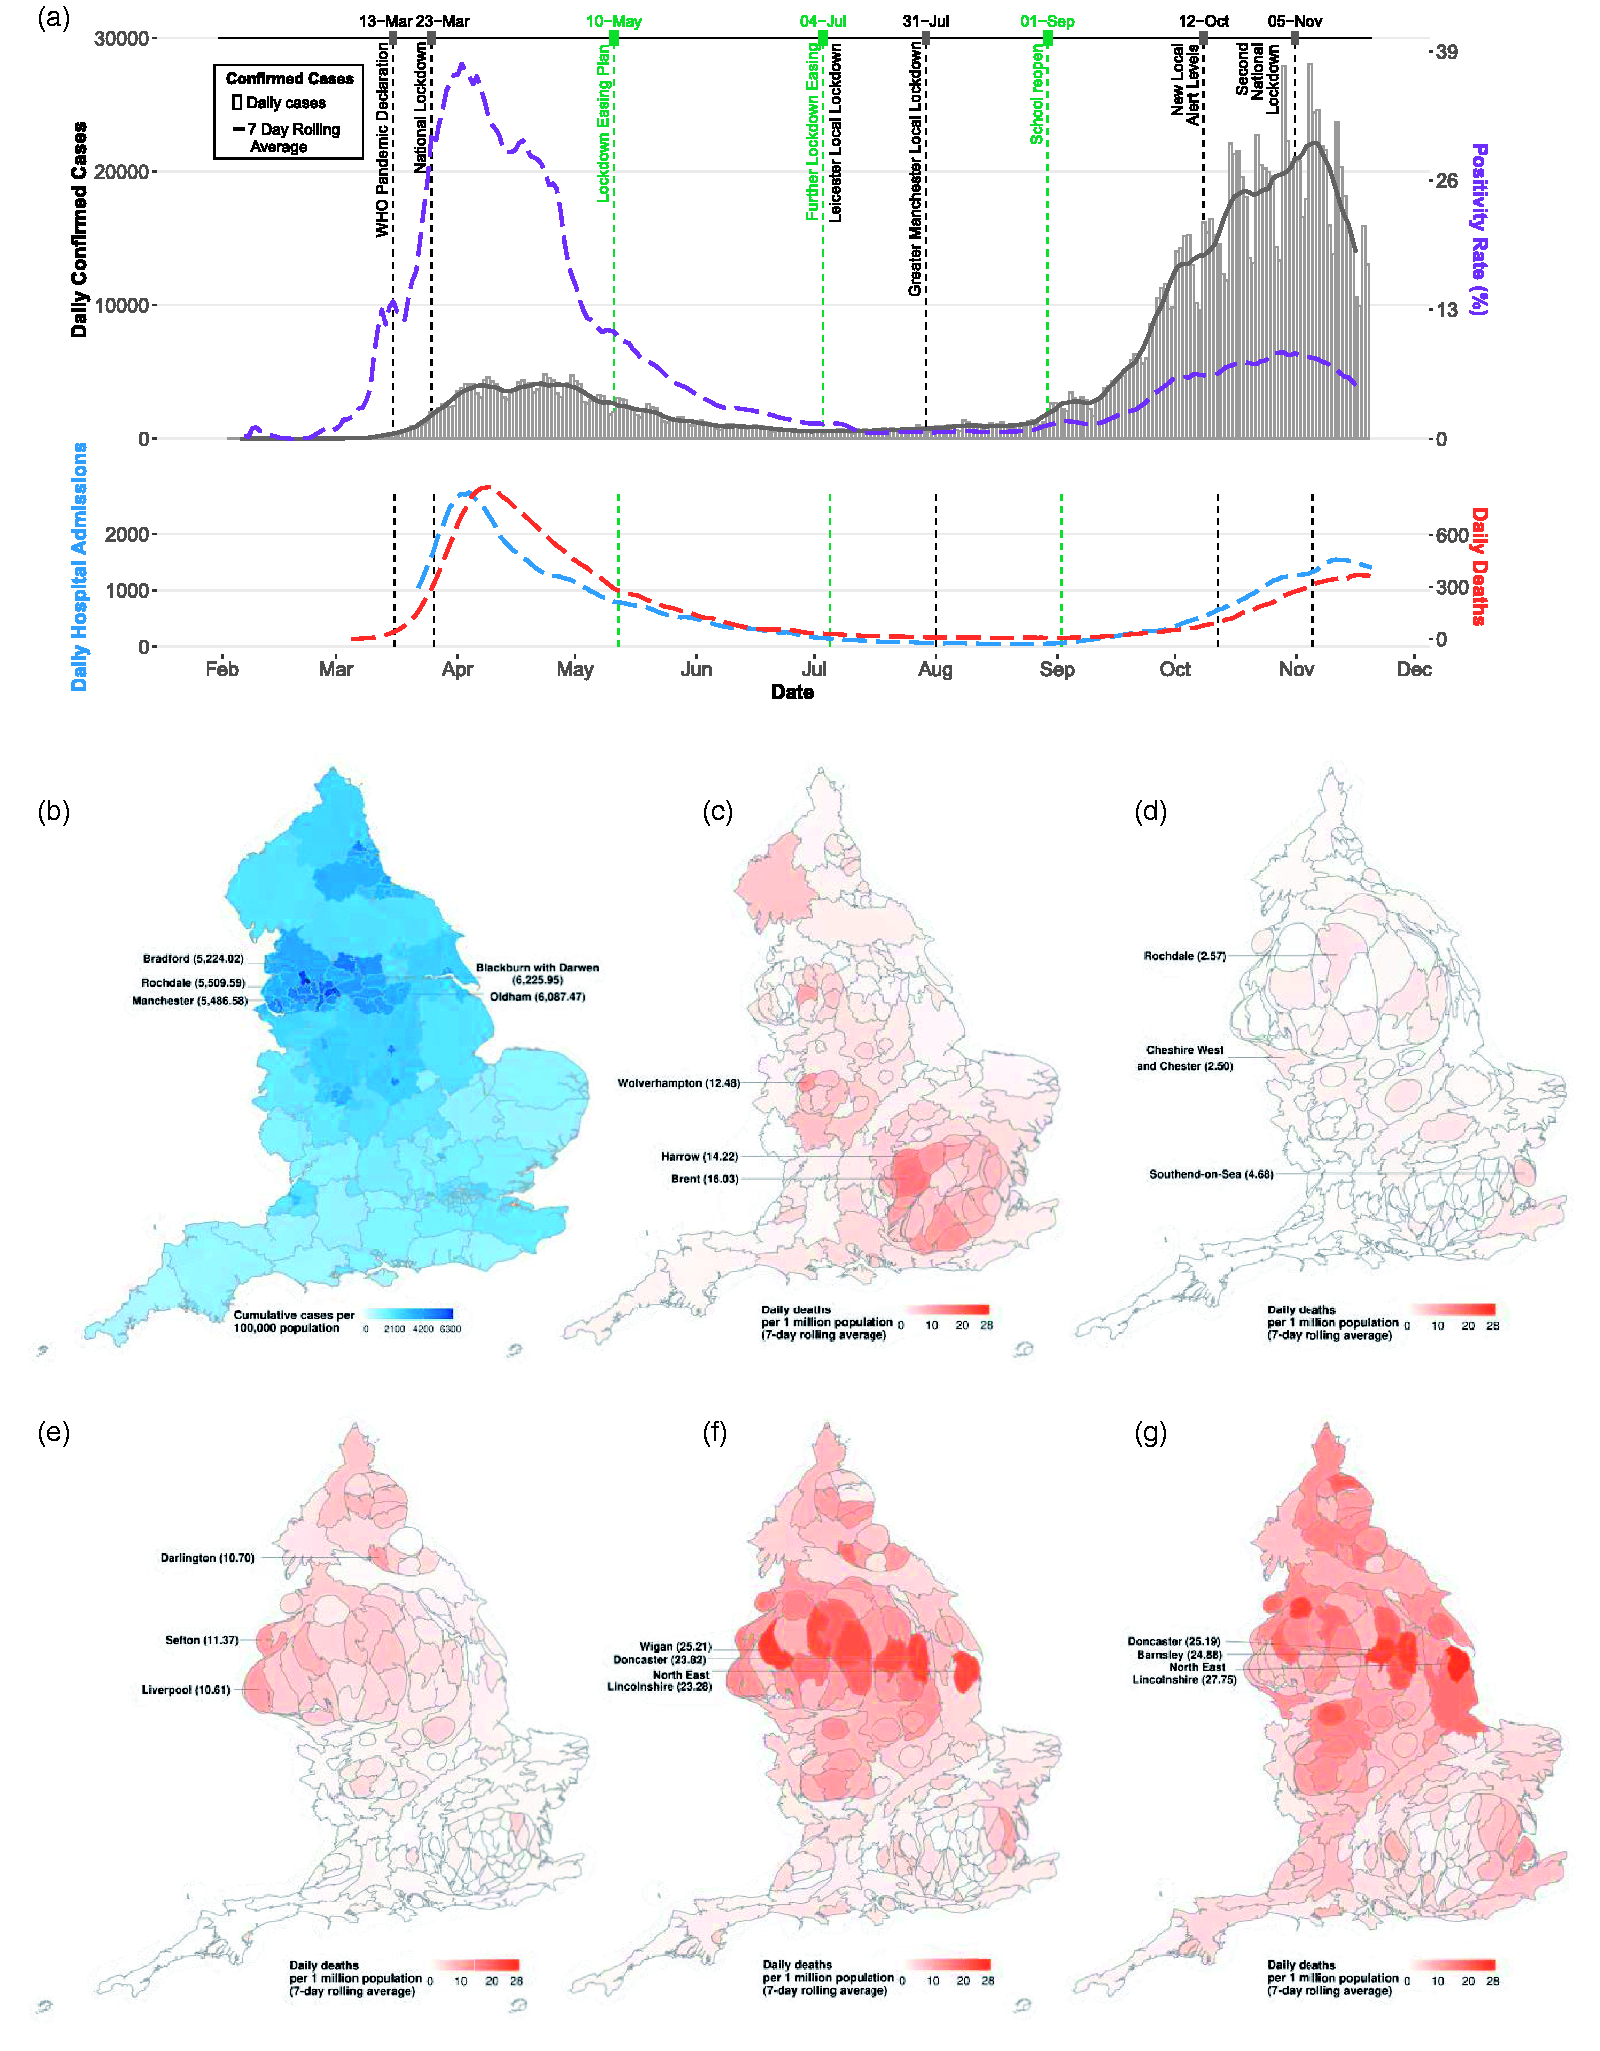
Regional disparities of the risk of Covid-19 across local authorities in England. (a) The severity of Covid-19 in England. (b) Cumulative cases on 23 Nov. (c) Daily deaths on 23 Mar. (d) Daily deaths on 4 Jul. (e) Daily deaths on 12 Oct. (f) Daily deaths on 5 Nov. (g) Daily deaths on 23 Nov.
The latest cumulative confirmed cases per 1,00,000 population across LAs in England is visualised in Figure 1(b), showing the severity of local outbreaks. As stated in the review from Public Health England(2020b), there exist disparities in COVID-19 risk geographically. Blackburn with Darwen has the highest infection rate (6,225.95 per 1,00,000 population) on 23 November, followed by several LAs in the North-West of England (labelled in Figure 1(b)), while the South has relatively low infection rates. From Figure 1(c) to (g), we summarise the regional disparities over time in the severity of the outbreak across LAs in England by using cartogram maps, where the area of each LA is scaled in proportion to the daily confirmed cases per 1,00,000 population, and the filling of each LA reflects the deaths (within 28 days of positive test) per 1 million population. To be more specific, the local authorities with the highest deaths per 1 million population at different phases are labelled in each figure. With the area being enlarged proportionally and the filling being darkened for a more severe LA, the regional disparities of COVID-19 risk are better communicated and visually emphasised.
The findings are three-fold. First, when the first national lockdown was introduced on 23 March 2020, the pandemic was developing more rapidly within Greater London compared to other LAs in the nation. However, disparities in the confirmed cases per 1,00,000 population among LAs were not as significant as in Figure 1(d) to (g), so the shape of the map remains similar to the real map of England in Figure 1(b). Second, although more stringent restrictions were introduced in the North-West of England from 30 July, they did not seem to improve the situation of the pandemic, with the North of England remaining as the epicentre of England in the past three months. Third, although the outbreak may not seem to be as severe as during March for the nation as a whole, the pandemic in several LAs located in the North of England has indeed deteriorated over time with both soaring cases and deaths. The North of England was hit much harder than the South during the second wave of the pandemic. Overall, the disparities in COVID-19 risk in a spatiotemporal manner in England indicates the necessity of timely, decisive and stringent responses to tackle local pandemic situations.
Footnotes
Declaration of conflicting interests
The author(s) declared no potential conflicts of interest with respect to the research, authorship, and/or publication of this article.
Funding
The author(s) disclosed receipt of the following financial support for the research, authorship, and/or publication of this article. This research was partially funded by the Alliance Manchester Business School Strategic Investment Fund on “Data-driven modelling”.