
Abstract
Internal migration has significant impacts on the population structure, public services, economic and social development of local areas. In this research, we adopted the theory and methods of complex network analysis to visualise the internal migration flows across local authorities in England and Wales. The graphic prominently highlights two spatial and geographic characteristics of population mobility in England and Wales: a large proportion of internal migration is associated with clusters of neighbouring or nearby local authorities, and the most urban authorities, such as London and other major metropolitan cities, have net outward internal migration (i.e., more people moving out than in).
Internal migration refers to the movement of people involving a change of usual residence within a country (Smelser and Baltes, 2001), and modelling internal migration flows can contribute towards a better understanding of the characteristics of population mobility and its potential economic and social impacts. This research aims to visually highlight the spatial and geographic patterns of internal migration in England and Wales, through applying the theory and methods of complex network analysis. The latest internal migration data between local authorities in England and Wales in the year to mid-2019 are collected from the Office for National Statistics (2020).
The construction of a complex network provides a graphic representation of measurable variables as nodes and their interactions as edges. To unveil the spatial and geographic characteristics of population mobility in England and Wales, an internal migration network is constructed in Figure 1, where nodes are used to denote the local authorities and edges to represent the migration flows. The size of each node is proportional to the population size of the corresponding local authority, while the colour indicates the net internal migration rate, which is calculated as the net number of internal migrants as a percentage of the local authority’s population in mid-2018. The width of each edge is determined by the inflow size of migrants moving from one local authority to another. The backbone network filters out those small inflows of having less than 250 internal migrants. In contrast, an estimated 3.39 million people moved residentially between local authorities in England and Wales in the 12-month period to mid-2019 (ONS, 2020).
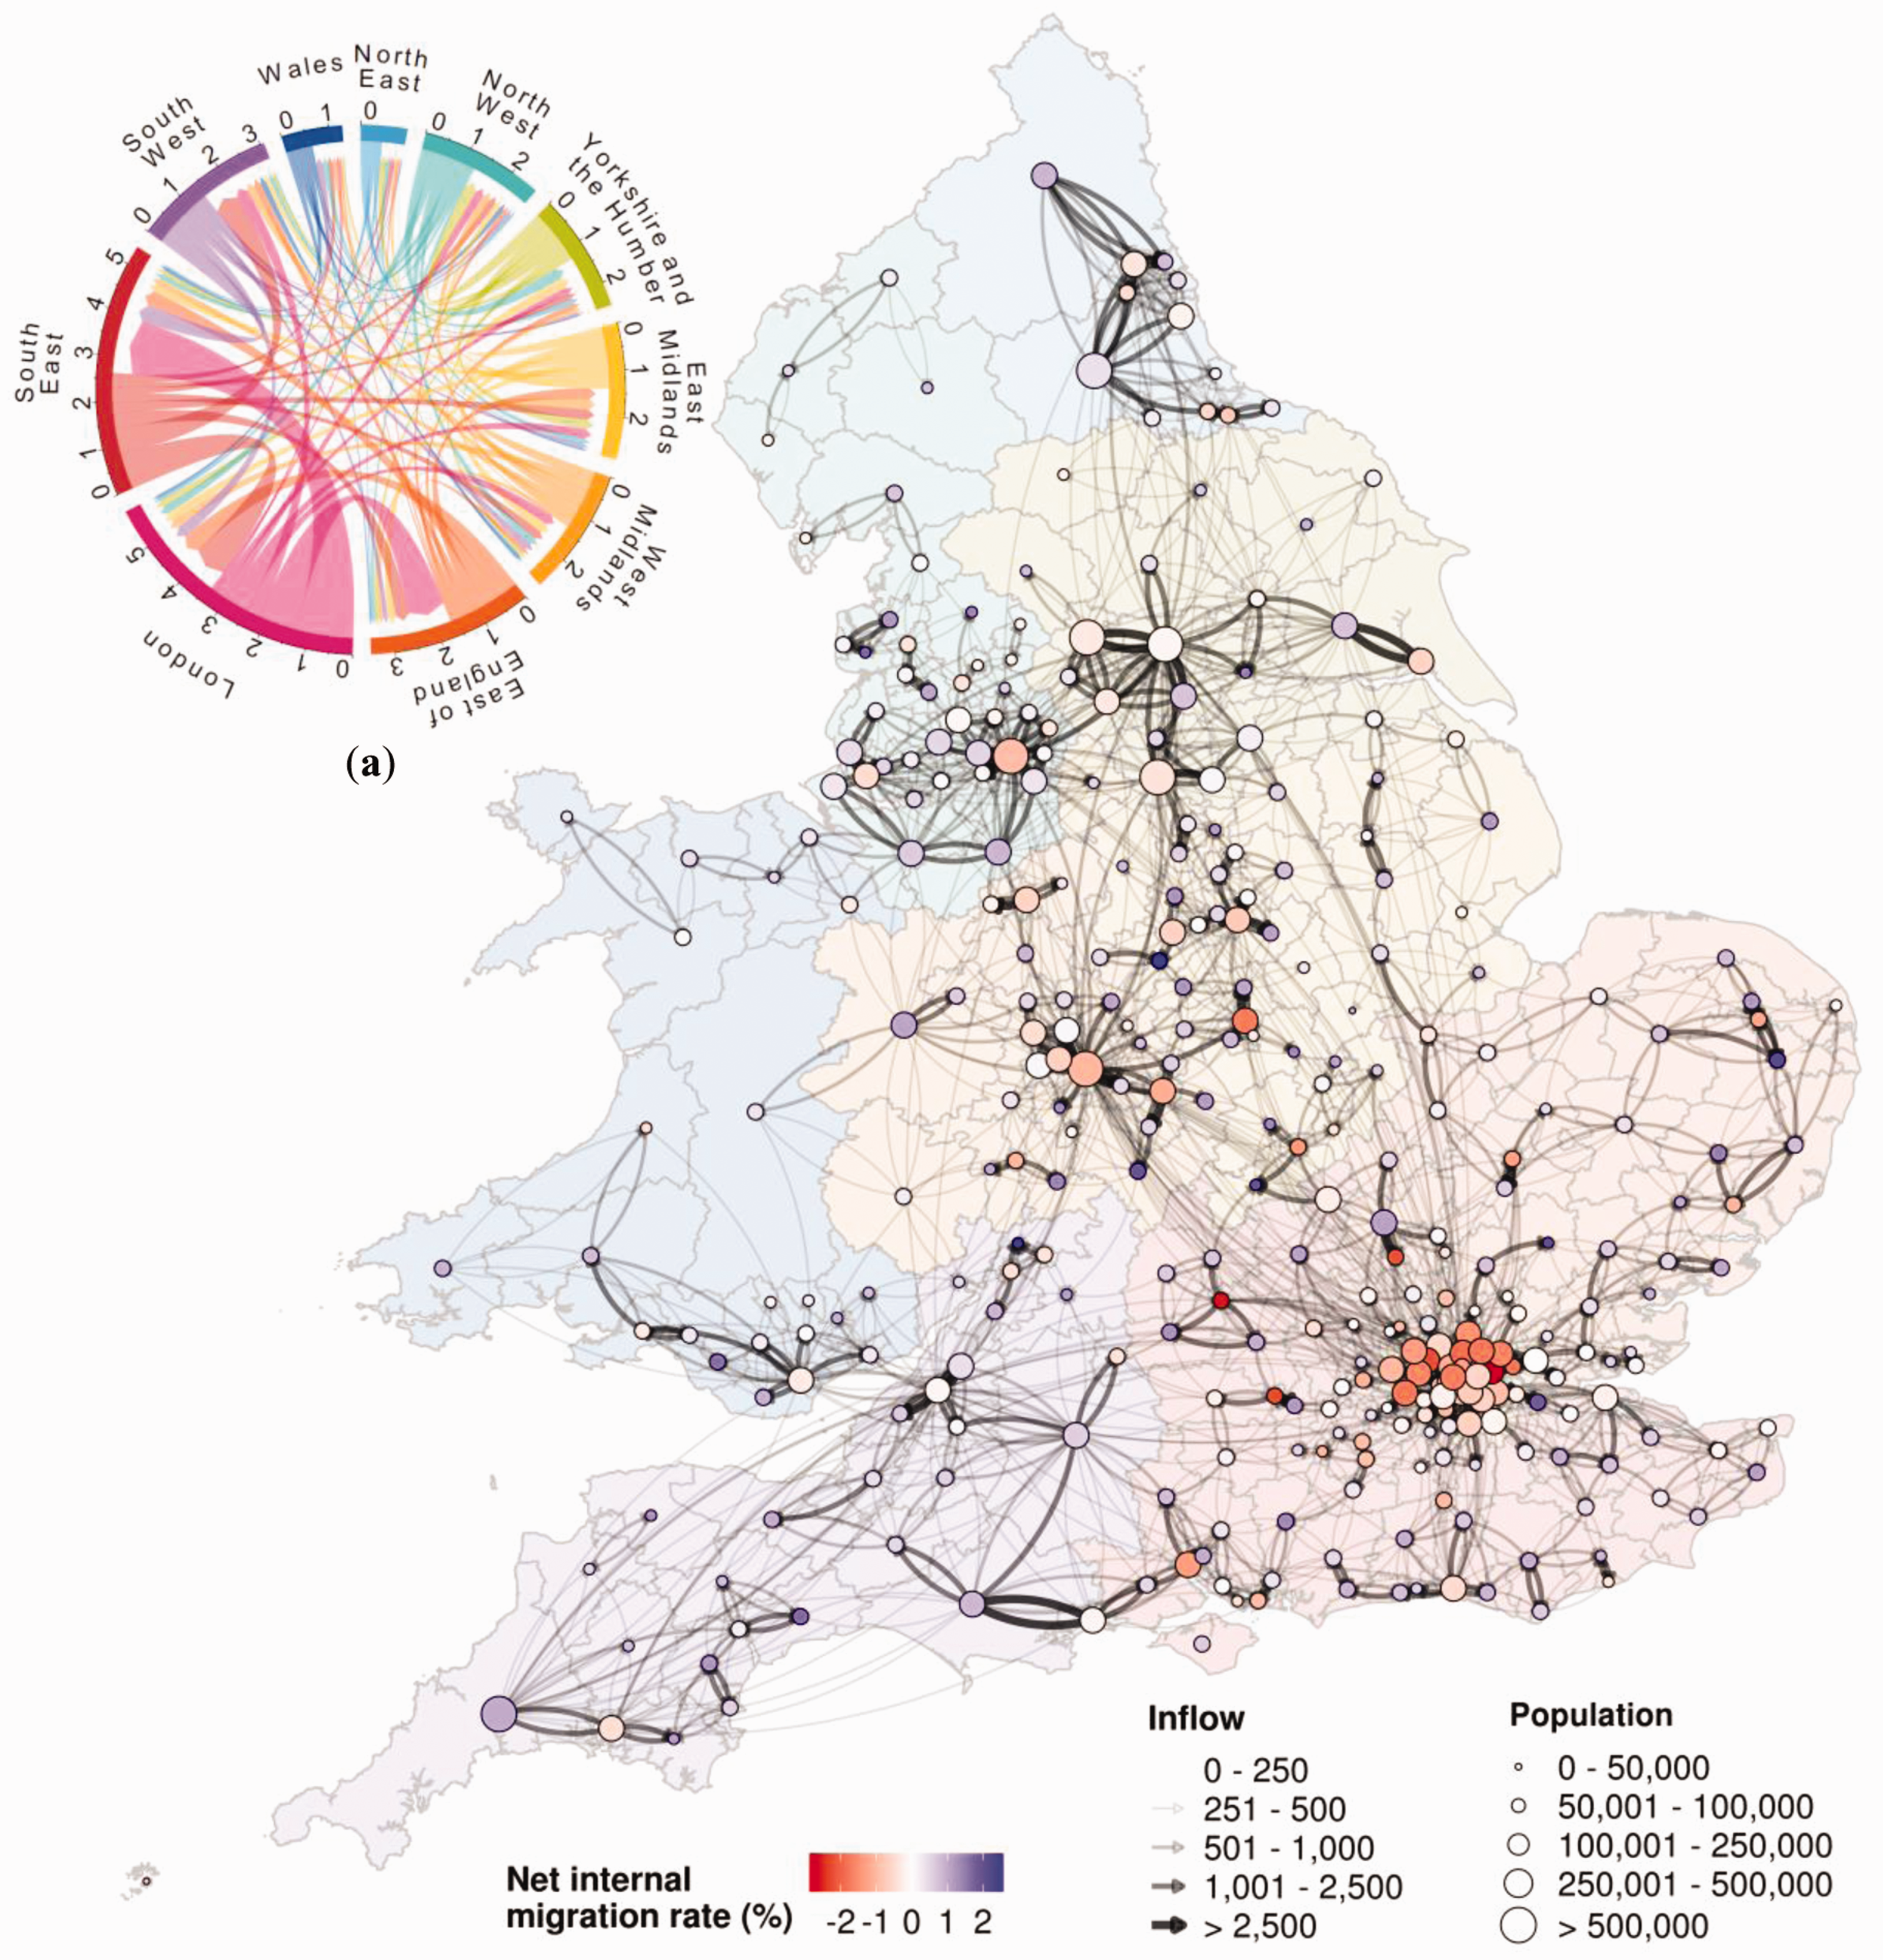
Visualisation of internal migration flows between local authorities in England and Wales in the year to mid-2019. (a) Chord diagram of internal migration flows (unit: 100,000) across the nine English regions and Wales in the same period.
The graphic prominently highlights two key characteristics of population mobility in England and Wales. (1) The internal migration is geographically widespread in England and Wales in terms of the densely connected structure of the internal migration network, and it is particularly notable that people tend to move within clusters of neighbouring or nearby local authorities. In fact, two-thirds of population moves in London are to other local authorities within the London region (ONS, 2020). The supplementary chord diagram in Figure 1(a) further depicts the bilateral migration flows across the nine English regions and Wales. The width of the chord indicates the number of migrants who moved out from the origin (Qi et al., 2017). For example, the circular visualisation shows that large outflows of migrants moved out from London to the East or South East of England. (2) The most urban authorities, including many London boroughs and other major metropolitan cities, such as Birmingham, Manchester, Leeds and Cardiff, have net outward internal migration (i.e., more people moving out than in), while the rural authorities, such as those across the South West of England, have relatively high levels of net internal migration. Similar graphics can also be constructed to visualise the characteristics of international migration networks in the UK and globally to support informed planning and decision making on migration policies, public services, economic and social development strategies, and so forth.
Footnotes
Declaration of conflicting interests
The author(s) declared no potential conflicts of interest with respect to the research, authorship, and/or publication of this article.
Funding
The author(s) received no financial support for the research, authorship, and/or publication of this article.