
Abstract
The geography of urban innovation in the United States has often been portrayed as dominated by a few large cities. However, emerging perspectives challenge this notion by highlighting the significance of secondary cities for innovation processes. Unfortunately, prevailing narratives and empirical evidence focus on technological invention only, measured by patents. This study aims to reevaluate the geography of urban innovation by considering various phases of the innovation process and incorporating a broader range of innovation types. In addition to conventional patent metrics, this research suggests incorporating trademarks and design rights as complementary data. The findings reveal that large cities still exhibit prominence when examining absolute counts of innovation. Instead, analysing intensities allows the identification of secondary cities that specialise in various innovation activities beyond technological invention only. Overall, the findings provide compelling evidence that urban innovation in the United States is not limited to a few large cities nor is it solely driven by technological invention.
Introduction
Significant attention from academia and policymakers is devoted to identifying and supporting local innovative potential, embedded within the capabilities of individuals and organisations in specific places. Innovation activities tend to be highly concentrated in particular geographic areas, and this spatial clustering often reinforces itself, aligning with the concept of path-dependent and place-dependent evolutionary processes (Feldman and Kogler, 2010). Consequently, most innovation maps exhibit notable peaks of activity in specific locations, as exemplified by Florida’s well-known depiction of ‘The World is Spiky’ (Florida, 2005). More specifically, these innovation spikes tend to correspond to large metropolitan areas, leading to the assertion that urban agglomerations disproportionately drive innovation, as evidenced by studies on urban scaling (Bettencourt et al., 2010). The United States (US) has been prominently featured in this discussion, serving as the quintessential example of a country where the majority of innovation occurs in a select few cities possessing world-leading technological capabilities (Balland et al., 2020).
Alternative perspectives are also emerging, challenging this prevailing ‘large cities narrative’. Certain innovation activities might rely on agglomeration externalities less than others (Duranton and Puga, 2001), thereby opening opportunities for secondary cities (Ó Huallacháin and Douma, 2021) and more peripheral locations (Glückler et al., 2023; Shearmur, 2015). Moreover, a significant portion of the evidence regarding agglomeration and innovation primarily focuses on technological invention rather than innovation itself (Carlino and Kerr, 2015; Shearmur et al., 2017). Actual innovation involves the translation of inventions into new products, processes, or services that can be adopted or purchased by other economic actors. Therefore, while inventions represent potential innovations, innovation does not necessarily rely solely on technological invention.
In this study, I contribute to these lines of research by suggesting that the current perspective on urban innovation in the US can be enriched by shifting the focus beyond invention and technology alone, towards an emphasis on commercialised innovation that incorporates non-technological or ‘soft’ innovation as well (Stoneman, 2010). I contend that by expanding the concept and measurement of innovation, a more comprehensive map of urban innovation across US cities can be created.
Hence, the question that motivates this work is: What do broader innovation metrics reveal about patterns of urban innovation in the US?
The question is both a conceptual and an empirical one. Studies on urban innovation have predominantly relied on patents as the standard metric for measuring innovation (Carlino and Kerr, 2015). However, this empirical choice conceals a more significant issue that aligns with the prevailing emphasis on technological novelty within innovation narratives. As expressed by Carlino and Kerr (2015: 349), ‘Innovation comes in many shapes and sizes, except in economic studies’. This perspective extends to policy narratives as well. Breznitz (2021) refers to the phenomenon as ‘techno-fetishism’, wherein (local) policymakers tend to focus solely on the early and captivating stages of innovation processes. Consequently, these policymakers often overlook or undervalue other forms of innovation in which local firms can specialise, such as design and product development. Similarly, policymakers and investors across different regions are often drawn to the same high-tech (manufacturing) sectors and fixate on replicating the success of renowned yet unique clusters like Silicon Valley. This situation implies that innovation in other sectors remains unnoticed and is not recognised as a significant source of employment and economic prosperity (Delgado and Mills, 2000; Janssen and Castaldi, 2018; NESTA, 2007).
While acknowledging the limitations of patent data, it is surprising that there have been relatively few attempts to explore alternative metrics of innovation. Despite the initial consideration of commercialised product innovation at the state level in seminal work on the geography of innovation (Audretsch and Feldman, 1996; Feldman, 1994), subsequent studies have predominantly relied on patents as the primary metric. In this study, I argue that supplementing patent metrics with two additional metrics, namely trademarks and design rights, can provide a more comprehensive understanding of urban innovation activities, going beyond technological invention only. All three metrics – patents, trademarks, and design rights – are forms of intellectual property rights and are widely used by innovative individuals and companies as a means of formal appropriation. In principle, they are highly correlated, both at the firm and at the regional level. Yet, they also provide distinct insights, because: (i) not all firms and not all places excel in every phase of the innovation process and (ii) certain innovation processes prioritise downstream or user-driven learning rather than relying solely on the discovery of technological novelty.
In what follows I first review the competing narratives on large and secondary cities, with a focus on the evidence for the US. I will then discuss the three innovation metrics proposed in this study and what they do or do not capture. After explaining the data and methods, the empirical section presents novel evidence on the geography of urban innovation in the US during the 2010–15 period. I will conclude by discussing opportunities for further research and policy implications.
Urban innovation in the US: Main narratives and stylised facts
Agglomeration and innovation: The large city narrative
Duranton and Puga (2004) review the literature on agglomeration and innovation. They discuss three main mechanisms that explain why large cities have clear advantages when it comes to innovation. The first mechanism refers to ‘sharing’: large cities allow the formation of markets for specialised inputs that innovative firms can benefit from, from skilled labour to facilities. A second mechanism is ‘matching’: matching in labour markets in large cities is more likely to succeed, thanks to thick markets. A third mechanism is ‘learning’: large cities host more people and ideas, which increases the chance of knowledge spillovers, thanks to proximity.
Empirical studies have provided support for all three mechanisms, particularly in the case of the US. A notable approach that has effectively captured the narrative of large cities is the research on urban scaling (Balland et al., 2020; Bettencourt et al., 2007). Super-linear urban scaling is evident in the tendency for urban indicators to increase with city size. Scaling studies have utilised indicators such as patents, inventors, and research and development (R&D) employment, which capture technological inventions, as well as employment in creative sectors as a proxy for non-technological activities (Bettencourt et al., 2007). The fundamental intuition behind the super-linear scaling of urban innovation is that larger cities exponentially increase opportunities for knowledge spillovers. Thus, they function as ‘innovation machines’ (Florida et al., 2017) and are regarded as the epicentres of innovation. Moreover, Balland et al. (2020) discovered that scaling laws are even more pronounced for complex technologies, which notably benefit from specialisation and collaboration.
Several authors (including Carlino and Kerr, 2015; Shearmur et al., 2017) have expressed concerns regarding the limited empirical confirmation of the relationship between agglomeration and innovation, due to an exclusive focus on metrics of technological invention. Many of the prevailing stylised facts concerning the geography of innovation (Feldman and Kogler, 2010) primarily pertain to invention rather than innovation. Unfortunately, this distinction is not always acknowledged, leading to hasty conclusions drawn about innovation. The differentiation between invention and innovation traces back to the pioneering work of Schumpeter (1939), who emphasised that actual innovation occurs when inventions successfully reach users and generate economic value.
When moving from technological invention to actual innovation, authors have proposed several arguments as to why innovation would be more concentrated than invention (Acs et al., 1992; Feldman, 1994). To start with, the role of spatial proximity varies across the phases of the innovation process. Davids and Frenken (2018) suggest that geographical proximity will tend to matter most in the research and marketing phase, and less in the product development phase. They relate these patterns to the properties of the knowledge bases most relevant in each phase: research relying mostly on analytical knowledge, product development on synthetic and marketing on symbolic knowledge (Asheim et al., 2007). ‘Symbolic workers’, associated with this last type of knowledge, are expected to favour large cities, both for the amenities and for the characteristics of their work, more than scientists and engineers involved in research and invention (Florida et al., 2017).
Substantially fewer studies have drawn maps of urban innovation, rather than invention. Feldman (1994) already recognised that inventions and commercially viable innovations are distinct and have specific geographies. Feldman used data from the US Small Business Administration (SBA) to capture product innovation in manufacturing. At present that data (also used in Audretsch and Feldman, 1996) is still one of the few metrics of actual innovation found in the geography of innovation literature. Unfortunately, the SBA data collection was a one-time effort without any follow-up. Hence the jury is still out on whether agglomeration and concentration are key drivers beyond the evidence of technological invention.
Innovation without agglomeration: The emerging secondary city narrative
An increasing number of studies have raised concerns about the generalisation that large cities solely dominate the innovation landscape by highlighting the specific role that secondary cities can play. While this phenomenon has been extensively observed in the European context (Fritsch and Wyrwich, 2021b; Iammarino et al., 2019), evidence also suggests that it applies to the US.
A well-known argument put forth by Duranton and Puga (2001) suggests that firms in later stages of corporate technology life cycles may have a reduced need for a diverse urban environment compared to radically innovative startups. Secondary cities can offer an ideal setting for these ‘slower’ modes of innovation, particularly those focussed on process innovation. Consequently, the diversity provided by urban agglomerations appears to be most advantageous for entrepreneurs in the early phases of their corporate life cycle (Tavassoli et al., 2021).
Secondary cities offer more Marshallian than Jacobian type of externalities (Ó Huallacháin and Lee, 2011), which may be particularly conducive to incremental inventions and inventions in mature industries. Simultaneously, secondary cities can excel in specific technology sectors thanks to being company towns, university towns, or part of a larger agglomeration (Ó Huallacháin and Douma, 2021). Some studies on the US have proposed taxonomies that build upon the relative weight of large or small firms within cities or regions (Clark et al., 2010; Ó Huallacháin and Douma, 2021), although these taxonomies have primarily relied on patent data.
An emerging body of literature on innovation in the periphery suggests that some of the perceived shortcomings of peripheral and secondary cities can also be viewed as advantages (Eder, 2019; Glückler et al., 2023). This literature provides valuable insights that extend beyond the realm of technological invention (Eder and Trippl, 2019). On the one hand, this literature demonstrates that soft innovation, rooted in creativity and cultural assets, can thrive in peripheral and disconnected contexts (Grabher, 2018). This perspective challenges the notion that creative activities are predominantly concentrated in large cities (Florida, 2014). On the other hand, innovation in peripheral areas may revolve around the utilisation of territorial assets (Dinis, 2006). It is worth noting that while this literature has primarily focussed on European cases, there is also limited evidence available regarding the US.
Lastly, there is a limited body of literature focussing on the geography of service innovation. Service industries have predominantly been considered as complementary activities within urban innovation studies, benefitting from the availability of a skilled workforce (Moretti, 2012). However, Shearmur (2012) found that the geographic distribution of innovative knowledge-intensive business services (KIBS) does not necessarily conform to patterns dictated by agglomeration.
Overall, the picture emerging from the views outlined above is one of a richer geography of innovation, with more places and patterns of innovation than large cities or technological invention only. From a methodological standpoint, a warning from this strand of research is that one should consider metrics of intensity, that is, innovation counts relative to population (Ó Huallacháin and Douma, 2021) or to employment in innovation-related occupations (Wojan, 2022). This point will be considered in the empirical analysis of this study.
Innovation metrics complementing patents
Patents, trademarks and design rights
Measuring innovation is a complex task that has been approached in various manners (Carlino and Kerr, 2015). Intellectual property right registers have emerged as valuable resources due to their systematic compilation of filings, providing extensive information on the subjects and objects of the intellectual property in question. When filing an intellectual property right (IPR), applicants undergo an administrative review process where examiners assess the filing against a set of formal requirements. IPR offices maintain comprehensive and historical records of these filings, which are increasingly accessible in user-friendly formats. For many decades, quantitative studies on innovation have relied heavily on the abundant information available in patent registers (Griliches, 1990; Hall et al., 2001). Patents offer several advantages for measuring invention, primarily due to their requirement of meeting well-defined novelty criteria. Patents can be filed for technical inventions that are deemed suitable for industrial application. However, it is important to acknowledge the limitations of patent data. In the case of the United States Patent and Trademark Office, Jaffe and Lerner (2011) have drawn attention to a significant portion of patents that are filed solely for strategic purposes and may not accurately capture actual innovation.
Recently, researchers have started exploring alternative IPRs to complement patent statistics (Castaldi and Mendonça, 2022; Wojan, 2019, see also Gatrell and Ceh, 2003 for an early take). Trademarks, which are distinctive symbols used by producers to differentiate their goods and services, have gained attention in this regard. Gatrell and Ceh (2003) and Mendonça et al. (2004) were among the first to propose the use of trademarks as metrics for innovation, and subsequent empirical studies have provided extensive evidence supporting this approach (Flikkema et al., 2014, 2019; Ribeiro et al., 2022). While not all trademarks are directly related to innovation, they do indicate the commercialisation of products and services, as filers must comply with so-called use in market requirements (Graham et al., 2013). A significant portion of trademarks does indeed pertain to ‘corporate creativity’ (Gatrell and Ceh, 2003) and innovation, and they can complement patents in various ways (Castaldi, 2020). First, they can capture the more downstream phases of innovation, hence signalling which patents make it to the market. For example, a company like Tesla files new trademarks when introducing new car models to the market. Second, trademarks can capture innovations that may not meet the criteria for patentability due to their non-technical nature. Many service innovations, for instance, do not fulfil the patentability requirements but can be identified through trademark filings (Schmoch, 2003). This includes new services developed in information-intensive sectors, as demonstrated by González-Pedraz and Mayordomo (2012) who used new trademark filings to capture new products by commercial banks, as well as innovations in low-tech personal service sectors (Parviainen, 2011). Trademarks can also indicate the emergence of new business models (Desyllas and Sako, 2013). Third, they can capture innovation in more sectors and firm types, in particular, young and small firms that find patenting too complex or costly (Castaldi et al., 2020). Trademark filings are much more widespread across sectors and firm types than patent filings (Dinlersoz et al., 2018; Gatrell and Ceh, 2003; Ribeiro et al., 2022). Overall, both firm-level and project-level evidence, reviewed in Flikkema et al. (2019), points at trademarks being valid innovation metrics.
Some researchers have explored the use of design rights as a potential metric for capturing innovation, specifically focussing on aesthetic forms of innovation, but also technical design (Filippetti and D’Ippolito, 2017; Filitz et al., 2015; Stoneman, 2010). In the context of the US, design rights are filed as design patents at the USPTO. Like patents, design rights undergo checks for novelty and industrial applicability. However, design patents specifically pertain to technical design more than creative design (Schickl, 2013). To illustrate this point, consider Tesla’s approach to innovation, where design plays a central role. Tesla has filed numerous design patents, such as the recent filing of a design patent for a new steering wheel (patent US-D932398-S).
One way to establish the validity of IPRs as innovation metrics is to check whether innovators file IPRs more than non-innovators: a few studies have done that and found evidence of significant links between survey-based and IPR-based measures of innovation (Jensen and Webster, 2009; Wojan, 2019). Of the three metrics, design rights are probably the ones with less evidence of their validity as innovation metrics. Filitz et al. (2015) discuss two main reasons: conceptually, design innovation is still not clearly defined and empirically, many firms involved in design make little use of design rights (Vankan et al., 2014). Still, for our purpose here it is most relevant that design rights capture design activities, which might not represent design innovations themselves but still play a role in innovation processes (Marsili and Salter, 2006). It is fair to say that the use of design rights as innovation metrics is still somewhat experimental, but they are finding their way into regional studies (see Castaldi and Drivas, 2023; Corradini and Karoglou, 2023; Pinate et al., 2023).
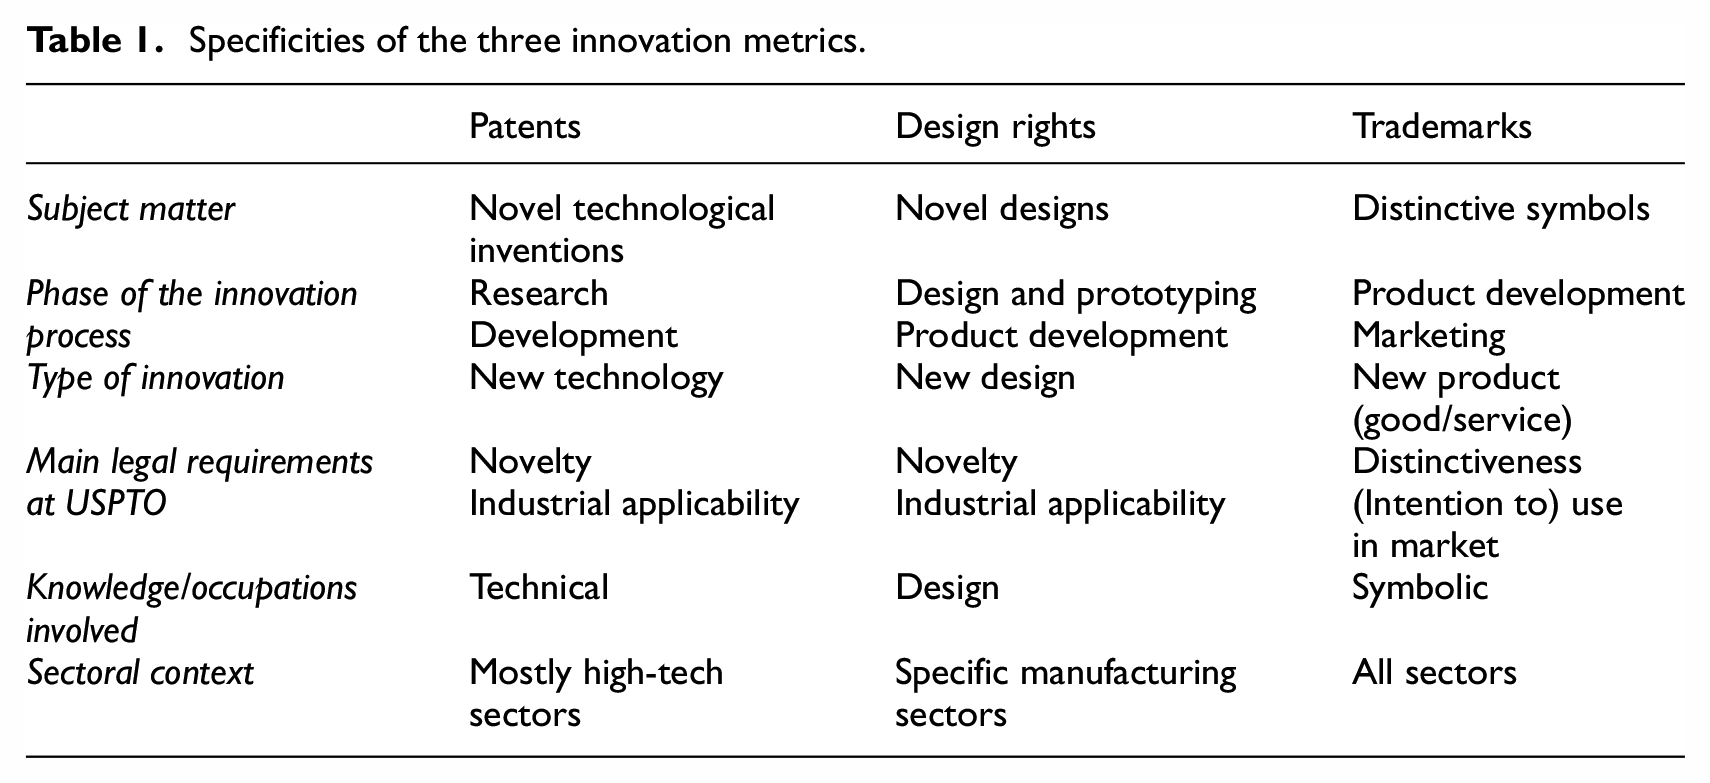
Table 1 summarises the specificities of the three innovation metrics, in terms of properties and reference to specific innovation activities, knowledge bases and occupations, and sectoral context covered. Upstream technological invention activities tend to rely on scientific and technological knowledge bases, while downstream innovation phases and non-technological innovation build upon symbolic knowledge bases.
Specificities of the three innovation metrics.
Caveats and limitations of IPR counts
Importantly, design rights and trademarks are not the only way to capture innovation beyond invention: entrepreneurship and venture capital data also show where commercialisation activities take place (Guzman and Stern, 2015; Samila and Sorenson, 2011), with specific strengths and weaknesses as innovation metrics (Carlino and Kerr, 2015). In particular, venture capital activity tends to focus on specific high-tech sectors only (Gompers and Lerner, 2006), while entrepreneurship data can offer a broader take if high-quality entrepreneurship can be discerned. A salient feature of design rights and trademarks is that they are highly comparable data to patents, also registered at the same office. In this sense, they are easier to combine than data coming from different sources and with different properties.
The limitations of IPR-based measures are also evident. A large share of innovation is not protected with IPRs and the use of IPRs is concentrated in specific firms and sectors (Cohen et al., 2000). Even if relying on trademarks and design rights helps to broaden the firms and sectors covered (Castaldi and Mendonça, 2022; Wojan, 2019), some innovation activities remain poorly represented by IPR counts. This is for instance the case for creative and cultural industries (Castaldi, 2018). Still, creative workers do contribute to innovation by fulfilling occupations in design and product development, so from an occupational rather than sectoral point of view their contribution to urban innovation specialisations is significant (Rodríguez-Pose and Lee, 2020). Finally, IPR filings may have an urban bias or even a large city bias. Specialised services that support firms with IPR filings tend to concentrate in large cities. Also, there might be a headquarters’ effect for large companies: IPRs get registered at the location of the company headquarters, which are more likely to be in large cities. Moreover, secrecy is a more effective appropriation strategy in remote locations than in central ones (Contigiani and Testoni, 2023; Shearmur, 2015). Yet, the empirical evidence is inconclusive on these matters. For the US, Wojan (2019) uses data from a survey of rural innovation to show that IPR strategies in urban versus rural areas are similar, after controlling for the number of substantive innovators.
Different metrics, different cities?
Based on the discussion above, the three metrics have the potential to allow the capture of: (i) different innovation phases, from technical invention to design and product development, and (ii) innovation activities across a wider range of sectors than high-tech ones. A handful of studies in regional studies have started to exploit the combination of these metrics (Block et al., 2022; Castaldi and Mendonça, 2022; Filippetti et al., 2020; Mendonça, 2014). To my knowledge, no study at the city level exists yet, except for the seminal work of Gatrell and Ceh (2003).
Related literature at the firm level indicates that firms bundling IPRs are better able to appropriate returns from innovation and growth (EPO-EUIPO, 2019; Hall et al., 2014). Instead, the concurrent filing of IPRs in a city does not require bundling at the corporate level, since separate (specialised) firms may contribute to each of the three innovation activities. Taking a complementarity view, the three IPRs capture distinct and complementary phases in the innovation process. According to this view, we should expect all innovative cities to score similarly across the three IPRs, as these are strongly correlated with each other. With this in mind, prior analysis based on patents would be largely confirmed. Yet, a substitution view would suggest that the three IPRs tell different stories. They can capture distinct types of innovation, occurring in specific sectors. For instance, service innovation can rely on technology, but it may rely on adoption of technology developed elsewhere rather than requiring actual technological novelty (Miles, 1993). Some industries and clusters rely strongly on design and soft innovation, with a limited role in scientific and technical knowledge (D'Ippolito, 2014). Combining these metrics can also capture the idea that places often tend to specialise in only one phase of the innovation process (Breznitz, 2021). Specialisation in technological invention is only one model of urban innovation. Cities can also specialise in the downstream phases of product development (Castaldi and Drivas, 2023). The above discussion raises a key empirical question: to what extent do these metrics help to reveal different innovation specialisations of US cities?
Data and methods
Data sources
The main sources of data for this study are the two public databases made available by the USPTO. USPTO (2020) covers patents, both utility and design, while the Trademark Case Files dataset includes all information on trademark filings (Graham et al., 2013). Both datasets were accessed in July 2020.
Patents can be counted by assignee or by inventor, while trademarks can only be counted by owners. In the case of multi-plant firms, patents can be filed by inventors based in locations other than the central location of the headquarters, while trademarks can only be filed centrally. Counting patents by inventor location is most logical from the point of view of identifying the actual loci of invention yet counting them by assignee location allows a more meaningful comparison with trademarks and provides information on where the direct economic returns might concentrate. The activities covered by trademarks typically tend to be more concentrated at the headquarters of firms, since they relate to the marketing and business development departments. Instead, patenting also happens in R&D locations which are more dispersed than the central headquarters locations. Given all considerations, I consider both counts by inventor and assignee location for utility and design patents.
I linked patents and trademarks to 356 metropolitan statistical areas (MSAs). This is a common level of analysis in urban innovation studies, with each MSA including a core urban centre. For patents, the assignment to MSAs relied on the information on latitude and longitude included in Patentsview, while for trademarks the assignment relied on the owners’ addresses, including postal codes and states. For IPRs with more than one inventor or owner, I used fractional counting to generate the counts by MSA. Finally, I included IPRs if at least one inventor/assignee/owner was based in the US at the time of filing. IPR records missing geographical information were deleted: these were less than 2% since the USPTO location information for US-based inventors is quite complete (see also de Rassenfosse et al., 2019; Graham et al., 2013).
I counted IPRs by year of filing since the time of filing is closest to the time of the invention or product development. I only kept those filings that reached registration. Registered utility and design patents survived the examination process and the related opposition after publication, which provides a quality check. For trademarks, the main reason for abandonment or cancellation between filing and registration lies in not submitting the use in market evidence (Graham et al., 2013). This might signal filings that happened too early in the innovation process, while companies eventually abandoned the original plans. Alternatively, companies might have filed trademarks early only for strategic purposes, not in relation to actual products (von Graevenitz et al., 2020). Hence, counting registered trademarks entails counting trademarks that are about products actually introduced in the marketplace. Because of the time lag between filing and registration, the data is right-truncated. Hence, I only consider registered IPRs filed before 2015.
Finally, I used population and economic data by MSA from the US Bureau of Economic Analysis.
Methods of analysis
To compare the findings with recent literature on the geography of urban innovation in the US, the analysis focussed on the years 2010–2015 and computed yearly averages for the entire period.
To reassess the evidence pertaining to the large city narrative, the study examined the ranking of MSAs based on absolute counts for all three innovation metrics (patents, design rights, and trademarks). The aim was to assess the extent to which the top MSAs in terms of innovation are also the largest in terms of population. I calculated top quantiles by population, considering the percentage of IPRs filed by the five, 10, or 20 largest MSAs. Additionally, urban scaling laws, as described by Bettencourt et al. (2010) and Balland et al. (2020), are estimated. Scaling coefficients, obtained through ordinary least squares (OLS) regression of the logarithm of innovation against the logarithm of population, are calculated. The adjusted R2 of the scaling relation is also reported as a measure of the goodness of fit, providing insights into the strength of the relationship between population size and innovation.
To move beyond the focus on the large city narrative, the analysis shifted from absolute counts to relative counts, specifically intensity measures relative to population size. Dividing IPR counts by population instead of employment allows the capture of independent filers, which are particularly numerous for patents (Ó Huallacháin and Lee, 2011). I used the intensity measures to create maps that visually depict the distribution of innovation activities across different cities. Additionally, I generated scatterplots to explore the correlations between IPR intensities, city size, and GDP per capita.
To analyse the specialisation of cities in different areas of innovation, I calculated Revealed Comparative Advantage (RCA) indexes as location quotients (using the R EconGeo package, Balland, 2017). Such indexes rely on computing for each city the share of utility patents/design patents/trademarks in a specific technology/design/market class over the total number of patents/design rights/trademarks and comparing it to the share for the US as whole. Indexes greater than 1 indicate that firms in the respective MSA specialise in that specific class. For patents I referred to 131 two-digit International Patent Classes (IPC) technological classes, for design patents to 32 Locarno design classes and for trademarks to 45 Nice market classes. 1 The choice of relatively high-level classification for IPC and Locarno classes was made to ensure consistency across the analysis, while the Nice classes remained at their original classification level, as they do not have subclasses. Overall, the aim was to identify the main fields of specialisation for each MSA and gain a better understanding of the diversity and distribution of innovation activities across different cities.
Finally, I took inspiration from the work on secondary cities by Ó Huallacháin and Douma (2021) and further analysed the patterns of a selected group of smaller cities that exhibit notable levels of intellectual property filings. I considered MSAs with less than 1.5 million residents, and with at least 100 patents or 200 trademarks or 20 design rights, on average for the period 2010–2015. This resulted in a set of 82 MSAs, some of which may have been part of a large combined statistical area (CSA), defined as an area with population greater than 2.3 million. With the help of Principal Component Analysis (PCA), I analysed emerging patterns that describe typical innovation profiles.
Results
Innovation and large cities
Table 2 reports the top 20 of the ranking of MSAs by the absolute counts of the three innovation metrics, with utility and design patents counted by the inventor location. As expected, trademark filings are much more abundant than patent ones, with design patents being the least. All five largest US cities (highlighted in bold) appear in the top 20 lists and for trademarks the top three exactly coincides with the three largest MSAs (New York, Los Angeles and Chicago). These first results already suggest that agglomeration plays a significant role for all three innovation metrics. However, different cities appear in a different position in the ranking, suggesting that the information from the three metrics does not overlap.
Top 20 MSA by average yearly patent, design and trademark counts (2010–2015).
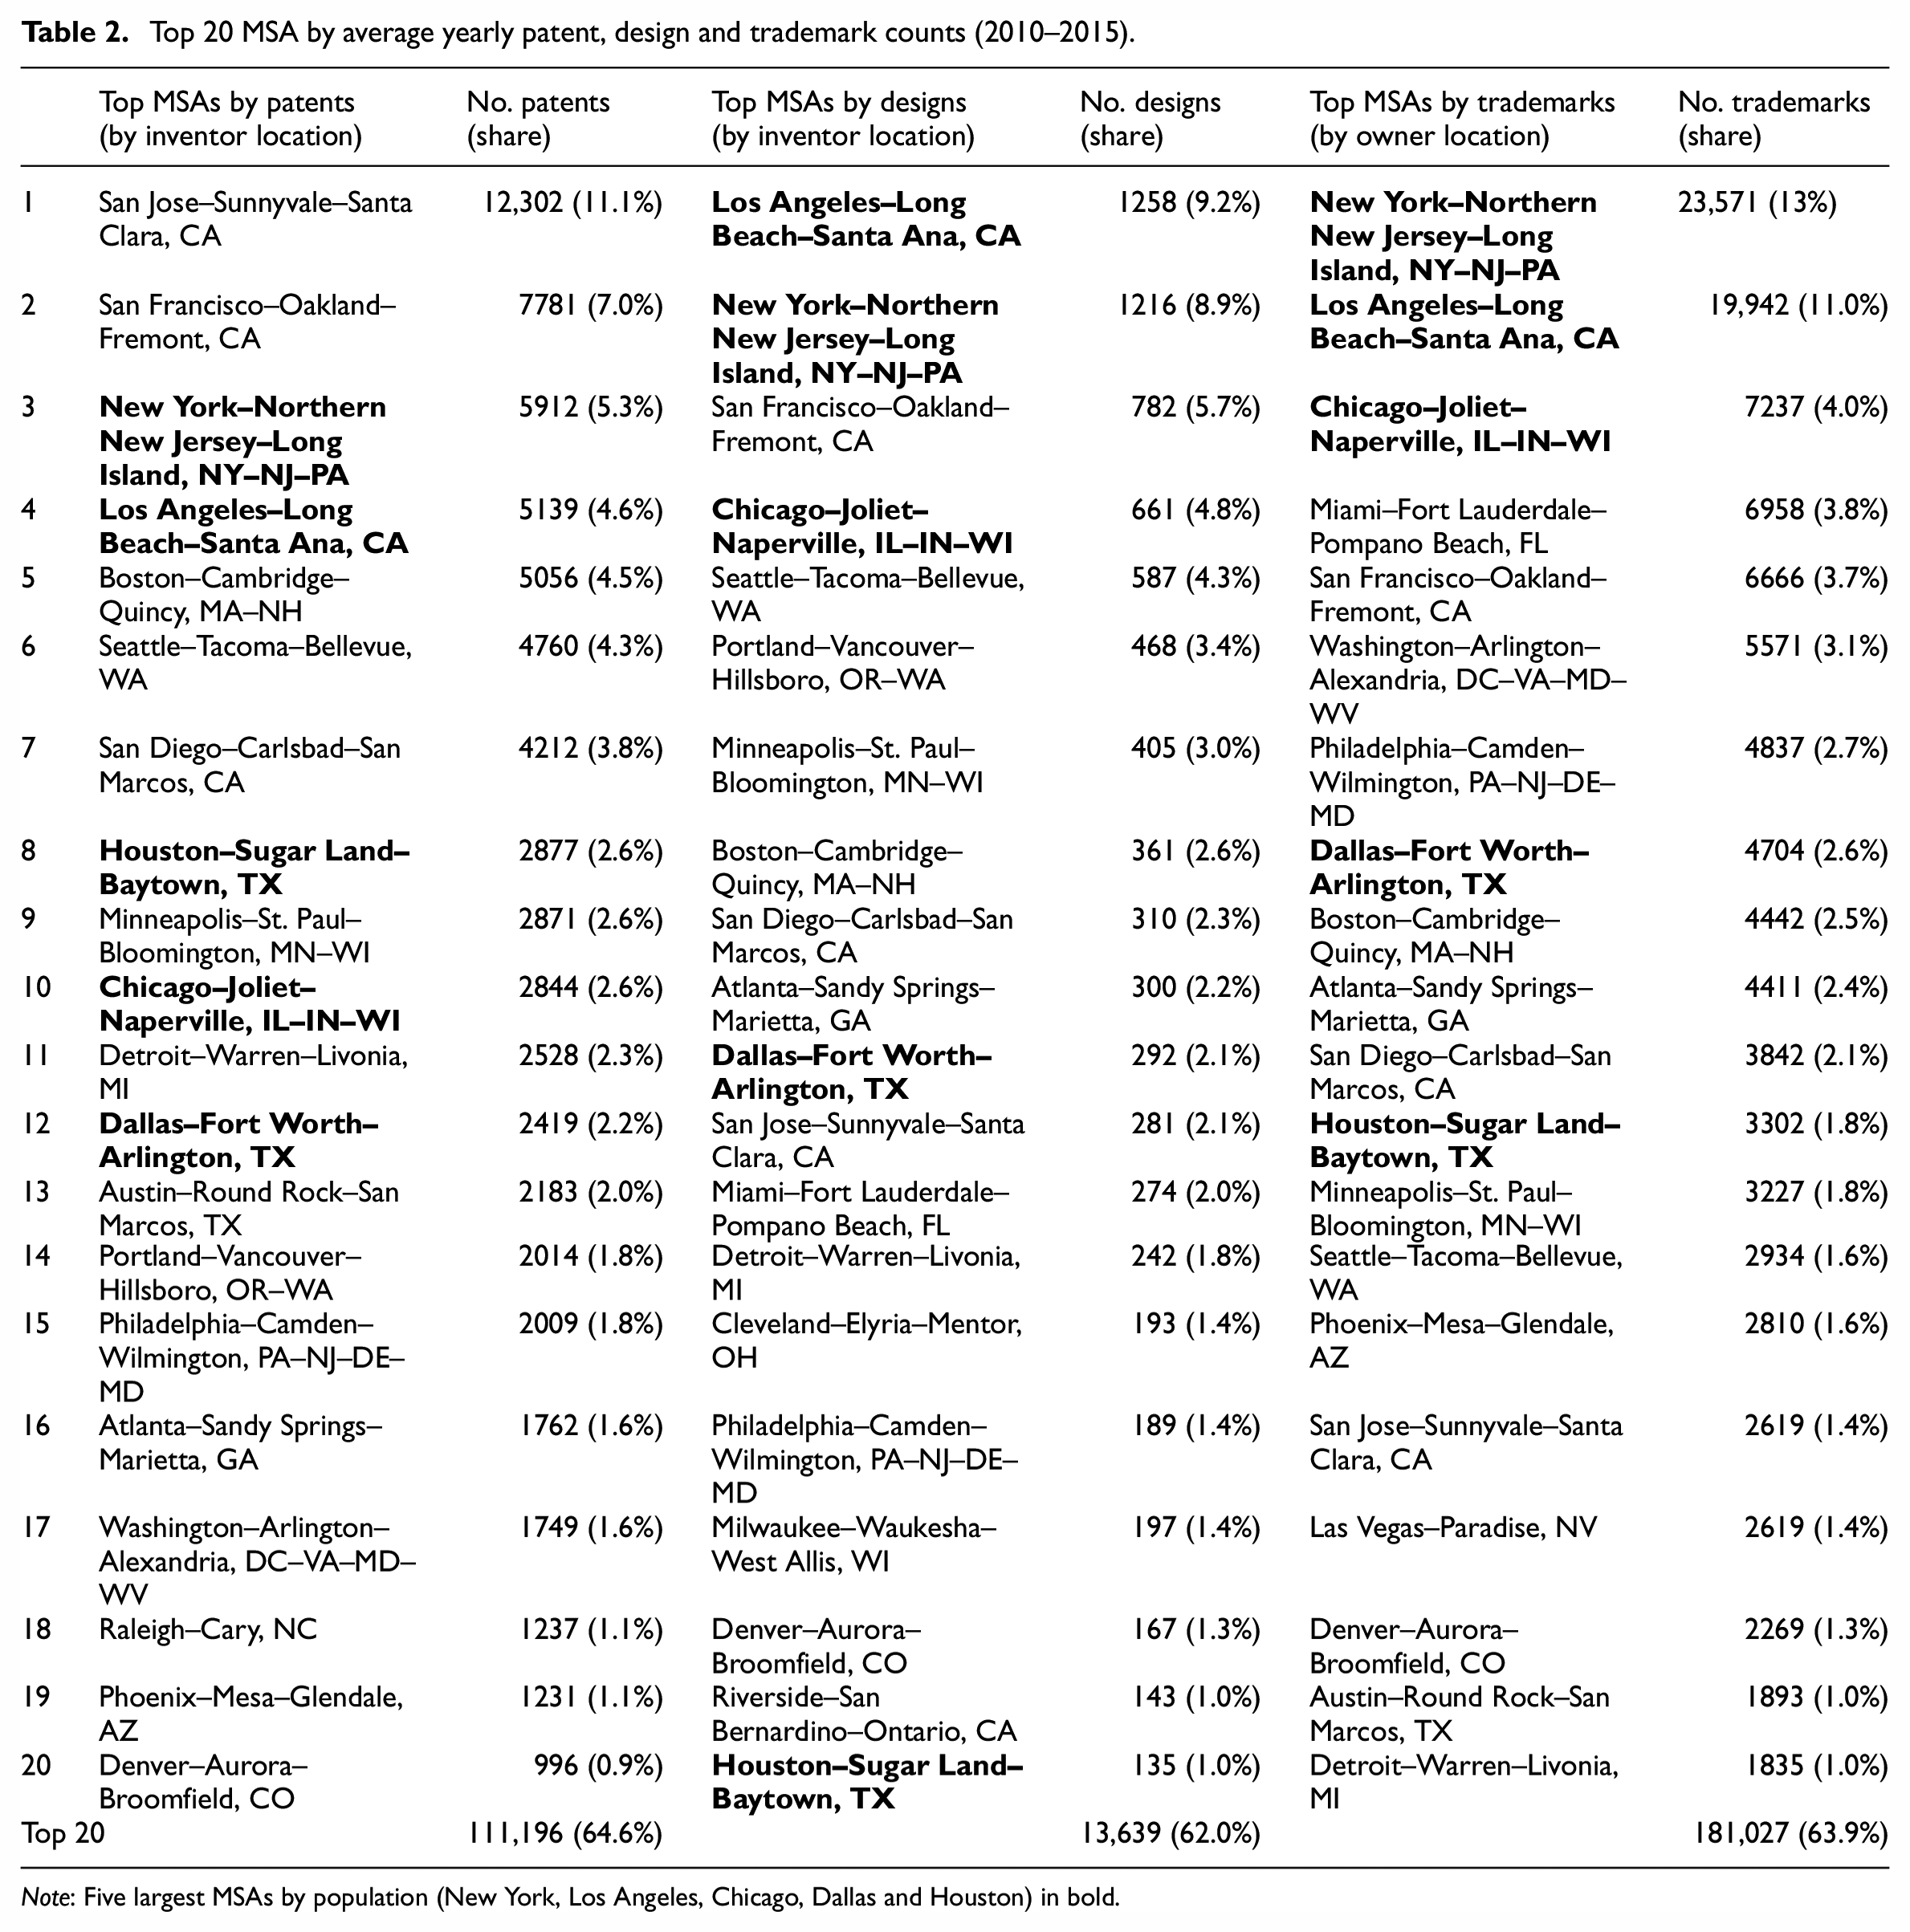
Note: Five largest MSAs by population (New York, Los Angeles, Chicago, Dallas and Houston) in bold.
When turning to Table 3, the concentration of innovation in large cities is broadly confirmed but the findings reveal different patterns. The top quantiles suggest that agglomeration externalities might be most at work for trademark and design activity and somewhat less so for patenting. As expected, the concentration of patenting by assignee is higher than by inventor location, mostly for the reason discussed above that patent filings can stem from non-headquarter locations as well.
Indicators of concentration by population, highest in bold and lowest in italics for each indicator.
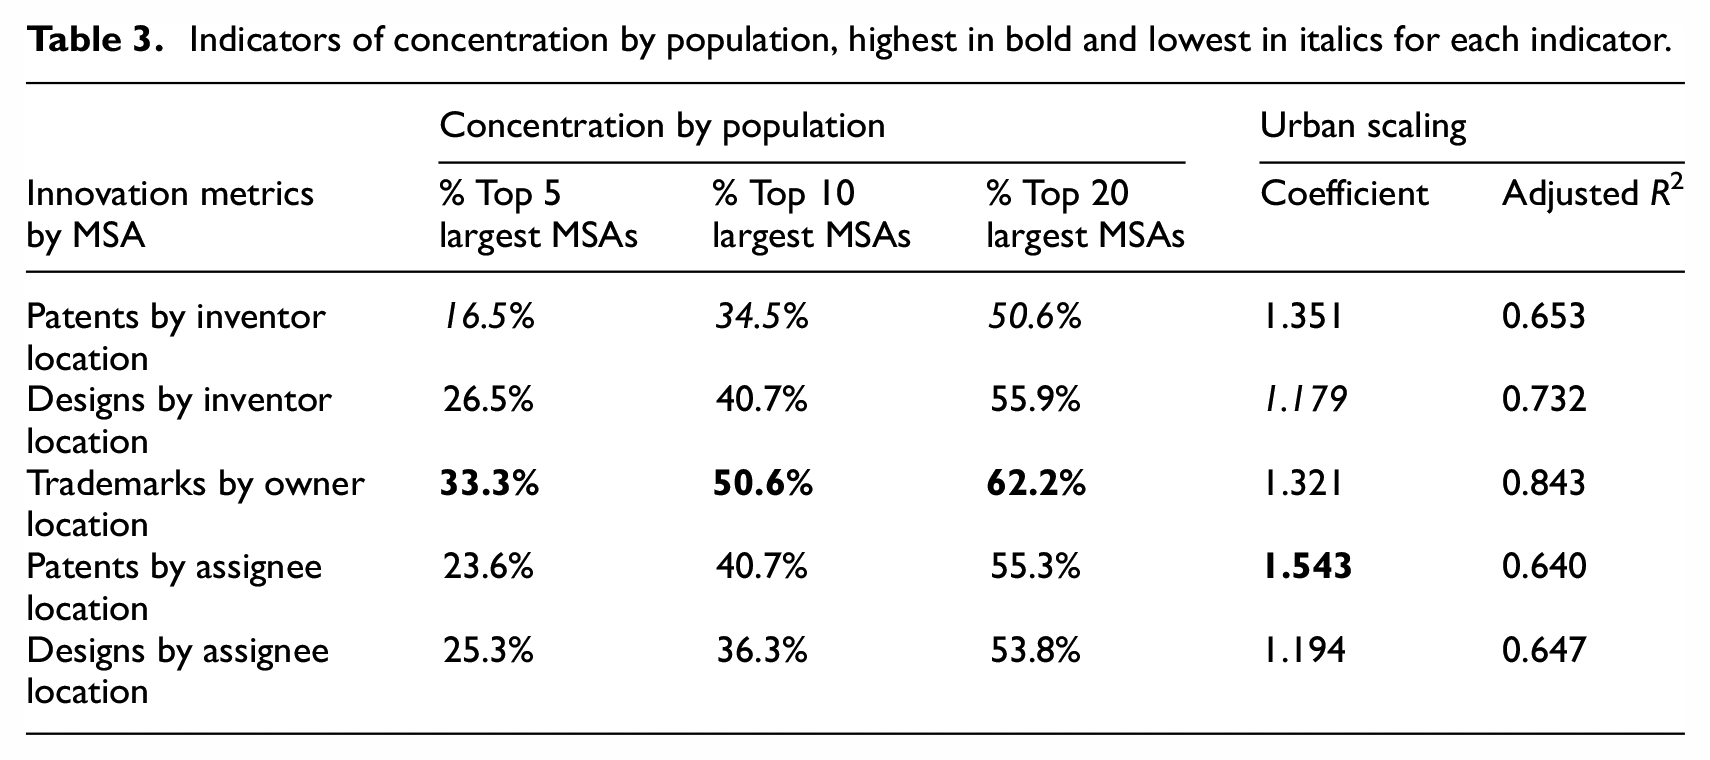
The estimated scaling coefficients indicate super-linear scaling, given that they are all above 1. Patents and trademarks display a comparable coefficient, but when patents are counted by assignee location, their scaling coefficient is the largest of all innovation metrics. The scaling coefficients for patents are higher than the value of 1.26 found in Balland et al. (2020) but lower than the coefficient of 1.46 found in Fritsch and Wyrwich (2021a).
The results broadly confirm urban scaling laws for all three innovation metrics. Downstream phases of innovation appear to benefit the most from urban agglomeration. This might relate to the concentration of such activities at corporate headquarters, but also to the locational preference of the worker types that contribute most to those activities. Interestingly, the concentration of patenting at the assignee level, which is more comparable to the owner level of trademark counts, is even higher than that of trademarks. When one aggregates technological inventions at the corporate headquarter level, then three quarters of patents belong to 20 cities. This suggest that unpacking different levels of concentration might be a new lens to characterise urban innovation patterns. Overall, these findings broadly confirm the patterns suggested by the large city narrative, also when broadening metrics beyond patents.
From absolute to relative innovation counts: IPR intensity across cities
The relationship between city size and innovation counts, as observed in urban scaling laws, has often been criticised for being driven by very large cities, which may overshadow the dynamics in smaller cities. When considering the relationship between agglomeration and relative innovation counts, the influence of large cities becomes less dominant (Fritsch and Wyrwich, 2021a).
Figure 1 presents maps illustrating the distribution of IPR intensities based on assignee and owner locations. The patent map reflects previous observations of concentrated patent activity in a few cities at the forefront of technological invention. Notably, San Jose stands out as the largest circle, exerting a significant influence on the overall map. The design map aligns with the specialised nature of design rights: only a select few locations exhibit substantial activity in terms of design rights filings. In contrast, the trademark map showcases a larger number of cities and a more geographically dispersed pattern, indicating the prominence of trademark activity across a broader range of locations.
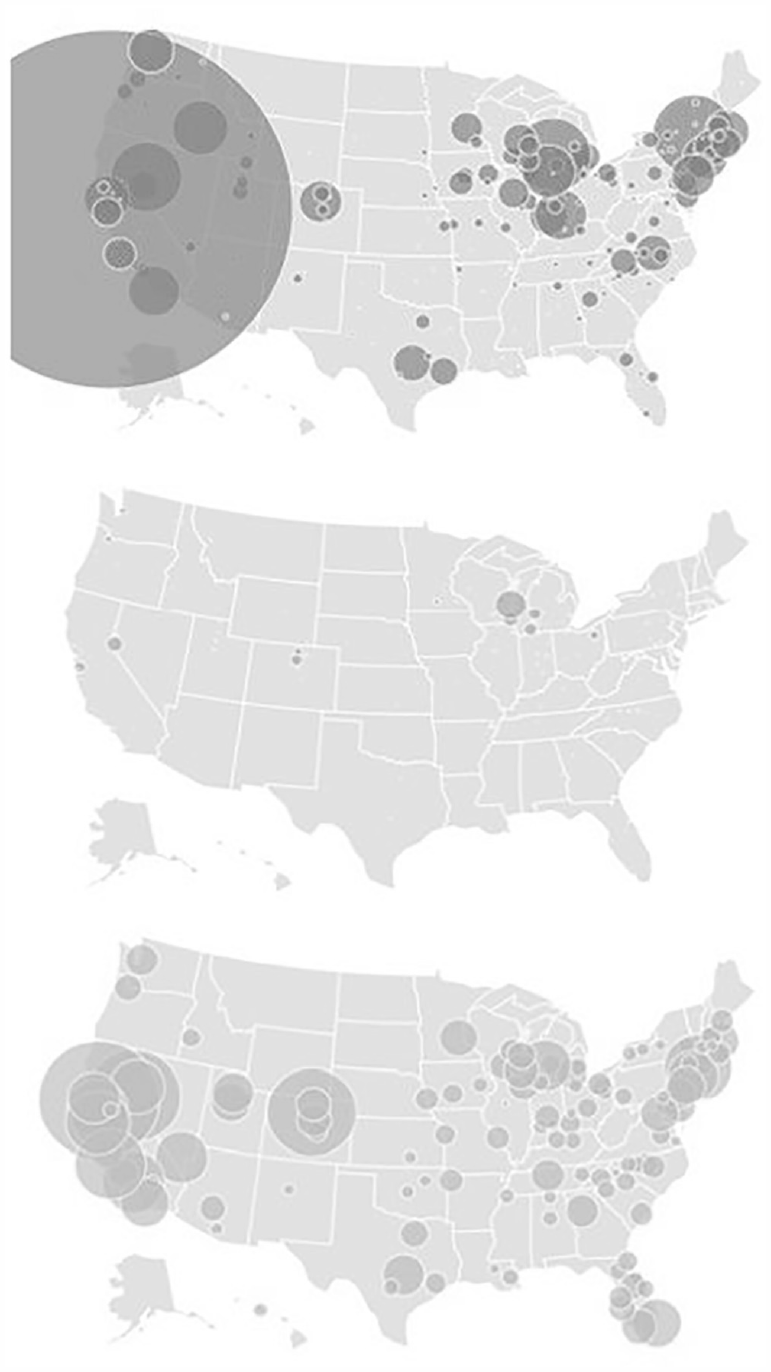
Distribution of patent, design right and trademark intensities, averages for the period 2010–2015, by owner location.
Table 4 presents the top 10 US cities ranked by patent, design, and trademark intensity. Many secondary cities emerge in these rankings, demonstrating that their innovation potential was overshadowed in the analysis based on absolute IPR counts. It is worth noting that some of these secondary cities are part of larger Consolidated Statistical Areas (CSAs), suggesting the possibility of size borrowing or sharing with nearby large cities (Meijers and Burger, 2010).
Top 10 US MSAs by patent, design and trademark intensity and the (technology, design, market) class where they have the highest RCA, averaged over 2010–2015.
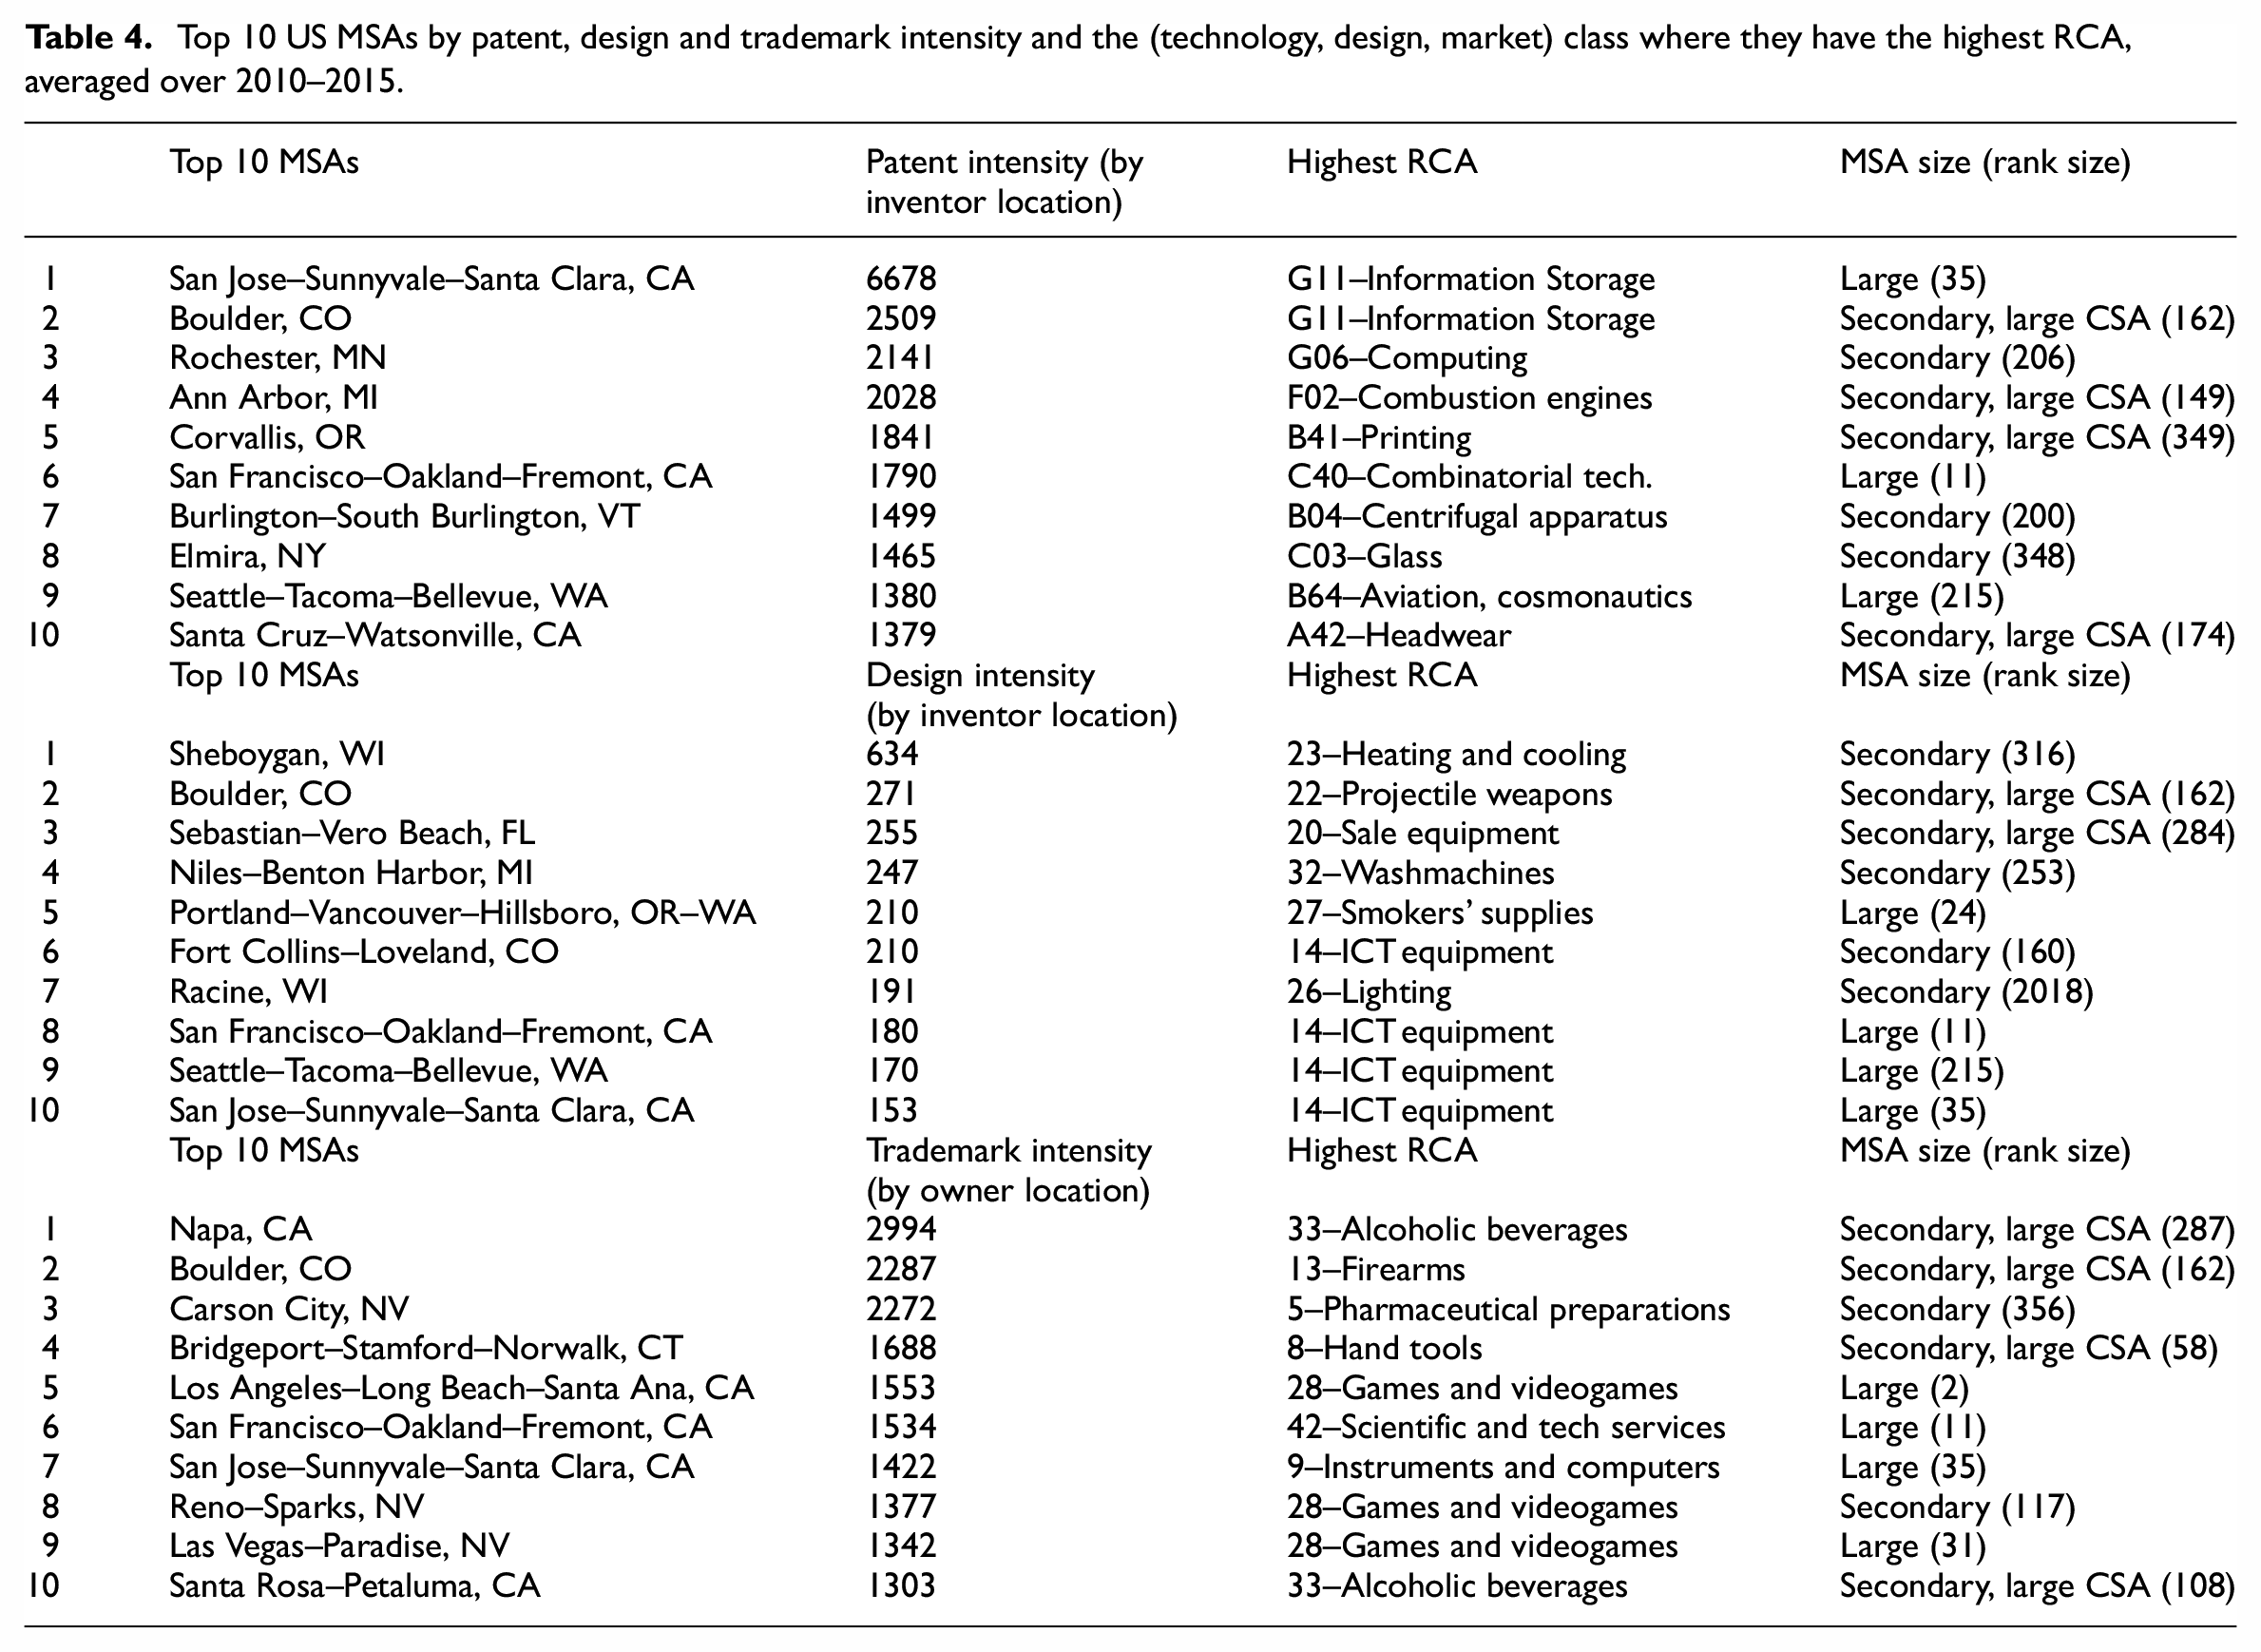
Interestingly, only three cities appear in all three rankings: San Jose, San Francisco, and Boulder, CO. San Jose and San Francisco are widely recognised as major technology hubs, and their presence across all three rankings highlights the complementarities between technology, design, and market activities in these cities, particularly in the domains of ICT technology, equipment design, and services. Boulder, on the other hand, is a secondary city located in a mountainous region and part of a larger CSA. It also stands out in the rankings of entrepreneurial activity by Andrews et al. (2022). The findings suggest synergies between design and trademark activity in relation to firearms, while patenting activities are more focussed on digital technologies.
The most common pattern is that cities specialise in one of three innovation activities. Table 4 highlights a diverse range of cities that specialise in one of the three innovation activities. This suggests that not all secondary cities focus solely on technological invention, challenging the perception that innovation centres are exclusively identified through patent metrics. Moreover, these findings confirm that high innovation intensity can be observed without high invention intensity. Table 4 identifies cities that might exploit a specific territorial advantage, like for the case of Napa. Overall, the table provides compelling evidence that innovation is not limited to a few large cities or solely driven by technological invention.
Figure 2 presents pairwise scatterplots of the three IPR intensities, population, and GDP per capita. The plots are displayed on a double-logarithmic scale, commonly used in urban scaling studies. The scatterplots reveal positive correlations among all the variables, indicating a general association between them. However, the scatter of data points suggests significant variability in how the variables relate to each other, indicating that a simple linear correlation may not fully capture the complex relationships at play. In particular, the scatterplots involving GDP per capita demonstrate that economic performance shows only a weak relationship with innovation measures and city size. This finding is in line with the idea that economic performance is driven by a complexity of factors that goes beyond one single variable and also aligns with findings in Andrews et al. (2022).
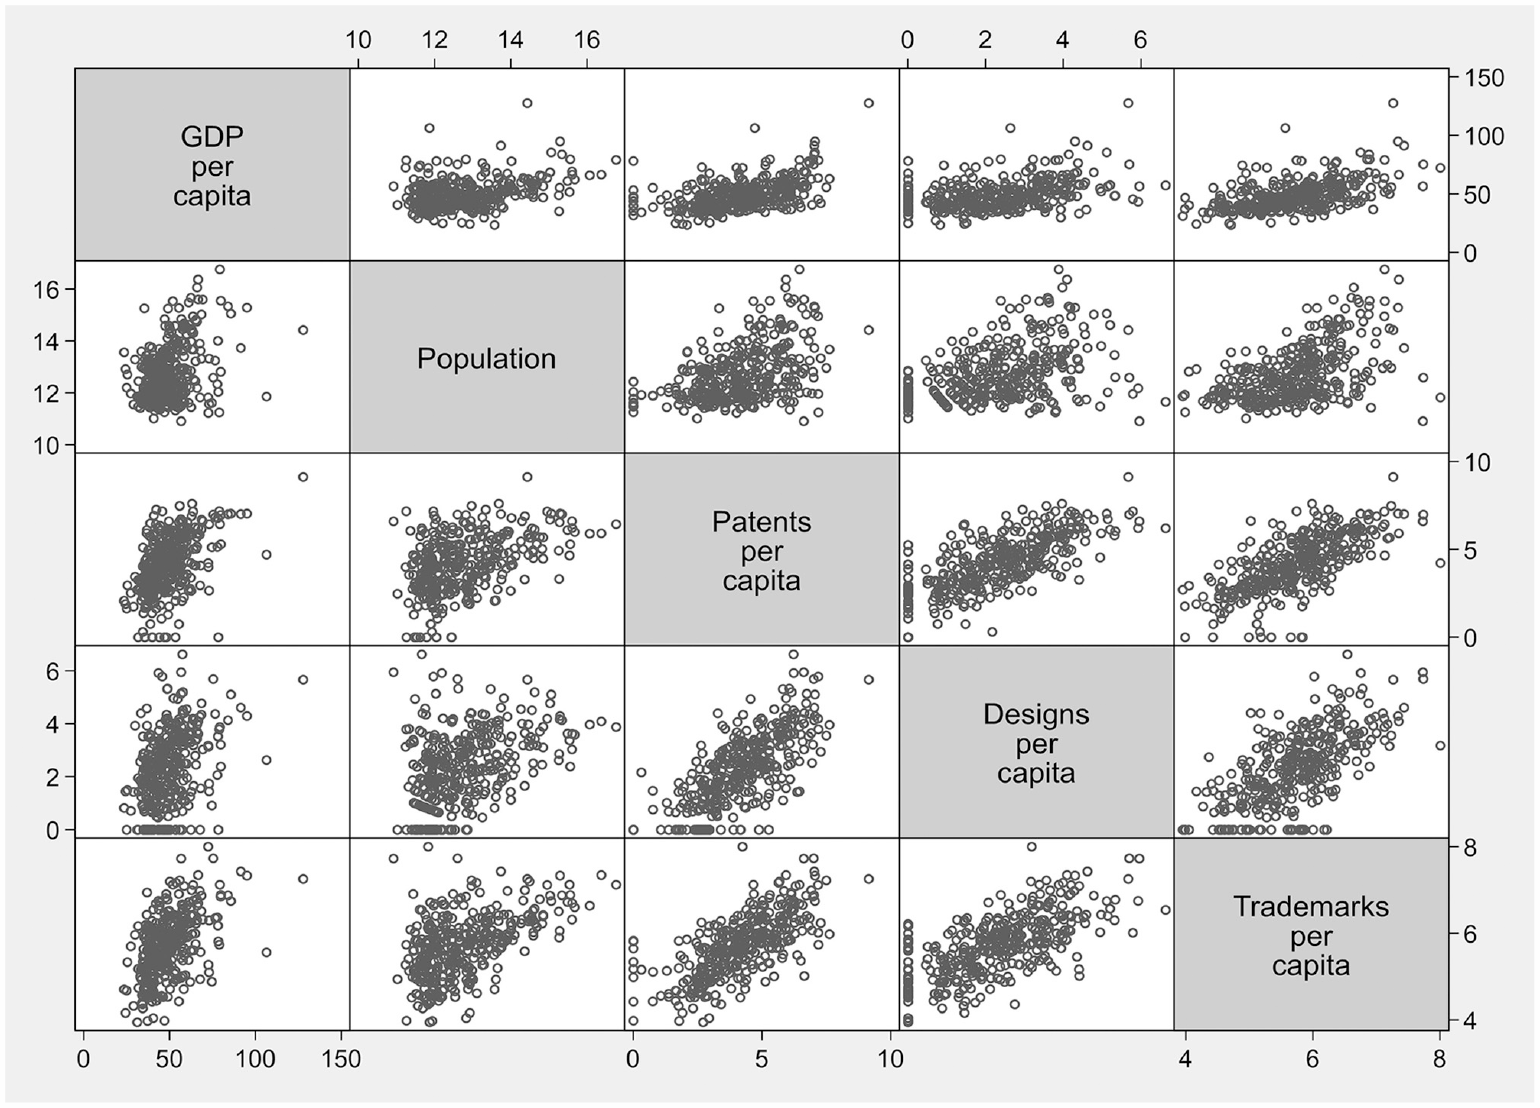
Scatterplots of IPR intensities, city size in terms of population, and GDP per capita by MSA (averages for the period 2010–2015), double logarithmic scale.
Overall, the findings indicate that integrating large and secondary cities within a single framework to understand patterns of innovation may present challenges. Recognising the distinct characteristics and dynamics of secondary cities, the next section focuses on analysing a select group of these cities to gain deeper insights into their innovation patterns.
Innovation and secondary cities
Considering the insights gained from the analysis conducted thus far and drawing on relevant findings from Ó Huallacháin and Douma (2021), it is useful to perform a Principal Component Analysis (PCA) incorporating the following variables: the size of the MSA based on population in 2010, a binary variable indicating whether the secondary MSA is part of a larger agglomeration (large CSA), and the three IPR intensities – patents and design rights analysed by inventor and assignee location, and trademarks analysed by owner location.
I extracted and varimax rotated three components, as reported in Table 5. These components collectively accounted for 76.3% of the total variance, indicating that they effectively captured the underlying patterns in the data. The significant loadings, that is, those exceeding 0.4, were exclusive to individual components, suggesting clear associations between the variables and the identified factors. The Kaiser–Meyer–Olkin statistic, with a value of 0.543, surpassed the critical threshold of 0.5, indicating that a significant proportion of the total variance was attributable to common underlying factors. The Bartlett’s test of sphericity yielded a significant result with a p-value less than 0.001, indicating that the variables exhibited a sufficient level of correlation to justify the utilisation of a PCA.
Results from the PCA on 82 secondary cities: component loadings and variance explained (in bold the significant loadings, >0.4).
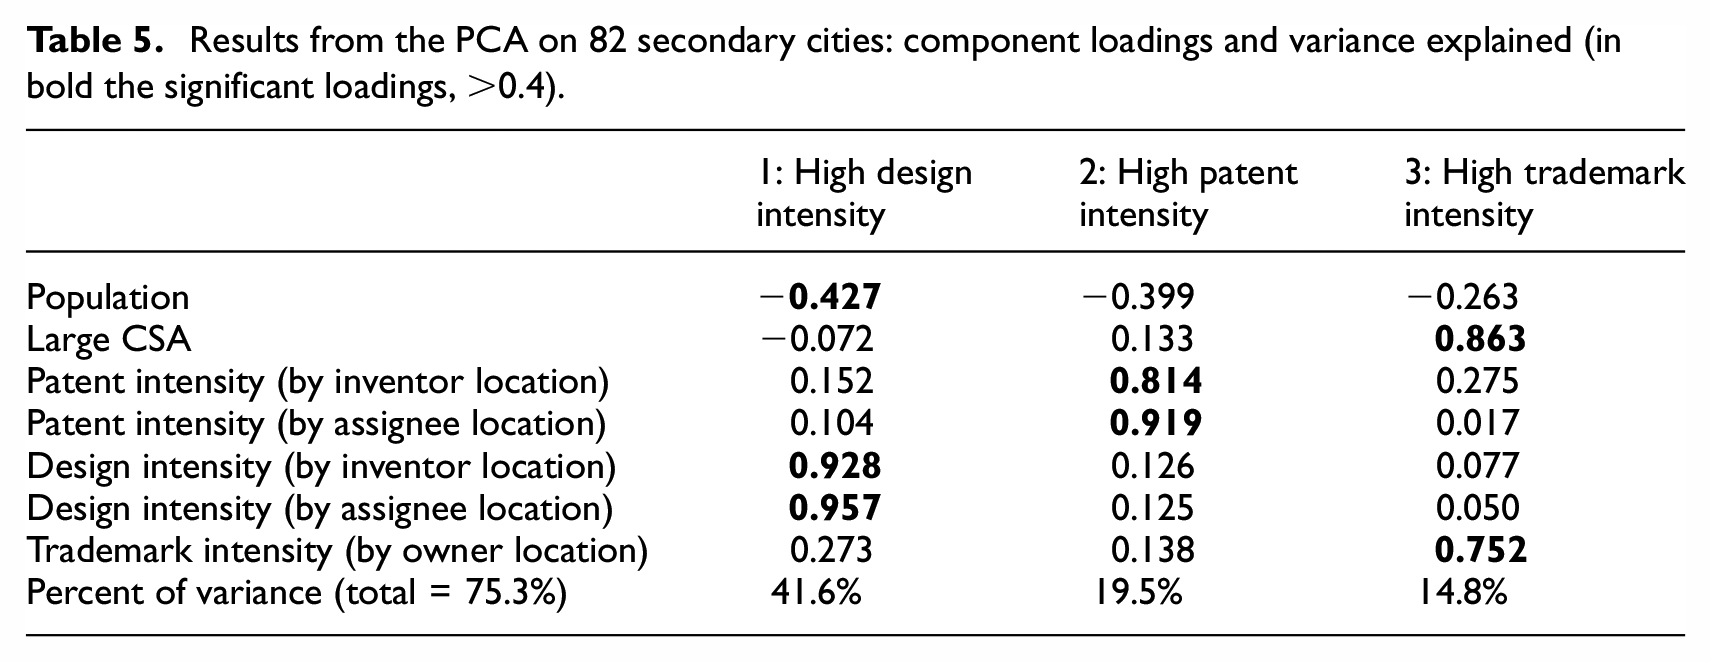
The first component, termed ‘high design intensity’, primarily explained the largest share of the variance, a result in line with the specialistic nature of design rights. Cities such as Sheboygan, WI, Racine, WI, and Niles–Benton Harbor, MI scored highest on this component, indicating a specialisation in design rights. Notably, these cities were relatively small in size.
The second component, referred to as ‘high patent intensity’, captured the intensity of patent activity. Cities like Albany–Schenectady–Troy, NY, Boulder, CO, and Boise City–Nampa, ID exhibited high scores on this component. These cities show diverse profiles, but most of them appear in previous research on secondary city invention (Ó Huallacháin and Douma, 2021).
The third component, which combined high trademark intensity with being part of a larger consolidated statistical area (CSA), suggested a potential benefit of accessing agglomeration for trademark activity. Cities such as Napa, CA, Boulder, CO, and Santa Rosa-Petaluma, CA scored high on this component, all characterised by a combination of trademark intensity and integration into larger agglomerations.
In conclusion, the findings of this last analysis reaffirm that different innovation metrics exhibit distinct geographical patterns within secondary cities.
Conclusions
Discussion and limitations
The analysis in this study was motivated by the aim of providing a comprehensive map of urban innovation in the US, encompassing various specialisation areas. The focus extended beyond examining technological invention activity measured by patents and included design and product/service innovation activities measured by design rights and trademarks. The empirical findings offered a more detailed and comprehensive understanding compared to prior research.
Before delving into the implications of this study for urban innovation research and policy, it is important to discuss some key limitations.
Firstly, it is important to acknowledge that measuring innovation is a complex task, and IPR metrics do not capture all the activities that contribute to innovation. In addition to the limitations already discussed in Section 3, the three selected metrics do not adequately capture what Breznitz (2021) refers to as Stage 4, ‘Production and assembly’. These types of innovations, often internal process improvements, are typically not protected by IPRs. Instead, companies tend to safeguard them informally, as they are deeply embedded in firm-specific routines and are less susceptible to imitation due to their limited applicability outside the firm or factory boundaries. Surveys offer a valuable alternative for capturing such process innovation (as exemplified by the work of Lee and Rodríguez-Pose, 2013), but they also have their own set of constraints and limitations.
Another limitation of this study is that the analysis solely relied on simple counts of IPRs. However, it is crucial to recognise that the quality of IPRs can vary significantly, with certain patents or trademarks holding disproportionate value (Nasirov, 2020; Sandner and Block, 2011). Moreover, high-value innovation tends to exhibit a higher degree of geographical concentration (Balland et al., 2020; Castaldi and Los, 2017). Notably, recent methodologies have emerged that utilise trademark data to distinguish radically new products and services from incremental imitations (Semadeni and Anderson, 2010; von Graevenitz et al., 2022), which could be particularly interesting for further exploration. Replications and extensions of this study could reassess patterns using value-weighted counts and incorporating available indicators of patent and trademark value (Higham et al., 2021; Nasirov, 2020). Additionally, the combination of IPR data with data on entrepreneurial activity could offer a fruitful approach for drawing and comparing different maps of innovation, as exemplified by the studies conducted by Guzman and Stern (2015) and Andrews et al. (2022).
Finally, the analysis in this study treats MSAs as independent entities, overlooking the potential interrelations among proximate areas. Replicating the analysis at the level of commuting zones or incorporating spatial correlations could provide valuable insights. It would be particularly useful to develop theoretical explanations for the underlying mechanisms that contribute to spatial interdependencies. For example, it is possible that the Napa Valley’s specialisation in trademarks benefits from demand effects generated by the presence of technology firms in California. By delving into the mechanisms that drive spatial interdependencies, future research can shed light on the intricate relationships between innovation dynamics in different geographic areas.
Implications for further research and policy
This study offers several insights that prompt new research avenues.
Firstly, studies focussing on the properties of innovative cities (Clark et al., 2010; Huallacháin, 2023; Ó Huallacháin and Douma, 2021) could greatly benefit from incorporating the broader set of metrics proposed in this study. This would be particularly valuable if patents, design rights, and trademarks could be assigned to their respective owners, including different types of firms, individuals, or knowledge institutes. Efforts in this direction, such as the work by Dinlersoz et al. (2018), could enable a comprehensive representation of the organisational structure of urban innovation and facilitate an understanding of the variations in innovation across cities. For instance, it would be interesting to investigate to what extent cities with a strong specialisation in soft innovation are centred around large companies or rely on networks of specialised small firms. Additionally, it would be worthwhile to differentiate IPR filings between mature and young firms, considering that companies have different motivations to file IPRs at various stages of their corporate and innovation life cycles (Castaldi et al., 2020). An interesting question to explore is whether cities with companies that excel in both technology generation and product development may face barriers to knowledge diffusion due to incumbent firms (Belderbos et al., 2022). These avenues of research have the potential to deepen our understanding of innovation dynamics within cities and provide valuable insights into the interplay between organisational characteristics, territorial properties, and knowledge diffusion.
Furthermore, there is an emerging literature that explores the relationship between technological change and income inequality (Storper et al., 2015). It would be interesting to investigate whether cities specialising in innovation beyond technological invention are less susceptible to the inequality challenges often associated with high-tech agglomerations (Kwon and Sorenson, 2023). Breznitz (2021) suggests that the extent to which innovation generates local prosperity is linked to the ability of local actors to effectively exploit technology within their regions. Therefore, an intriguing question arises: Do cities that align their activities along the entire innovation process have a better position to not only create opportunities but also capitalise on them? Methodologically, one could establish connections between the different innovation metrics, potentially incorporating more disaggregated categories for technology, design, and market activities (as demonstrated, for instance, by Abbasiharofteh et al., 2022), to capture innovation trajectories at the city level. Additionally, the keyword-based approach utilised by von Graevenitz et al. (2022) could offer an innovative means of linking patent and trademark data. These methodological advancements provide opportunities to further enrich our understanding of the complex dynamics between innovation specialisation, local economic opportunities, and the potential implications for income inequality.
Thirdly, the utilisation of the proposed metrics can extend studies that investigate the drivers and conditions underlying the emergence of new innovation specialisations. By replicating and updating the work of Acs et al. (1992), researchers can reassess the actual impact of university and scientific centres on innovation, not only in terms of invention. Additionally, novel approaches and techniques such as those based on the principle of relatedness (Hidalgo et al., 2018) and the analysis of regional and city positions in knowledge spaces (Catalán et al., 2022) can be leveraged to gain further insights. Drivas (2022) and Castaldi and Drivas (2023) have demonstrated that regional market specialisations in Europe and the US often originate from existing technological specialisations. However, they also exhibit their own path dependency, as regions are more likely to develop new market specialisations if they have a historical presence in those areas. Such history may well be intertwined with territorial properties or cultural assets that cities are able to exploit for innovation (Capello and Lenzi, 2018; Pike, 2013; Sáiz and Zofío, 2022).
Finally, this study has made an original contribution to the emerging literature on innovation in the periphery. While much of this literature has predominantly focussed on Europe and relied on qualitative analysis of specific cases (Pugh and Dubois, 2021), there is a need for more quantitative studies and broader geographical analysis to strengthen the empirical foundations of the claims. By expanding the scope of analysis beyond urban areas and including rural regions (as also highlighted by Wojan, 2019), researchers can further explore innovation dynamics in peripheral areas. This would contribute to a more comprehensive understanding of innovation patterns across different types of regions.
In terms of policy implications, the incorporation of a broader set of innovation metrics is likely to be of great value to policymakers in identifying, assessing, and monitoring the innovation potential of specific cities. The analysis presented in this paper demonstrates that by expanding the range of metrics, more cities and diverse innovation specialisations can be uncovered, including many secondary cities that would otherwise be overlooked. The emphasis on metrics beyond patents can serve as a wake-up call for policymakers who may be overly focussed on technology-driven innovation. By recognising and promoting the opportunities presented by related innovation activities that leverage existing technological capabilities, policymakers can foster a more comprehensive and inclusive approach to urban and regional development. Furthermore, it is important to reconsider the terminology used to describe these secondary cities. The label ‘secondary’ implies a lower rank or status, which may underestimate their true potential. Therefore, it may be necessary to find a more suitable and empowering name that accurately reflects the significance and contributions of these cities to the broader innovation landscape. In conclusion, policymakers can benefit greatly from adopting a broader range of innovation metrics, as it enables a more comprehensive understanding of urban innovation dynamics and highlights the untapped potential of secondary cities, while acknowledging the role played by large cities. By embracing a diverse set of metrics and reevaluating the terminology used, policymakers can better support and promote innovation across a wider spectrum of places.
Footnotes
Acknowledgements
I thank Justine Miller for her excellent research assistance with the data preparation. I also wish to thank Bart Los for his comments on an early draft, the three anonymous reviewers and the editor. All errors remain my own.
Declaration of conflicting interests
The author declared no potential conflicts of interest with respect to the research, authorship, and/or publication of this article.
Funding
The author disclosed receipt of the following financial support for the research, authorship, and/or publication of this article: I am grateful for the support of a Membership Grant of the Regional Studies Association (MeRSA).