
Abstract
Introduction:
In recent years, screen-based activities have become increasingly popular amongst children and adolescents. Several studies have found increased screen time to be associated with sleep disturbances, poorer academic performance and reduced physical activity. However, not much is known about children’s activity preferences and participation in relation to their screen time. This study investigated the association between school-aged children’s screen time use and their activity participation and physical activity.
Method:
A sample of 25 parents/caregivers with typically developing children aged 8–12 years in Australia participated. Parents/caregivers completed the Children Screen Time Use Report (CSTUR) and Children Participation Questionnaire-School (CPQ-S). Child participants completed the CSTUR, Preferences for Activities of Children (PAC), Perceived Meaning of Occupations Questionnaire (PMOQ) and Physical Activity Questionnaire-Children (PAQ-C). Data were analyzed using Spearman Rho correlations.
Results:
Findings from this study found no statistically significant associations between the CSTUR and PAQ-C subscales in children aged 8–12 years. However, there were several significant correlations found between CSTUR and the PAC, PMOQ and CPQ-S scale scores.
Conclusion:
Occupational therapists need to consider screen-based activities in school age children and the impact it can have on their daily participation.
Introduction
Participation is a multidimensional concept that has evolved from the International Classification of Functioning, Disability and Health (ICF) framework as one’s engagement in everyday activities (World Health Organization [WHO], 2001). Participation in everyday occupations is vital for childhood development as it has been shown to promote a positive influence on physical and mental health. Participation fosters learning of new skills and knowledge, developing an understanding of societal norms and forming interpersonal interactions and relationships with peers (Case-Smith, 2010). Children’s activity participation is measured by the type (e.g. play, leisure, sleep, education, work, self-care and social interaction), frequency of activities, the level of engagement, enjoyment and satisfaction (Vessby and Kjellberg, 2010).
With the increasing use of technology, the world wide web and social media, participation in screen time (ST) plays a crucial role in the daily lives of all people and has become increasingly popular amongst children and adolescents (Oswald et al., 2020). ST is time spent occupied in screen-based technologies such as television, computers and laptops, tablets and iPads, gaming devices and smartphones (Oswald et al., 2020). ST has provided significant opportunities for learning, creativity, self-expression, socialization and entertainment for children and adolescents (Houghton et al., 2015). However, in recent years, increased time spent on ST-related activities has sparked a debate on the potential risks to children’s mental and physical health and activity participation (Houghton et al., 2015). For example, lowered self-esteem, increased anxiety and depression, difficulty making friends, inability to complete tasks, decreased academic achievement and obesity have all been linked with increased ST (Mineshita et al., 2021; Neophytou et al., 2021).
By understanding the different impacts of ST use and type, clinicians can build on existing evidence-based clinical practice to address the outcomes and identify effective interventions to enhance occupational participation and overall well-being in relation to children’s ST use. Research in this area will generate valuable information and insights to assist and inform clinical practice when working with children and their families. In the current study, the Person-Environment-Occupation-Performance (PEOP) model (Baum et al., 2015) has guided many aspects of our research as it allows examination of children’s interactions with ST use and facilitates understanding of its influence on school-aged children’s physiological and psychosocial well-being. For example, sleep quality, occupational performance and participation, self-care, learning and physical activity. Therefore, the aim of this study is to investigate the association between school-age children’s ST use and their activity participation and physical activity.
Literature review
Current international ST guidelines for children recommends that screen-based activities are limited to a maximum of 2 hours per day (WHO, 2019). However, an Australian study found that only 11% of school-age children met this guideline with most reporting over 12 hours daily use of technology for leisure purposes (Howie et al., 2020). The same study also reported that high ST use meant that most children didn’t get to sleep until after 11pm on weekdays and weekends which encouraged poor sleeping patterns directly linked to poorer academic performance (AP; Howie et al., 2020). Mortazavi et al.’s (2019) research also found an association between children and adolescents who use ST for more than 2 hours each day and poor and short sleep duration. For example, television viewing was found to decrease overall sleep duration and delay bedtimes and wake-times, while computer use of more than 2 hours per day had a negative influence on sleep patterns (Mortazavi et al., 2019). The authors reported that light exposure from screen devices increased alertness and arousal levels during the evening, which led to disrupted sleep and wake cycles (Mortazavi et al., 2019).
Similarly, a study conducted in Wuhan, China (Yan et al., 2017) determined that approximately 40% of adolescents exceeded the recommended ST use of 2 hours per day. The study showed that Chinese students who spent more time playing electronic games were associated with less sleep duration and those who watched television or engaged with social media websites on school days were negatively associated with AP (Yan et al., 2017). These findings are supported by other research that suggests children who watch television for more than 2 hours a day at age 8–9 experience a decrease in AP, for example in reading performance at age 10–11, compared to those who participate in less than 1 hour of ST per day (Mundy et al., 2020).
In addition to poor AP and sleeping problems, studies have highlighted that children who spend more than 2 hours a day on screen-based activities are also at increased risk of psychological difficulties and reduced physical activity (PA) (Stiglic and Viner, 2019). One study reported that children with shorter ST durations were likely to be engaged in higher PA levels, have normal body weight and better AP (O’Brien et al., 2018). In contrast, children who spent long periods of time watching television were associated with decreased PA levels, poorer muscle strength and the potential development of obesity (Mineshita et al., 2021). Mineshita et al. (2021) suggested that this could be the result of children spending less time outdoors engaged in sporting activities and an increased calorific intake while watching television.
Greier et al. (2019) also found that children who watched more than 2 hours of television per day were significantly associated with poorer fitness levels and a 50% increased risk of being overweight compared to children who viewed less. Research by Sanders et al. (2019), however, demonstrated variability when ST was examined by type; for example, while passive ST (television) was seen to be associated with worse physical health outcomes, educational ST indicated positive academic outcomes. When conducting research into children’s ST use, screen duration is one of several exposure factors that should be considered, and it is important that other components such as type and purpose of ST are also considered.
Purpose
The purpose of our study was to investigate the relationship between typically developing school-age children’s ST use and their activity participation and PA. Our study poses the following research question: Is there an association between school-aged children’s ST use and their self-report activity preferences, perceived meaning of everyday activities, PA and activity participation as reported by parents/caregivers?
Method
Design
Our study used a cross-sectional survey design.
Participants
A sample of 25 parents/caregivers with typically developing children aged 8 to 12 years were recruited from across Australia using convenience and snowball sampling methods via social media platforms. Participants were required to meet several inclusion criteria to participate in the study. Child participants were required to (1) be aged between 8 and 12 years; (2) reside in Australia; (3) have adequate English comprehension of a typically developing 8-year-old; (4) have the consent of their parent/caregiver to take part in the study; and (5) be able to provide signed consent to participate. Exclusion criteria were to be (1) not known to any members of the research team; and (2) have no known diagnosis of a physical, psychological, neurological, behavioural, intellectual, or learning difficulty (as reported by their parent/caregiver).
Parents/caregivers’ inclusion criteria were to (1) provide written consent to participate in the study; (2) provide third-party consent on behalf of their child to be involved in the study; (3) be a parent/caregiver of a child involved in this study; (4) reside in Australia; (5) have adequate comprehension skills to be able to read and write in English at a sufficient level; and (6) spend a sufficient amount of time with their participating child to be able to identify their child’s ST use and participation and assist with completing scaled tools. The exclusion criterion was to be not known to the research team.
Instrumentation
We emailed participants an information pack that included links to online questionnaires on Qualtrics in relation to their child’s ST use, activity participation and PA. Each questionnaire provided instructions to guide participants and completed questionnaires were required to be returned within 2 weeks of receipt. The time taken to complete each questionnaire was approximately 15 minutes for parents/caregivers and 30 minutes for child participants.
Demographic questionnaire
Parents/caregivers were asked to complete the demographic questionnaire to obtain background information on the child participant which would assist with the screening process. The questionnaire included a plain language statement and the consent section which participants were able to sign online. If any participant did not meet the inclusion criteria for the study, we sent out an email informing them that their participation was no longer required and acknowledging their time and interest.
Children Screen Time Use Report
The Children Screen Time Use Report (CSTUR) was completed by both parents/caregivers and child participants through Qualtrics (Ye et al., 2021). The purpose of the CSTUR was to record the child’s average ST use on two typical weekdays and the two weekend days. It measures four types of ST: educational (doing homework), social (interacting with others through messaging), interactive (playing video games) and passive (watching television). The four ST domains were defined in table format on Qualtrics to assist participants in completing the questionnaire. We asked parents to complete the CSTUR based on their observations of their child’s ST use while we asked child participants to report time spent in each ST category in hours and minutes. Based on a trial involving four parents and two occupational therapists who completed the report, the CSTUR exhibited reasonable face and content validity (Ye et al., 2021).
Children Participation Questionnaire – School
The Children Participation Questionnaire – School (CPQ-S) was completed by parents/caregivers to measure their child’s participation patterns in everyday activities (Rosenberg et al., 2019). We asked parents to complete the questionnaire on Qualtrics by responding to the CPQ-S items using a six-point Likert scale, marking the response that best related to their child. The CPQ was initially developed in 2005 for pre-school children with or without developmental difficulties (Rosenberg et al., 2019) and later adapted for use in school-age children by 10 expert occupational therapists.
The CPQ-S questionnaire includes seven occupation domains and 55 items: activities of daily living (ADLs), instrumental activities of daily living (IADLs), sleep, play, leisure, social participation and education (Rosenberg et al., 2019). It incorporates four participation measures: Frequency represents the child’s mean participation frequency ranging from 0 (never) to 5 (everyday); Independence measures the mean assistance the child requires, 1 (dependent) to 6 (independent); Child Enjoyment measures the mean level of the child’s enjoyment, 1 (lowest level of satisfaction) to 6 (highest); and Parental Satisfaction determines the parents’ satisfaction of the child’s performance, 1 (lowest level of satisfaction) to 6 (highest).
Previous findings demonstrate that the CPQ-S exhibits good construct validity and internal reliability (Cronbach’s coefficient αs = =0.79–0.90) and its criterion validity is supported by significant correlations with the Vineland Adaptive Behaviour Scale (Rosenberg et al., 2019).
Perceived Meaning of Occupation Questionnaire
The Perceived Meaning of Occupation Questionnaire (PMOQ) is a self-report questionnaire designed for children to assess their perceived meaning of everyday activities (Rosenberg et al., 2019). The questionnaire uses simple language and visual aids in the form of small pictures and figures to illustrate possible answers and is appropriate for typically developing children to comprehend (Rosenberg et al., 2019). We asked children to complete the PMOQ online with their parents/caregiver’s assistance via Qualtrics.
The PMOQ contains 23 activities chosen through a process of expert validation and measures seven domains of occupational participation: ADLs, IADLs, sleep, social participation, play, leisure and education (Rosenberg et al., 2019). For each activity the child participates in, he/she is required to respond to four questions on a three-point rating scale; for example, (1) Is this activity important to you? 3 = very important to me, 2 = not so important to me, 1 = not important to me at all. This continues throughout for all other questions. Rosenberg et al. (2019) report a Cronbach’s alpha coefficient of 0.76, making the PMOQ a reliable tool for the evaluation of children’s perceived meaning of occupation. The PMOQ also has adequate face and content validity (Rosenberg et al., 2019).
Preferences for Activities of Children
The Preferences for Activities of Children (PAC) is a 55-item self-report questionnaire designed to examine a child’s preferences for activities and is appropriate for use with children and youth aged between 6 and 21 years (King et al., 2004). We created an online version of the PAC on Qualtrics for child participants to complete. The PAC activity items are based on formal and informal domains including physical, recreational, social, self-improvement and skill-based. The child chooses their preference for the activity by indicating: (1) would not like to do at all; (2) would sort of like to do; or (3) would really like to do (King et al., 2004). According to a longitudinal study involving children aged 6 to 14 years with physical impairments (N = 427) in Ontario, Canada, the PAC presented sufficient test-retest reliability, internal consistency (Cronbach’s coefficient α = 0.76–0.84), content validity and construct validity (King et al., 2004).
Physical Activity Questionnaire – Children
The Physical Activity Questionnaire – Children (PAQ-C) is a self-report, 7-day recall tool developed to assess general levels of physical activity for children between the ages of 8 and 14 years and uses memory cues to enhance the recall ability of children taking the test (Kowalski et al., 2004). The tool generates a subscale score of PA derived from nine items, each scored on a five-point scale (Kowalski et al., 2004). The overall scores provide indication of children who may be at risk from low PA or at no risk from high PA. For this study, an online version of the PAQ-C was created for participants. The PAQ-C is reported to be a valid and reliable measure of physical activity and is considered cost and time efficient (Crocker et al., 1997; Kowalski et al., 2004).
Data analysis
The data collected was entered into and stored securely on the Statistical Programme for the Social Sciences Software Version 28.0.1 (SPSS; IBM Corp., 2020). We used the SPSS to calculate descriptive statistics of the CSTUR, CPQ-S, PAC, PAQ-C and PMOQ variables including mean, standard deviation, range and interquartile ranges (Kaliyadan and Kulkarni, 2019). The level of significance was set at p < 0.05 for all statistical analysis results.
To answer the research question, we analysed the data using Spearman Rho correlations to investigate if any significant correlations existed between the CSTUR variables and the CPQ-S, PAC, PAQ-C and PMOQ factors. Spearman Rho correlation is a measure of monotonic association between two variables such as: (1) as the value of one variable increases, the value of the other variable also increases (positive correlation); or (2) as the value of one variable increases, the other variable decreases (negative correlation) (Schober et al., 2018).
Procedures
Ethics approval was granted on 23 May 2022 (approval number HEAG-H 38_2022) from Deakin University. To facilitate participant recruitment, we distributed a flyer that included information about the study which was advertised on mothers’ groups’ Facebook pages and shared with local community groups. We provided all the participants with a plain language statement to ensure they understood the logistics and requirements of the study prior to consenting (e.g. voluntary participation, right of withdrawal and confidentiality of data). Parents/caregivers were required to give informed consent while the children provided both verbal assent and written consent to participate in the study.
Results
Participants
Sixty-five parents/caregivers of children signed up to take part in the study. After we screened for eligibility, 25 mothers and their children (11 males and 14 females) who met the study inclusion criteria returned the completed questionnaires and were included in the final analyses. The mean age for the child participants was 9.6 years (SD = 1.22; range 4 years).
Instrument scores
We calculated descriptive statistics for the subscales and total scores of the CSTUR, CPQ-S, PAC, PAQ-C and PMOQ and these are presented in Table 1 alongside the mean, standard deviation, range and interquartile ranges.
Descriptive statistics for the CSTUR, CPQ-S, PAC, PAQ-C and PMOQ (n = 25).
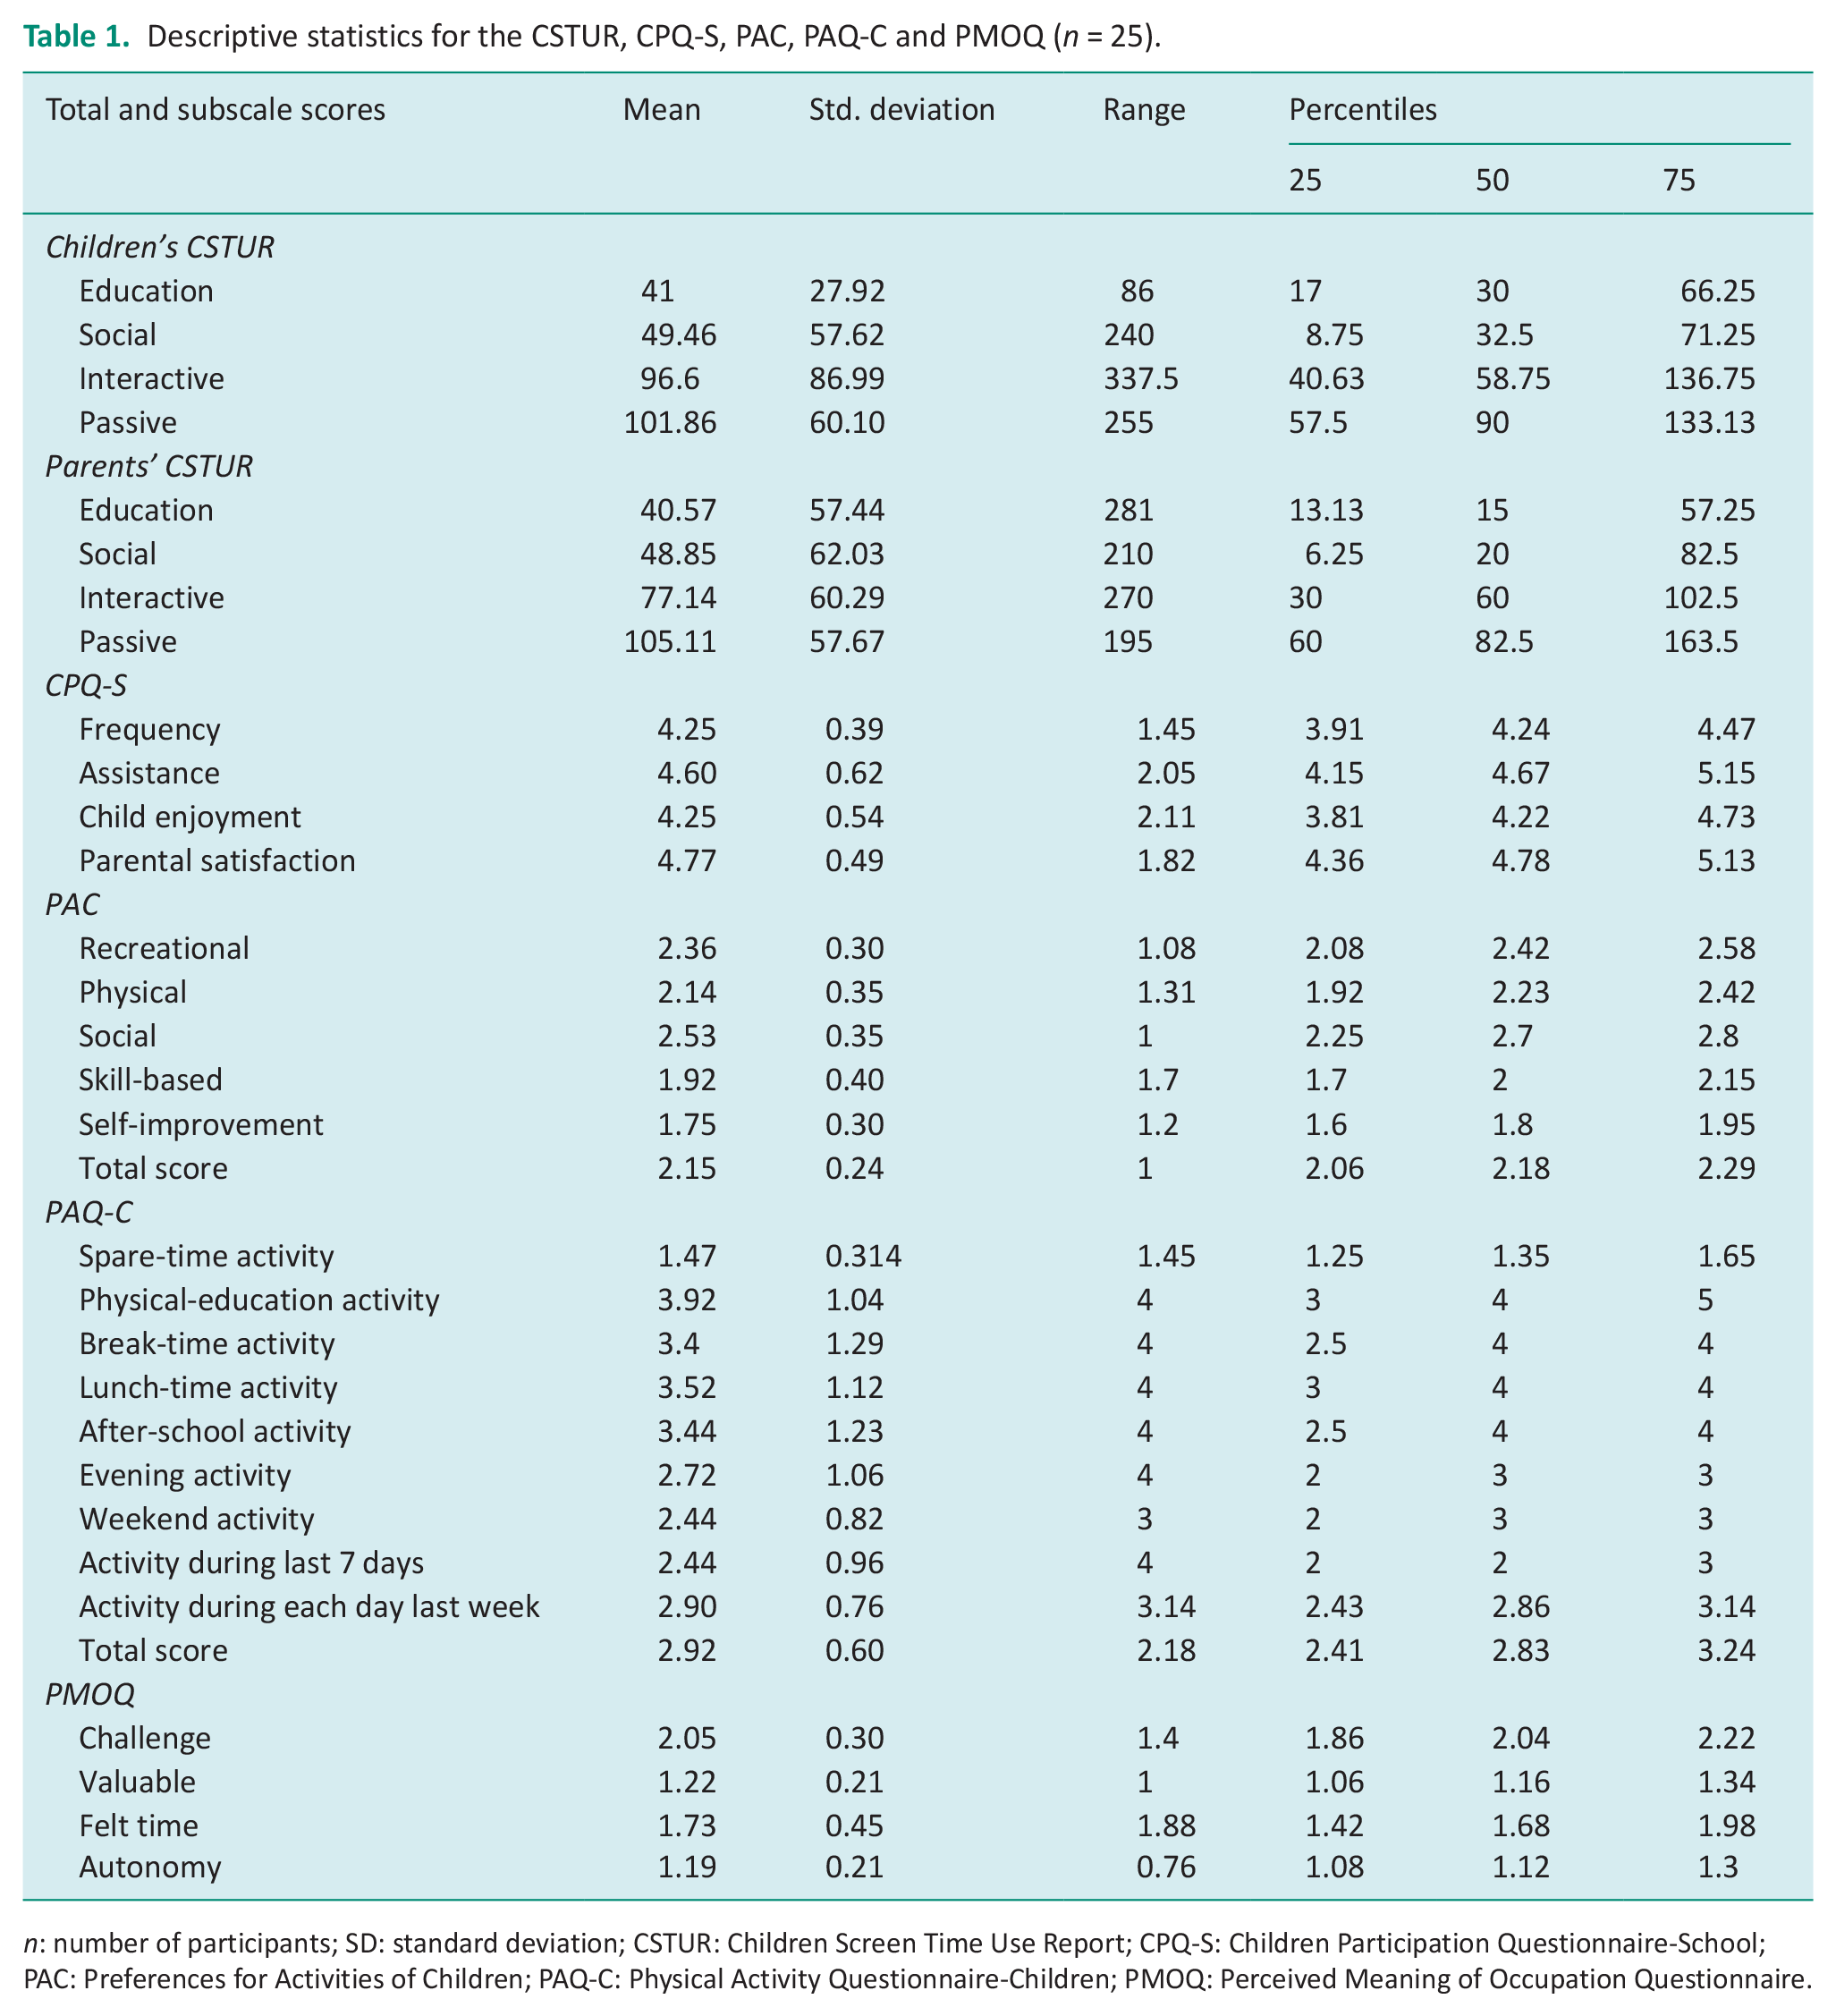
n: number of participants; SD: standard deviation; CSTUR: Children Screen Time Use Report; CPQ-S: Children Participation Questionnaire-School; PAC: Preferences for Activities of Children; PAQ-C: Physical Activity Questionnaire-Children; PMOQ: Perceived Meaning of Occupation Questionnaire.
Correlation results
No statistically significant associations were observed between the CSTUR and PAQ-C subscales in children aged 8–12 years. However, several significant correlations were obtained between the CSTUR and the PAC, PMOQ and CPQ-S scale scores (see Tables 2–4).
Spearman rho correlation (two-tailed) between the PAC and PMOQ subscale and total score with the child’s CSTUR (n = 25).
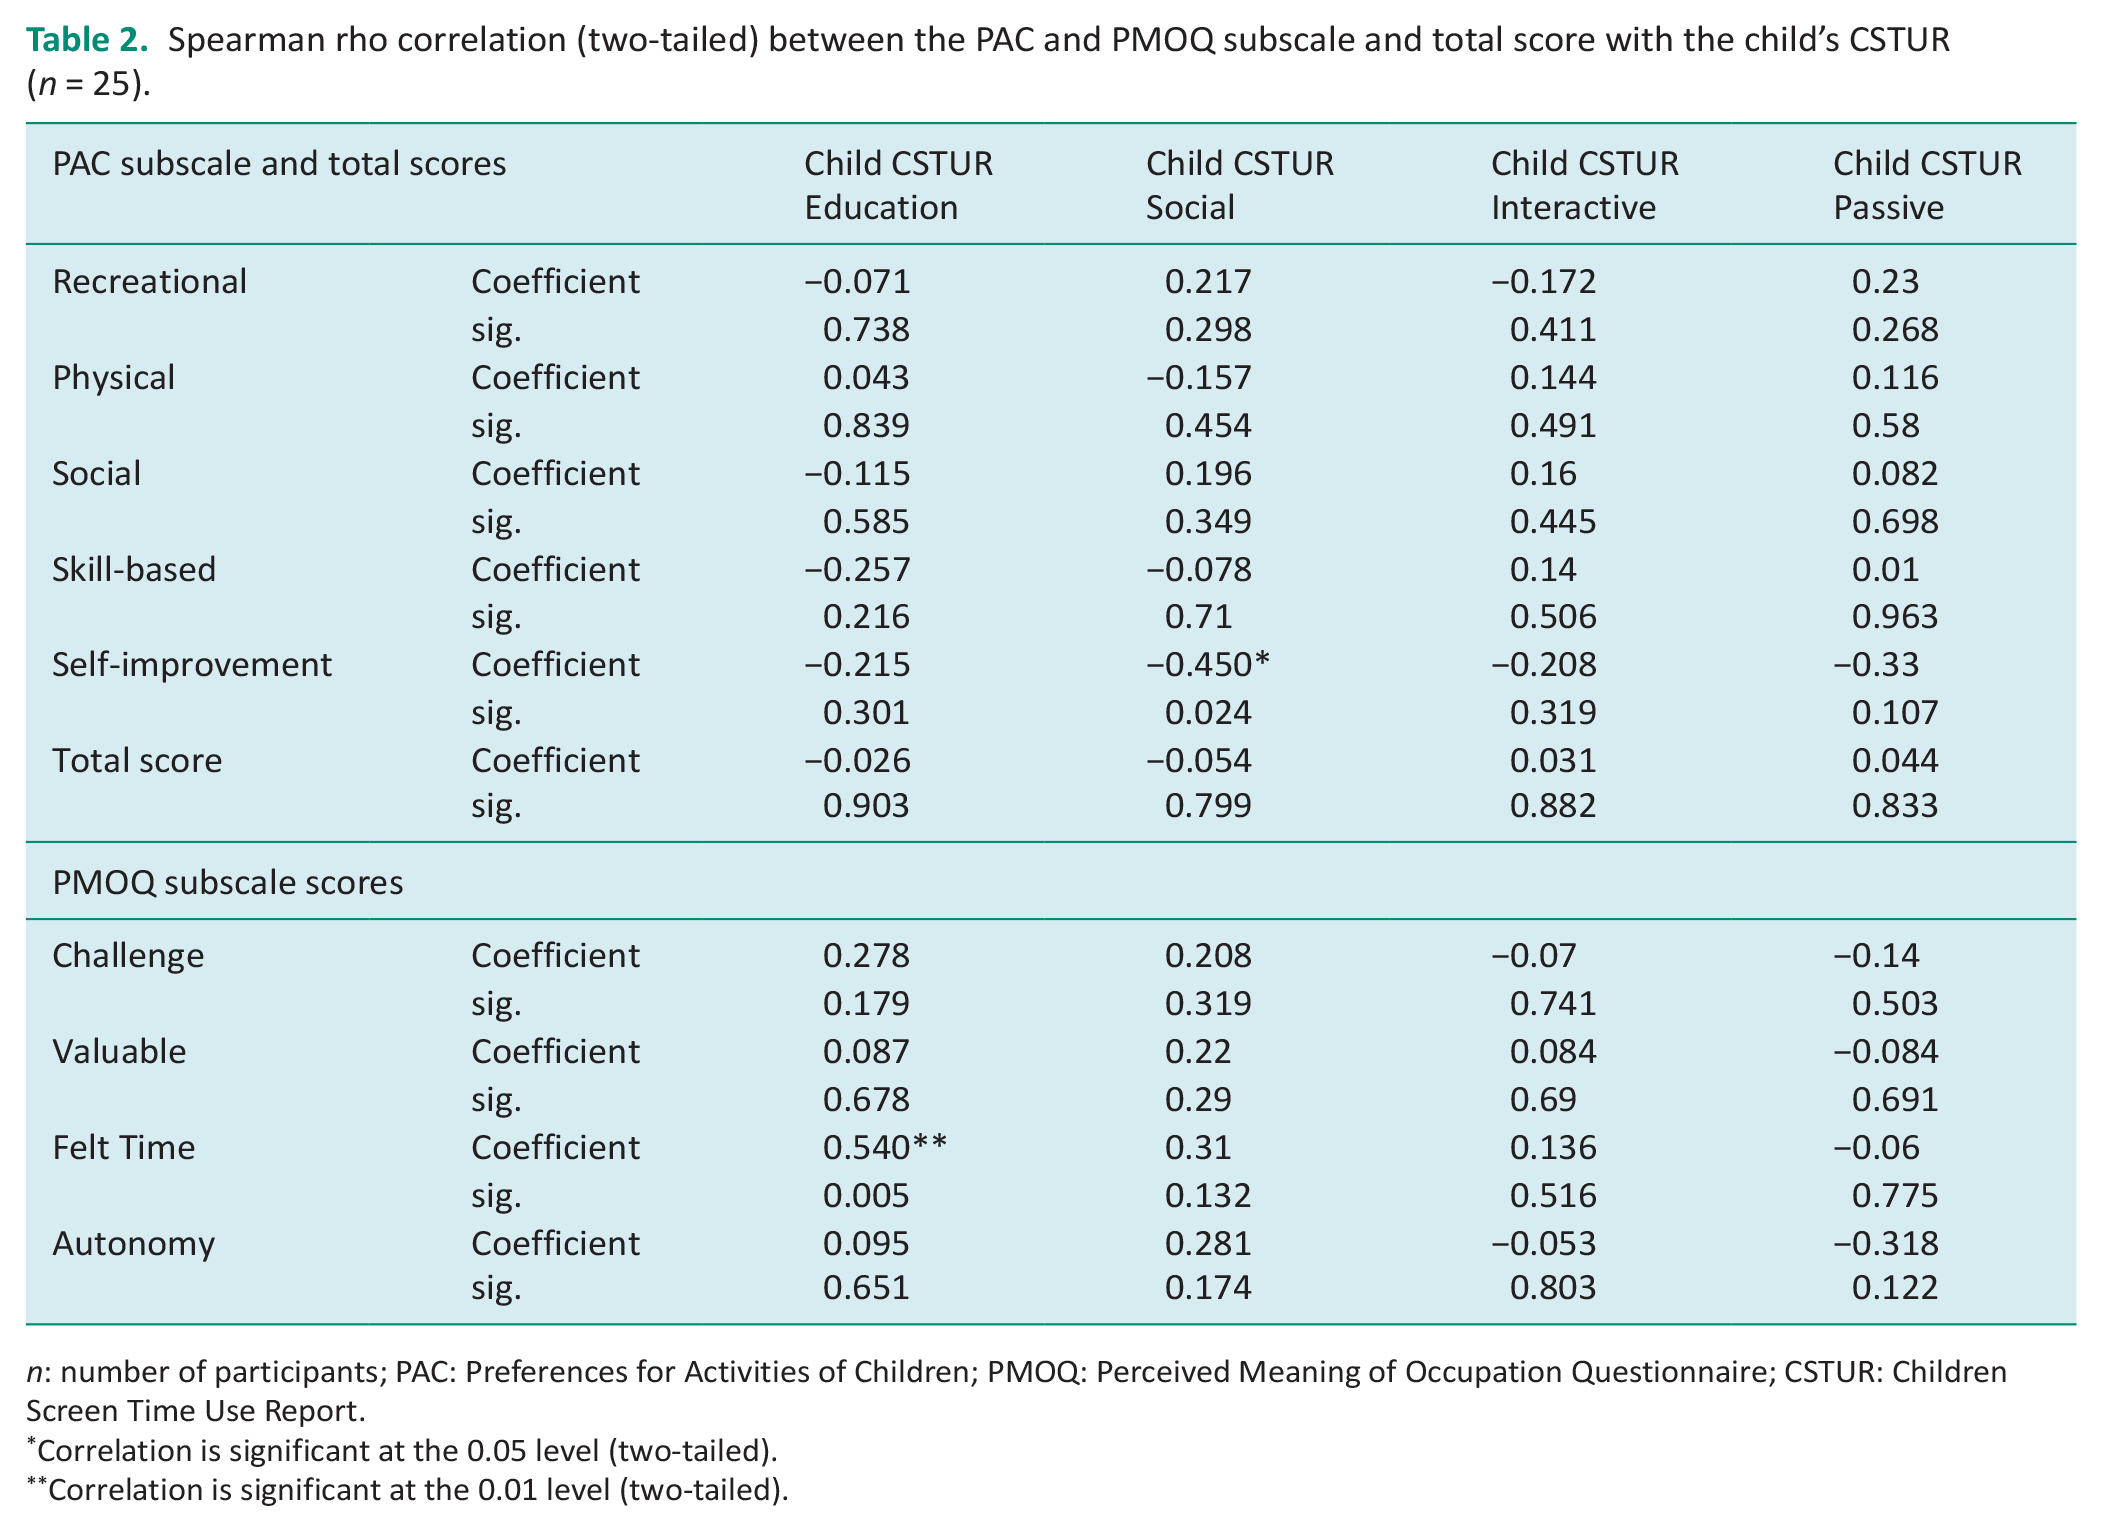
n: number of participants; PAC: Preferences for Activities of Children; PMOQ: Perceived Meaning of Occupation Questionnaire; CSTUR: Children Screen Time Use Report.
Correlation is significant at the 0.05 level (two-tailed).
Correlation is significant at the 0.01 level (two-tailed).
Spearman rho correlation (two-tailed) between the CPQ-S subscale and the children’s CSTUR subscale (n = 25).
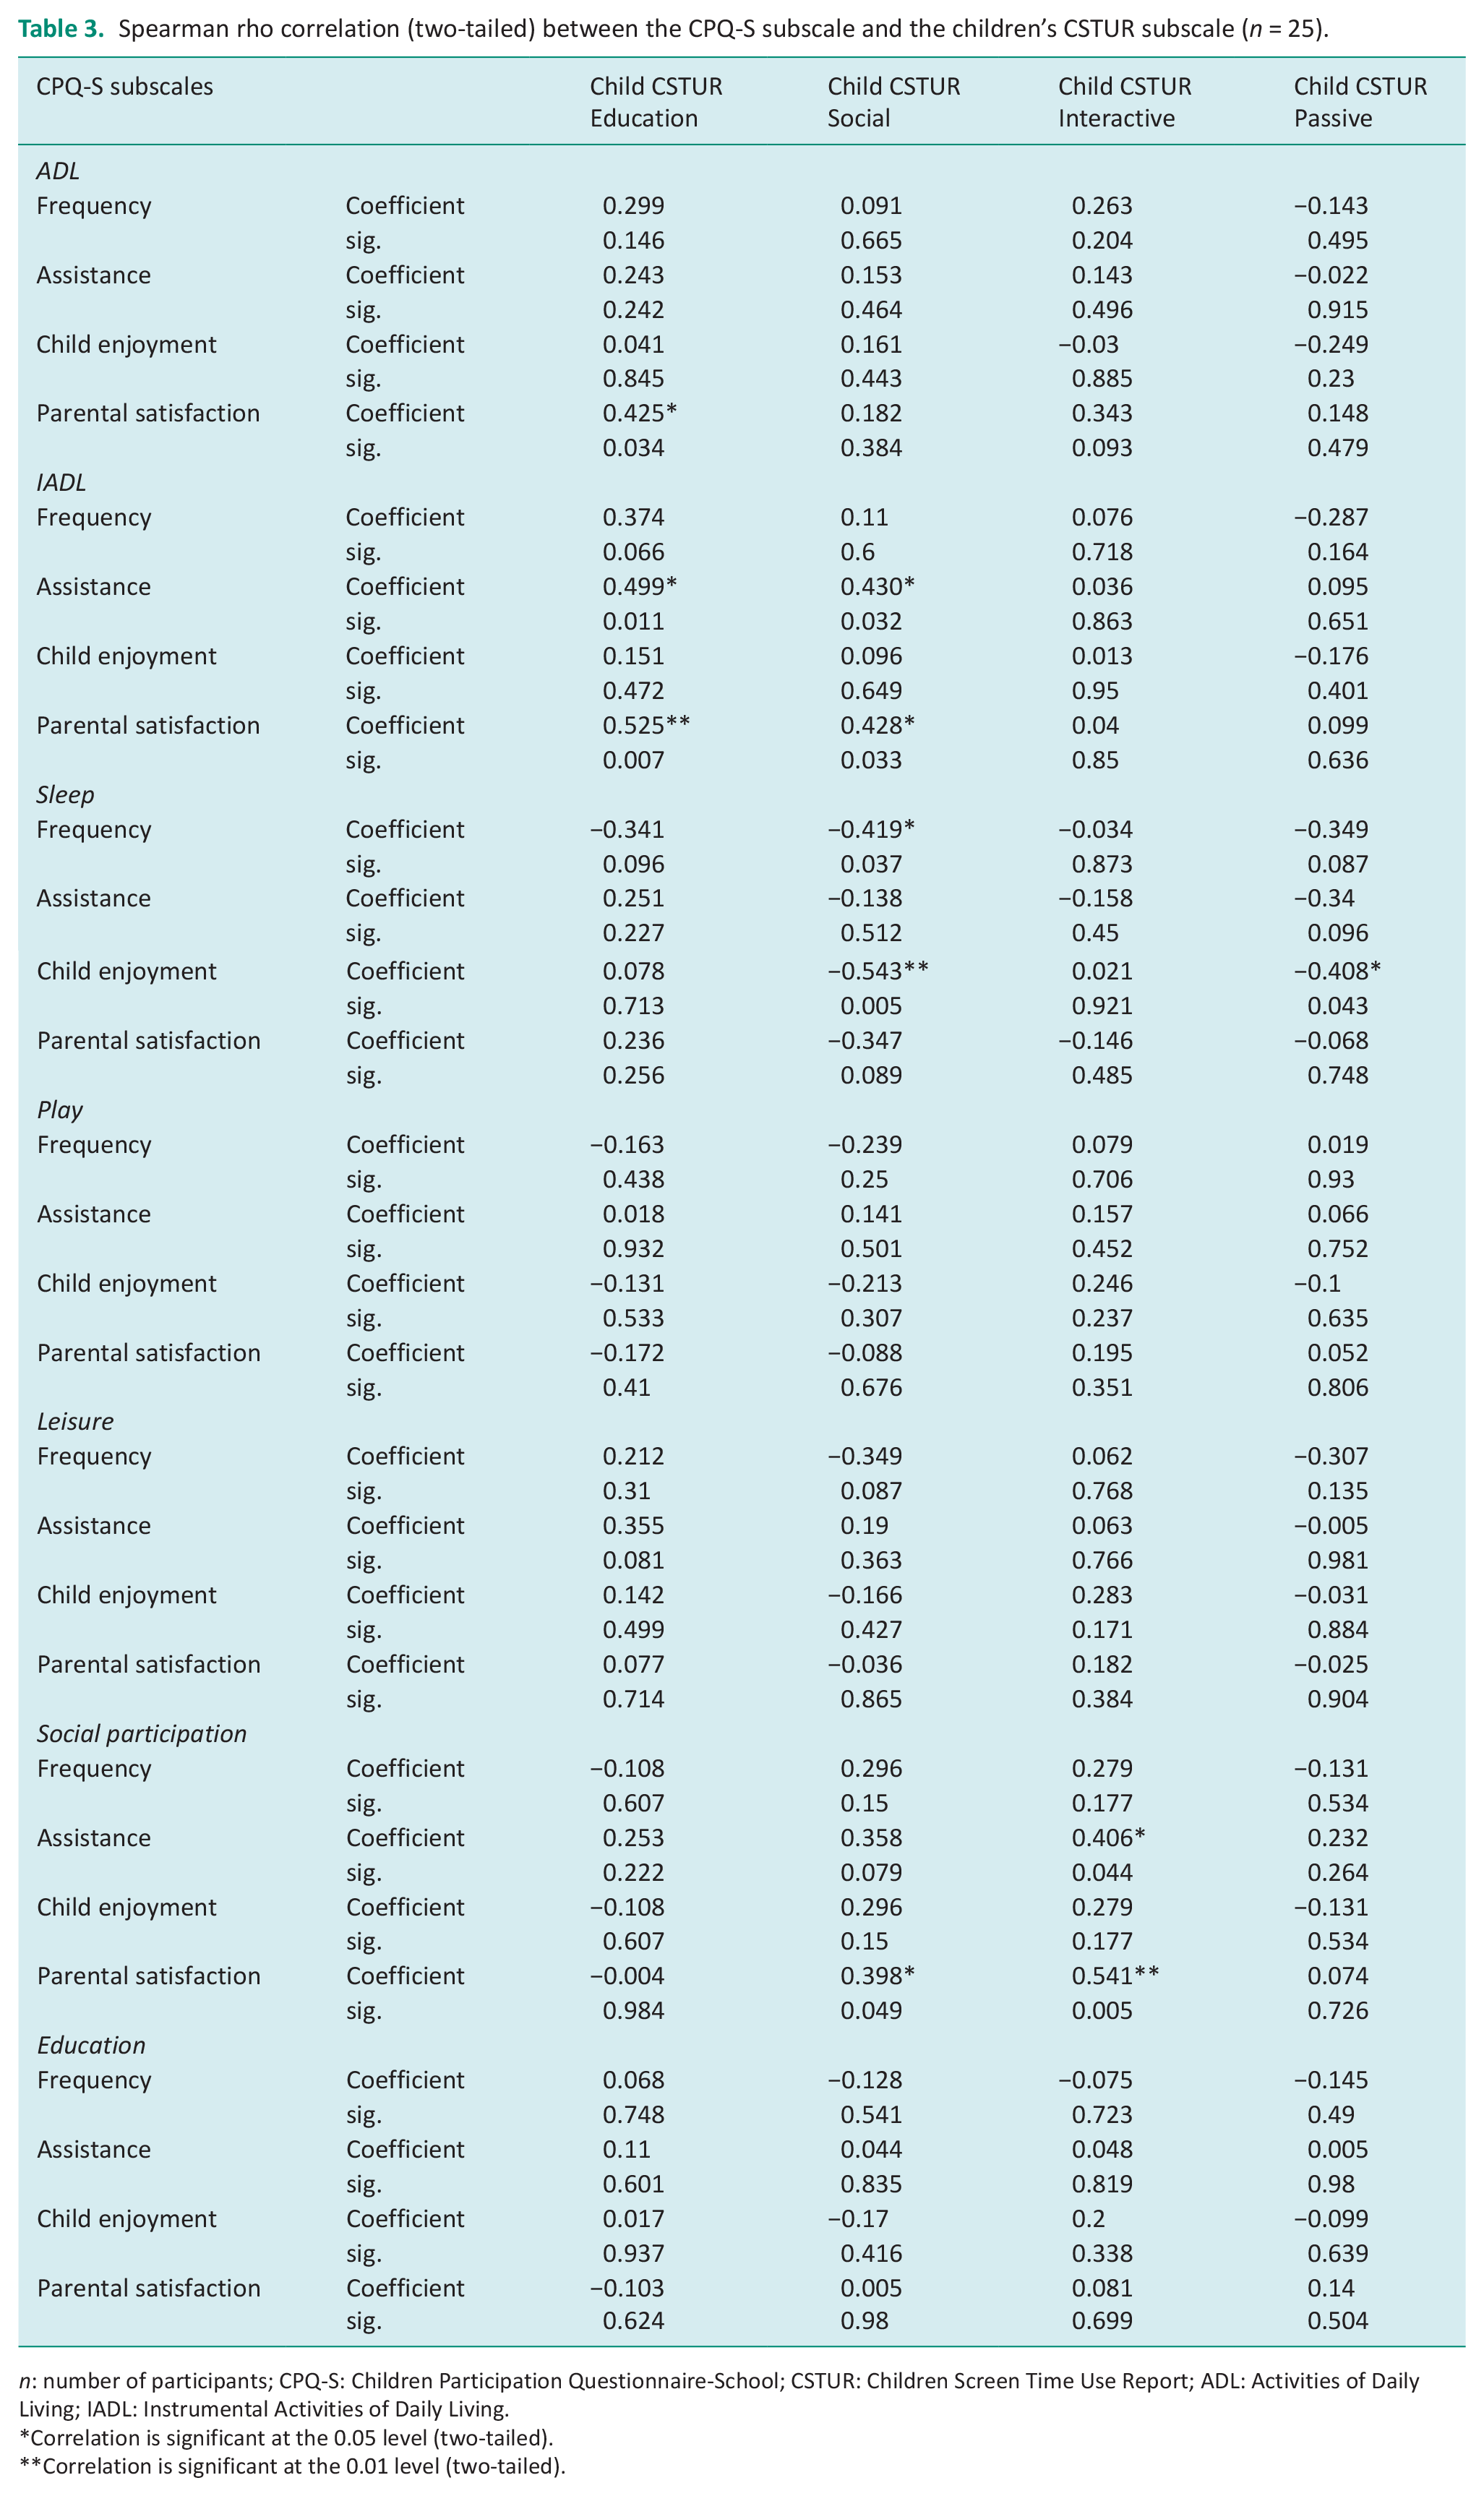
n: number of participants; CPQ-S: Children Participation Questionnaire-School; CSTUR: Children Screen Time Use Report; ADL: Activities of Daily Living; IADL: Instrumental Activities of Daily Living.
Correlation is significant at the 0.05 level (two-tailed).
Correlation is significant at the 0.01 level (two-tailed).
Spearman rho correlation (2-tailed) between the CPQ-S subscale and the parents’ CSTUR subscale (n = 25).
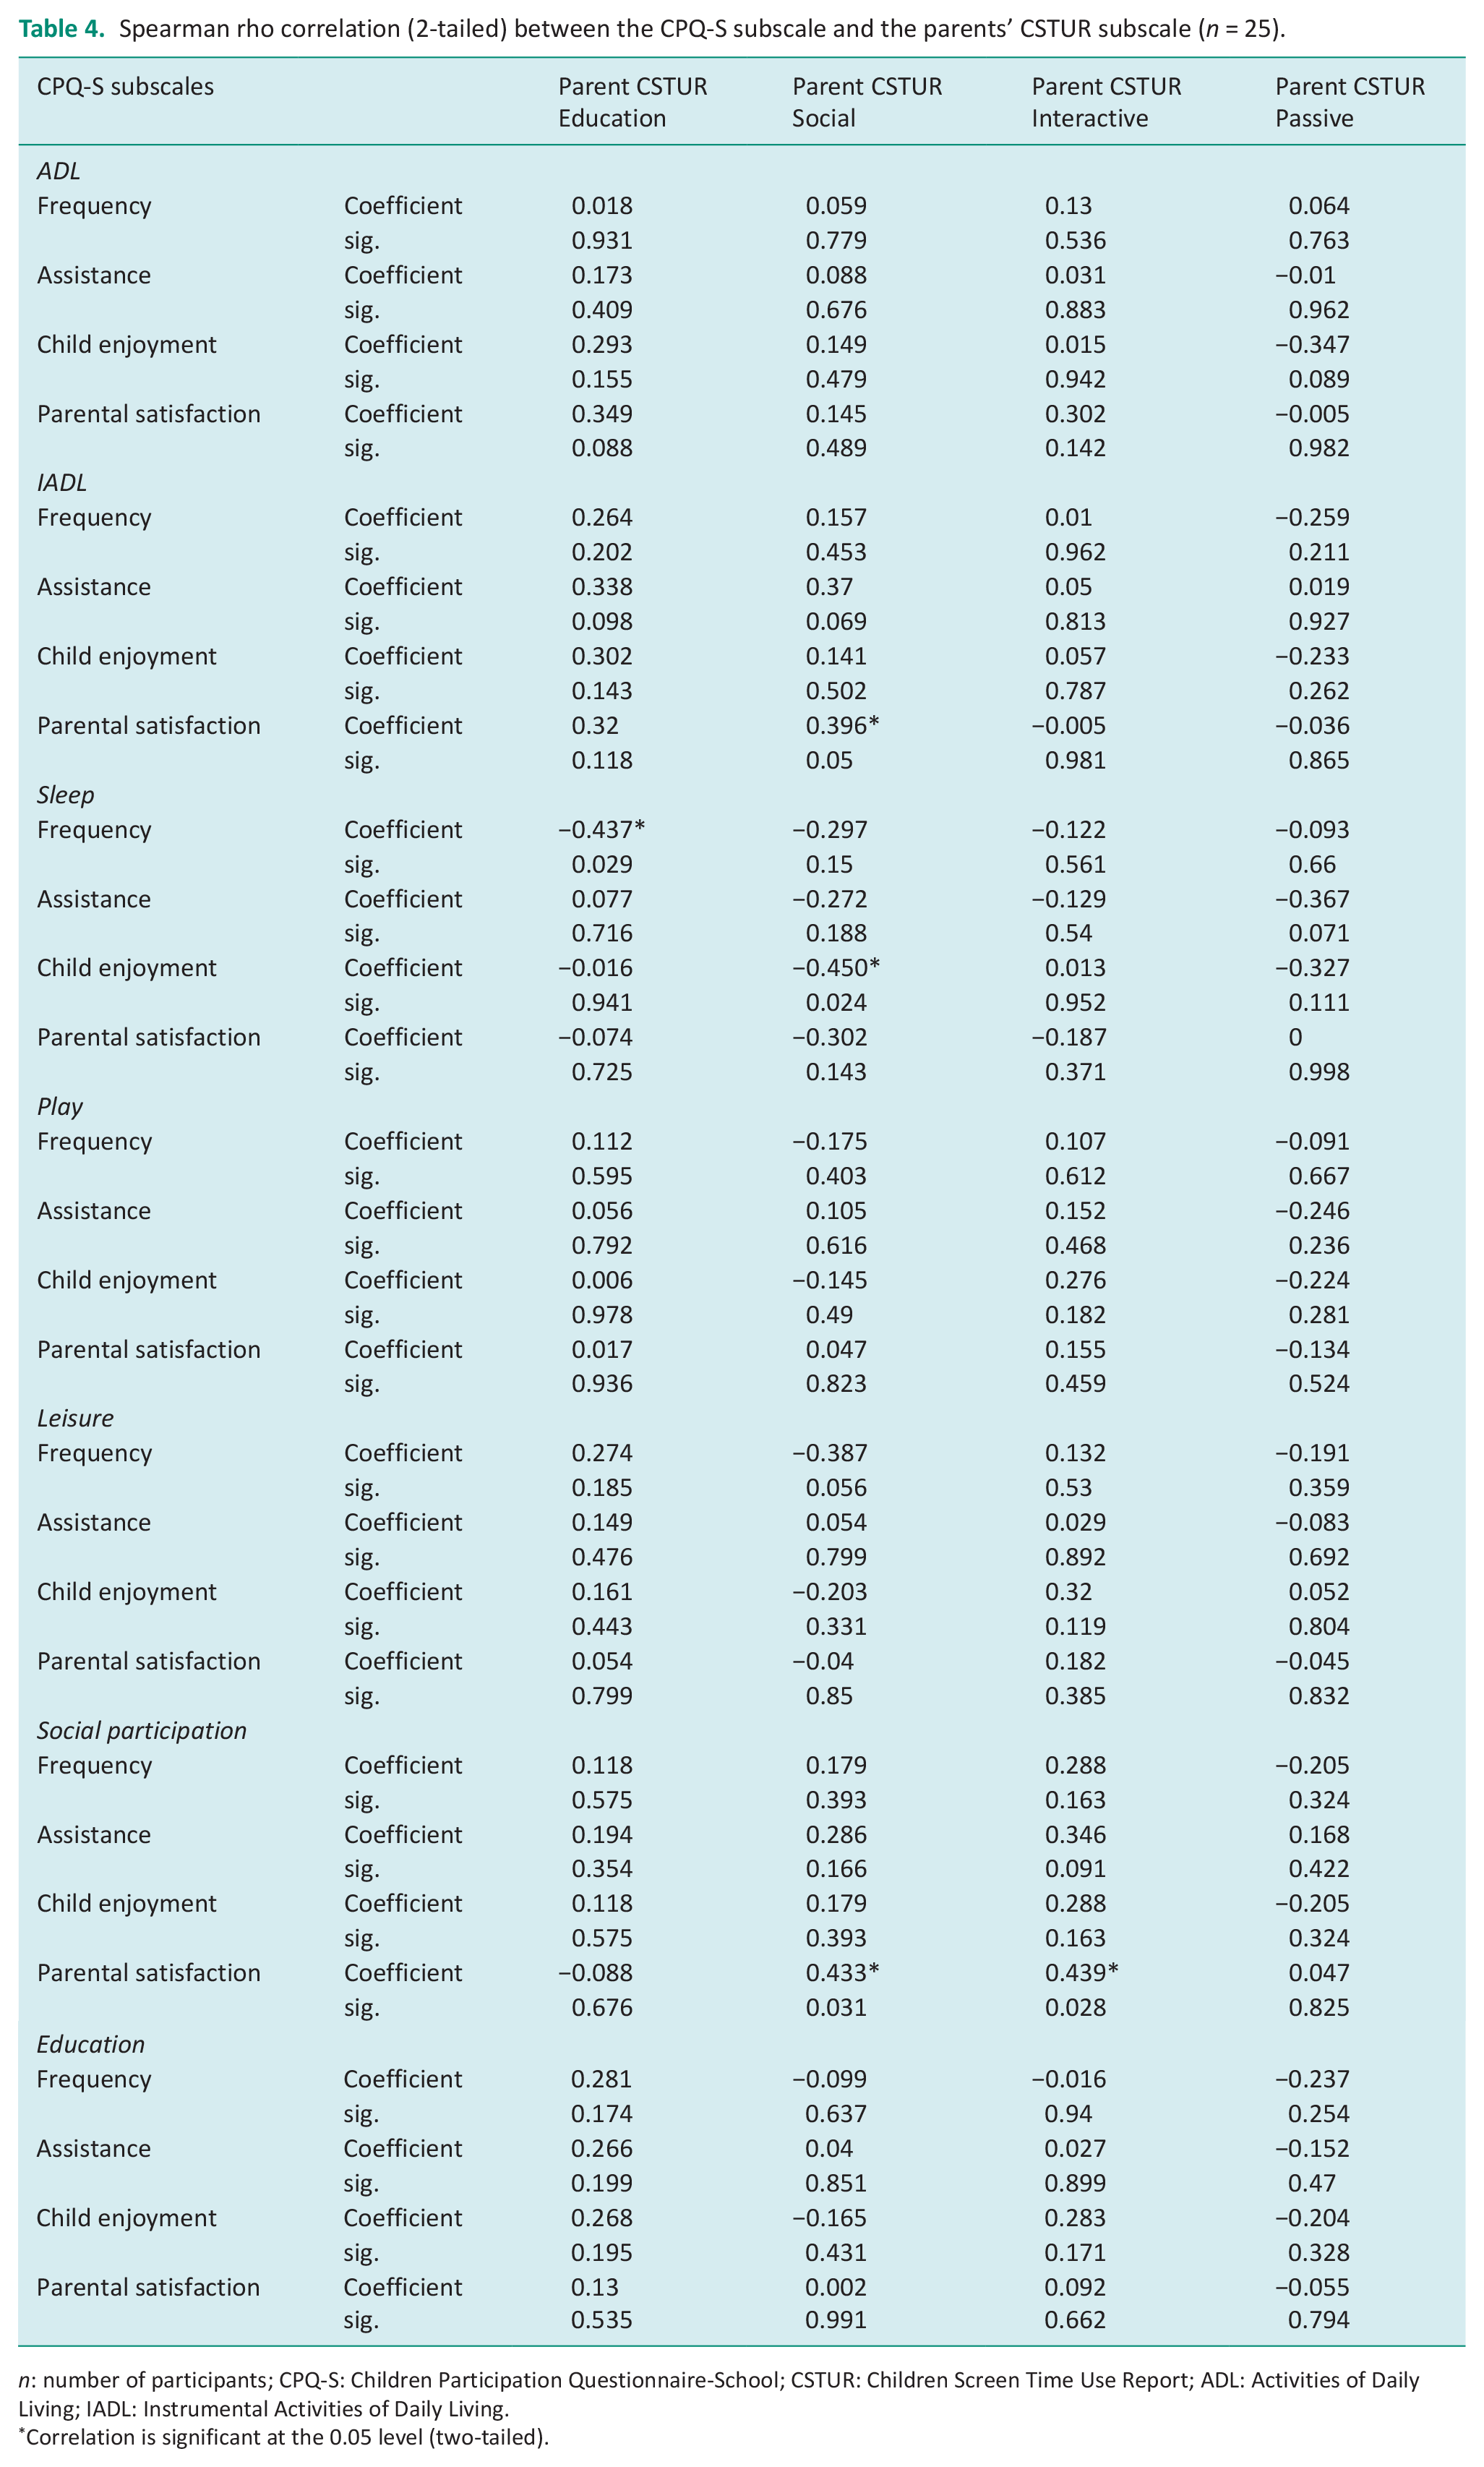
n: number of participants; CPQ-S: Children Participation Questionnaire-School; CSTUR: Children Screen Time Use Report; ADL: Activities of Daily Living; IADL: Instrumental Activities of Daily Living.
Correlation is significant at the 0.05 level (two-tailed).
PAC and CSTUR as reported by children
The PAC Self-Improvement subscale was found to have a moderate significant negative association with the CSTUR Social scale (rs = −0.450, p = 0.024).
PMOQ and CSTUR as reported by children
The PMOQ Felt Time subscale exhibited a moderate significant positive relationship with the CSTUR Education scale (rs = 0.540, p = 0.005).
CPQ-S and CSTUR as reported by children
Moderate significant positive associations were found between the CPQ-S ADL Parental Satisfaction scale with the CSTUR Education subscale (rs = 0.425, p = 0.034); CPQ-S IADL Assistance and Parental Satisfaction subscales with the CSTUR Education subscale (rs = 0.499, p = 0.011 and rs = 0.525, p = 0.007, respectively); CPQ-S IADL Assistance subscale with the CSTUR Social scale (rs = 0.430, p = 0.032); CPQ-S IADL Parental Satisfaction with the CSTUR Social scale (rs = 0.428, p = 0.033); CPQ-S Social Parental Satisfaction with the CSTUR Interactive subscale (rs = 0.541, p = 0.005); and the CPQ-S Social Assistance with the CSTUR Interactive subscale (rs = .406, p = 0.044) (see Table 3). Meanwhile, a weak positive correlation was found between the CPQ-S Social Parental Satisfaction scale score and the CSTUR Social scale score (rs = 0.398, p = 0.049).
In addition, the CSTUR Social scale score demonstrated a negative moderate significant association with the CPQ-S Sleep Frequency scale (rs = −0.419, p = 0.037) and the Sleep Child Enjoyment scale (rs = −0.543, p = 0.005). The Sleep Child Enjoyment scale was also found to have a moderate negative relationship with the CSTUR Passive subscale (rs = −0.408, p = 0.043; see Table 3).
CPQ-S and CSTUR as reported by parents/caregivers
The CPQ-S IADL Parental Satisfaction scale showed a positive weak correlation with the CSTUR Social scale (rs = .396, p = 0.05; see Table 4). Meanwhile, a negative moderate association was seen between the CPQ-S Sleep Child Enjoyment scale and the CSTUR Social scale (rs = −0.450, p = 0.024), and the CPQ-S Sleep Frequency scale with the CSTUR Education scale (rs = −0.437, p = 0.029). Lastly, a moderate positive significant correlation was seen between the CPQ-S Social Parental Satisfaction scale with the CSTUR Interactive scale (rs = .433, p = .031), and the CSTUR Passive scale (rs = 0.439, p = 0.028; see Table 4).
Discussion
Association between children’s ST use and their self-reported PA
Our findings showed no significant associations across PAQ-C subscales with the CSTUR subscales in children aged 8–12 years. Thus, our results contrast with those of previous studies that exhibited a significant association. Our results support Dahlgren et al.’s (2021) investigation which examined the relationship between smartphone ST and PA among children and adolescents aged 10–15 years (n = 121). Like our study, the authors found no significant associations between ST use and PA levels in children aged 10 to 15.
Our findings also concur with those of Serrano-Sanchez et al. (2011) who reported that no single screen-related behaviour was associated with the reduction of PA in Spanish adolescents aged 12–18 years (n = 3503). Feldman et al. (2003) also found that PA was not associated with watching television or playing video games in a cohort of 10th grade students in Montreal, Quebec (n = 948). Therefore, the findings from our study indicate that certain types of ST-related activities may not be associated with PA levels in children. Potential reasons for this occurring are that the ST measures used to collect data are not sensitive to other specific subtypes of electronic device use, children may use electronic devices during some PA (e.g. wearing headphones when performing physical exercise), or PA levels are not directly impacted by ST in some cross-cultural contexts.
Association between children’s ST use and their self-reported activity preferences
Our study found that social ST was negatively associated with the child’s self-reported activity preferences for self-improvement (e.g. completing educational activities; King et al., 2004). This suggests that increased social ST may be associated with decreased preferences for self-improvement activities. Children may prefer engaging in ST activities they perceive as being fun instead of engaging in self-improvement activities that they may view as work or mandated.
The current literature supports links between negative associations of social ST and educational activities. Liu et al. (2022) examined the effects of smartphone use in students aged 10–19 in Shanghai, China and found that more than 30% of adolescents used smartphones for social and entertainment purposes. Spending ample time on social media and entertainment took time away from participation in other various activities and, therefore, may have influenced children’s interest and preferences in completing self-improvement activities such as doing homework, which is vital for their learning development.
Mundy et al. (2020) conducted a longitudinal Australian cohort study to examine the effects of media use on AP in children aged 8–9 years (n = 1239). The findings indicated that children who used computers for more than 1 hour per day for leisure-related activities exhibited lower academic scores at a later age compared to those who spent less than an hour per day. Therefore, it appears that parents/caregivers should consider limiting children’s social ST use since it appears to have a negative predictive impact on future academic achievements.
Association between children’s ST use and their self-reported perceptions of meaning of everyday activities
A positive association was observed in our study between the PMOQ Felt Time subscale and the CSTUR Education ST subscale. Felt Time as defined by the PMOQ is ‘the mean score for sense of time and engagement’ (Rosenberg et al., 2019: 6). Only a few studies have investigated children’s sense of time and engagement in relation to ST activities, although research by Rosenberg et al. (2019) has examined the relationship between school-aged Israeli children’s (6–12 years) perceived meaning and their participation as assessed by parents (n = 60). Their results demonstrated that children perceived educational activities (e.g. studying) as challenging compared to self-care or leisure activities. However, the children appeared to recognize the importance of education and learning as enablers for development regardless of its difficulty level. Hence, our study supports the literature in suggesting that children are more engaged and have a sense of using time in a constructive way when it relates to education related tasks which are perceived by them as valuable (Rosenberg et al., 2019). Children are likely more motivated and invested in activities that they self-select, that they receive positive feedback from parents and peers to engage in, and that they receive a positive outcome from.
Associations between ST use as reported by children and their activity participation as reported by their parents/caregivers
A positive correlation was found in our study between the child’s reported ST use for Education and the Assistance and Parental Satisfaction subscale scores on the ADL and IADL of the CPQ-S. Our study determined that children who used ST for educational purposes were less likely to require parental/caregiver assistance during self-care or domestic care tasks. This could be the result of children educating themselves through reading and learning from the internet. Parents/caregivers were therefore more satisfied with their child’s participation.
In addition, a positive correlation was identified between the IADL (Assistance and Parental Satisfaction) scale scores and the Social Participation (Parental Satisfaction) scale score on the CSTUR Social scale in our study. The results suggest that those children who spent time socializing with friends online may require less assistance with IADL tasks and that parents are more likely to be satisfied with their child’s social participation. Our findings are like those of Paulich et al. (2021) who describe the positive effects of social ST use on peer relationships, identifying an association between ST use, where children stayed connected with their peers through social media, texting or video calls and higher numbers of close friends, increased social skills and the development of strong relationships (Paulich et al., 2021). Therefore, the literature clarifies and supports our findings where parents were likely to be satisfied with their children’s use of ST for social purposes.
A further positive correlation was observed in our study between the CPQ-S Social Participation (Assistance and Parental Satisfaction) scales and the CSTUR Interactive subscale score. Gentile et al.’s (2009) investigation of video game habits in Singaporean children (grade 7; n = 727) reported a positive association between interactive ST (playing prosocial video games) and the amount of prosocial behaviour exhibited by children. They found that children who frequently played prosocial video games were more inclined to later exhibit and be involved in helpful behaviours. The promotion of children’s positive social interactions with their peers therefore explains parental satisfaction with their child’s social participation as found in our study.
In contrast, Social and Passive ST demonstrated a negative association with the CPQ-S Sleep (Frequency and Child Enjoyment) scale scores in our study. Our finding concurs with Mortazavi et al.’s (2019) study which found that children who played on a computer or watched television for more than 2 hours per day were more likely to present with sleep problems and experience shorter sleep durations. This association can potentially be explained by screen devices’ emission of short light wavelengths which are perceived as blue light – this is known to delay the natural release of melatonin and decrease feelings of sleepiness (Shecter et al., 2018). Children who engage in high amounts of ST could therefore experience less restful sleep and increased next-day sleepiness which in turn may negatively affect their participation and concentration levels at home and school. Likewise, children who may be sleep deprived are less likely to be ready to engage in learning activities, play, and social opportunities with peers.
Several similarities were also found between the child’s reported ST use and parents/caregivers reported ST use and the child’s participation questionnaire: for example, between CPQ-S Social Participation (Parental Satisfaction) and the CSTUR Social and Passive subscale scores. As previously discussed, children who spend time interacting actively with friends online may be associated with improvements in their social skills; therefore, parents/caregivers may be more likely to be satisfied with their children’s social participation. Both sets of data also showed a negative statistically significant association between the CPQ-S Sleep (Child Enjoyment) and CSTUR Social subscale scores.
Interestingly, we did not identify any notable associations between the CPQ-S and CSTUR Education ST subscale scores as reported by parents/caregivers. This suggests that parents/caregivers may not have observed their child participating in completing homework or the results from the CSTUR reported by parents/caregivers are either over or underestimated compared to their child’s reported ST use for education. However, our results stress the importance of parents/caregivers monitoring and limiting the timing and duration of ST to overcome the detrimental effects of ST on children’s AP and sleep.
Limitations
Several limitations are associated with our study. Firstly, the small sample size may have contributed to the statistical analyses having limited power while the convenience and snowball sampling methods used to recruit participants may have contributed to bias since individuals who volunteered to take part in the study may have been motivated to do so. Secondly, the CSTUR, CPQ-S, PAC, PAQ-C and PMOQ are all self-report scales and can therefore be prone to social desirability and recall bias. Lastly, the online recruitment of participants may have inadvertently excluded families without internet access.
Recommendations for future research
We recommend this research is replicated with a larger and more diverse sample of participants. Similarly, instead of assessing total ST use in children, the different ST subtypes and their impacts could be investigated further. Children’s PA levels could be measured in different ways including the use of monitoring devices. We recommend that future research be conducted using a mixed-methods approach to obtain a broader overview of the factors being studied. For example, children’s opinions and perspectives could be solicited on the impacts of ST on different occupations such as self-care, leisure, sleep and play to gain more detailed, richer and nuanced insights on the topic. Finally, the recruitment of a larger sample would allow regression analyses to investigate the predictive relationship between different types of children’s ST and their activity participation and PA.
Implications for occupational therapy practice
Occupational therapy practice thrives on the concept of achieving occupational balance (Wagman et al., 2012). Therefore, by monitoring the potential for excessive use of ST, children will be able to engage in the right amount and variation of occupations to support their development, health and well-being. The findings from this study provide further insights for occupational therapists in their clinical reasoning and support their evidence-based practice on the potential impacts of ST on school-age children’s activity participation and PA. As such, occupational therapists are better informed and may implement strategies such as educating parents and teachers to monitor screen activities and help limit children’s ST use to a maximum of 2 hours per day.
Conclusion
The relationship between school-age children’s ST, activity participation and PA was examined. Several statistically significant associations were found between children’s ST use and their self-perceived meaning of everyday activities, activity preferences and participation (as reported by their parents/caregivers). Meanwhile, no statistically significant association was found between children’s ST use and PA. Overall, this study has confirmed the findings of previous research on the impacts of high ST use on children’s activity participation, especially sleep and learning, and provided new insights for occupational therapists working with children and their levels of ST use.
Key findings
High levels of screen time in school-age children may impact their activity participation, especially sleep and learning.
Screen time was not associated with PA levels in school-age children.
What the study has added
The study contributes to the occupational therapy evidence base regarding the significant relationship between screen time use, participation and PA in typically developing school-age children.
Footnotes
Research ethics
Ethics approval was granted by Deakin University Human Ethics Advisory Committee on 23 May 2022 (approval number HEAG-H 38_2022).
Consent
Written and verbal informed consent to participate in the study were obtained from all participants.
Patient and public involvement data
Patient and public involvement in the research was not included at any stage of the research.
Declaration of conflicting interests
The author(s) declared no potential conflicts of interest with respect to the research, authorship, and/or publication of this article.
Funding
The author(s) declared no financial support for the research, authorship, and/or publication of this article.
Contributorship
TB and MLY conceived the study topic and study design. TN researched literature supporting the study and completed data collection with guidance from TB and MLY. TB, MLY and TN were all involved in gaining ethical approval and data analysis. TN wrote the first draft of the manuscript. TB, MLY and TN were involved in critically evaluating, reviewing, and editing the manuscript. All authors approved the final version of the manuscript that was submitted to BJOT.