
Abstract
This article presents the design and monitoring of a lab-scale smart farming system through the integration of control and app designs that can be used for teaching embedded control application to electromechanical systems. A combination of sensors and actuators is used to develop an Arduino-based embedded feedback control system that could be implemented in a smart farming environment. Specifically, we look at controlling electromechanical devices to actuate the fan and water pump to provide the optimal temperature and moisture, respectively, to enhance plant growth in a smart farming setting. The effectiveness of the feedback control is tested by conducting a plant growth experiment. Using garden cress (Lepidium sativum) as a case study, the plant grown in the controlled temperature and moisture settings shows substantially healthier growth compared to the one grown in the non-controlled environment. In addition, an app is designed and developed to transform the Arduino data stream from the sensors into valuable insights that could help the users to monitor and improve the overall crop health. The developed system in this paper enables students to learn integral skills from interdisciplinary engineering fields (e.g. systems, control, mechanical and computer) to solve an agricultural problem.
Keywords
Introduction
It is vital to equip the next generation of engineers with a high-level of critical thinking and creativity 1 to enable them to contribute to global societal development, 2 which is why this article is centred around bridging the gap between current engineering education and practical applications in industry. This article leverages the fundamental understanding of interdisciplinary engineering concepts and provides an opportunity to apply these concepts through design and analysis to address a problem in the agricultural context.
According to the United Nation’s projection, the world population will reach 9.7 billion by 2050. This is expected to create demands for global agricultural production to rise 69% between 2010 and 2050. 3 In order to meet these demands, it is crucial for farmers to leverage data analytic models and predictive technologies to achieve greater production capabilities, simultaneously improving both yield increase and cost reduction aspects. 4 At the same time, the drive to produce locally to reduce the carbon footprint contribution from transportation also requires the use of technology in farming to create a suitable climate for the vegetation to grow off-season.
Smart farming, a farming approach that employs information and communication technologies, is deemed as the viable solution to improve farming practices to increase production sustainably5–7 It is a data-driven approach that leverages advanced technologies such as big data analytics, artificial intelligence (AI), machine learning, and cloud computing to improve the efficiency, productivity, and sustainability of farming practices. 8 Smart farming uses a network of sensors and Internet of Things (IoT) devices that collect data about various aspects of the farming environment, such as ground mapping robots, weather monitoring, and even livestock behaviour monitoring. 9 It can even be adapted to urban farming settings by providing real-time monitoring and analysis of critical plant health parameters. A recent study shows how AI has crucially contributed to sustainable solutions as fresh produce can now be harvested in urban settings when traditional agriculture is not possible. 10 Furthermore, it reduces the carbon footprint of food production by reducing transportation distances and associated emissions, as well as providing opportunities for social and economic development in urban areas. 11 All these data from smart farming can be utilised to generate insights and recommendations for optimising crop yields, reducing waste, and improving resource management using computational algorithms. 12 The backbone architecture to implement these resource managements is the feedback control system.13,14
The aim of this article is thus to propose practical teaching material that could devise a smart farming methodology that is accessible, adaptable, and sustainable. The teaching material will be driven by the embedded control system design of electromechanical devices to introduce students to emerging sensing and embedded systems technologies. This practical teaching material can be adopted for laboratory activities for engineering students, including systems engineering, electronic engineering, mechanical engineering, mechatronic engineering, and computer engineering. While the application addressed in this practical teaching material is directly related to agriculture, the sensors, control and software technologies that are involved are easily transferable to all the engineering fields mentioned above, therefore it is suitable as part of the curriculum of any of those engineering courses.
The central objective of the proposed teaching material on engineering education is to give students an opportunity to translate their existing interdisciplinary engineering knowledge and technical skills into a practical context. The laboratory will outline a low-cost and adaptable smart farming method that can be integrated into a controlled-farming environment, where it offers a cost-effective solution using readily available electromechanical components that outperform current manual farming methods. Thus, through reproducing this solution, students can understand how significant embedded control design and electromechanical devices can be applied and utilised in an industrial context beyond the scope of their theory-based engineering lectures. Students should also ensure that their solutions are logically structured around the project costs, time frames and other performance factors.
This teaching material is developed based on a project done for the first author’s third (final) year individual project for the Bachelor of Systems Engineering degree programme, and this design exercise is to be used as one of the assignments for the module called ‘Advanced Systems and Software Engineering’ offered in the third year of the degree programme.
System overview
The smart farming system consists of the following component groups as illustrated in Figure 1:
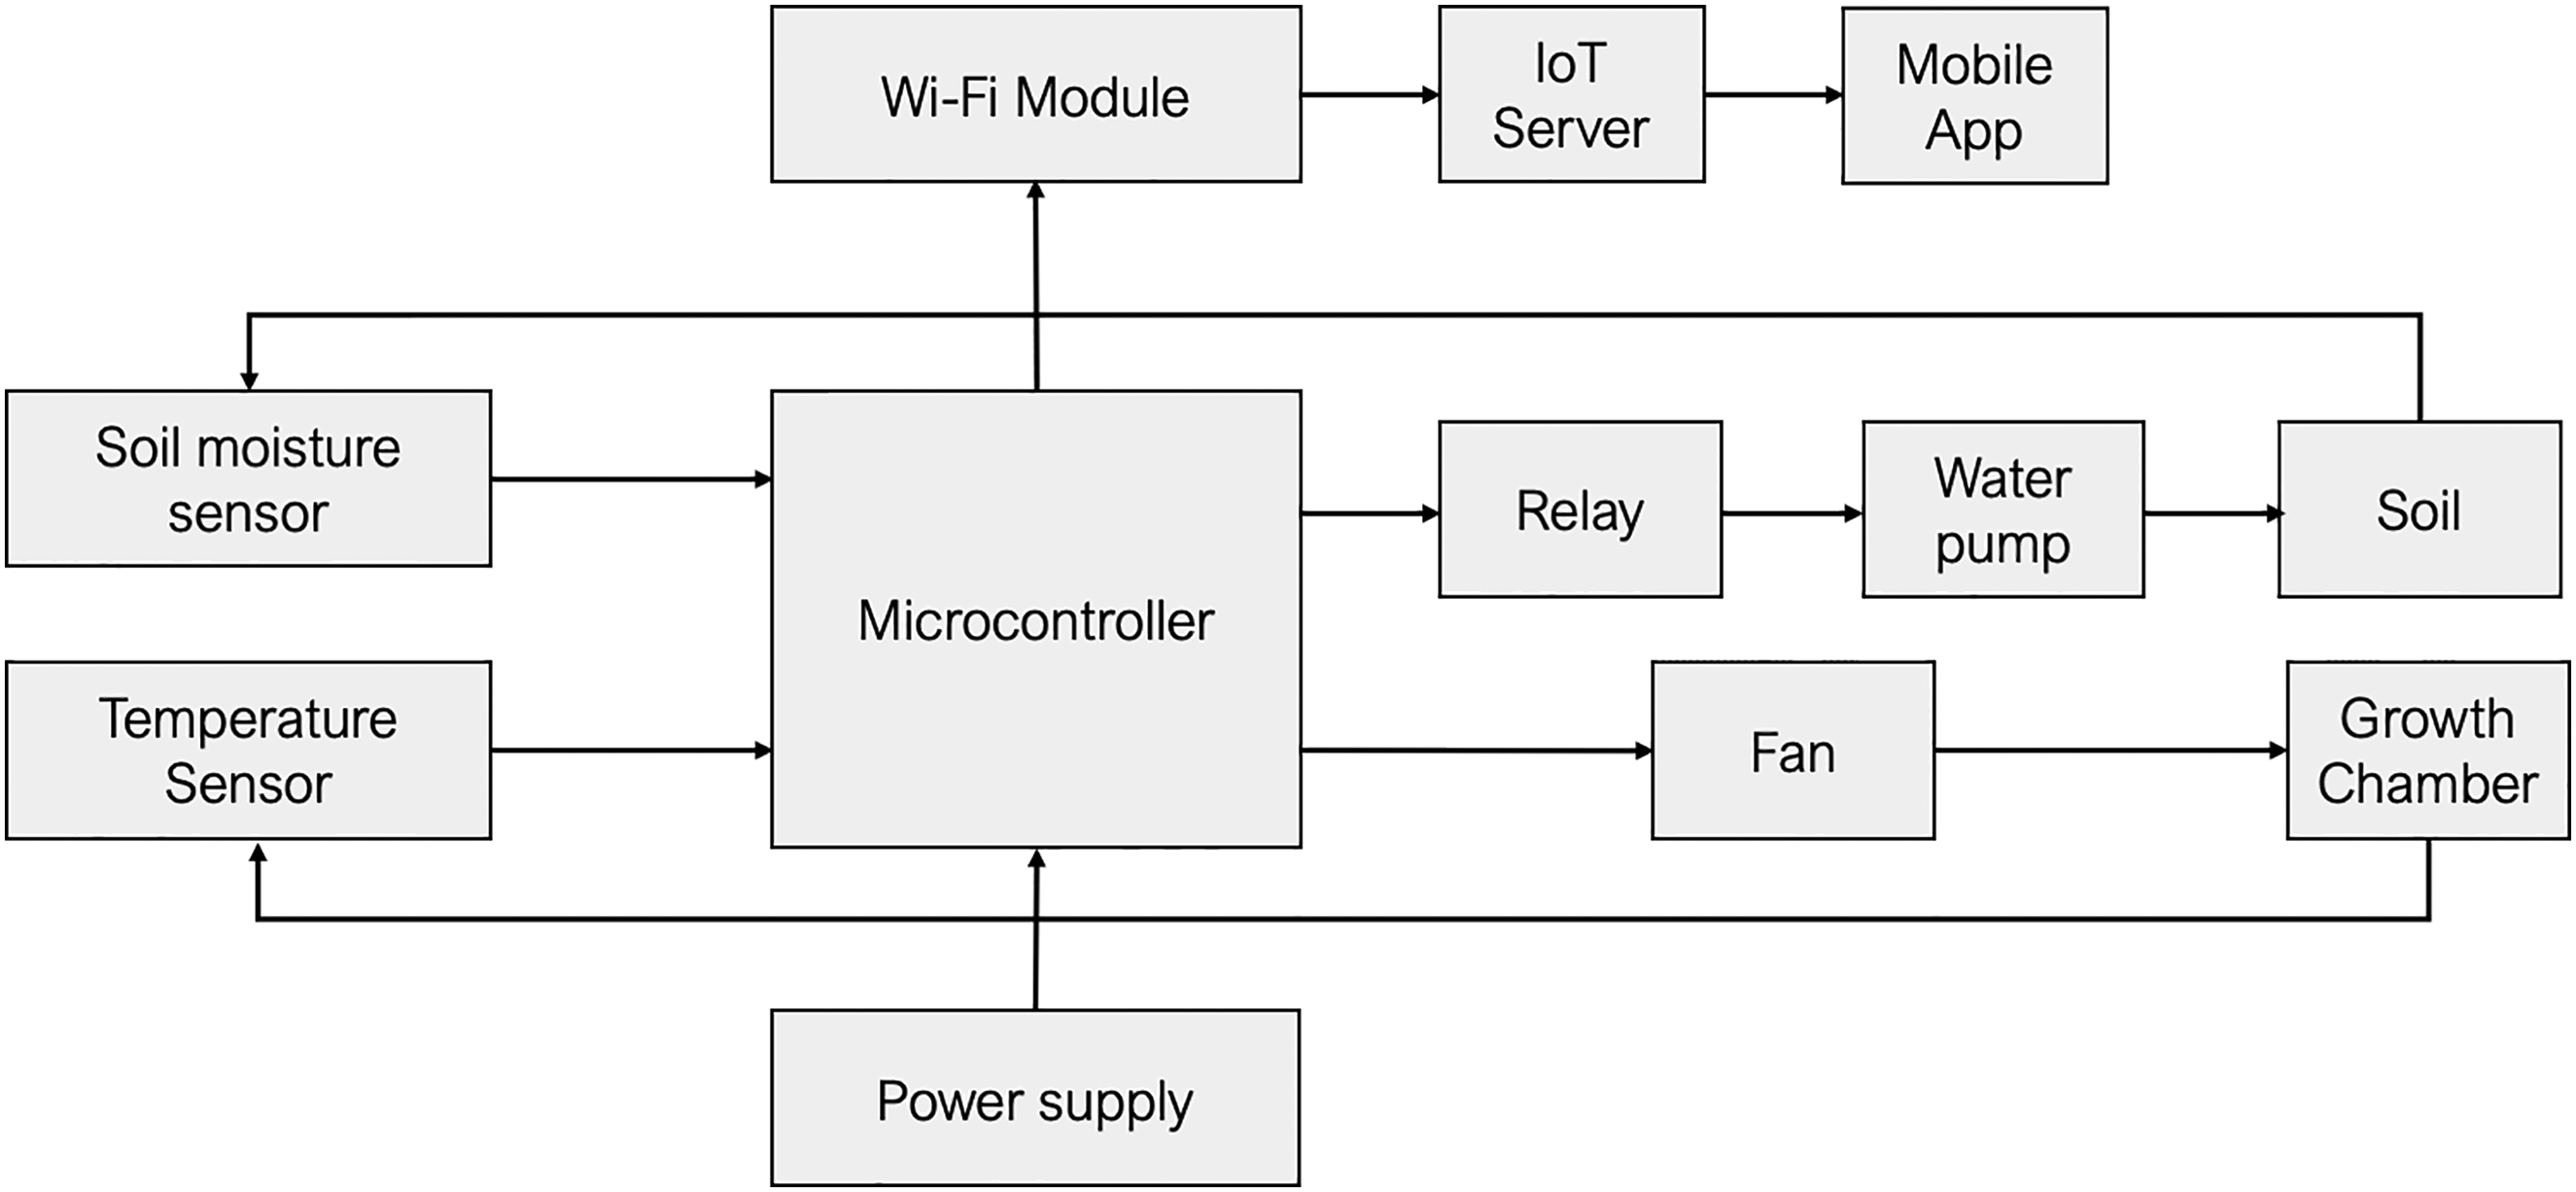
Smart farming system block diagram.
The smart farming system is designed to utilise a set of sensors, to measure some environmental variables that affect the growth of the plants. An embedded control approach is applied, utilising a simple Arduino Uno as the controller. The objective is to monitor the ambient temperature and the soil moisture, and the controller is used to ensure these variables are maintained at the level for optimal growth of the plant. From a control engineering perspective, this is equivalent set points (reference) tracking problem. The control algorithm is used to activate the actuators, that is, the fan and water pump, to regulate the temperature and the soil moisture to reach their respective set points. The details of the system components and the development are discussed in the next section.
System development
The system development was expected to provide students with the knowledge and skill to do a step-by-step engineering system design. This includes the selection of the suitable components as listed in the previous section, the calculation of the power requirement, the design of the electronic circuit and the software for the control function and the user interface, respectively, and carrying out all the testing and integration.
Sensors
Sensors are required to detect and measure signals from certain physical variables on the conditions of the system environment. An electronic sensor is connected to a data acquisition device where the measurement data are sent for further processing or use. Here, the two sensors of interest are the temperature and the moisture sensors. The implementation of these sensors involves familiarisation with the basic software aspects of Arduino IDE, exercising foundational circuit knowledge including breadboard electronic rules and calibration techniques. One important thing to note when implementing several sensors together is that data from each one sensor should not interfere with the other sensors, and should be logged and stored separately. This allows individual testing, which also facilitates the troubleshooting and debugging processes. The I/O (input/output) testing approach is widely recognised in the industry for its ability to help engineers efficiently identify issues, instil confidence in clean and maintainable code, and enhance the system’s performance, reliability, and user satisfaction.15,16
Microcontroller and embedded control
An Arduino Uno is used as the controller. This microcontroller is chosen due to its affordability, wide compatibility with various other components and is simple to program without the need for high programming skills. The Arduino Integrated Development Environment, also known as Arduino Software (IDE) 17 that is quite easy to learn and has also included the text editor, is sufficient to implement the program to control this smart farming system. This makes it an ideal choice for any engineering students wanting to learn skills such as electronics design and embedded control. If more input and output ports are needed, for instance, if more sensors are included, using an Arduino Mega would be an alternative.
An embedded feedback control system is essential for a smart farm to ensure that a controlled environment can be created and maintained. The feedback control system should be able to access the information acquired by each of the sensors to detect any deviation from the ideal operating conditions. Any deviations detected can then trigger responses to the electromechanical devices to output corrective actions, in this case changing the temperature and moisture via the fan and water pump, respectively.
Wi-Fi module
Although the engineering of feedback control has been successfully implemented, it is constrained by a wire that is connected to a laptop if data would be streamed from the Arduino. This is not a practical design aspect, thus adding wireless compatibility would ensure practicality for real-world use. Unfortunately, the Arduino Uno R3 does not have an inbuilt Wi-Fi functionality, so it is paired with a low cost ESP8266-01S Wi-Fi module to send and receive data over Wi-Fi. This will allow the system to log data and output control signals to the electromechanical devices without any manual or wired interaction.
To allow a seamless exchange of information between microcontrollers, computers and electronic components, specific protocols are in place to facilitate their communication and there are multiple methods to achieve this. The protocol UART (Universal Asynchronous Receiver/Transmitter) is a hardware communication interface that allows serial communication between devices. Additionally, Wi-Fi is a wireless communication technology that enables these devices to connect to a local area network (LAN) or the internet wirelessly.
While connection via USB was the most common approach, this entailed a dedicated wire connection from the computer (host) to the Arduino (client). The UART serial communication method was used instead as it has two wires TX (for transmitting data) and RX (for receiving data) directly to the ESP8266-01 Wi-Fi module without the need to wire Arduino to the laptop. Although UART has the advantage of receiving serial data in parallel form, there are more chances of losing the data. To minimise this risk, it is recommended to promptly transfer the data to remote cloud storage. This can be achieved by establishing a process where data from IoT devices are transferred immediately and securely to remote cloud storage methods. By doing so, the data are stored in a centralised and more secure environment, reducing the likelihood of data loss, unauthorised access, or device malfunctions.
Once the Wi-Fi connection is set up, it is important to consider how the system should mitigate any external connection issues. For instance, there is a momentary Wi-Fi signal loss in the initial setup that has caused the system to crash completely and an error message is displayed when the Wi-Fi module is plugged into the laptop. To overcome this, a ‘
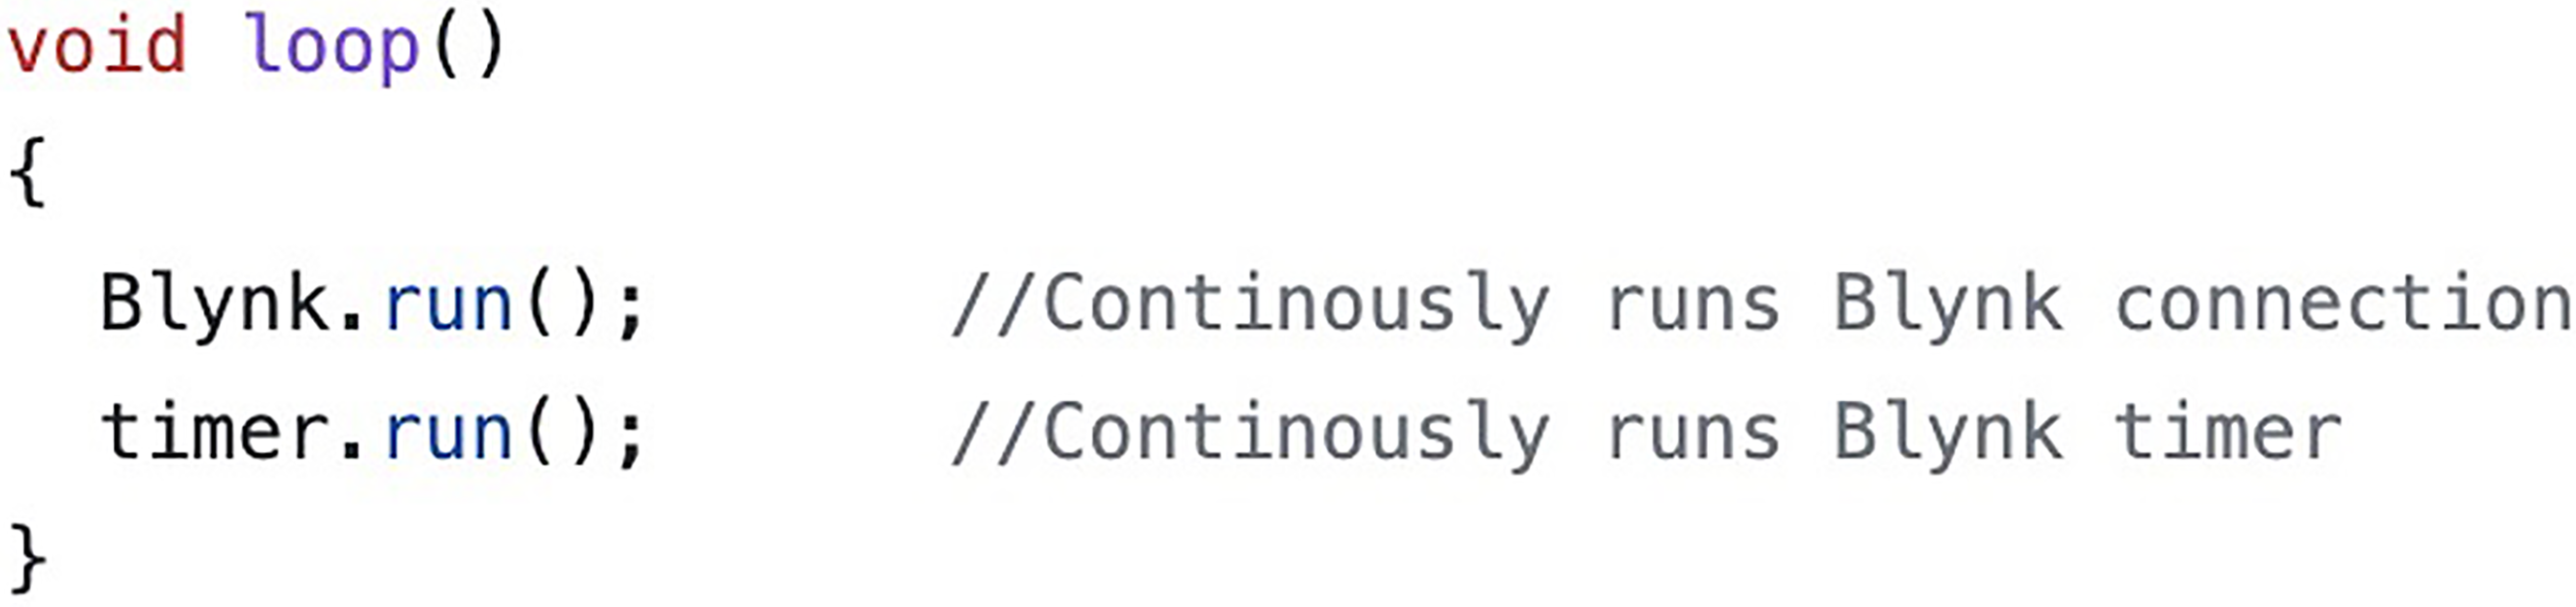
Blynk connection code.
IoT-based mobile app (Blynk)
A user-friendly software application (both for the web and app interfaces) is developed, where plant health can be monitored with real-time updates. The app displays relevant plant data from the controlled environment and appropriately stores the data in a cloud-based IoT device. Utilising data transformation tools, the app presents interactive ways for users to explore their data, providing valuable insights instead of burdening them with raw data and manual analysis. Additionally, the app allows seamless data streaming from the Arduino device, either through direct readings from the serial monitor or by exporting data to .csv format. This showcases that the purpose of this app is not solely to stream data; its forefront functionality is to provide insightful and informative metrics to the farmers.
The inclusion of real-time charts in data visualisation simplifies pattern identification and outlier detection within large data sets, facilitating faster decision-making by leveraging this pre-processed data. Another notable feature of the app is its notification system, which alerts users exclusively when an actuator is activated. Additionally, the app offers an action log history alongside real-time updates, enabling users to review any missed activities.
Growth chamber and hardware configurations
The sensors and the electromechanical devices must be installed appropriately such that they can be operated within the smart farming context. A growth chamber suitable for an indoor farming environment can be constructed to directly compare growth rates. Here, the construction of the suitable plant growth chamber and the configuration of the hardware used are discussed.
Growth chamber assembly
A cardboard box is used as the growth chamber, with the dimension of L = 43 cm; W = 56 cm; H = 32 cm as shown in Figure 3. A separator is used to divide the chamber into two, side-by-side, such that two experiments, that is, plant growing with and without feedback control can be conducted simultaneously and in quite an identical environment. A standard plant grow LED (light emitting diode) light is used to provide the required sunlight for the plant to grow. The light is programmed using a standard timer switch to switch-on for 16 h and switch-off for 8 h mimicking a typical ‘long-day’ lighting exposure for garden cress.18,19
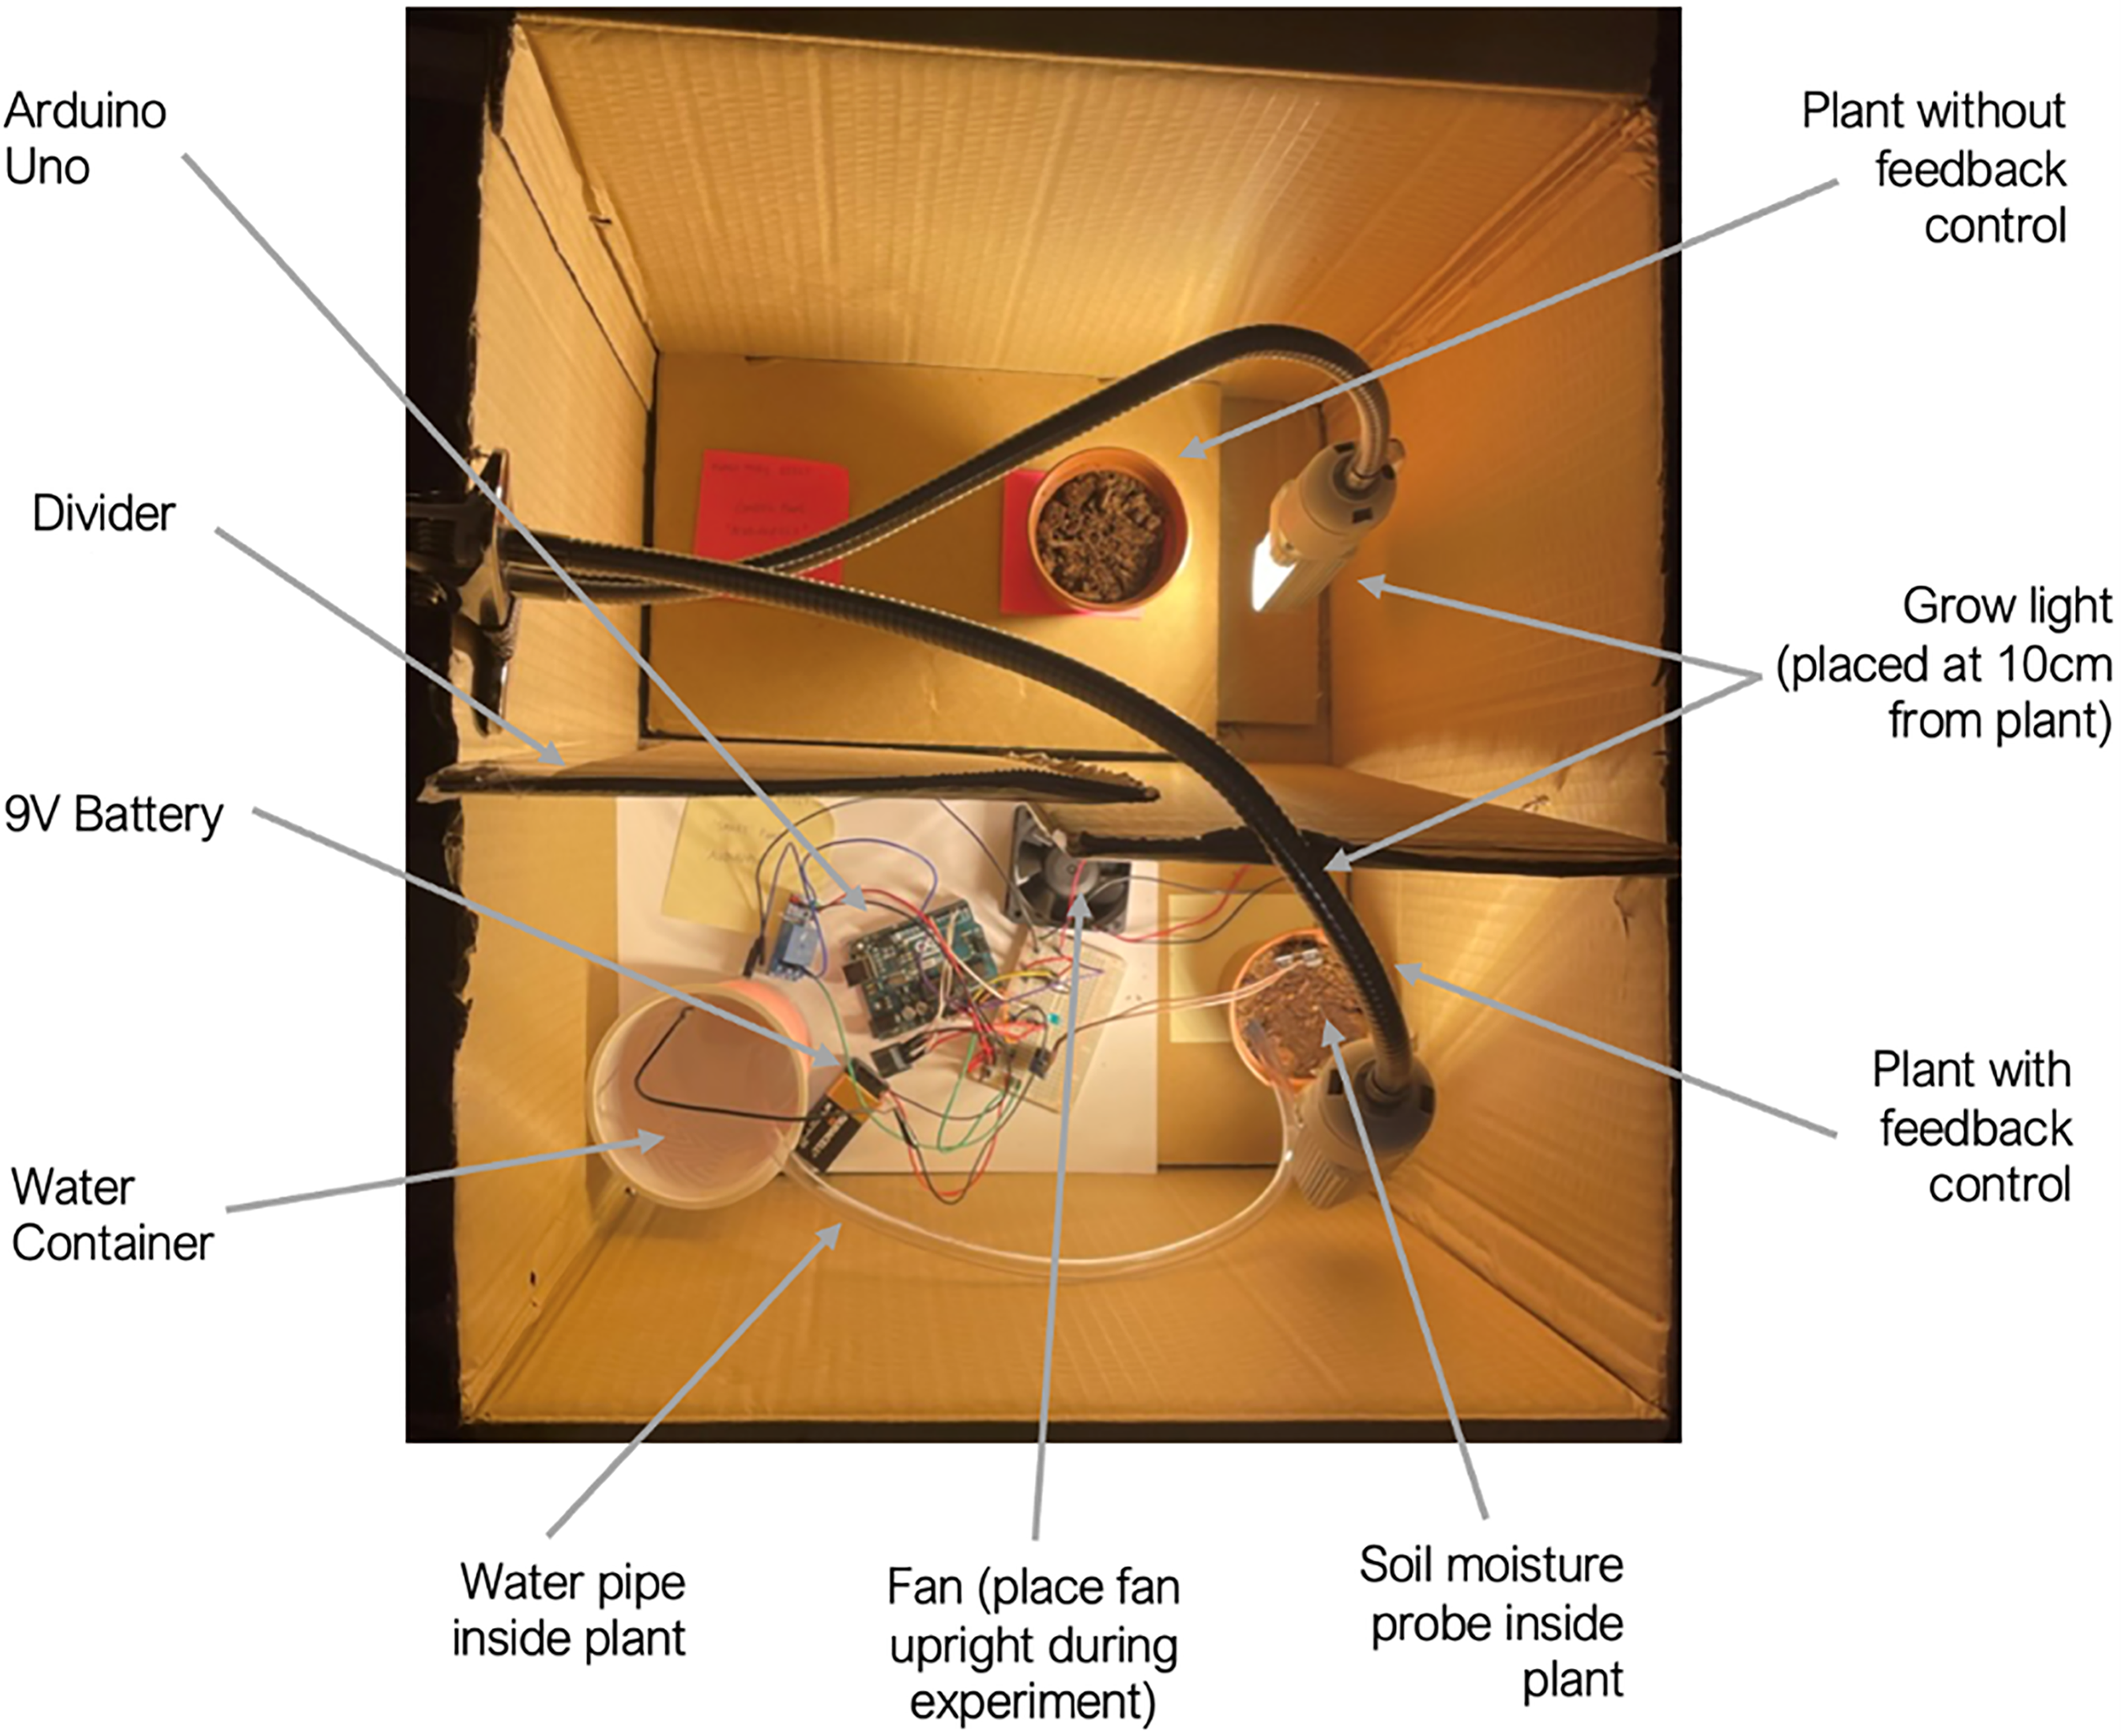
Growth chamber and embedded control setup for smart farming.
Temperature sensor
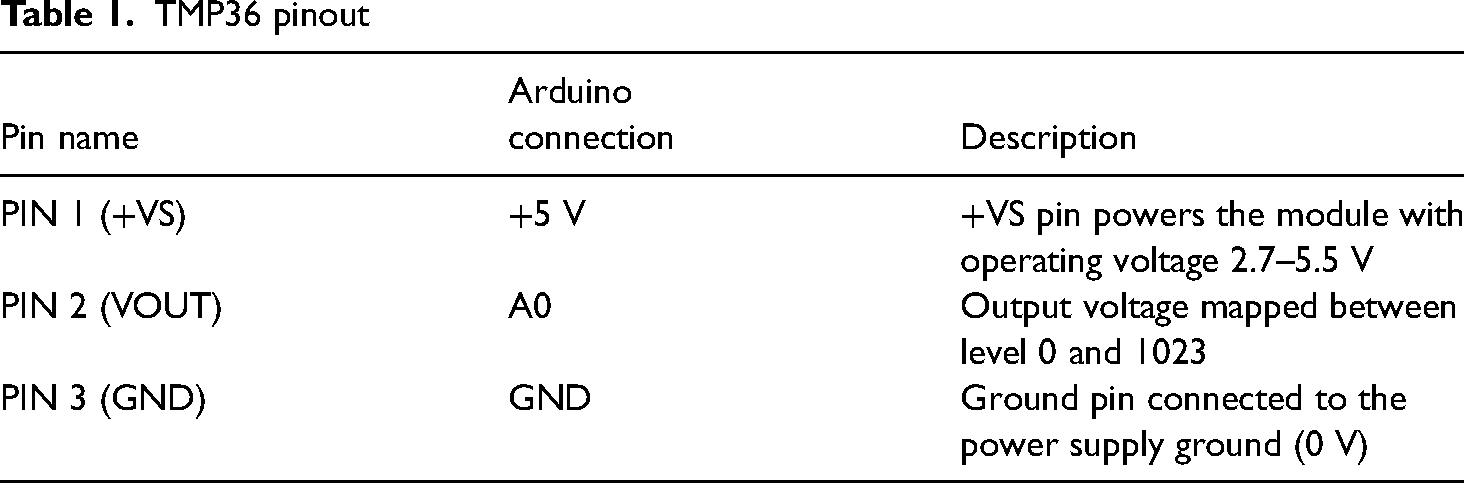
The TMP36 temperature sensor is used in this development. This sensor is a standard sensor that usually is provided with the Arduino Starter Kit. The documentation 20 suggests that this sensor is not weatherproof, so this component would be compromised if it is directly exposed to weather elements. Nevertheless, this sensor is suitable for an indoor experiment. The pinout configuration of the temperature sensor is shown in Table 1.
TMP36 pinout
The output voltage measurement on the pin A0 from the sensor needs to be converted into the temperature value in Celsius (
Arduino Uno yields resolution of 5/1024 (V/level)
The datasheet
20
indicates that the output configuration of 0–1.75 V corresponds to the temperature
The datasheet
20
states that the TMP36 has 10 mV resolution, therefore, multiply the calibrated


The steps above can be described using the following equation: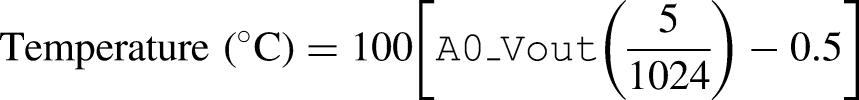
Soil moisture sensor
The moisture sensor used here is the FC-28 Soil Moisture Resistor with LM393 Comparator Chip. An electrical current of 35 mA is sent between each of the electrode probes to measure the soil resistance between them. For the soil with a high water content, there is a higher electrical conductivity and thus a lower resistance to the current flow because water is a good conductor of electricity.
The Ohm’s law, that is,
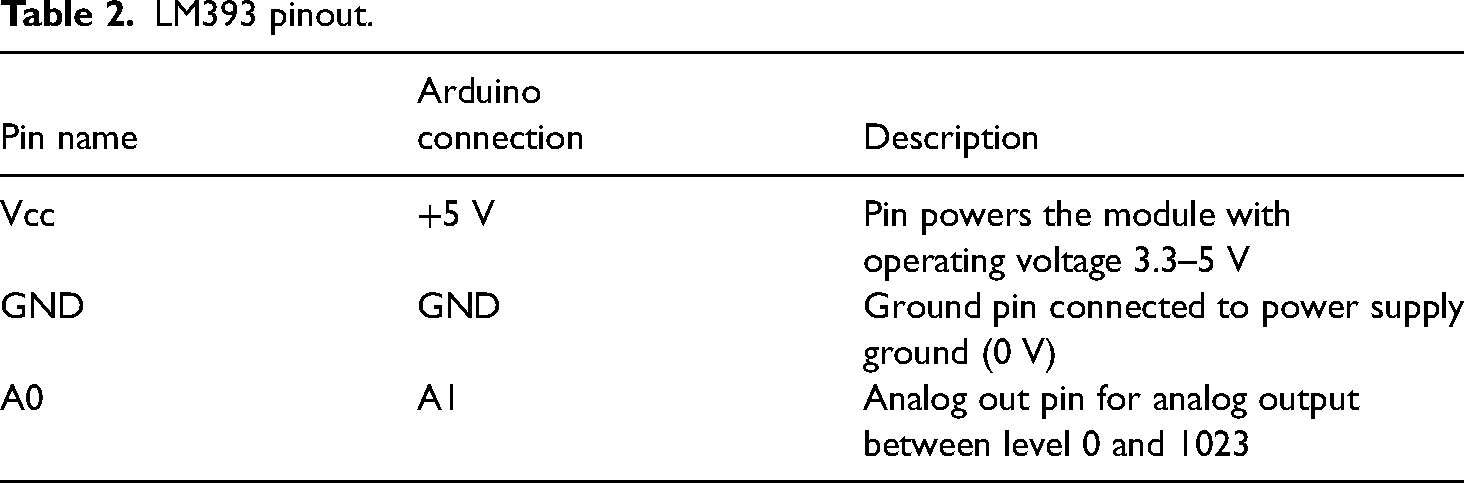
The pinout configuration of soil moisture sensor FC-28 is given in Table 2. The soil moisture sensor is calibrated (0% to 100%) according to its contextual conditions. The calibration procedure can be summarised as follows:
Take the output voltage reading level for completely ‘dry’ (no water in the soil). Take the output voltage reading level for completely ‘wet’ (fully submerged in wet soil). Map the dry and wet readings to 0% and 100%, respectively. Repeat steps 1 to 3 for at least five times and find the respective averages.


LM393 pinout.
In this experiment, the soil used was characterised by a dry soil variable
Electromechanical axial fan
A 12 V, 0.16 A axial fan is used to directly regulate the temperature of the growth chamber. To control the temperature, using a fan is sufficient and no need for a heater, because the temperature of the growth chamber does not go below the room temperature (i.e. between 18
Electromechanical water pump
A submersible 3 V DC water pump is connected to a water pipe tubing (diameter 0.7 cm) to alter the soil moisture content. An external power source (9 V) is also introduced at this stage to remove the dependency on the laptop battery as the actuator primary source of power. Unlike the fan that could be switched on for a full iteration duration (15 min), additional care needs to be taken when switching on the water pump as a mere 3 s of switching on the pump could cause flooding and drowning the plant. The watering increment (the duration for which the pump is switched on), in this case, the ‘0.5 seconds’ could be altered in the future depending on the specific plant or number of plants to be watered at the same time. In addition, a 3-hour iteration is deemed reasonable as one tends to water plants 1 to 2 times a day so collating data for 4 to 8 times per day is reasonable.
In this small-scale project, a 9 V battery was used and it was sufficient to run the system for 16 days to verify the functionalities of the system. If we were to run the system for more than 16 days, we would need to connect the wall wart to the main power supply. However, if the system is to run continuously for a longer time, where no power supply is available around the smart farming area, ideally a solar panel with a battery will be used.
Wiring configuration and Arduino flowchart
The wiring diagram of the connection from the Arduino Uno to the other components, that is, the sensors, actuators (the two electromechanical devices), the Wi-Fi module, and the power source, is shown in Figure 4. The Arduino flowcharts describing the algorithms to turn on the fan and water pump are shown in Figure 5.
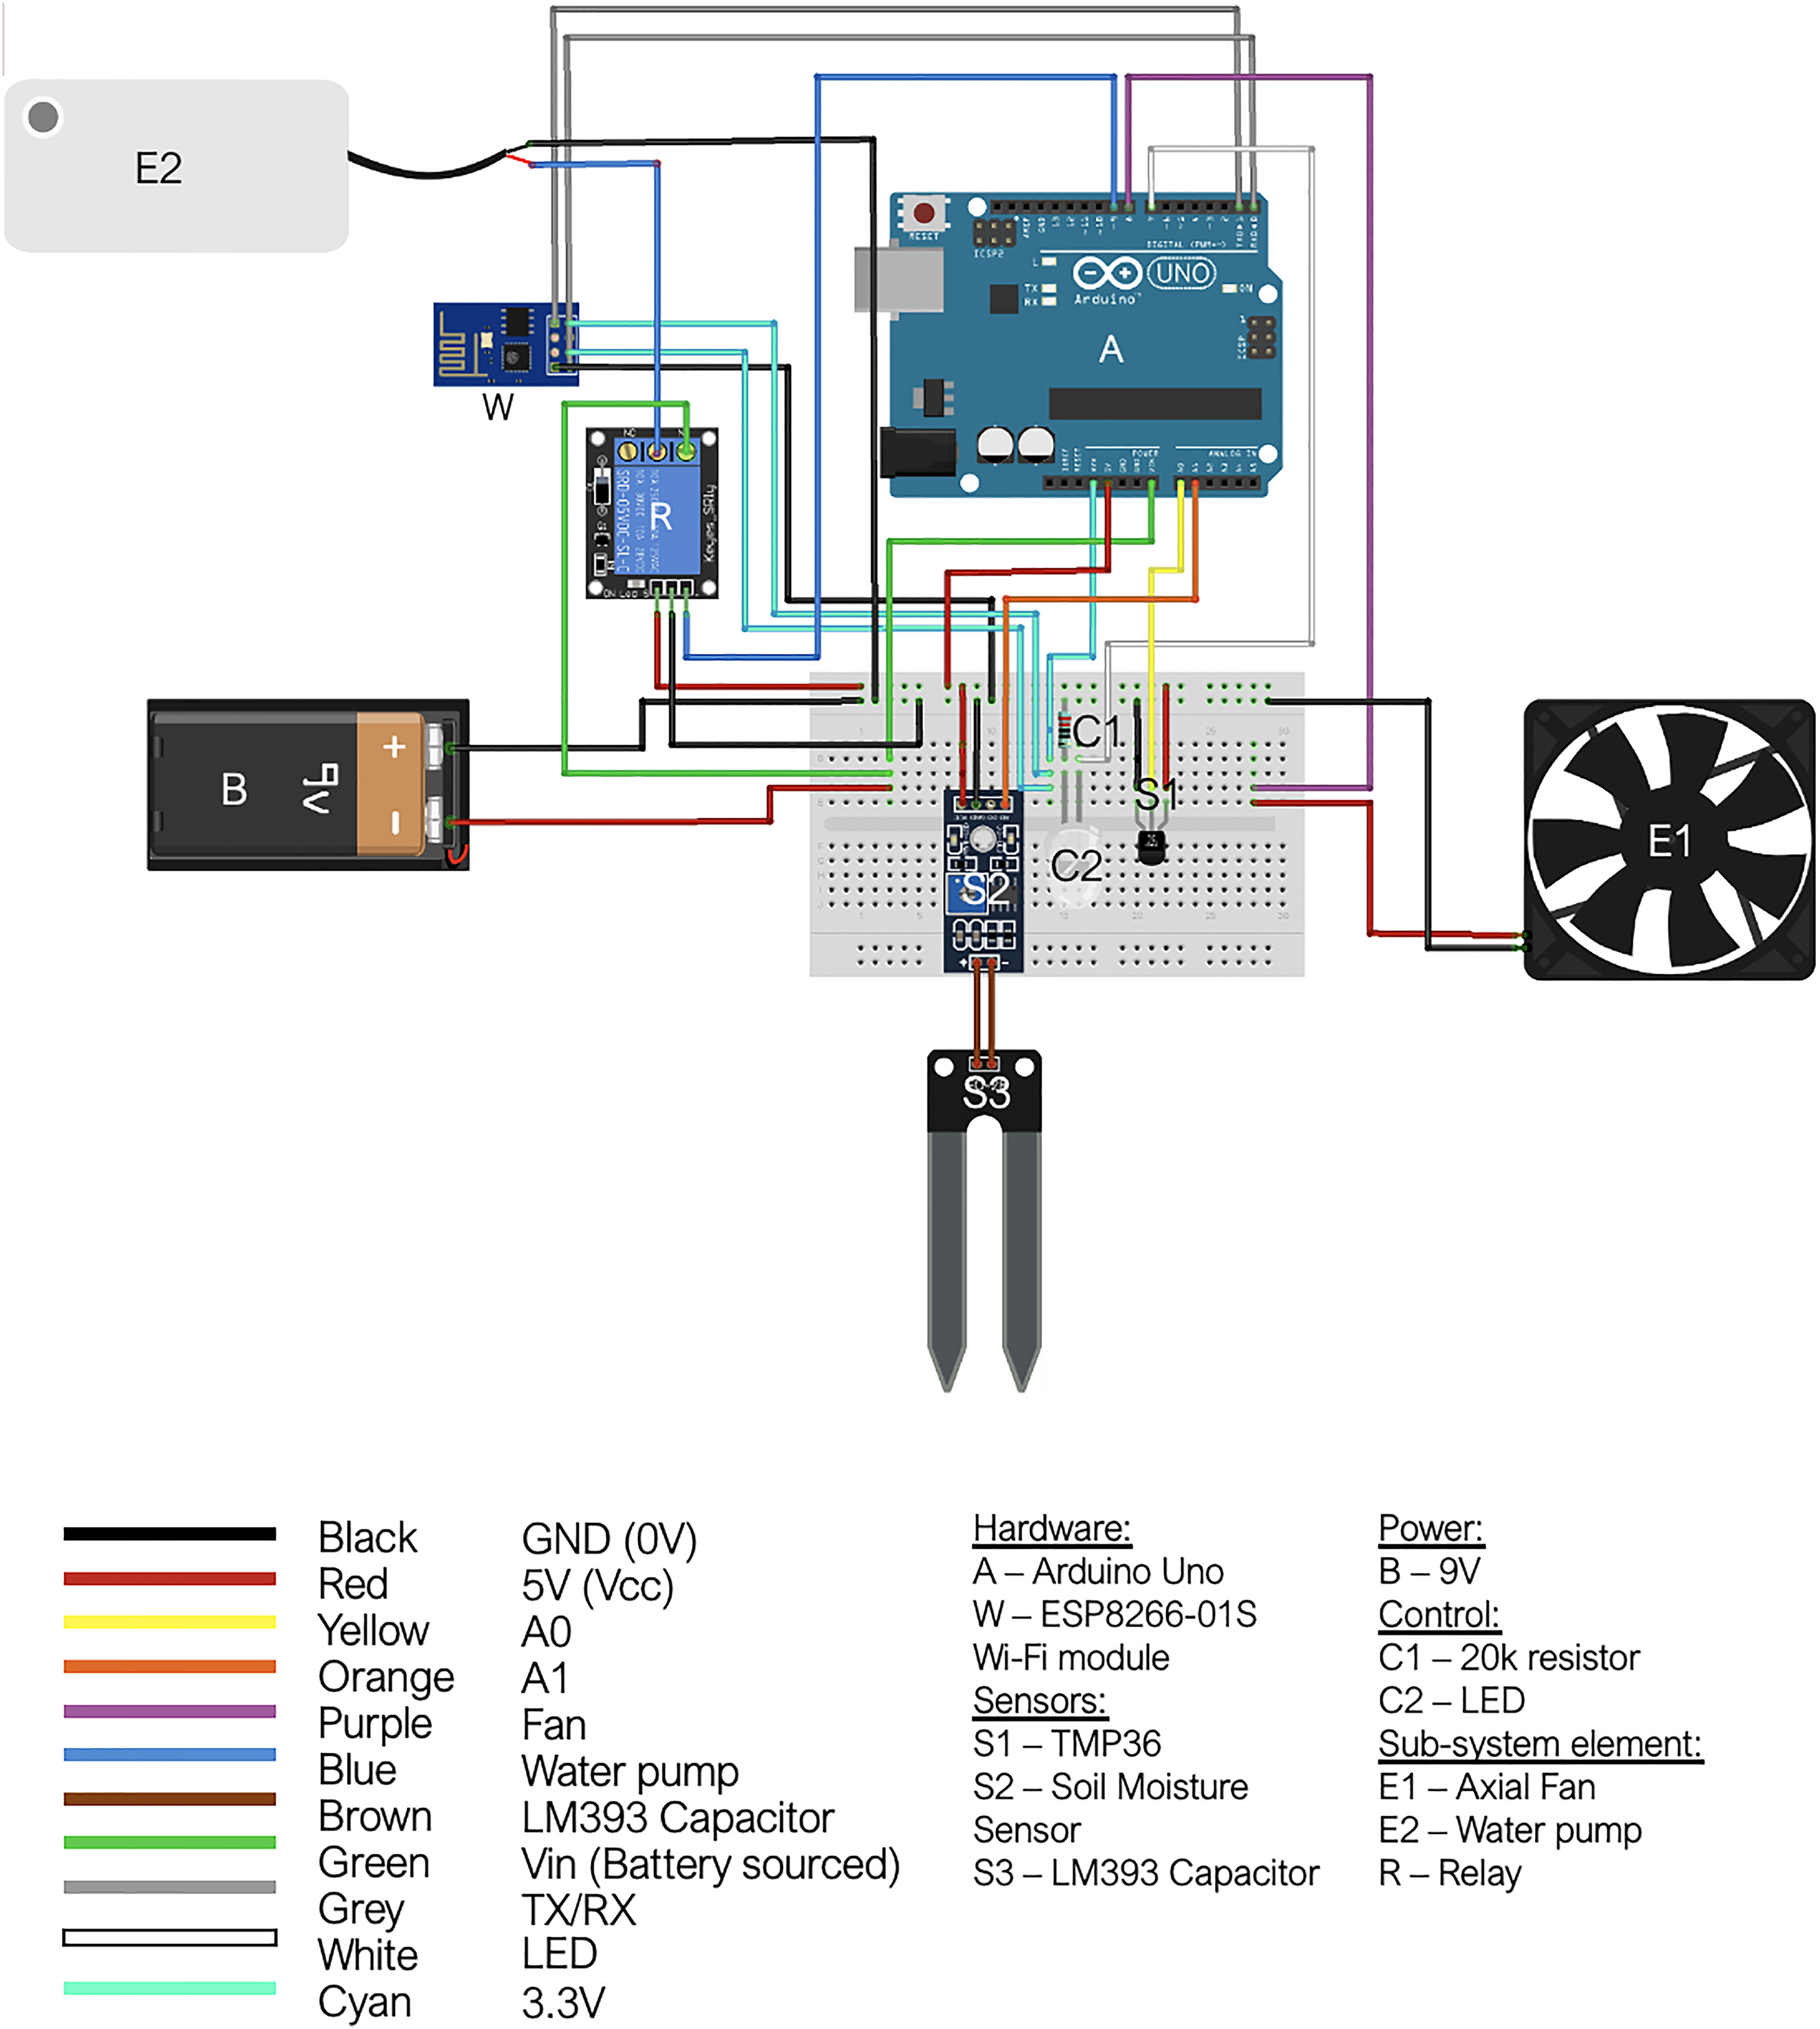
Hardware circuit diagram for the embedded control of two electromechanical devices, i.e., fan and water pump.
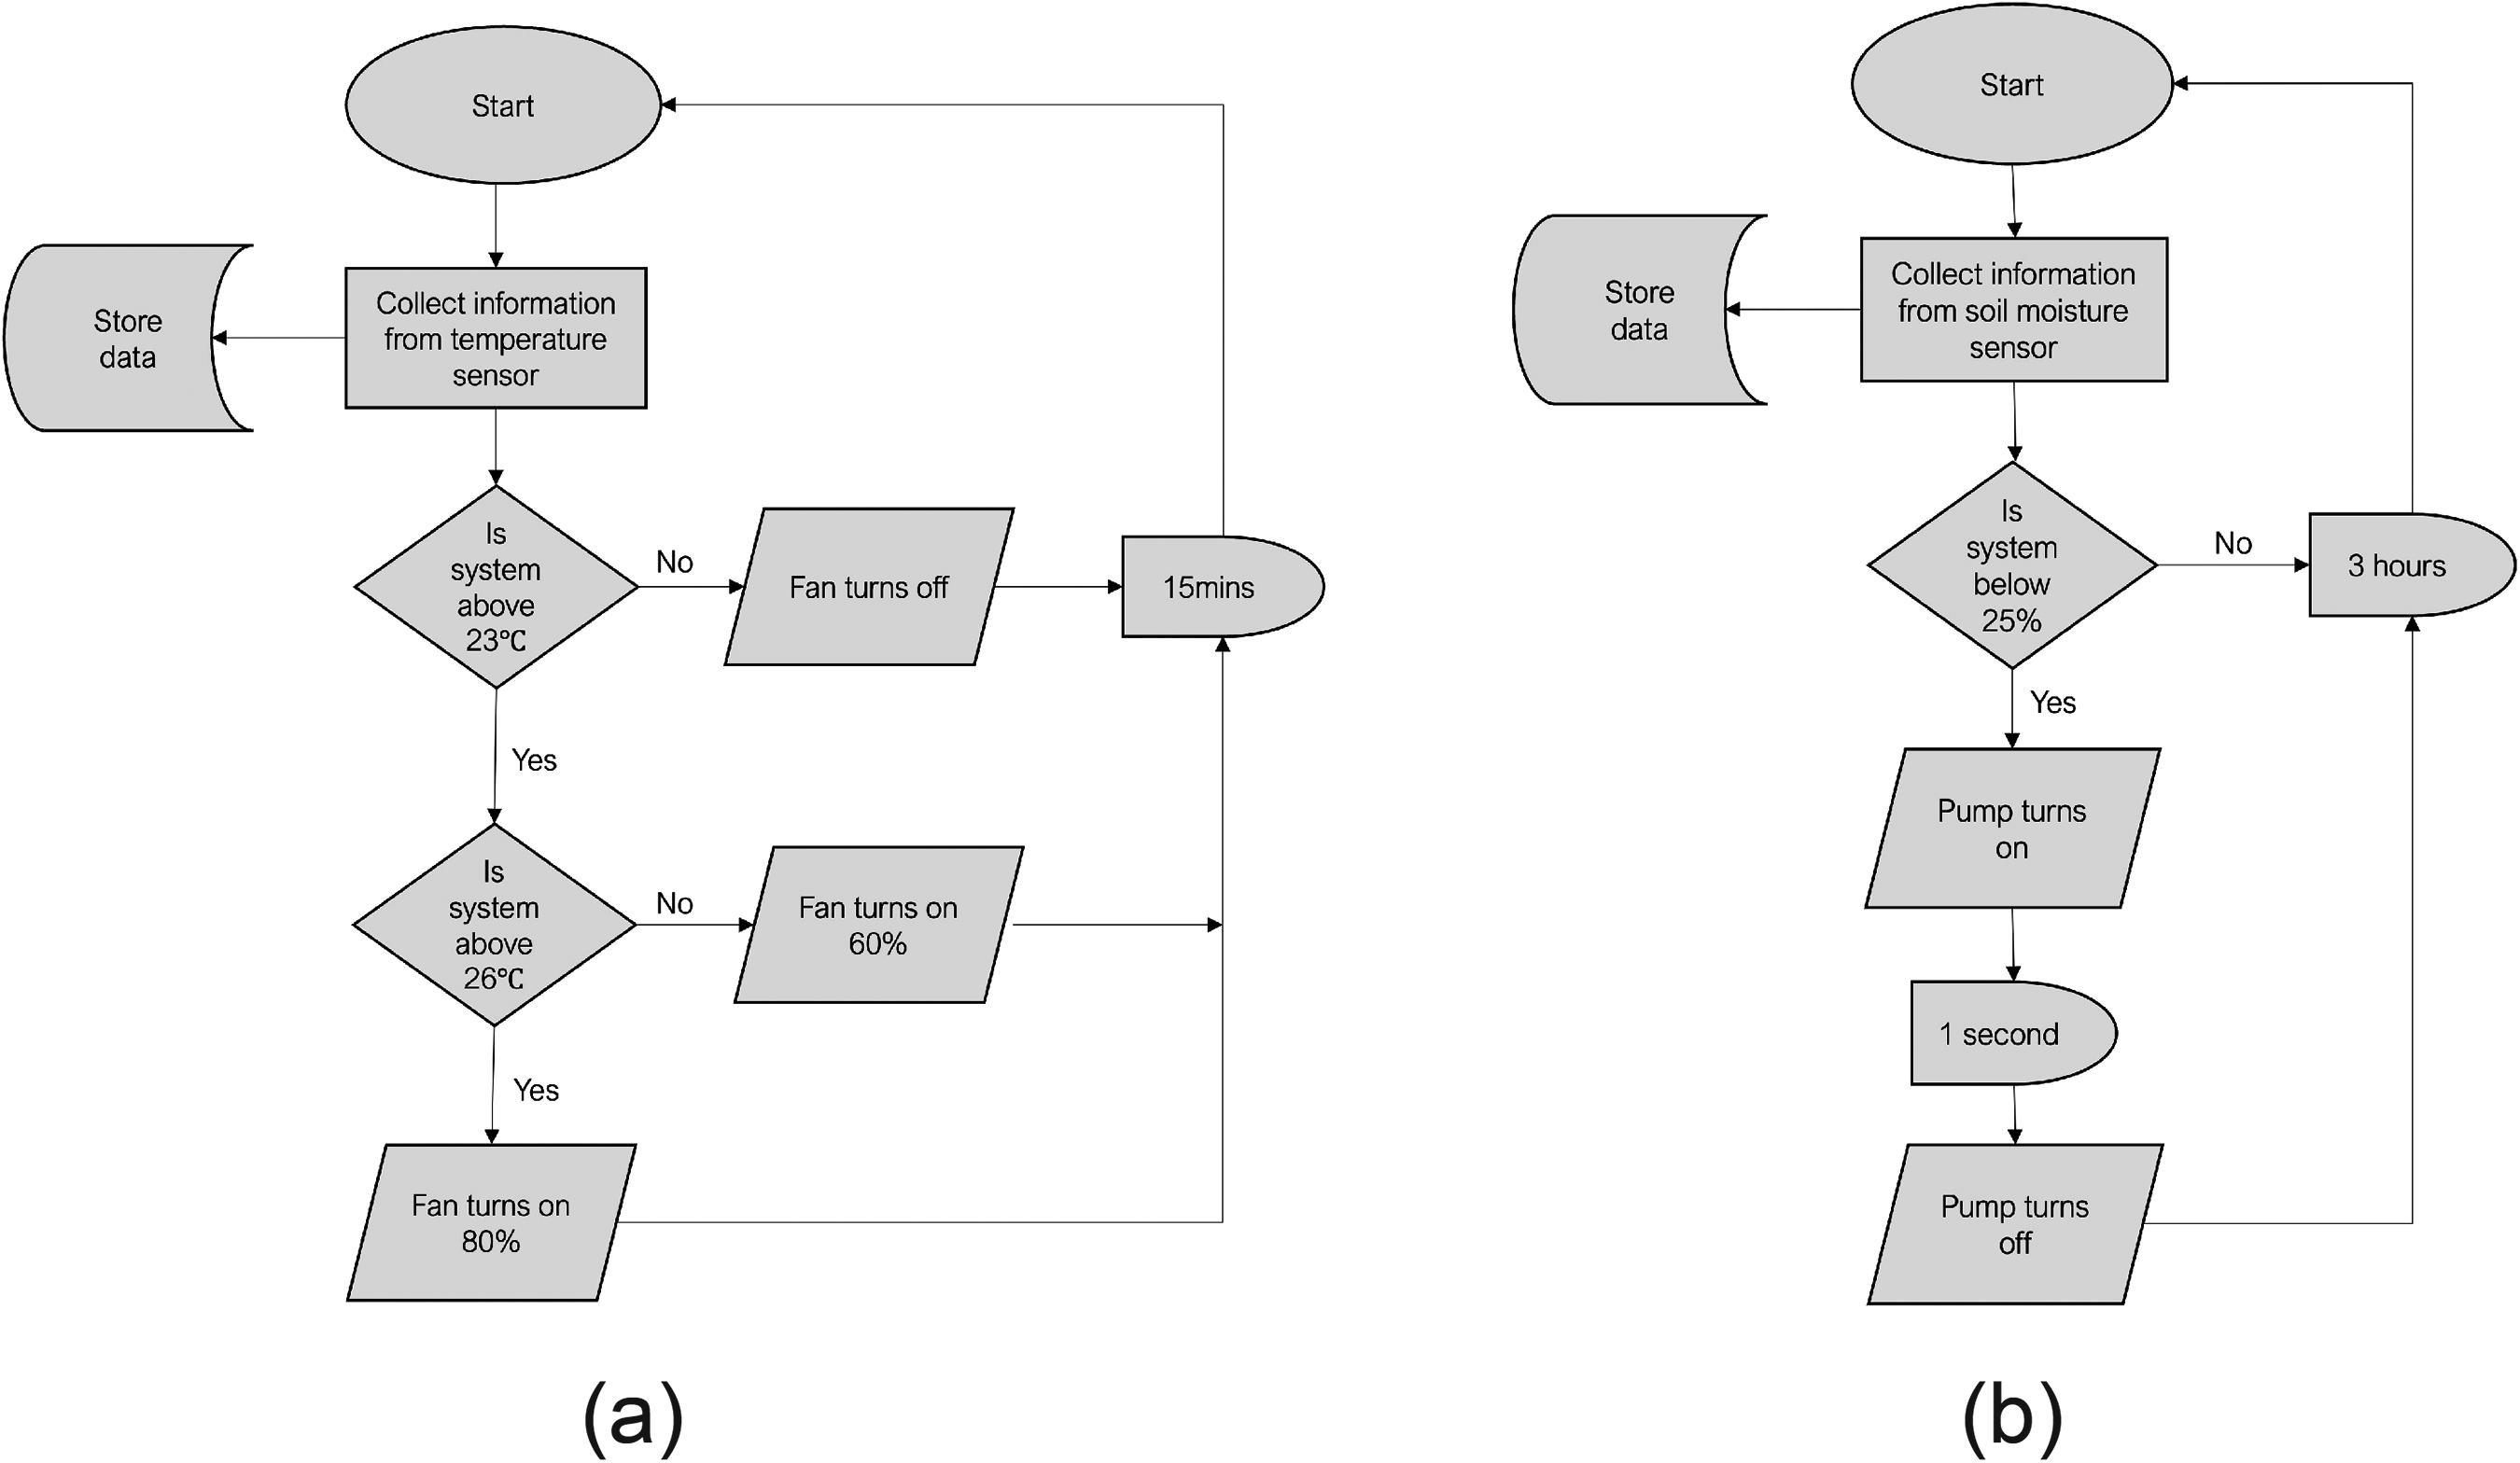
Flowchart for the control and operation of (a) the fan and (b) the water pump.
Blynk web and mobile app interfaces design
To set up the Blynk networking for a smart farming app, the Blynk library needs to be configured to connect to a local access point using the user’s specific SSID and password for their Wi-Fi. Furthermore, in order to ensure secure communication between the app and the connected devices within the smart farming system, it is necessary to generate Blynk security credentials such as the ’Auth Token’ from the account area.
Blynk IoT is a commercial app that offers a comprehensive suite of tools, protocols, and integrations, enabling farmers to leverage its platform for efficient device management, real-time data monitoring, and seamless connectivity, thus driving smart farming innovation within the IoT ecosystem.
Blynk primarily uses the Internet Protocol (IP) for networking, allowing communication over the Internet. It relies on the Transmission Control Protocol (TCP) to establish connections between the Blynk app and the Arduino or other hardware devices. TCP provides a reliable and ordered data transmission between the Blynk app and the hardware device, ensuring that data packets are delivered correctly and in the correct order.
Transmitting the measured data from the smart farming system to a mobile app interface will help users make more informed decisions and respond more quickly to system changes as all parameters are logged in a useful form. The two key functions of the mobile app are to monitor and control the smart farm measured variables. The control function is done by sending a command to activate the two actuators in the system. These two functions can be found on the
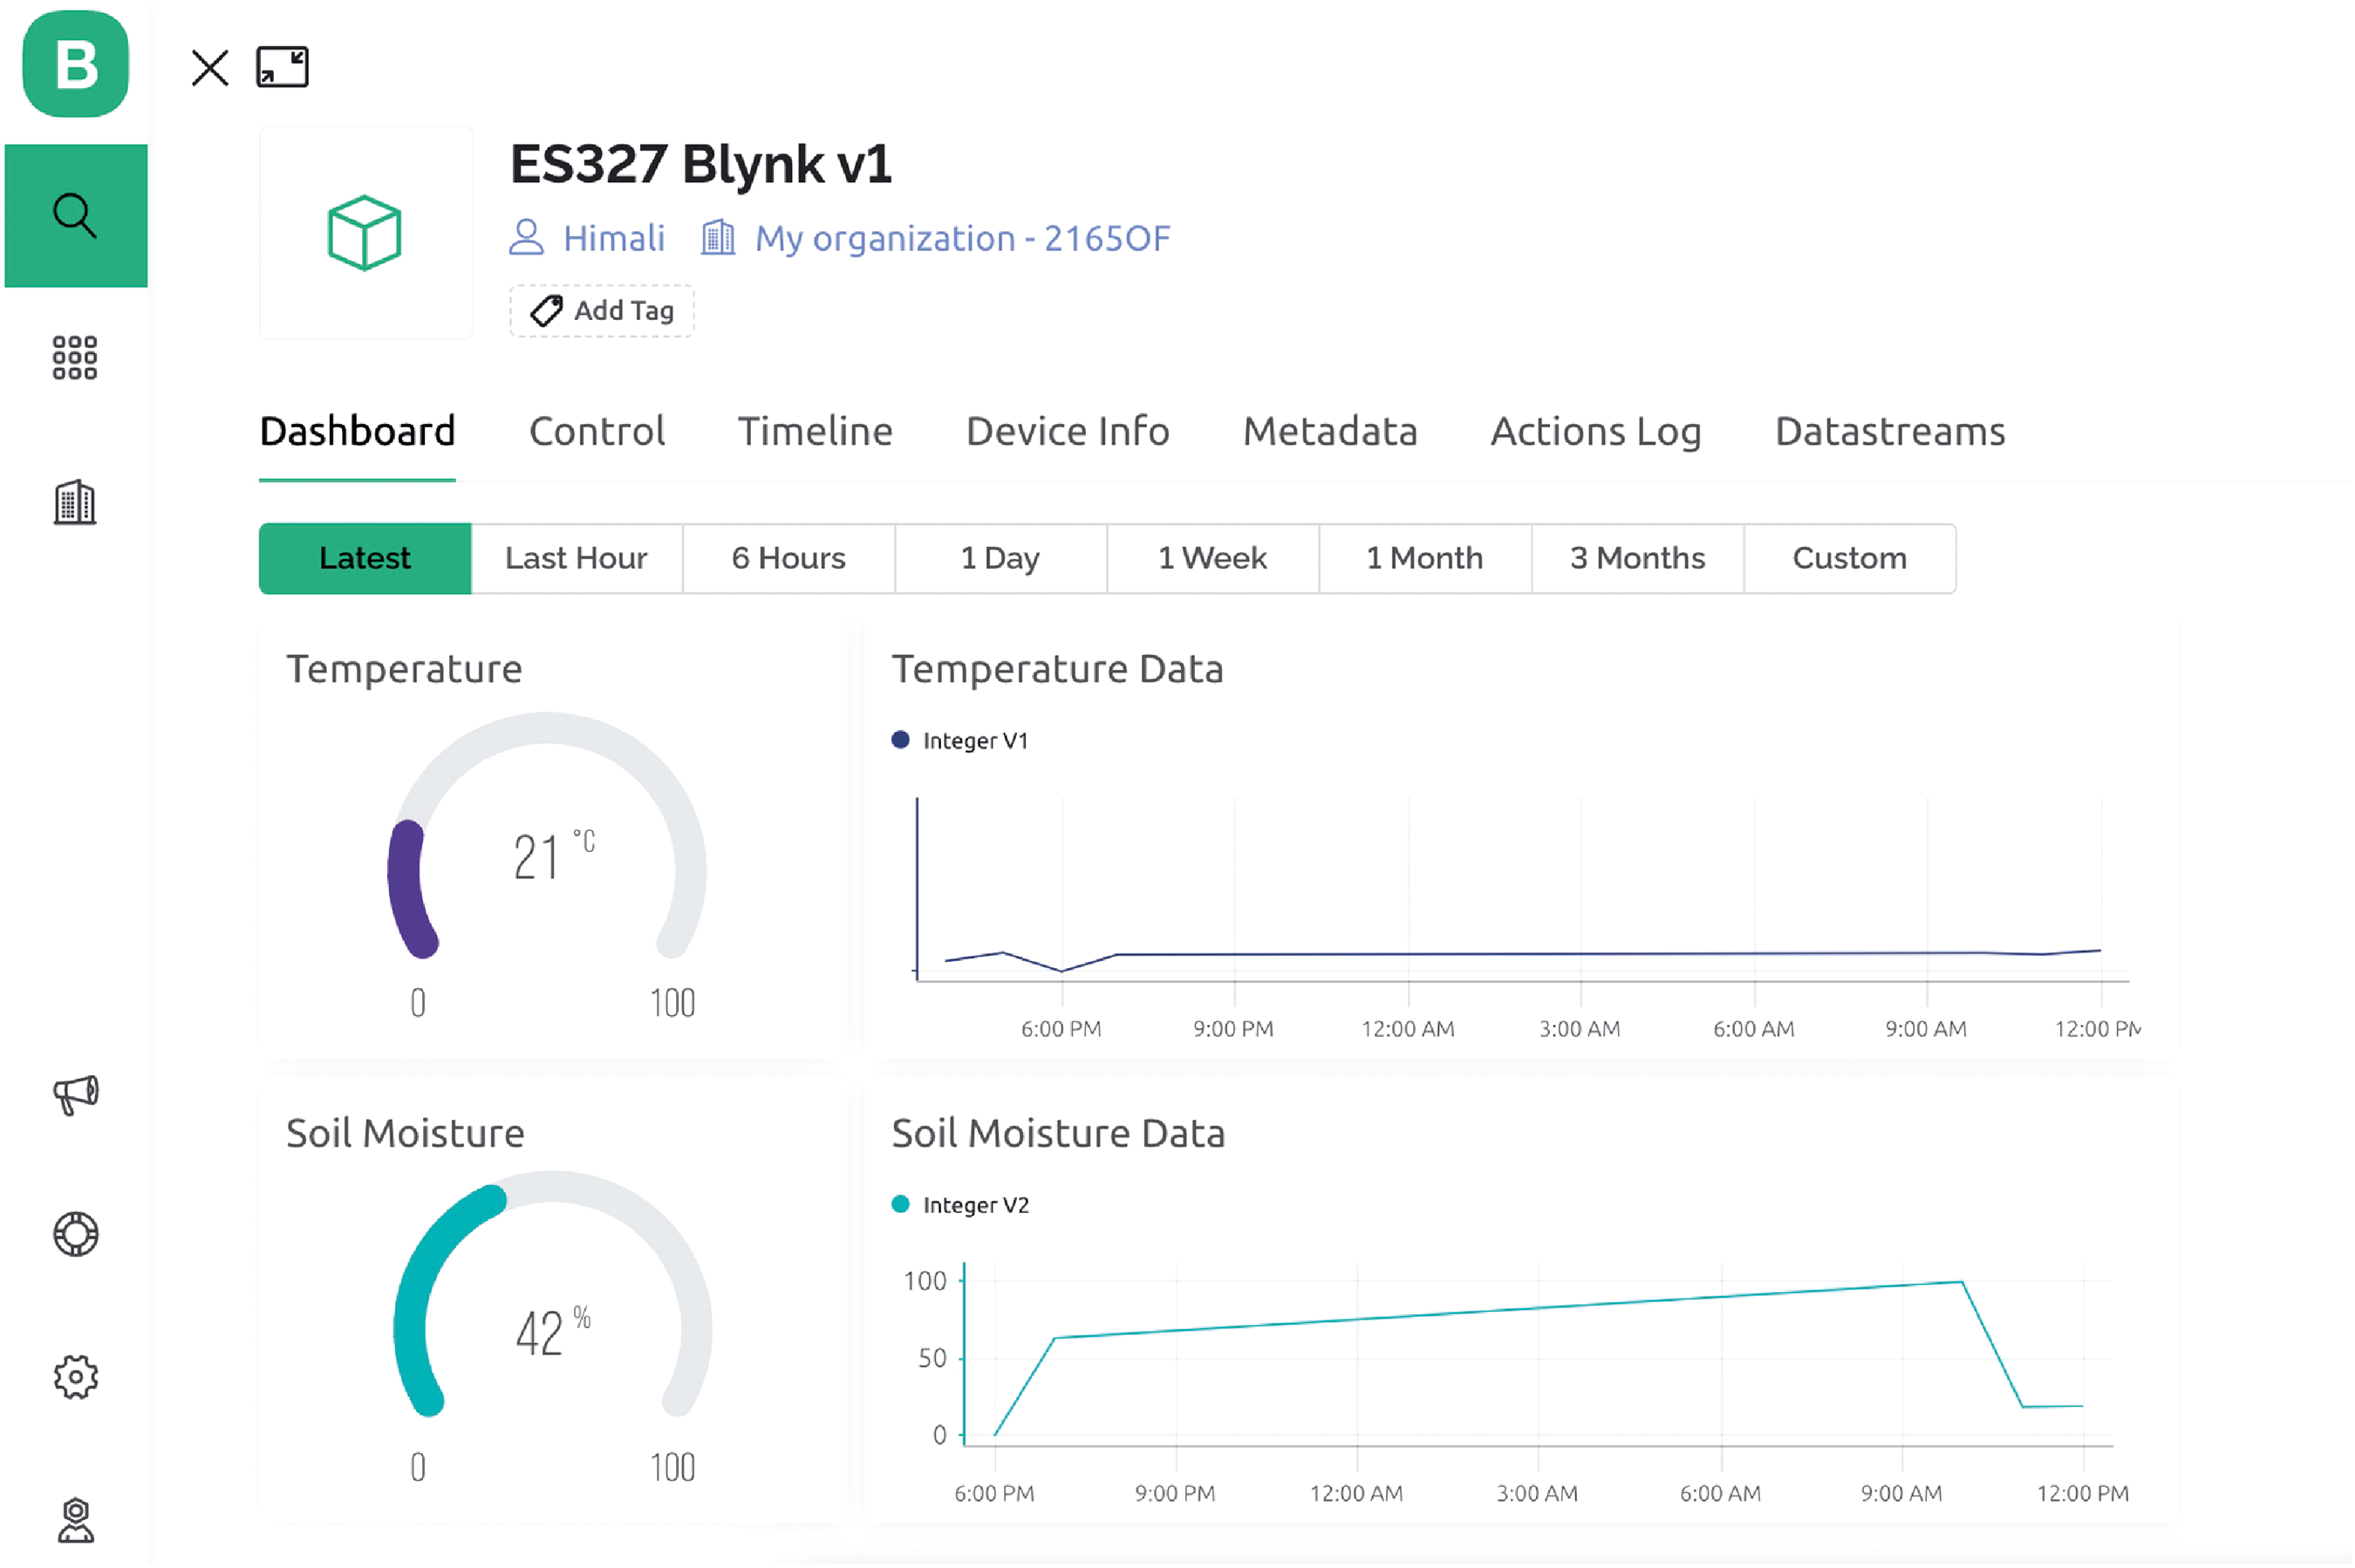
A screenshot of web interface
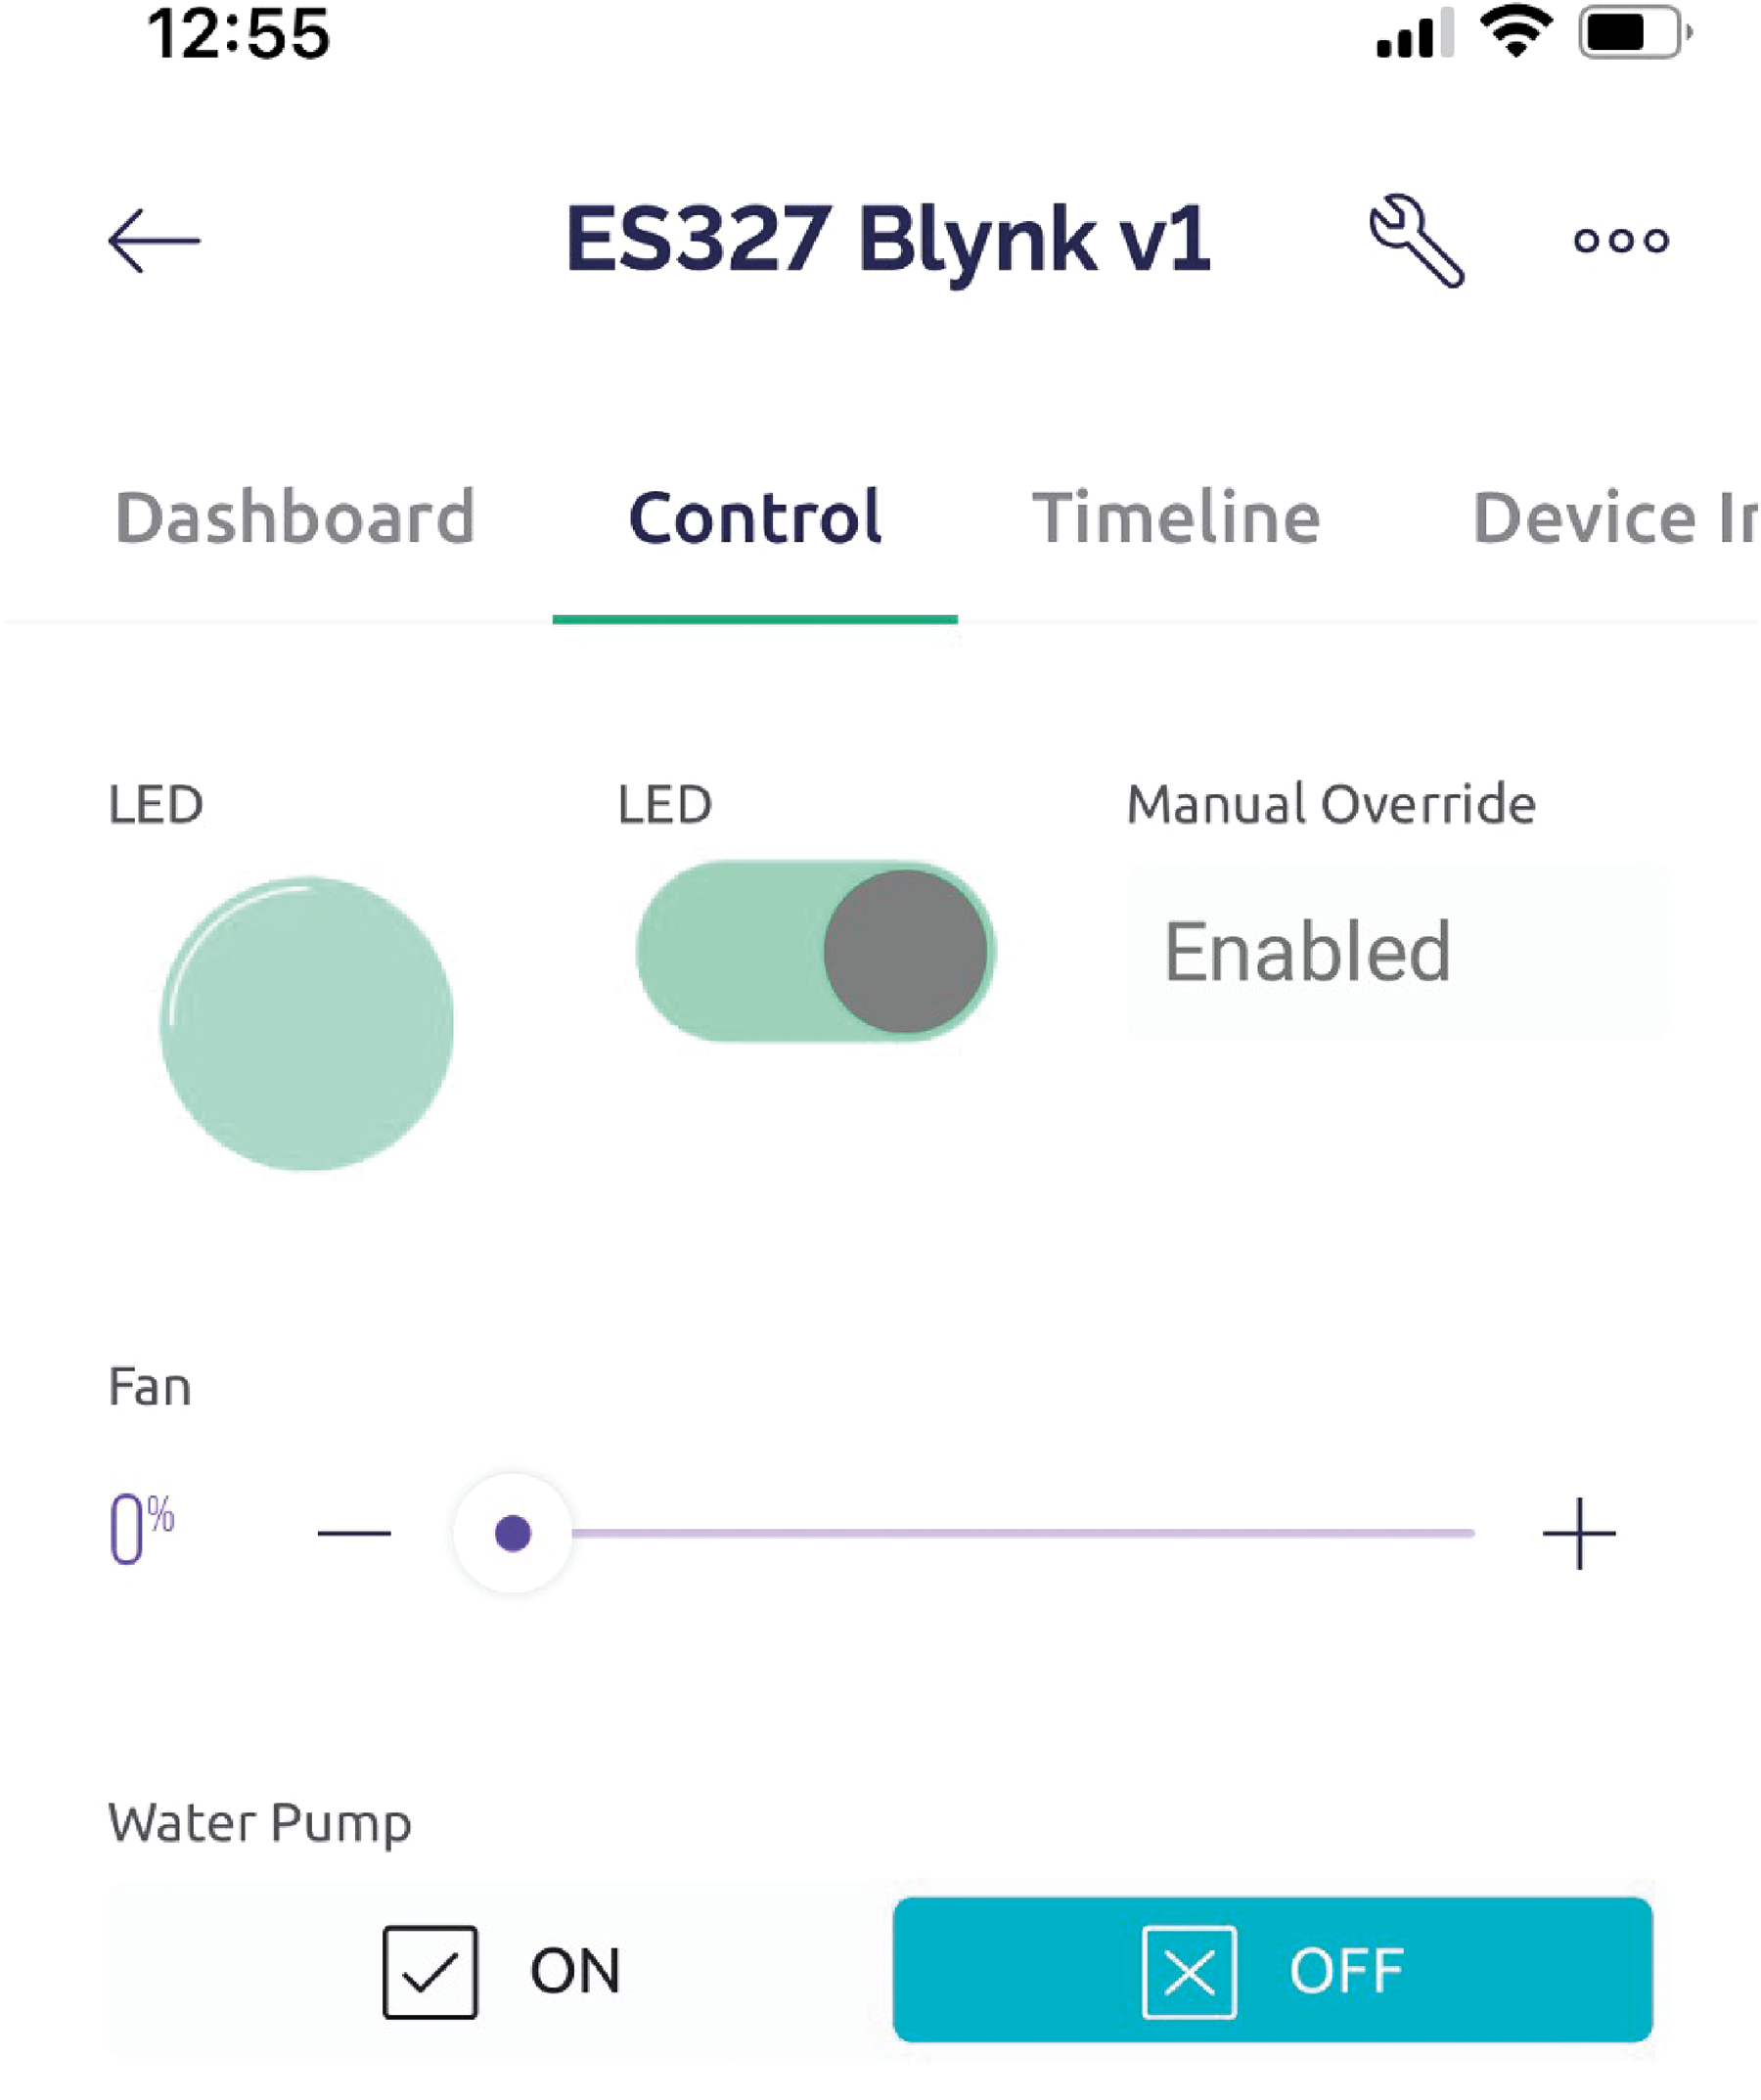
A screenshot of App interface
Interface design
Students could introduce different user interfaces and visualisation elements such as dials and graphs from the Blynk Widget Box to help users interpret the data generated by the system by converting it into a graphical and summarised form. Once the design has been completed, each element can be individually configured by adding script so the graphic can achieve real-time interaction and analytics generated by the Arduino.
A ‘virtual pin’ can be used to direct relevant variables outputs from Arduino to Blynk. This virtual pin will be used as a datastream storage that multiple elements can utilise; for example, the temperature sensor will be fed V1 (virtual pin) datastream corresponding to 
Dashboard
The
Control
The
Students can actively consider the system’s practical aspects and implement them into the app design as well. For example, the user could add elements to the app to check for continuous wireless connection between itself and the Arduino through a simple toggle to the LED on/off switch. In our development, the LED C2 in Figure 4 serves this purpose.
Results and discussion
Experimental setup
To test the functionality of the smart farming setup and also the app, an experiment was conducted. For the experiment, two pots of garden cress (Lepidium sativum) and the hardware components were placed in the growth chamber following Figure 3. The descriptions of the two plants under consideration are given below:
Plant 1: The temperature and soil moisture were regulated to optimal conditions as previously outlined in the growth chamber design section above. Plant 2: The temperature was regulated at room temperature, which lied within the healthy range. This setting was to ensure that there was no risk of a preceding high temperature, which may cause the plant enzymes to denature, and no risk of photosynthesis was prevented from taking place. Plant 2 was manually watered twice a day to the extent deemed necessary.
Measurements of the temperature were acquired every 15 min, while the measurements for the soil moisture were acquired every 3 h as discussed above. A simple on/off control was used to switch on and off the two electromechanical devices. The fan would turn on when the chamber temperature was higher than the upper limit (> 23
Hypothesis
The experiment was conducted to demonstrate the effectiveness of the deployment of the embedded control of the electromechanical devices. From this experiment, students can be expected to form the following hypothesis.
Students can address the hypothesis using both qualitative and quantitative perspectives to ensure a conclusive justification that could enhance the reliability of the results.
Qualitative results
An expected outcome of this experiment was shown in Figure 8. The experiment was conducted over a 16-day lifecycle (i.e. when the cress should be ready for harvesting according to the seedling package instructions). Plant 1 clearly showed better qualitative growth in terms of the number of germinated (successful sprouting of seeds 22 ) seedlings and healthier leaf characteristics compared to Plant 2. It was important to note that Plant 2 could still reach further growth however, this was beyond the considered lifecycle range. For students to relate these results to actual practice, in the context of conventional farming practices, Plant 2 represents a typical growth rate using traditional farming methods, while Plant 1 represents the accelerated growth rate with higher yield in terms of the lifecycle when employing feedback control. The major difference in yield production between the plants at the end of the defined lifecycle can provide justification for the significance of embedded control of electromechanical devices for improved farming.
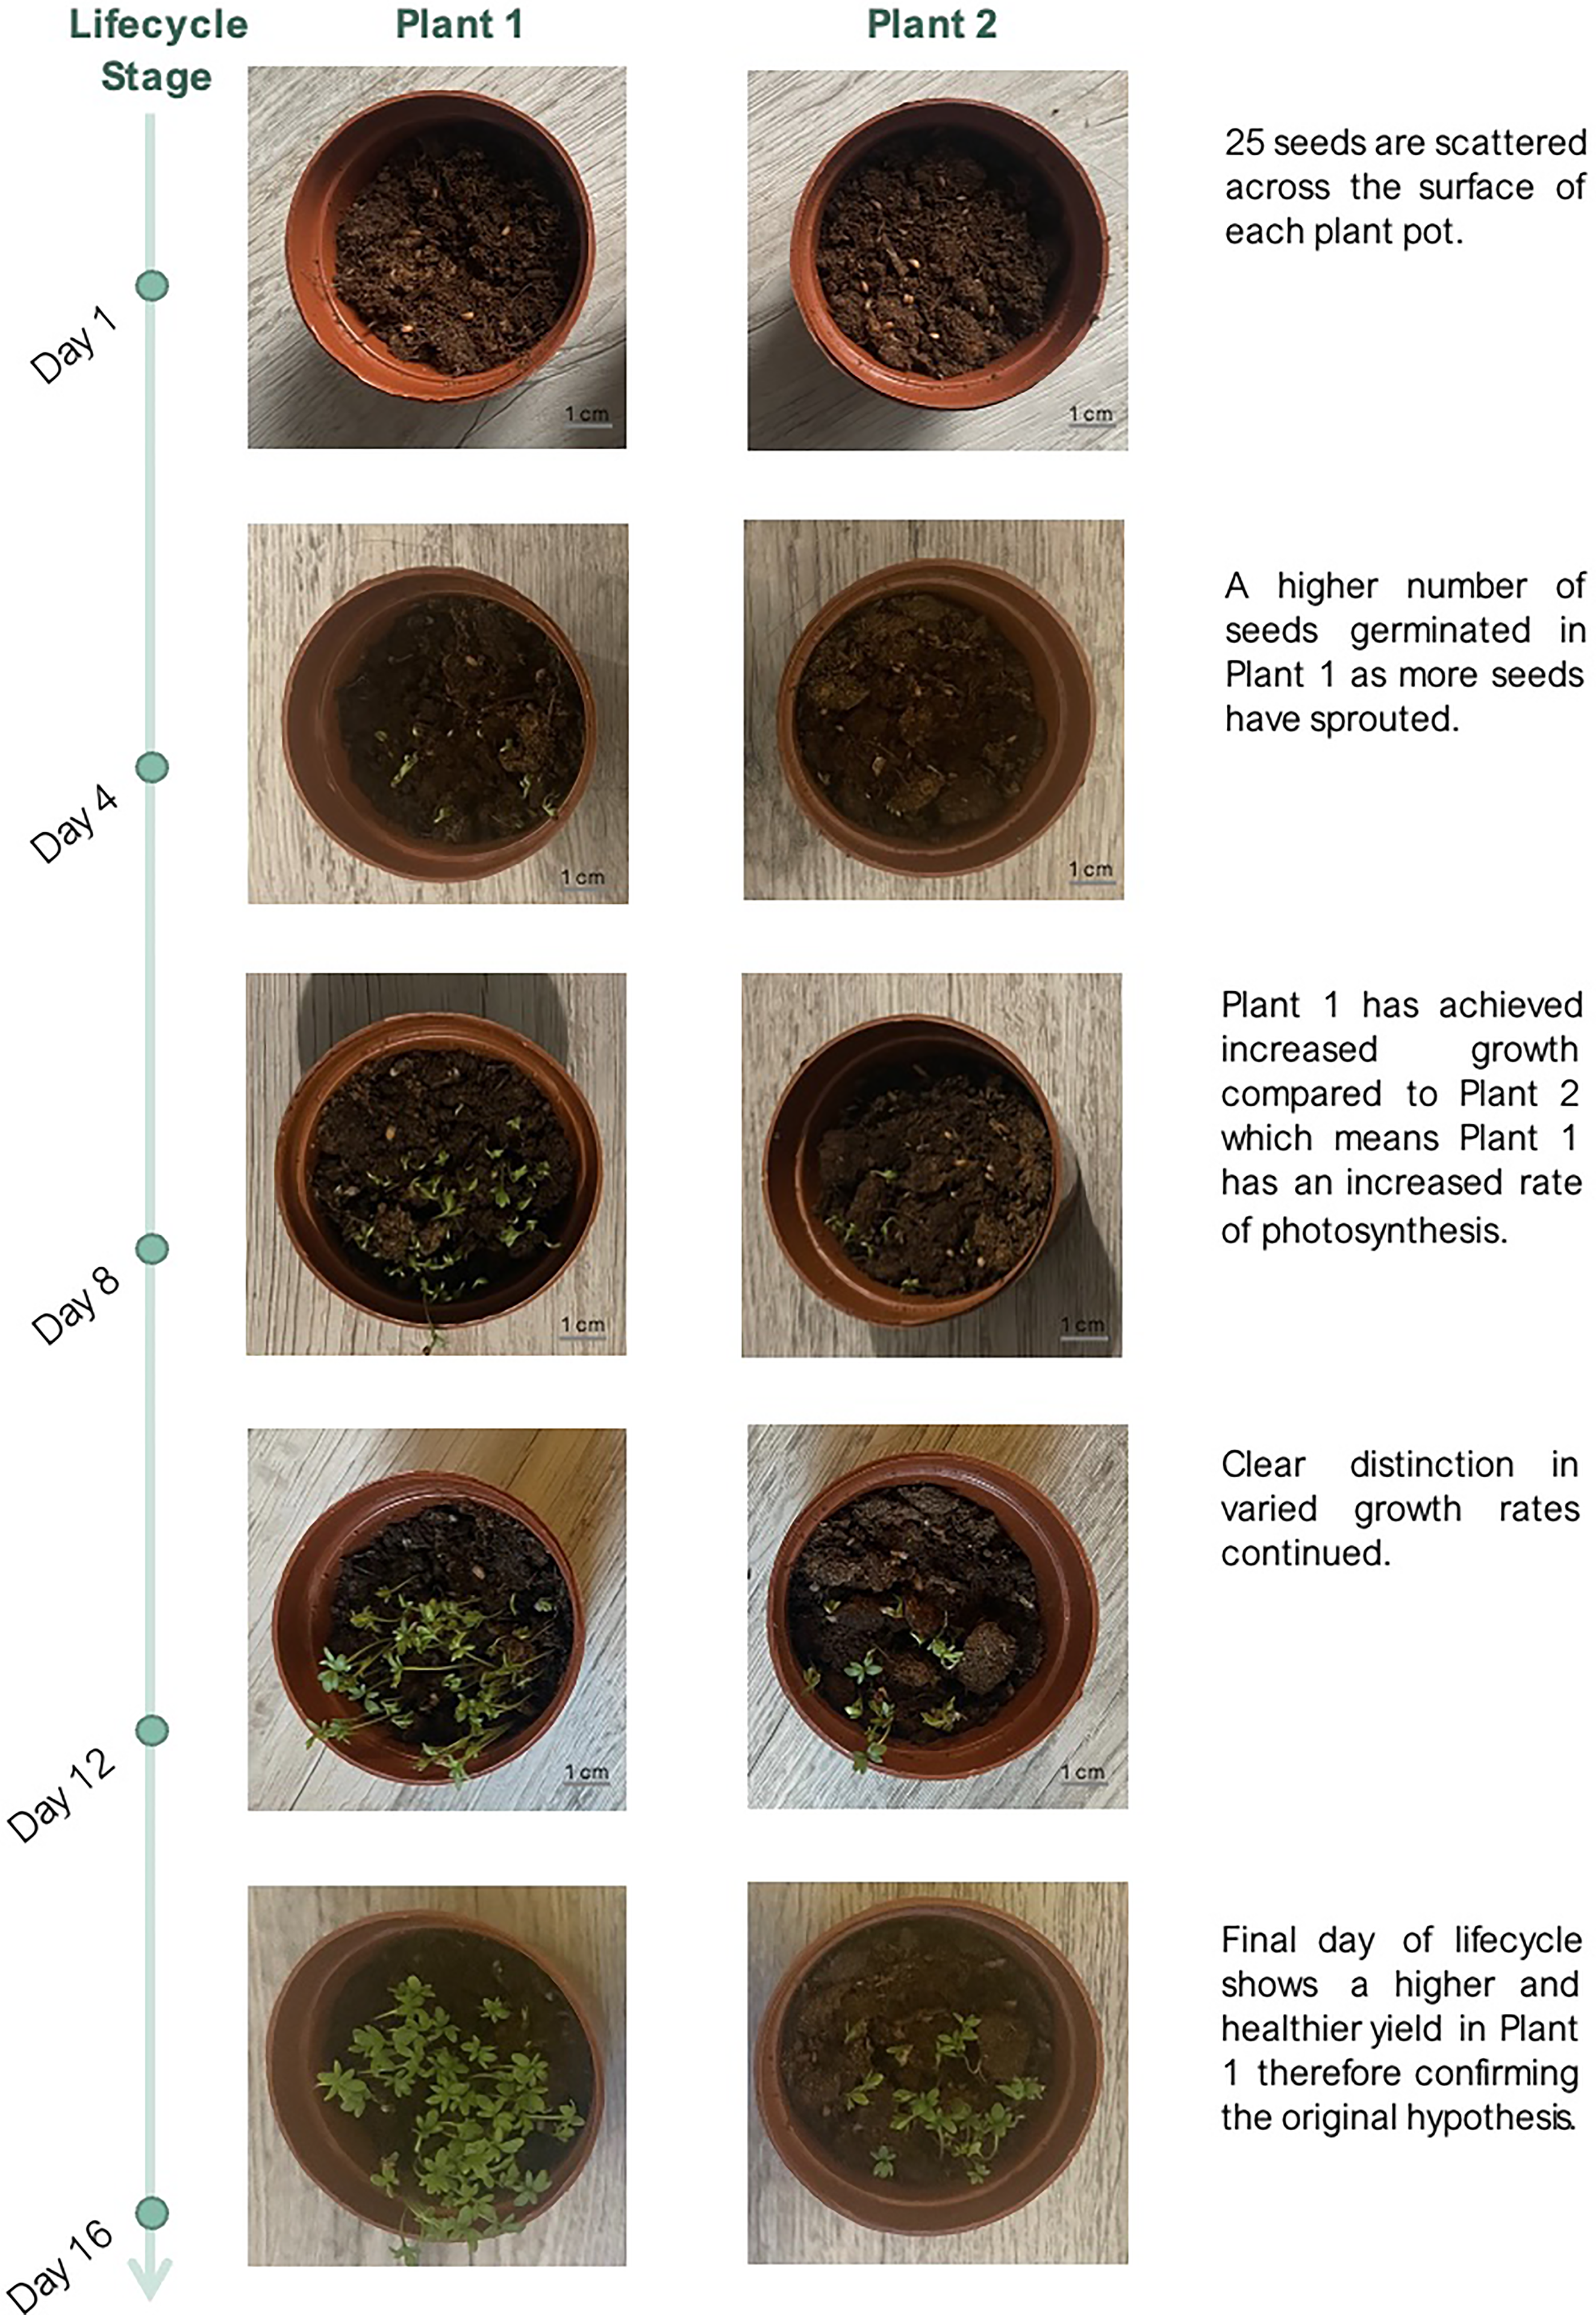
Lifecycle stage of plant grown under two different conditions. Plant 1 and Plant 2 are grown with and without feedback control deployment, respectively.
Quantitative results
While qualitative results are a good indicator of plant productivity, students should also learn to analyse quantitative results. Students can learn to decide on which important metrics that can be used to quantify the results. Here, the number of successful germination, stem length, leaf width and number of leaves bloomed measured at day 16 can be used as the quantitative metrics.
Plant 1 has a 92% germination success (23/25), whereas Plant 2 had a 64% germination success (16/25). The averages of the other quantitative metrics are calculated based on the number of germinated seeds and they are summarised in Table 3.
Results summary of the quantitative metrics used to analyse plant growth.
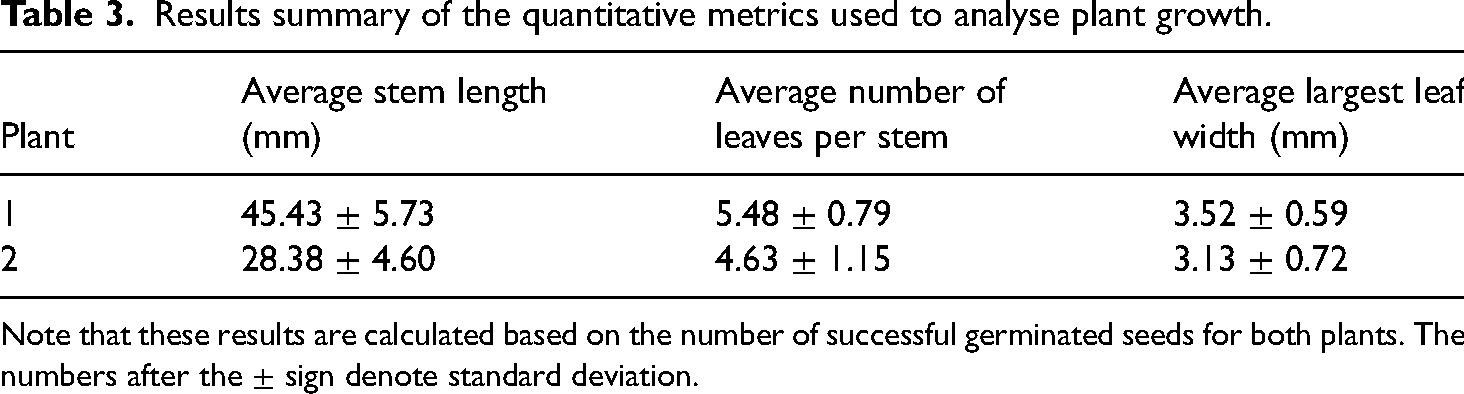
Note that these results are calculated based on the number of successful germinated seeds for both plants. The numbers after the
Students can be encouraged to present the results in Table 3 in a graphical manner. Given the measurements were done based on the average of successfully germinated seeds with an error bar, the most suitable graphic representation would be the bar graph. An example of the bar graphs depiction is shown in Figure 9. These bar graphs enable clear visual comparison that Plant 1 appeared to outperform Plant 2 in all three metrics indicating that better growth is achieved when the important growth factors such as temperature and soil moisture 23 are regulated by the embedded controlled system but a statistical test was needed to accept or reject the hypothesis.
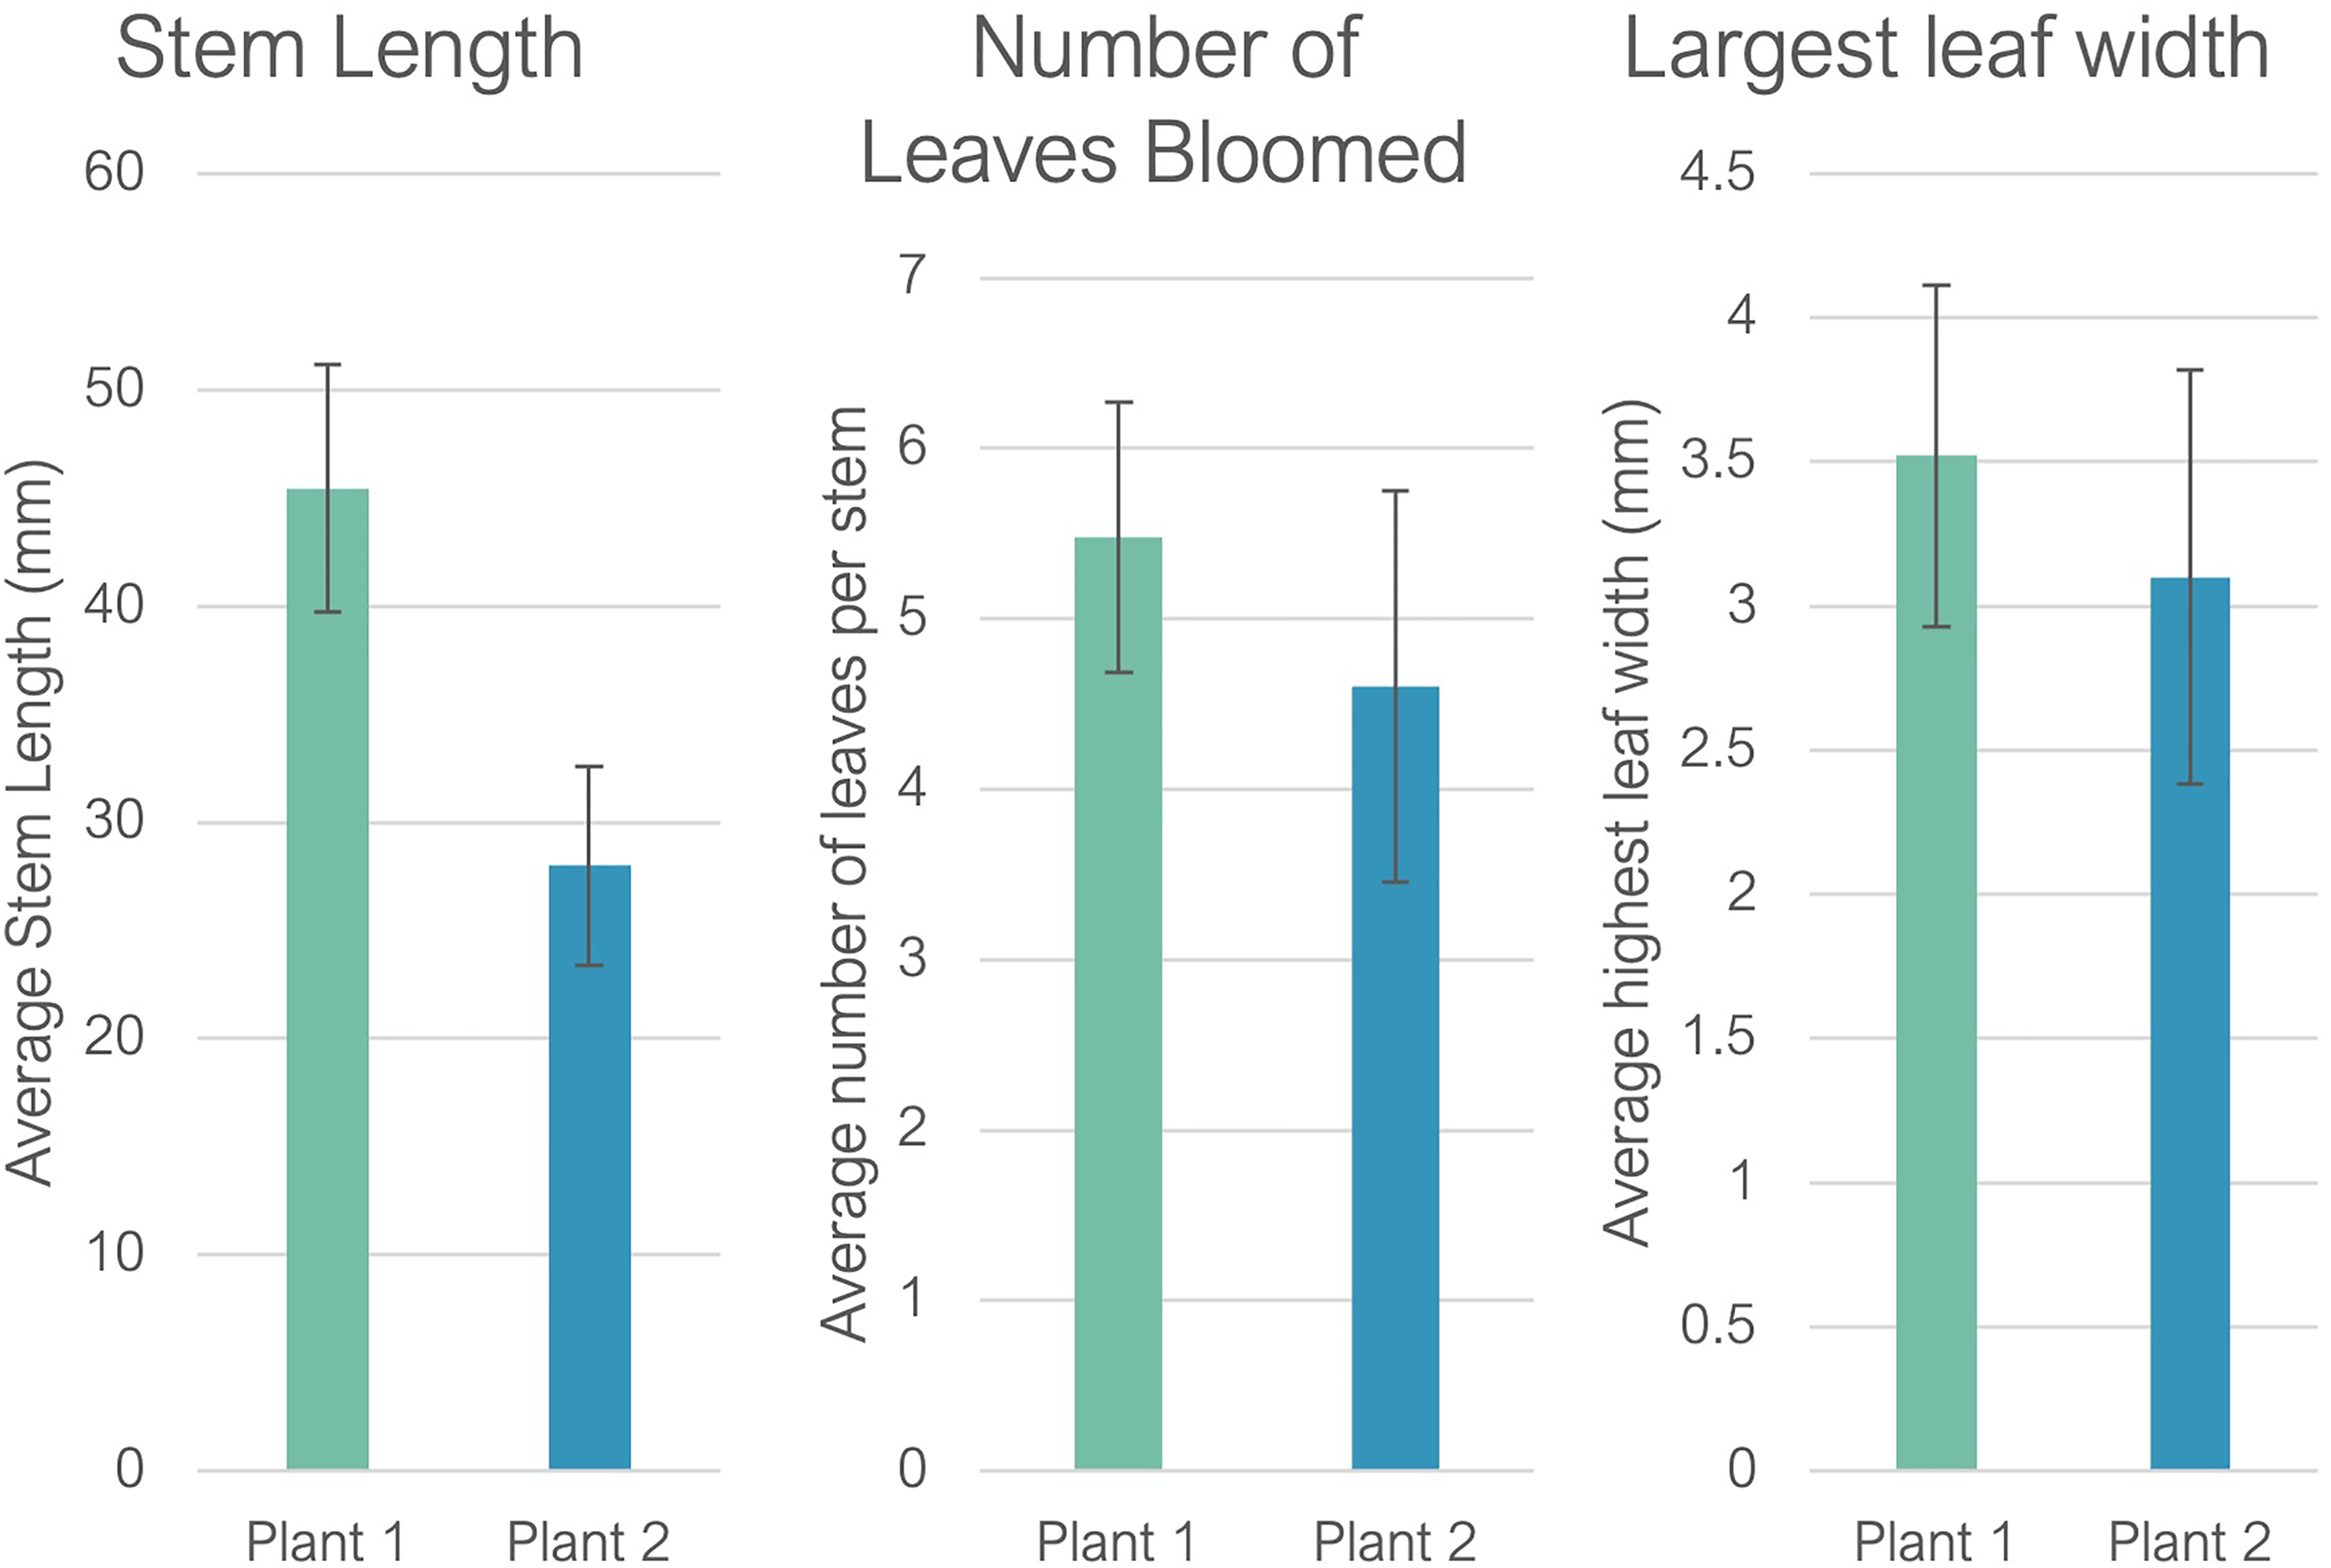
Graphical representation of the experimental data for better visualisation.
Another aspect of analysing quantitative results that students can be aware of was the measurement error. This error analysis was of particular importance in biological measurements.
24
Although the two stem length averages had a small difference (of
Conclusion
An embedded feedback control system using Arduino employing electromechanical devices has been built for application to a lab-scale smart farming system. An experiment using garden cress has been conducted to test the hypothesis and give students an opportunity to translate their engineering skillset within the practical context of agriculture. At the end of the defined lifecycle, the plant grown in the growth chamber equipped with feedback control demonstrates better and healthier growth compared to the plant grown without feedback control. A web and app interfaces are also designed to provide real time and historical measurements of ambient temperature and soil moisture useful for plant growth. We expect that instructors and particularly students who are interested in the practical application of embedded control of electromechanical devices could benefit from the design of this article.
Modification and extension are very possible, depending on the needs. For instance, if the effect of the light cycle on plant growth is to be considered, then a light sensor and artificial light can be added to the system. The smart farming system’s inherent flexibility and expandability make it an invaluable learning tool for students, as it can be customised to cater to their specific needs in developing various technical or interdisciplinary application skills.
Supplemental Material
sj-cls-1-ijj-10.1177_03064190231190052 - Supplemental material for Teaching embedded control system design of electromechanical devices using a lab-scale smart farming system
Supplemental material, sj-cls-1-ijj-10.1177_03064190231190052 for Teaching embedded control system design of electromechanical devices using a lab-scale smart farming system by Himali Mistry, Dina Shona Laila and Mathias Foo in International Journal of Mechanical Engineering Education
Supplemental Material
sj-sty-2-ijj-10.1177_03064190231190052 - Supplemental material for Teaching embedded control system design of electromechanical devices using a lab-scale smart farming system
Supplemental material, sj-sty-2-ijj-10.1177_03064190231190052 for Teaching embedded control system design of electromechanical devices using a lab-scale smart farming system by Himali Mistry, Dina Shona Laila and Mathias Foo in International Journal of Mechanical Engineering Education
Supplemental Material
sj-bst-3-ijj-10.1177_03064190231190052 - Supplemental material for Teaching embedded control system design of electromechanical devices using a lab-scale smart farming system
Supplemental material, sj-bst-3-ijj-10.1177_03064190231190052 for Teaching embedded control system design of electromechanical devices using a lab-scale smart farming system by Himali Mistry, Dina Shona Laila and Mathias Foo in International Journal of Mechanical Engineering Education
Supplemental Material
sj-bib-4-ijj-10.1177_03064190231190052 - Supplemental material for Teaching embedded control system design of electromechanical devices using a lab-scale smart farming system
Supplemental material, sj-bib-4-ijj-10.1177_03064190231190052 for Teaching embedded control system design of electromechanical devices using a lab-scale smart farming system by Himali Mistry, Dina Shona Laila and Mathias Foo in International Journal of Mechanical Engineering Education
Footnotes
Acknowledgements
The authors would like to thank the students and teaching staff from the School of Engineering at University of Warwick and the Faculty of Electronic Engineering at Universiti Teknologi Brunei for all the fruitful discussion time.
Declaration of conflicting interests
The author(s) declared no potential conflicts of interest with respect to the research, authorship and/or publication of this article.
Funding
The author(s) disclosed receipt of the following financial support for the research and/or authorship of this article: This work was supported by British Council through UK-Brunei Higher Education Teaching and Learning Partnership grant.
Data Availability Statement
Supplemental material
Supplemental material for this article is available online.