
Abstract
Latour’s notion of immutable mobiles relates the circulability of certain objects to, among other features, their immutability, readability and combinability. As such it does not distinguish between, say, hand-drawn maps and machine-generated graphs. How, though, does the medial ‘microstructure’ of immutable mobiles matter to socially shared uses? Would, for example, digital images as bounded grids of nonoverlapping square pixels, each representing a numerical value, shape how distributed scientific work unfolds? In this article, I begin with reviewing attempts to link the microstructure of media to their communicative uses, focusing on Luhmann’s relational account of media as loosely coupled substrates in which more rigid forms can become manifest. Drawing on an ethnography of astronomical research, I then inquire into how the scientists involved reasoned about their uses of media from within their practices. They used digital photographic exposures as ‘workable objects’ whose usefulness was not guaranteed initially. Local work was oriented to potential reuses of images (as processed exposures) by researchers elsewhere, as demonstrated by concerns over the integrity of images, the possibility of describing their work with reasonable efforts, as well as by negotiating acceptable elements in calculations so as to reveal stabilized phenomena. In doing so, scientists insisted on the need to play or experiment, suspending sequential work for explorations oriented toward deciding which action among alternatives to make consequential. This was part of a more extended ‘calculative game’ that points, through its orientation to reasonable agreement and delimitations of legitimate efforts, to the social order of this work. The medium, here conceived as images deemed accountable to reuses elsewhere, is a social achievement. Recognizing this may help to better understand the reusability of scientific data and its challenges.
Introduction
New media can have novel and widespread epistemic uses and effects. This is illustrated by Latour’s (1986: 7) notion of immutable mobiles – ‘objects which have the properties of being mobile but also immutable, presentable, readable and combinable with one another’. By making (traces of) transient events durable and available in many places and at various times, such objects are ‘able to retroact on other graphematic articulations – and, what is most important, not only on those from which they have originated’ (Rheinberger, 1997: 106). As Latour conceives it, the notion of immutable mobiles is fairly inclusive and comprises hand-drawn maps, machine-generated inscriptions, tabulations, writing and other items.
Neither Latour nor the scholars adopting the notion of immutable mobiles probe in detail into how their specific medial ‘microstructure’ or notational properties become consequential in scientific practice. How, for example, would digital images as bounded grids of nonoverlapping square pixels, each representing a numerical value, shape how distributed scientific work unfolds? Drawing on a case study from astronomy, I pursue this question by examining how the microstructure of digital photographic exposures matters when this medium is one for recording traces, one that enables generative epistemic uses, and one of communication. I argue that as scientists’ work with digital exposures was oriented toward potential future reuses of data by researchers elsewhere, its medium was shaped by the epistemic and social accountabilities involved.
Many studies of scientific practice have either emphasized the flexibility of interpretations and data or dwelt on the rigor of writing and notational systems. On the one hand, constructivist accounts, broadly conceived, have emphasized the former. Thus, Collins (1992) declares demonstrating the ‘interpretative flexibility’ of experimental data as the first stage of his Empirical Program of Relativism, which is to be followed by a search for extra-epistemic, often social, factors to account for the settlement of scientific disputes. Studies on the Social Construction of Technology (Pinch and Bijker, 1987) invoke interpretative flexibility to argue against deterministic accounts of technological developments (e.g. Meyer and Schulz-Schaeffer, 2006). Even presumably straightforward practices like counting imply contextual, and therefore potentially controversial, understandings of what is to be counted (Martin and Lynch, 2009).
On the other hand, philosophical, historical and social studies of mathematics and theoretical physics have emphasized the rigor of shared notational systems and suggest that disciplinary thinking is tied to writing and its materiality. Krämer (2005: 32) argues that writing is a ‘means to make a formatted surface useful not only for communication but also for cognition’. She insists that media do ‘not only relay their contents but are also fundamentally generative’ (Krämer, 2015: 27). This view was anticipated by Husserl’s (1970) understanding of writing as a condition of possibility of ideal objects as well as a canon of media studies (Goody, 1977; McLuhan, 1964; Peters, 2015). It was also anticipated by Wittgenstein’s (1978) interpretation of mathematical practice, which attends to its medium (often paper), its formatting (typically calculations with numbers in the decimal system), and its necessary visibility (expressed, for instance, by his demand for a mathematical proof to be übersichtlich, that is, perspicuous or surveyable [p. 143]). Pickering (1995: Ch. 4) describes William Rowan Hamilton’s invention of quaternion algebra as an intertwining of human choice-making and the ‘disciplinary agency’ of mathematical notation. This is echoed by Merz and Knorr-Cetina (1997), who, inspired by Derrida (1976), seek to identify ethnographically the ‘performative techniques’ of notation in theoretical physics, and find its users to oscillate between ‘“straightforward” algorithmic practice and “being stuck”, followed by non-algorithmic practice’ (p. 75). Rotman (2000: 58) insists that ‘without rigor, mathematics would vanish’, since ‘rigor is not an externally enforced program of foundational hygiene, but rather an intrinsic and inescapable demand proceeding from writing’ which is basic to transforming ‘mathematical intuition into an intersubjective writing/thinking practice’. That doing mathematics is constitutively tied to its materiality and specific choices of media, including blackboards and scrap paper, has been observed by Livingston (1986) as well as Barany and McKenzie (2014), and was analyzed using video recordings by Greiffenhagen (2014). Heintz (2010: 177) insists that communicating with numbers entails medial effects that cannot be ascribed to social contexts alone. She contends that this is at odds with popular views of interpretative flexibility.
As such, the flexibility of interpretation and the rigor of notation lead to competing epistemological positions, arguably somewhat like the perhaps irresolvable opposition of constructivist and deterministic accounts of technology (Lievrouw, 2014; Wyatt, 2008; cf. Dourish, 2017). An alternative, ‘orthogonal’ view is to move toward an ‘organizational’ mode (Sharrock and Anderson, 1991: 61) and attempt to specify how scientists reason about their use of media from within their practices, and how, in producing natural orders, scientists also produce and inquire into social orders (cf. Lynch, 1993). This approach is pursued by ethnomethodological studies of work, whose insight that the specifics of technologies are unavoidably produced through ordered interactional work (Button, 1993) may well extend to the uses of media in scientific practice.
Uses of digital images in contemporary scientific practice offer an intriguing case for such a study. The Greek root of the word ‘photography’ (photographein) is translated into English as ‘light writing’ (Davenport, 1999). If the digital is essentially a form of writing, as Bolter (1991) and Krämer (2015), among others, suggest, digital photography seems amenable to the effects of formalization. Alphabetic writing did not just ‘map’ or represent spoken language but arguably made it possible to reflect on the grammar of language (Derrida, 1976; Luhmann, 2012; Stetter, 1997). Thus inspired, one may wonder whether the grid-like structure of digital exposures calls for rethinking the sociotechnical uses of imaging data in scientific practice. Drawing on interviews, archival sources and ethnography to identify culturally and historically specific assessments of the visual and the numerical in work with digital scientific images, the studies of Galison (1997), Beaulieu (2002) and Joyce (2006) hint at this possibility.
In this article, I consider the grid-shaped graphic fields of digital photographic exposures not (merely) as being made and understood to represent something, but (also) as constituting frameworks for action in and through which orders of work and instruction are constituted and maintained. In taking this ethnomethodological viewpoint I am inspired by Goodwin’s (2018) study of children playing hopscotch and of archaeology students being instructed to use a Munsell color chart, as well as by Lynch’s (1991) study of the topical contextures – ‘spatial grammars’ that are ‘topically tied to complexes of action and equipment’ (p. 53) – of digitality and opticism. Elsewhere, Lynch and Edgerton (1988) describe the ‘crafting of natural resemblance’ as practitioners remove presumed artifacts in pixel images by hand in what they term ‘practical Cartesianism’ as one orientation of scientists’ work with such images. As scientists prepare images for display, here visual accountabilities appear to override numerical ones. This observation contrasts with ones from Vertesi’s (2015) ethnography of the Mars Exploration Rovers. She describes how digital data afford diverse visualizations (such as color codings) while the ‘numerical appeal restricts scientists to those types of image manipulations that can be replicated, mathematically described, or generated’ (p. 196). Although not elaborating on the structure of digital images, Vertesi is perceptive to their accountable uses by the scientists she studied.
While not dwelling on practices in detail, de Rijcke and Beaulieu (2014) are more explicit about this accountability in their study of ‘networked images’ in atlases of functional magnetic resonance imaging (fMRI) brain scans, ascribing the authoritativeness of atlas images to their embeddedness in ‘suites of technologies’ comprising standard formats as well as ‘data models, databases, screen-based interfaces, and electronic networks’ (p. 132). In her ethnographic study of an fMRI laboratory, Alač (2011) notes that ‘the visibility of digital visuals is relative to the circumstances of their practical and multimodal engagement’, but since ‘imaged bodies perform resistances by placing conditions on their scans’, she insists that the visuals ‘cannot be fully characterized as socially constructed’ (p. 18, emphasis in original). The medial structure of digital visuals enters through affording users with what Alač, drawing on the work of Charles Sanders Peirce, calls diagrammatic iconicity: they are objects that practitioners can experiment with to gain insights into what they represent.
These studies view digital images (or visuals) as malleable objects whose uses are constrained or stabilized by their numerical constitution, their networking or by mediated objects (human bodies). 1 As described, in particular by Alač and Vertesi, this work can be explorative and even playful – a feature also noticed in other ethnographic accounts of digital data use (Coopmans, 2014; Lynch, 1991: 72-73) that arguably resonates with studies that have likened experimental work to games (Jacob, 1982; Rheinberger, 1997), explorations (Sargent, 1995; Steinle, 1997) and tinkering (Knorr-Cetina, 1981; cf. Lévi-Strauss, 1966; Jacob, 1977), and that have suggested play with board games as an analogy for scientific practice (Latour and Woolgar, 1979: Ch. 6; but see Sormani, 2015). Informed by these insights I shall be open to uses of play in constituting media in scientific practice.
In this article, I follow the medial properties of digital images through different contexts of scientific practice, which, inspired by Rotman (2000: 58), I seek to grasp as an ‘intersubjective writing/thinking practice’. I am curious about how images are embedded in practices when their makers and potential reusers are not co-present. I focus on how ‘other-than-local considerations manifest themselves within the locality’ at my study site as a ‘lab-in-a-discipline’ (Sharrock and Anderson, 1986: 91). I also take inspiration from attempts to situate the microstructure of media in social interaction and communication, drawing attention to the generativity of media (Heider, 1926/1959; Krämer, 2005, 2015; Luhmann, 2000, 2001, 2012). Among these, Luhmann’s work is of particular interest, not only for relating the properties of media to their communicative function, but also for conceiving of observation as a practice that is bound to the uses of media and their capacity to mark distinctions (Baecker, 2002; Heintz, 2010). 2 Briefly put, inspired by Heider (1959), Luhmann considers media to be loosely coupled substrates in which more rigidly coupled forms can become manifest. He views the distinction between medium and form as relational, fixated by the function of closed systems of communication (‘social systems’). Thus conceived, forms may instigate the definition of media. Suggestive as it may be, this abstract view pays no attention to how the medium/form distinction is constituted in actual courses of work. It is to such essential detail that I turn in this article.
Astronomical observation provides a useful case for such a study. Astronomy has been called a ‘science of the eye’ (Daston and Galison, 2007) and several authors have noticed its emphasis on visual work with images (Brooker et al., 2019; Kessler, 2012; Lynch and Edgerton, 1988; Vertesi, 2015). But astronomy has also been considered a quintessentially mathematical science whose practices have been linked to accounting (Porter, 1995; Smith, 1991). The use of digital images in astronomical practice may have ‘fused’ these two aspects (cf. Galison, 1997: 21). Just about all data in astronomy today are recorded digitally, and much of it is available through open access. This facilitates not only their reuse, but also holding makers and users of data accountable for their practices in novel ways (Hoeppe, 2014).
This article is based on eighteen months of ethnography of the work of a research group at an astronomical research institute in Heidelberg, Germany, conducted in 2007-10, and followed by revisits in 2010-17. I focused on witnessing its everyday work, particularly in settings where graduate students and young post-docs were instructed by senior scientists. I supplement this material with my documentation of an introductory university course on observational astronomy that I witnessed at a North American University in 2014. I use pseudonyms throughout. Although I have not participated in the work that I describe here, I had acquired practice in analyzing digital astronomical data fifteen years prior to my study in the course of completing a MSc degree in (astro-)physics.
The generative calculability of digital images
For contemporary astronomers, the calculability of digital photographic images appears to be a given. They commonly say that they count photons in exposures taken with the digital cameras that have dominated optical and near-infrared observing since the mid-1980s. Made to record the radiation of cosmic objects, ‘science exposures’ – photographic recordings of the night sky – are always deemed to contain artifacts of the detector, the telescope optics or the atmosphere. Artifacts are, as such, defined contextually. They had been common already in analog photography using chemical emulsions on film or glass plates, a dominant medium of astronomical research prior to the introduction of digital detectors. In digital astronomy, however, they are dealt with differently. This is illustrated by a lecture by ‘the Professor’ in an introductory class in observational astronomy taught in 2014 for undergraduate students at a North American University. Following a review of various detectors used for observing, he turned to explaining what makes observing with CCD (charged coupled device) detectors, which have been dominant in astronomy since the 1980s, novel in kind. In the following transcript, underlining indicates stress.
Now that we have gone over some of the basics … ehm … I think it’s time to get into … to some of the tricks. The
This transcript conveys the Professor’s excitement about the uses of CCD detectors for observing and data reduction, the latter involving ‘secrets’ known to insiders like himself. Focusing on measuring the radiation flux of cosmic objects, he presents himself as an experienced practitioner who has witnessed the introduction of digital imaging technology and instructs his students in its use, not the least in the lab course that accompanied this lecture. The Professor explains that CCD detectors are not only ‘very efficient’ (sensitive) but also ‘very linear’ (recording incoming light in proportion to the exposure time). This makes their output directly amenable to arithmetic calculations, including the pixel-by-pixel addition, subtraction and division of exposures. Differential imaging, the Professor explains, is an important use: subtracting ‘off source’ exposures (images of blank sky which provide measures of the noise) from ‘on source’ exposures (in which celestial objects are recorded, always also including noise) to obtain the signal of only ‘the source’ is a novel way to remove ever-present artifacts in exposures and to bypass uncertainties involved in local calibrations. The novel generativity of digital photography draws on this calculability, that is, on users being able to add, subtract, multiply or divide photographic exposures that are, originally, symbolic (encoded numerically) in a pixel-by-pixel manner.
Not ‘born-digital’ (McCray, 2014), photography using chemical emulsions is an example of what the Professor calls ‘old astronomy’. It is not only much less sensitive than CCDs, having only about one percent of their efficiency to collect light (McLean, 2008), but also ‘highly nonlinear’, as described by their characteristic curve – ‘a plot of the density of [exposed and chemically developed] dark grains versus log(exposure) typically shows a “toe”, a linear part …, and a “shoulder” where saturation due to the finite number of available grains in the emulsion is approached’ (Knox et al., 1998: 840). Complicating its uses further, this nonlinearity typically depends on the wavelength of incident light. In ‘old astronomy’, exposures became amenable to calculations only after photographic plates had been scanned, the characteristic curve for each plate determined and the resulting linearization correction applied to the measured values of scanned pixels. The multiple uncertainties of this laborious procedure (Boyce, 1977) contrast with the apparent simplicity of differential imaging. Its diverse steps require explication, making it less straightforward to ascribe the difference of two exposures to the signal of a cosmic source. This would have also impeded their circulation.
While the Professor describes differential imaging as a simple, sequential procedure of removing artifacts by subtracting images, early accounts of the introduction of digital imaging in astronomy have also highlighted its novel opportunities for play and experimentation. For example, in his concluding remarks at a workshop on digital image processing in 1979, Mike Disney, an astronomer at the University College Cardiff (UK), notes: The astronomer here wants to play with the data in a flexible interactive way which requires sophisticated software. […] I would like to re-emphasize the importance of fitting image-processing into the natural habits of scientific man [sic]. Having first ‘seen’ his data the astronomer will want to return to it many times to measure, to think, and to experiment. (Disney, 1979: 496)
Disney appears to use ‘play’ and ‘experiment’ synonymously, both arguably suspending otherwise sequential operations. If ‘image processing’ can be integrated to these scientists’ ‘natural habits’ then nothing unusual happens when astronomers play with data. I shall be open to the possible role of play in constituting digital images as media that are usable at distinct sites of astronomical practice. It almost goes without saying that Disney, like the Professor (above) and other astronomers with whom I discussed this topic, appears not to be troubled with philosophical concerns about picture theories of representation, as he refers to digital photographic exposures as images. For these scientists, ‘images’ are digital exposures, unprocessed or processed, typically recorded and stored in the standard FITS (Flexible Image Transport System) file format (see McCray, 2014).
Image, medium and form
In his lecture, the Professor schematically illustrated the function and use of CCD detectors on the classroom’s blackboard with hand-drawn grids of squares, filling them with numbers to describe their calculative uses. How digital images are both visual and numerical is illustrated schematically by Figure 1, taken from Lynch (1991). It shows a formatted, bounded two-dimensional surface of nonoverlapping square picture elements (pixels). A progression of shades of gray has been used to visualize the numerical values pertaining to individual pixels, making it a ‘mathematical assemblage’ (p. 72). In this case, darker pixels represent smaller numbers than brighter ones. Figure 1 could well be a close-up of a digital photographic image of a star (Lynch considers the work of astronomers in his text), recorded, read out and stored electronically, and then printed on paper. Each constituent pixel in the grid of the digital image can be assigned a number between zero and the detector’s saturation level.
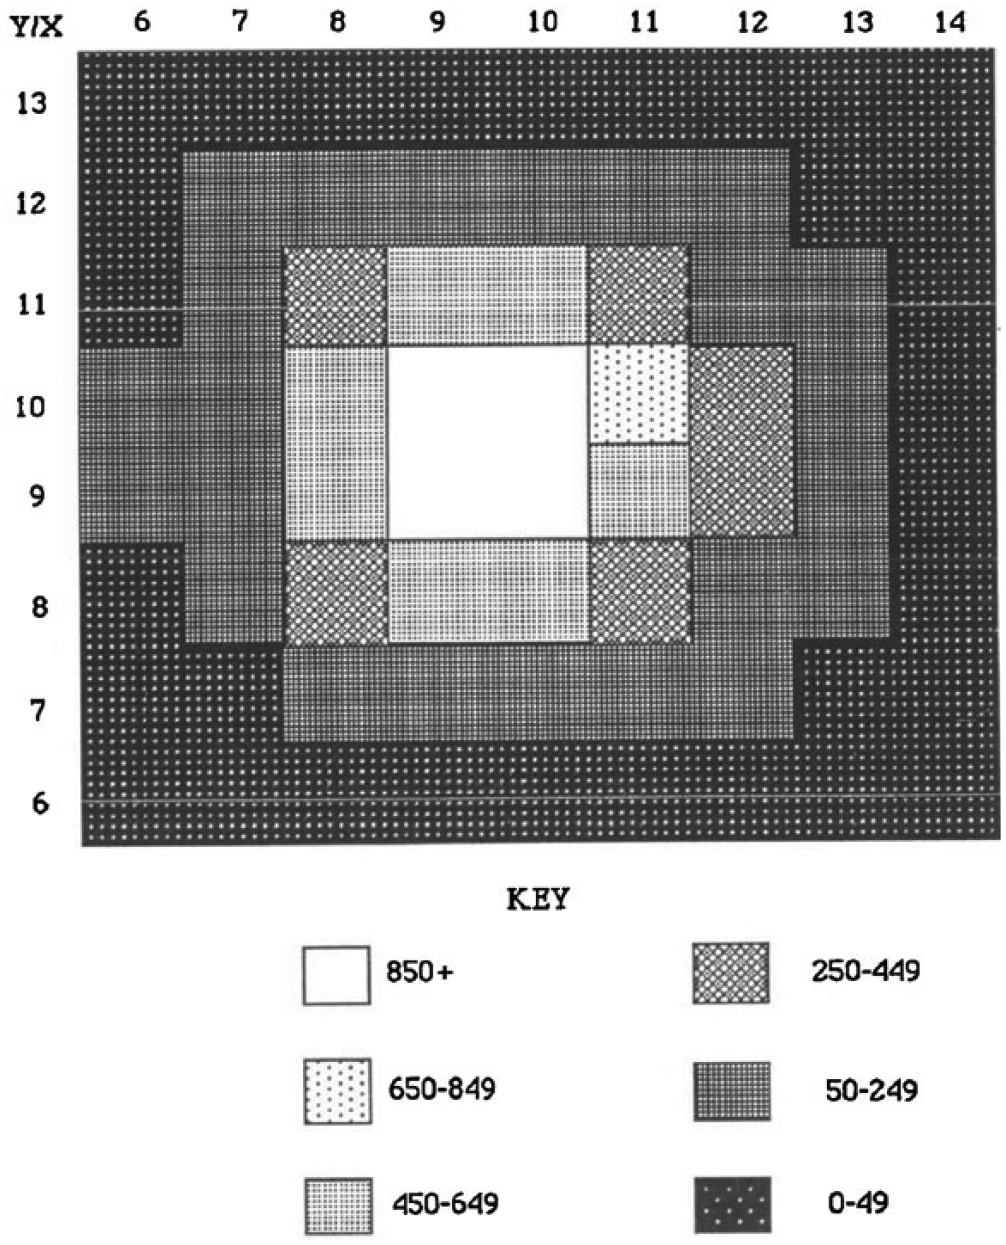
A greyscale map as a representation of a digital photographic exposure. This picture is taken from Lynch (1991, Figure 3), where it stands side-by-side with a table of the numerical values that are encoded in the scheme depicted here.
This description of digital images accords with the physicalist understanding of media that Fritz Heider (1926/1959), a Gestalt psychologist, formulates. Heider argues for conceiving of a ‘medium’ as a substrate of loosely coupled elements in which ‘things’, more rigidly coupled structures, can become manifest. Heider claims that, ideally, media are determined externally, not imprinting their internal coupling on what they mediate. He notices that this largely pertains to photography, whose substrates are determined externally in the moment of exposure, before the ‘traces’ of light are ‘fixated’ (Heider, 1959: 21). However, arguing that instruments like thermometers and barometers are also media, Heider acknowledges that these devices selectively transpose what they mediate according to their inherent organization, for otherwise they could not make it available to human senses. He insists that the distinction of medium and thing is relative, in that what is an externally determined medium in one circumstance may be an intrinsically coupled thing in another (Heider, 1959: 15–16).
Heider’s suggestions are abstracted by Luhmann (2000, 2001, 2012), who likewise adopts a relational view, considering media (much like Heider) as substrates that are more loosely coupled than the ‘forms’ (not ‘things’) they reveal. True to his constructivism, Luhmann insists that the distinction of medium and form is always made by an observer, and from the observer’s particular perspective. Luhmann abandons Heider’s materialism, arguing that while physical media may provide a repertoire for the manifestation of forms, this is not inevitably the case. For example, the letters of the alphabet are the medium in which the form of words becomes manifest, and words are a medium for the form of sentences.
Luhmann’s (2012) concern with media is chiefly a concern with communication, which he considers to be the basic operation of ‘social systems’. He sets out from the premise that the success of communication is unlikely in principle, given that the recipient of a message may not be reached, may not understand it, or may not accept it. He identifies three media of communication which, in turn, increase the likelihood of its ever-uncertain continuation. Spoken language is the foundational medium of communication. Its use in face-to-face interaction is marked by the ongoing repair of sequential utterances and nonverbal signs, making the success of communication more likely (pp. 123-138). Dissemination media, such as writing and printing, extend the reach of messages. They allow going beyond the orientation to consensus characteristic of face-to-face interactions but make dissent easier (pp. 120-121). This calls for means to increase the acceptance of a message. Informed by Parsons’s (1975) functionalist account of generalized media of interchange, Luhmann suggests that this is accomplished by the use of symbolically generalized media of communication, ‘media that structurally increase the likelihood for the success of communication’ (Luhmann, 2012: 190-238). Luhmann posits that these are specific to functional subsystems of society. For him, ‘truth’ is the symbolically generalized medium of academic scholarship (Wissenschaft): what is deemed true or false is distinguished from within this subsystem with a preference for communicating truth.
Considering works of art, Luhmann (2000, 2001, 2012) argues that while forms become manifest through media, they may also instigate what can be regarded as a medium. In doing so he moves to lofty levels of abstraction. For example, he considers variations in late medieval paintings as an example in which the form of Virgin Mary holding the Child draws attention to Mary’s body and posture as the medium that can hold the Child in discernably distinct ways (Luhmann, 2001: 207). Throughout, Luhmann discusses finished works that have been acknowledged as art. He does not consider the process of making art objects, when the distinction of medium and form may as yet be unstable, and ignores how participants seek to achieve agreement on what is medium and what is form.
In the context of observational astronomy, ‘the Professor’ I quoted earlier implied that the use of differential imaging is generative and independent of its epistemic context. By allowing the proper removal of artifacts, here the medium can presumably be used to make the visible form of astronomical objects manifest – though astronomers do not typically speak of a digital exposure or image as a ‘medium’. The work of Heider and Luhmann prompts the question of whether, conversely, some kind of form may be constitutive for what scientists using digital images could hold to be the proper medium of their work. The point of asking this question is not to subscribe to Luhmann’s abstract theorizing, but rather to make agreements on what a medium can be available for ethnographic description, and ethnomethodological re-specification.
Accountable images
In the following I draw on my ethnography of a research group of astronomers studying galaxy evolution. These astronomers use digital photographic exposures of the sky taken through a series of color filters that transmit specific wavelength ranges of visible and near-infrared light to measure the radiation flux of cosmic objects, and to classify objects and estimate their properties by fitting template spectra from a library to these measurements (see Figures 2 and 3). In this domain of astronomy data from diverse instruments are routinely combined and the reusability of data is contingent on their mobility. ‘Raw’ exposures, processed images and catalogs of measurements taken in these images are commonly made public.
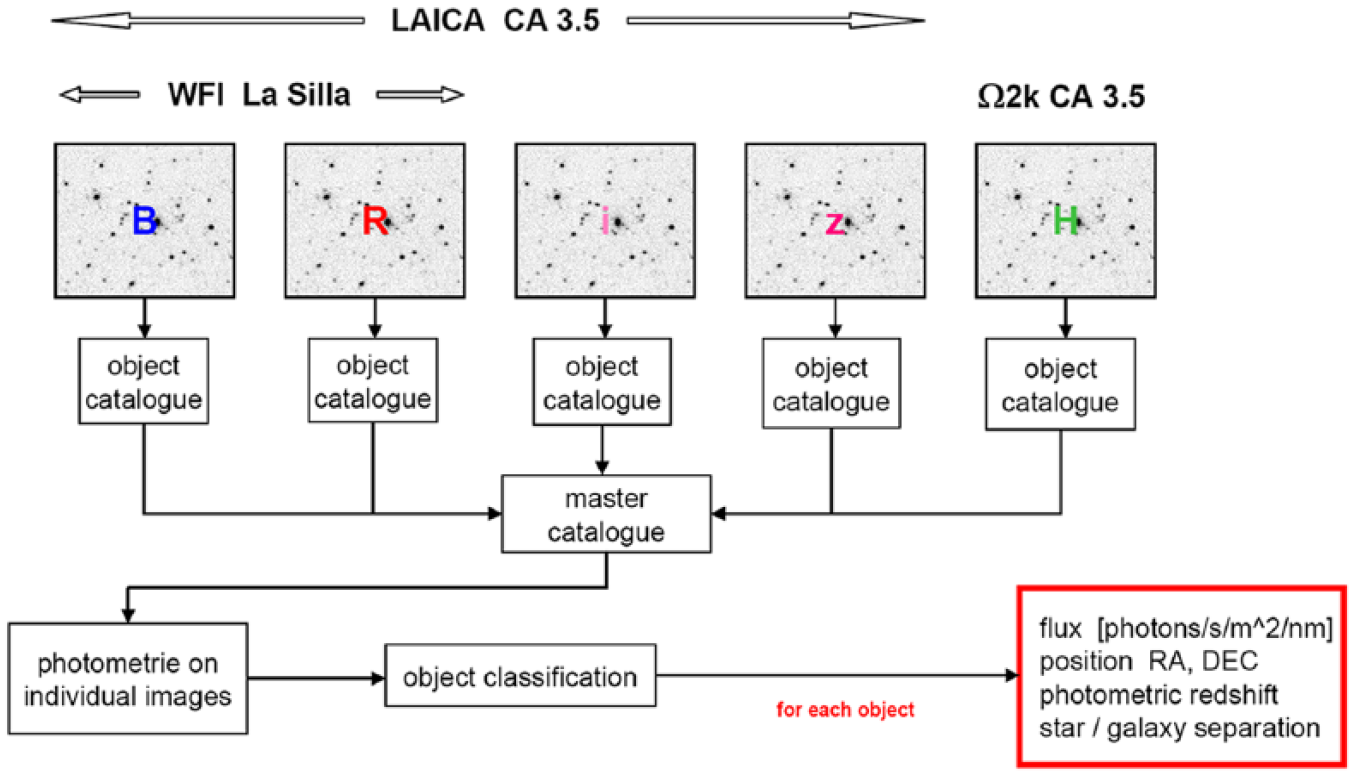
Flowchart of the data reductions of the research group described in the text, as taken from a conference presentation of one of its members. It depicts the work as a sequence of operations. First, a set of exposures is taken of specific selected fields in the sky through a series of color filters (B, R, I, z, H) using different digital cameras (LAICA and Omega2000 at the 3.5-meter telescope at Calar Alto Observatory, Spain, and WFI at the 2.2-meter telescope at La Silla Observatory, Chile). These are then used to detect objects algorithmically, take photometric measurements at the object positions, and classify objects by searching the best-fitting match with a library of template spectra. The results are object positions, radiations fluxes, classifications of the object type (star, galaxy) and estimates of the photometric redshift, a measure of cosmic distance.
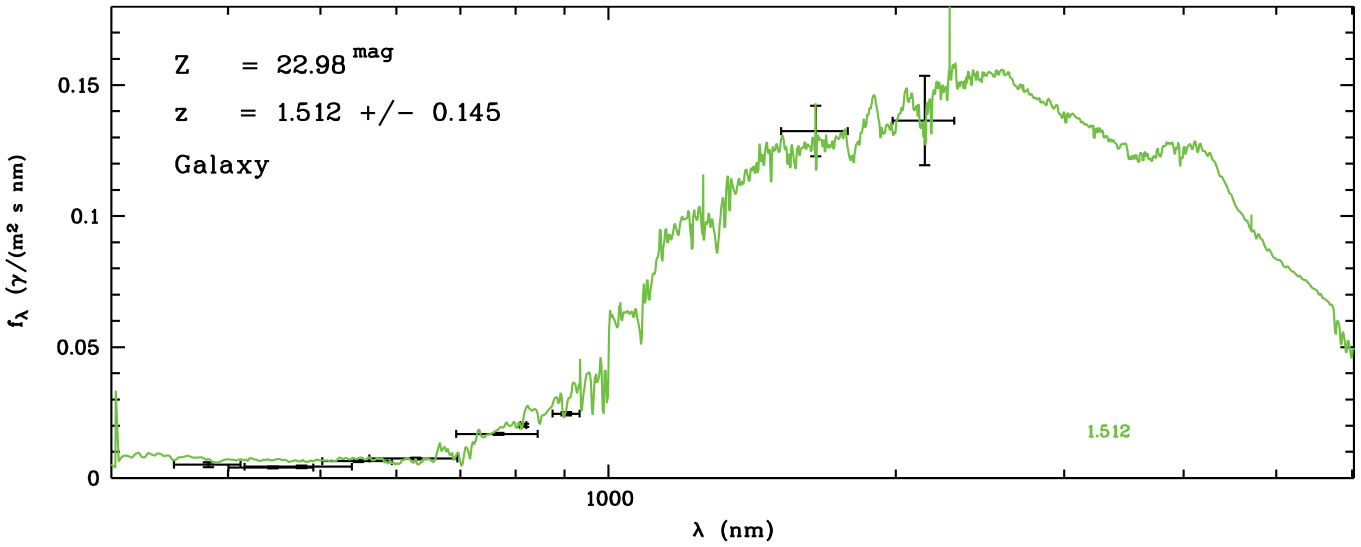
A galaxy spectral energy distribution, depicting measured radiation flux densities as a function of wavelength. Crosses indicate measurement errors. The best-fitting spectral energy distribution template, selected algorithmically from a library of templates, is shown as a continuous green line.
Differential imaging is the first step of this work. Foundational as it may be, this operation alone does not necessarily make exposures available for further uses. Subsequent work consists of removing artifacts from recorded science exposures, calibrating and adding them, and using algorithms to detect objects and measure these objects’ fluxes. After converting counts of the flux in pixels into astronomical magnitudes and colors (the ratio of the flux densities in adjacent wavebands), the resulting spectral energy distributions of detected objects (wavelength dependent radiation fluxes) is assembled in a table. Eventually, the best-fitting template of a library of diverse galaxy spectra (of different ages, masses, histories, compositions and photometric redshifts) is matched algorithmically to the observations of each object in the catalog (Hoeppe, 2014).
These astronomers describe this work in their publications as a single linear sequence of calculative operations (see Figure 2), but I witnessed that these practices were reflexive in an ethnomethodological sense, in that earlier steps of work were reassessed and modified, subject to the outcome of later steps in the sequence. This prospective and retrospective reasoning engaged discipline-specific representational formats and contexts of accountability (Hoeppe, 2014). In this intertwining of calculative practices and visual assessments, digital photographic exposures made with different telescopes and detectors were one kind of calculative thing alongside spectral energy distribution templates of galaxies and stars (Figure 3), calculative prescriptions (such as how to convert pixel counts into physical radiation fluxes), and models of artifacts in calibration images (described below).
I describe four episodes from the group’s work in which the usability of digital exposures was at stake. I focus on how troubles were identified and how calculative work with images was negotiated, performed and assessed, focusing as such on digital images and their pixel microstructure. Supervised by senior researchers, two graduate students and a postdoctoral scholar were new to the group and became inquirers into its work practices.
(i) Repairing the calculative uses of exposures: From form to medium
One of the first steps of the team’s data analysis is to divide the science exposures by so-called flatfield frames, which are taken with the same telescope and camera in the evening or morning twilight of an observing night. This division is meant to cancel out artifacts and yield science images with desired ‘flat’ backgrounds, that is, a uniform noise level across the image. Proper observing includes taking a series of flatfield exposures at the beginning or end of a night from which one can later ‘pick one that looks good’, as Otto, one of the team’s senior scientists, explained to Nadine, a PhD student. Senior astronomers like Otto draw on their experience to make educated guesses in selecting the flatfield that may be suited best for this project. In this work calculating with images dwells on visual practices early on. In the following, I use ‘science exposures’ to refer to the unprocessed imaging data of the night sky, and ‘science images’ to refer to the result of the division of science exposures by flatfield calibration exposures (of the twilight sky) and subtraction by dark frames (see McLean, 2008).
Guided by Otto and Otfried, another senior scientist, Nadine had chosen a good-looking flatfield for her project. 3 But her first attempt to complete the sequence of data reductions and template-fitting resulted in a list of objects that seemed puzzling: galaxies with masses and luminosities unusual for their distance. Otfried was concerned and argued that these objects ‘cannot exist’. He suspected that a mistake had occurred early on, possibly an offset between the two contributing data sets (one optical, the other near-infrared), and called for reconsidering how the new images had been flatfielded. As such, an assessment made by exercising professional vision was challenged by the outcome of calculative practices that failed to replicate familiar astronomical phenomena (the masses and luminosities of distant galaxies).
Reconsidering the other flatfields, none of them was found to look better than the one that had been chosen. Thus, team members turned to assess the flatfield’s calculative properties. Following Otto’s suggestion, Nadine did so by calculating the differences between preliminary photometric measurements of stars in the field with independent measurements from public photometric catalogs (tabulations of stellar positions and radiation fluxes). Plotting these differences suggested the presence of two artifacts in the flatfield images: one a circular brightening at the center, the other a gradient across the image (Figure 4). Otfried attributed both to straylight that had entered the telescope during twilight.
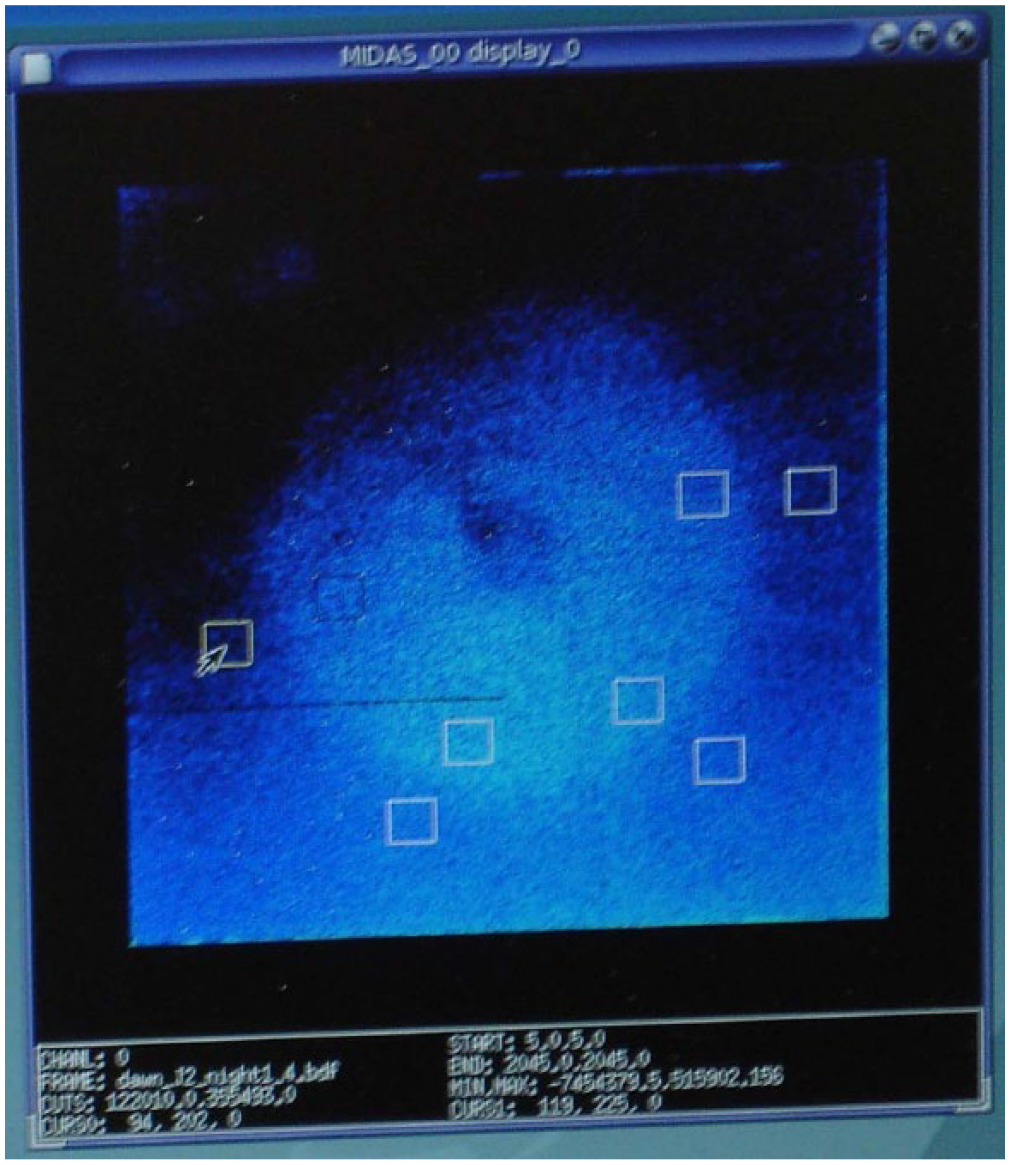
False-color image of one of Nadine’s flatfields. The most conspicuous features in the flatfield are visible as a brightening toward the lower edge of the exposure and a roundish shape near its center. The white rectangles denote areas of the pixel image in which she had measured the noise level.
To remedy this effect, Otfried guided Nadine to formulate models that described the artifacts and could be subtracted from the flatfield exposure. In conversation with Otfried, Nadine summarized her findings on paper – a medium that lacks the inherent calculability of the digital, but arguably gives more room for approximations and schematic assessments. Otfried went yet further by moving to a blackboard for schematically specifying and quantifying the ‘models’ of the ‘numerical things’ (the gradient and the ring). New to the group’s procedures and unfamiliar with its next steps, Nadine could not have done this herself.
With the artifacts thus specified, Otto, one of the group’s senior researchers, formulated a sequence of arithmetic operations to calculate a usable flatfield that Nadine was to apply. Figure 5 shows the sequence that Otto sketched on a whiteboard in a group meeting. Exposures and the modeled artifacts are drawn schematically as square outlines of the infrared camera’s 2048 × 2048 pixels. The outlines of a ‘raw’ flatfield exposure (a), a noise pattern (b) and the modeled ring (c) mark these exposures as commensurable, that is, as amenable for inclusion in arithmetic operations.
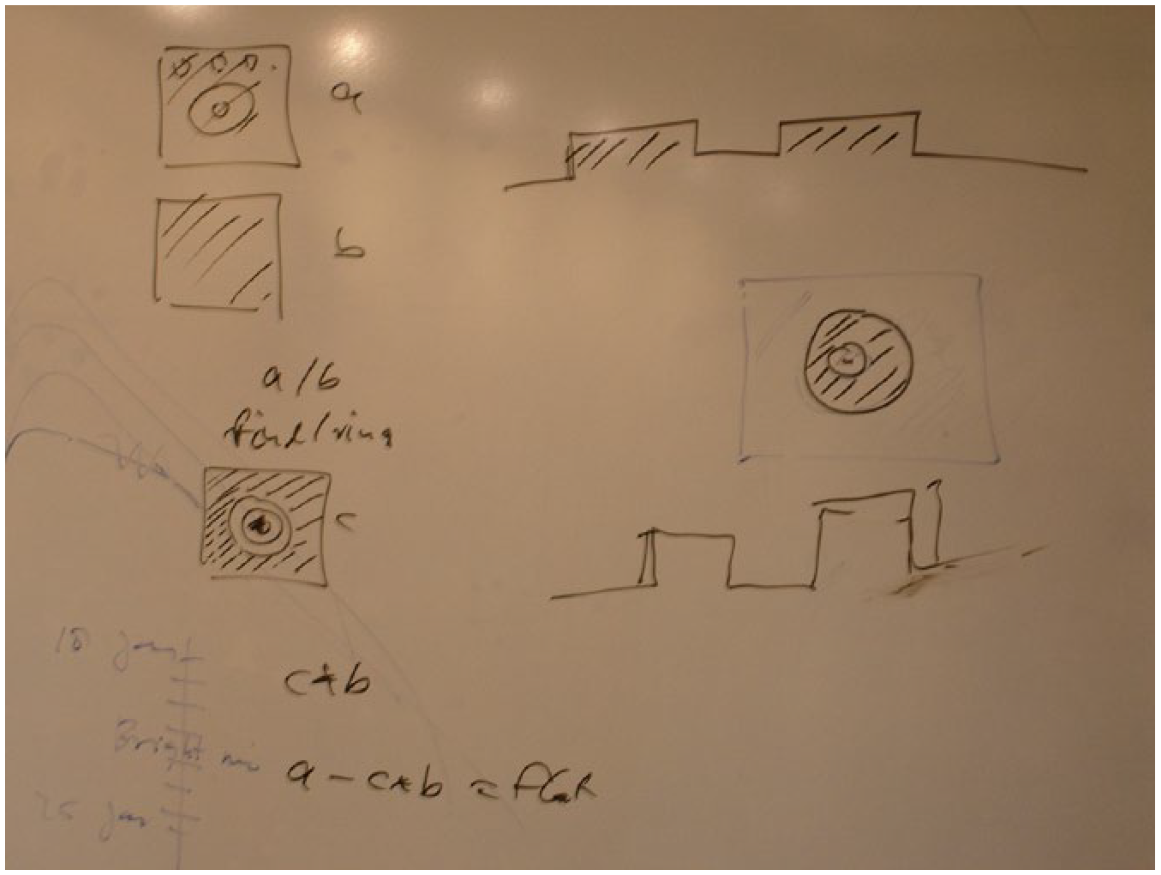
Sequence of arithmetic operations (left) that Nadine was to apply to remedy her flatfield issue, as developed in a group meeting and sketched by Otto. The outlines of a (a) flatfield exposure, (b) a noise pattern, and (c) the modeled ring are drawn schematically as square outlines of the infrared camera’s 2048 pixels × 2048 pixels. The sketches on the right top and bottom represent cross-sections of the intensity of scattered light across the flatfield.
A few days later, Nadine had produced a numerical description (a model) of the ring and set the values of surrounding pixels to zero. When she met Otfried to show him a color-coded representation of the ring model on screen, he found the model to ‘look good’ at first. However, after taking a closer look, Otfried was troubled by the discontinuity of pixel values at the edge of Nadine’s model: I mean … the image with the sharp edges … the images should not … by no means … have sharp edges … independent of what you do. If you produce something which has sharp edges … then it is bound to be a bad description of the thing. If something goes smoothly to 0 and you have set everything to 0 outside that … that is fine. If something goes smoothly to 1 and you set everything to 1 outside that … then that is fine. But you cannot go somewhere and then set something to 0. This makes no sense.
Being concerned with the ‘smoothness’ of the flatfield and worrying about its ‘sharp edges’, Otfried was oriented to its future calculative uses and its specific accountabilities when fitting spectral energy distribution templates to the flux measurements. Nadine had to modify her model accordingly.
Thus the ‘flatfield problem’, which had emerged despite the use of differential imaging, was resolved reflexively by introducing an additional element, the straylight model, into the group’s calculative work. These scientists oriented to flatfield calibration frames and science exposures in distinct ways. Taken during twilight before stars appear in the sky and lacking as such a referent external to the observing situation, the flatfield exposures were not made accountable as pictures of celestial objects, but as images that index the optical performance of the observing setup only. Intended to repair local artifacts, flatfield images were manipulated in a pixel-by-pixel way, sometimes by hand, conditional upon their further use in calculative work.
By contrast, individual pixels in science exposures were not changed by hand. Understood as indexing cosmic objects, science exposures were used as entire frames throughout. Indeed, science exposures were kept ‘arithmetically distinct’ from calibration frames: While calibration frames were recursively adjusted in this prospective and retrospective sequential work, the ‘raw’ science exposures were not overwritten. Calibration frames were made visually accountable to artifacts of the local observing situation. By contrast, the science images (the science exposures as divided by the latest version of the flatfield) were made numerically accountable, through measurements of their pixel values, to galaxy spectral energy distributions on which communal agreement, reaching beyond this group, had been achieved before. Thus understood, and adopting Luhmann’s terms descriptively, the science images were shaped as a medium so as to reproduce stabilized forms of extragalactic astronomy, while retaining the capacity to surprise researchers.
(ii) Images that fail as a medium
Patrick, a postdoctoral scholar, was to apply the template-fitting technique to multicolor CCD exposures of another field in the sky, centered on the galaxy cluster A226. These had been taken over a period of four years with the Wide-Field Imager (WFI) camera at the 2.2-meter telescope at La Silla Observatory (Chile). New to the template-fitting technique and to data from this instrument, Patrick was troubled that the slowness of his computer restricted his ability to play with the parameter settings in the data reduction pipeline. This made it challenging to understand his data properly:
It took
Playing with what? The parameters?
Well … I used to work with
The relatively slow speed of his computer invited Patrick to reason about what would, arguably, be unremarkable otherwise: suspending sequential work for a period of ‘play’ oriented toward deciding which action among potential alternatives to choose and make consequential for subsequent work. He was aware of the choices available to him in terms of procedures and the ‘parameter space’, and he argued that it was through his play that he could properly understand the set of digital images constituting his data. Doing so involved the (retrospective) assessments of previous actions. As in Nadine’s case, Patrick assessed calculative operations with images visually. The choices at his disposal were much like the ones that Nadine had, but, unlike her, Patrick could draw on his experience of having previously completed a research project in extragalactic astronomy with similar kinds of pixel image data. He was expected to be able to select a good flatfield for use in his project on his own, and to know when to stop playing with the parameters.
The play that Patrick described to me as ordinary practice was soon challenged, as he continued to use the images of the galaxy cluster A226. A known issue with straylight in the camera, much as in Nadine’s case, was complicated by the fact that several changes to the telescope’s mechanical structure had been made over the four years in which the exposures of A226 had been recorded. Upon closer inspection of the exposures taken at different epochs, Patrick and his supervisor Otfried noticed that stars in the corner of the images did not look round (as desired) but appeared to be more and more distorted the further they were away from the center of the image. This effect appeared to grow worse over time. Otfried interpreted it as an optical error (astigmatism) caused by changes in the telescope’s mechanical structure.
In discussion with Otfried, Patrick first considered reducing the size of the exposures and using only their inner parts, where the distortions were smaller. However, since the cluster galaxies were distributed across the field, doing so would have curtailed the number of galaxies in the sample deemed necessary for the project. The team’s data reduction software did not allow for correcting artifacts whose shape appeared to be radially symmetric, and which were as such distinct for each position in the exposure. Patrick next considered to abandon treating his exposures as a unit, and to divide them into a grid of 4×4 subfields, correcting the image distortions separately in each subfield. He would then work with sixteen exposures instead of a single one. In discussing this plan, Patrick and Otfried realized that doing so would dramatically increase the number of choices that they would have to account for and weaken whatever conclusion they could draw from these data. Troubled by this prospect, Otfried decided that Patrick should abandon work on this data set.
Salvaging the exposures of A226 for the group’s work would have meant giving up on what Nadine strived for in her work: maintaining the integrity of science exposures. Describing Patrick’s work with subexposures in writing would shift the weight in the data release publication from images as ‘arrays of numbers’ toward explanatory text. Doing so would also have risked making the data ‘too soft’ for discovery work, for its capacity to attribute distinctions to epistemic novelty was compromised. The point is not that the calculations involved could not possibly be made to match existing calculative work, but that only a certain effort to do so seemed legitimate to these researchers. This is a social accountability. Deemed unsuited for traveling beyond this group’s situated work, the exposures comprising the A226 data set were dismissed as an adequate medium.
(iii) Preparing images that can resist researchers’ efforts
The pixel microstructure of digital exposures appeared to be effective only if these could be properly embedded in this group’s calculative work, which included other calculable things, such as galaxy spectral energy distribution templates. What was required of these other elements for new science exposures to be usable for the work of the Heidelberg group? In this episode, I consider the challenge that Nick, a fellow PhD student of Nadine, faced. New to near-infrared imaging and the group’s SED fitting technique, he was to use images of the Omega2000 camera to search for distant galaxy clusters in a field in the sky that had been observed by the so-called COSMOS collaboration (Scoville et al., 2007). This other team had committed itself to making its data public in a series of data releases. In mid-2008, the COSMOS collaboration released (calibrated) mid-infrared images taken of the COSMOS field using IRAC, the Infrared Array Camera onboard the NASA satellite Spitzer. Nick and his supervisor Otto were eager to add the IRAC images to their own set of optical and near-infrared exposures. They hoped to find or confirm more distant (higher-redshift) clusters of galaxies than using their visible-light data only allowed. However, they knew from hearsay that the photometric calibration of the IRAC images was not reliable for small fluxes. Using them was a challenge and a matter of concern for applying the SED template-fitting, because of its sensitivity to small calibration errors.
Nick downloaded the IRAC images from the COSMOS website, applied differential imaging (as described by the Professor above), used the code SourceExtractor (Bertin and Arnouts, 1996), a popular tool for object detection in digital astronomical images, and then applied the group’s photometry pipeline to derive magnitudes and colors of the detected galaxy candidates. This was followed by Otto guiding him to ‘fine-tune’ the measured galaxy colors using the well-established colors of standard stars. Plotting the colors of standard stars along with the newly measured galaxy colors in a so-called color-color diagram can reveal systematic differences which, considered artefactual, can be used to correct the measured galaxy colors. However, this is not what Nick could do with the IRAC data, since the visible-light template stellar spectra that his group had used previously did not reach to the longer mid-infrared wavelengths of the IRAC images.
Encouraged by Otto, Nick tried to use spectra and colors of a type of stars that had not been used by the group before: so-called M dwarfs, which are known to emit significantly in the infrared and are sufficiently common in the sky for some to be found in any exposure of the field that Nick studied. As such, Nick sought to make the extension of his data set possible by adding a new calculative element to the group’s repertoire. He obtained two sets of simulated M dwarf spectra (one of them unpublished) from which he computed colors and proceeded to apply the fine-tuning as described above. He then used the template-fitting algorithm to estimate redshifts. To him and Otto, the resulting redshifts ‘seem[ed] to make sense’ as they were in reasonable agreement with those of a sample of galaxies for which spectroscopically determined redshifts, deemed more reliable, were also available.
The presentation of his preliminary results in a group meeting instigated a lively discussion on whether or not it was legitimate to include M dwarf spectra in the group’s calculative work. Otfried, the group’s most experienced expert in template-fitting, argued that it was not. He interrupted Nick’s presentation by asking why he had not used ‘bluer stars’, like ‘F stars’ or ‘white dwarfs’, which, as Otfried claimed, had better established spectra. Nick responded that these were too faint at mid-infrared wavelengths and could therefore not be compared to measurement of galaxies in the IRAC images. Turning to Nick’s supervisor Otto, Otfried then argued: The problem is that he is using M stars which
Otfried went on musing about the troubling complexity of M dwarf spectra, particularly their abundance of absorption lines at infrared wavelengths, noting that these would increase the uncertainty of photometric measurements taken with the group’s filter set. As such, Otfried insisted that the ‘interpretative flexibility’ of M dwarf spectra was a problem, and not a benefit, for future uses and users of their work. Otto conceded and decided that Nick should abandon using M dwarf spectra.
However, Otto and Nick were not yet ready to give up on including the IRAC images in their data set. They went on to match the photometric redshifts that included IRAC data to those of a sample of galaxies in the COSMOS field for which independent spectroscopic redshifts were available, and subsequently applied the resulting correction to the measurements of all the galaxies not previously observed spectroscopically. When Nick presented this work at a group meeting three months later, Otfried was again troubled. He warned that doing so hid treacherous complexities and concluded his assessment in despair: ‘I think this is a wrong way … which has led to
In this episode, it was not Nick’s work with the IRAC images that was at issue, but whether, and how, measurements in these images could be included in calculative work that included measurements in other images. By trying to set up conditions in which practices could unfold reflexively, Nick’s work was meant to be constitutive, but he failed to achieve his goal. For Otfried, the flexibility of Nick’s calculative work and its elements was just its problem. As in the case of Patrick’s attempt to divide his digital images into a grid of 4 × 4 subimages, Nick’s use of M star template spectra seemed pointless to Otfried because these templates were widely known to be uncertain.
Successfully including the IRAC images in their data set required the introduction of a stabilized, calculable astronomical phenomenon – in this case the shapes of stellar spectral energy distributions – on which communal agreement had been achieved. As Otfried insisted, infrared spectra of M dwarf stars did not count as such, because ‘every program will produce other M star spectra’. The unremedied instability of M star spectral shapes would be carried into the interpretation of galaxy spectral energy distribution template fits, making it uncertain what would be assessed if a match of observations with templates had been achieved (cf. Cartwright, 1983; Warwick, 1995). While Patrick’s images did not travel out from the group’s work for being used by other astronomers, here the IRAC images could not enter it. 4 In making the assessments that led to either case, Otfried demonstrated an alertness to social accountabilities that could not be dismissed.
Otfried worried that even the second route probed by Nick and Otto did not lead to sufficiently stable distinctions that one could get away with, as his reference to the fate of published work adopting such an approach suggests. His call for setting up circumstances in which data can ‘resist’ the researchers’ efforts to yield epistemic novelty mirrors, for this symbolic, computational work with digital images, what Rheinberger (2005: 97) has noticed about molecular biology, where successful experimental systems can ‘turn against’ the experimentalist. Nick’s failure to use the M dwarf spectra did not dent his reputation within the team; it was rather seen as a PhD student’s attempt to go as far as possible to enrich the data set, and as such deemed a useful learning experience.
(iv) Experimenting with a weight map
In my last episode I take an additional look at how play or experiment unfolded, and was constrained, in this group’s attempts to make digital exposures a medium for their work. Toward the end of her project, Nadine had produced a composite mosaic image of all her new near-infrared exposures of three adjacent subfields of the sky, centered on the galaxy cluster Abell 901, which she was then to use to detect objects. The total integration times of the three subfields of her mosaic were unequal, and thus were their noise levels. To compensate for this variation and to use the SourceExtractor code to generate a homogenous sample of detected objects in an area with a uniform signal-to-noise ratio, Nadine had to produce a ‘weight map’ of the entire field that accounted for variations in sensitivity. She was guided by Otto, who was at the time constructing a weight map for his own project, also using data taken with the Omega2000 camera.
One day, when Nadine went to see Otto in his office, he told her about a problem that he had just encountered. Much as in Nadine’s mosaic image, his mosaic exhibited variations in sensitivity, yet when he used the object detection algorithm, the areas of the sky covered by multiple exposures did not appear to contain more detected objects. This was contrary to what he expected on the grounds of their presumably higher signal-to-noise ratio: … in my Omega2000 image there was something strange. With the pure weight it didn’t work out. It was not looking good … so I thought ‘What do I do?’ … I experimented a little and then I
Otto visually assessed his computational work, applied to the entire weight map, with respect to an expectation of ‘reasonableness’ (‘It was not looking good’) that draws on his experience with the entire sequence of data reductions. Lacking an understanding of what, if anything, had gone wrong, he ‘experimented’ with squaring the weight map, an arithmetic operation on the numerical values of its pixels that was not backed by a physical understanding of data analysis. Unable to rationalize how doing so led to the improvement that he noticed, he described its apparent success as ‘pure alchemy’.
Scientists have been observed before to invoke notions of magic when being unable to explicate or rationalize their actions or alleged tacit knowledge (cf. Cambrosio and Keating, 1988; Lynch, 2013). Otto made his assessment as a comment on the success of his experimentation when the planful execution of sequential operations had run aground. This resembles Patrick’s resort to play as a suspension of sequential work for a period of explorations as described above. In either case, play/experiment was instigated when researchers could not anticipate the outcome of calculations. As in Nadine’s and Patrick’s work, Otto assessed calculations visually.
Note that Otto did not experiment with his science images (the exposures of the night sky as divided by the flatfield and corrected with other ‘routine’ measures). Instead, as he later explained to me, his experimentation with the weight map and use of the source detection code resulted in a list of candidate objects whose further uses were conditional on being confirmed by independently derived object lists in science images taken at other wavelengths. Only in combination would these result in meaningful spectral energy distribution template fits and derived physical parameters that would make sense when represented in the graphical formats of extragalactic astronomy (including galaxy color-magnitude diagrams and luminosity functions) to which this group contributed. Continuing this episode, Otto encouraged Nadine to experiment with her weight maps, much as he had done himself, explaining to her that it is ‘better to stir in the noise a bit longer than to lose objects’. After all, his experimentation was oriented to detecting objects near the noise limit of his exposures.
Discussion: Calculation, medium, play
A digital exposure by itself does not determine how it is to be used. The Professor told his students that artifacts in ‘born-digital’ (McCray, 2014) exposures can be removed by subtraction, marking a fundamental change in astronomical data analysis. None of the scientists of the Heidelberg group contested this view, but the exposures they worked with could not be used in such a straightforward manner. Much of what I witnessed consisted in assessing and negotiating how photographic exposures could be embedded in calculative work. Thus, Nadine was guided to modify calibration frames recursively to yield forms that were meaningful in the representational spaces specific to extragalactic astronomy, including galaxy spectral energy distributions and graphs showing diverse physical properties derived therefrom. Along with these new exposures, calculative elements of diverse durability were included, from Nadine’s model of the artefactual ring and instrument-specific numbers describing the efficiency of the CCD chip to the (presumably universal and typical) spectral energy distributions of standard stars and galaxies. Nadine’s work was reflexive in an ethnomethodological sense (Garfinkel, 2002), in that her earlier actions were reassessed and modified, subject to the outcome of later operations.
Calculation
For these scientists, digital photographs were not merely ‘arrays of numbers’ but ‘arrays of measurements’. Each numerical pixel value was potentially an element in calculations that may include pixel values in other images. Laterally, pixels are contiguous with neighboring pixels as elements of visible structures. That digital photographs can reveal novelty when included in this group’s calculative work appears to be contingent on the stabilization of its other elements, so that any detected ‘signal’ can be ascribed to what the science exposures ‘contain’ – and not, for example, to an alternative shape of an M dwarf spectrum (cf. also Cartwright, 1983; Warwick, 1995). Otfried, in particular, was adamant that if images are to produce epistemic novelty, their Eigengesetzlichkeit (‘intrinsic organization’, Heider, 1926: 139) or Eigenlogik (‘intrinsic logic’, Heintz, 2010: 163, 171), must be allowed, literally, to play itself out; they must be included in computational work as elements that astronomers cannot control at will. If phenomena cannot be possibly lost, they can also not be properly found (cf. Garfinkel, 2002: 264–267).
It would seem that if these astronomers included a new element in what they considered a consistent, closed set of calculative elements and prescriptions – a calculus – they accepted its Eigenlogik. Or did they include a new element because its Eigenlogik was acceptable to them? Not only did Otfried point to a lack of agreement on the infrared spectra of M dwarf stars. He also insisted that distinct observations and modeling techniques had not (yet) adequately converged to a single form that experts in galaxy evolution could regard as sufficiently stable for inclusion in calculative operations suited to reveal epistemic novelty.
As such, Otfried did seek to escape circularity by adopting what philosophers of science have described as epistemic pluralism (Chang, 2012) or robustness reasoning, which dwells on the convergence of ‘multiple means of determination’ (Wimsatt, 2012 [1981]: 61) toward one result.
Medium
Although itself local, these scientists’ work was consistently oriented to potential future reuses of data by researchers elsewhere. Thus, Otfried was concerned that one could not get away with Patrick’s attempt of giving up on the integrity of digital exposures, and with the pitfalls of Otto and Nick’s attempt to use M dwarf star spectra and other means to include the IRAC images (an approach that had previously led to ‘dozens of wrong papers’), exhibited an orientation not only to established astronomical phenomena, but also to his assessment of other scientists’ work as well as to being assessed by others who may use the group’s data or scrutinize its findings. He was oriented to those who ‘play the same game’, and, as such, to the social order of this work, much as Winch (1990: 84) noticed that a ‘scientific investigator … must take account of two sets of relations: first, his relation to the phenomena which he investigates; second, his relation to his fellow scientists. Both of these are essential to the sense of saying that he is “detecting regularities” or “discovering uniformities”’. Concerns with the integrity of exposures, the possibility of describing work with reasonable efforts as well as with negotiating acceptable calculative elements in image processing so as to reveal stabilized phenomena are also concerns with being socially accountable.
Although not employed by these astronomers, I used Luhmann’s distinction of medium and form to structure my description of their work, referring to processed images that were deemed accountable to reuses elsewhere as media, and to established astronomical phenomena as forms. With this distinction made as an (ever provisional) end-point, a closed system of communication may seem to be in place, excluding exposures that could not be circulated or recommended for reuse. However, saying so means to gloss over Winch’s two sets of relations, which can never be separated in practice. As such, Luhmann’s account of medium and form, however insightful it is as an approach that does not posit media as fixed but acknowledges their malleability, dwells on a background that typically remains unspecified. 5
Play
If the constitution of a medium is marked by an orientation to ‘those who play the same game’, then local acts of play deserve some attention. Throughout my ethnography, including in the cases presented above, I witnessed that astronomers insisted on the need to ‘play’ with their data. They typically characterized this play as suspensions of sequential work for periods of exploration oriented toward deciding which action among potential alternatives to choose and make consequential. Researchers invoked ‘play’ when the proper next actions to take were not immediately recognizable. They used the term synonymously with ‘experimentation’ (as Otto did) or ‘exploration’. In this play one could not do whatever one wanted to but was constrained to a ‘(parameter) space’ (as in Patrick’s initial work) and by the accountability of subsequent work (as in Otto’s case).
Writers on play have noticed that it is commonly set apart from ordinary, sequential courses of activity by a metacommunicative frame (indicating that ‘this is play’; Bateson, 1972: 177-193), involving actions that are not, or not immediately, consequential, and that are often deemed reversible (Fink, 1960; Huizinga, 1955). Always done with somebody or something, and bounded spatially or by rules, play is often marked by movement in relation to a visual structure such as a field or board. Thus, as Buytendijk observes, ‘the domain of play is the domain of the image’ (1933: 129, my translation). How play will unfold is not knowable in advance; when one enters play one relinquishes control: ‘one does not only play, but is being played with’ (p. 117). Surprises must be possible.
In the work of these astronomers, the notation of the calculative elements they used provided a constraint on their efforts that is also characteristic of play. For example, Otto did not manipulate the weight map manually but adopted a calculative prescription (‘squaring all pixel values’) that could be specified, was reversible and replicable. This is one example where turning to calculation and quantification prevents a ‘proliferation of meaning’ (cf. Bastide, 1990; Beaulieu, 2002; Heintz, 2010; Porter, 1995). The generativity of differential imaging that, according to the Professor, quoted above, has transformed astronomical data analyses, belongs here as well.
On the other hand, these researchers’ orientation to the epistemic and social accountabilities beyond the local setting was unlike what classical accounts of play posit. When Otto squared all pixel values in his weight map, he may have done so solely for the sake of simplicity and for keeping an overview of his actions, but he may have also exhibited an orientation to its examination by other researchers. This would resemble what Nadine, Patrick and Nick did as they processed photographic exposures for potential reuses by other scientists. For them, doing so was part of an extended ‘calculative game’ that reached beyond mere arithmetic computations and also included visual assessments and disciplinary-specific contexts of accountability (Hoeppe, 2014). It points, through understandings of ‘reasonable agreement’ (Kuhn, 1977: 185) and of the limits of what these researchers can get away with, to the social order of this work. As such, play/experiment can be constitutive in shaping a medium for this work across sites of practices.
Conclusion: The medium as a social achievement
Latour’s (1986) notion of immutable mobiles does not distinguish between hand-drawn maps and machine-generated graphs, for example. Exploiting this inclusiveness, few scholars have probed in detail into how the medial ‘microstructure’ of immutable mobiles matters to socially shared uses. Luhmann’s (2000, 2001, 2012) relational account, which builds on Heider’s (1959) work, draws attention to the malleability of media. While allowing the conception of widely shared media, including photography and writing, as unproblematic, it also invites us to consider the constitution of a medium as something that is not given unproblematically. Resisting Luhmann’s abstract theorizing, I have considered the agreement on what a medium could be as a topic for ethnographic description, and ethnomethodological re-specification, in a concrete example from digital astronomical practice. This work unfolded in ‘suites of technologies’ (de Rijcke and Beaulieu, 2014) that include data standards, databases and electronic infrastructures. If, in this case, digital scientific images can be regarded as being ‘networked’ then through the orientation of scientists’ work to accountabilities that are, at once, epistemic and social. This is how this work straddles both constructivist and technologically determinist accounts, and this is how the unavoidably local organization of these scientists’ work reaches across sites of practice. Media, thus conceived, are a social achievement. Recognizing this may help to better understand the reusability of scientific data and its challenges.
Footnotes
Acknowledgements
I am grateful to my astronomical interlocutors for their help, patience and understanding in the course of my fieldwork. Catelijne Coopmans, Sergio Sismondo and three anonymous reviewers kindly provided very helpful comments on earlier versions which much improved this article. Financial support was provided by the Deutsche Forschungsgemeinschaft (grant HO 3986/2-1) and the Social Sciences and Humanities Research Council of Canada (Insight Grant #435-2018-1397).
Funding
The author received no financial support for the research, authorship, and/or publication of this article.