
Abstract
Public bureaucracies, in their pioneering description, are rationalized spaces necessitating “slow” temporalities of processual work. Yet, around the world focus on speed and acceleration in society at large has led to making bureaucratic time more discrete and calculable. In India, since the advent of the modern colonial bureaucracy, time has been materialized through clocks, calendars and time-sheets, yet this has not resulted in discrete, measurable time. Present attempts to calculate time depend on the production of time-tracking “real time” data, estheticized on data dashboards to track and measure bureaucratic activity. Closely following the making of time data and its circulation through mediatory devices in a program aiming to digitally control the delivery of public services in southern India, I show how this data is made performative as calculable bureaucratic time. Performativity appears in two ways, first through the materiality of ranks, standards and interfaces marshaled to produce and publicize bureaucratic time as a valorized goal and, second, the deployment of this data to create an image of an ideal bureaucrat and thereby change the subjective experiences of lower order bureaucrats. In highlighting data's performativity, this article provides a contextual account of the workings of data beyond its representative functions.
Tracking Bureaucrats: From Representation to Performativity
On the busy, traffic-snarled road connecting Cubbon Park, a colonial-origin green patch in the vehicle-choked city of Bangalore in southern India, with the official secretariat of the government of Karnataka, stands tall a digital “clock” that reports in “real time” the number of public services delivered by the government (see Figure 1). This counter's appeal is not only in its display of the quantum of government services, which seem enormous, but in the rate of their change. As with the national debt clock on the Bank of America tower in New York, effect here is produced by the rapidly changing numbers. The counter communicates a working government, a government that does not just deliver services, but delivers them with some alacrity. Powering the digital clock is a program I call Saral, 1 purportedly introduced by the government of Karnataka around 2012, to offer a guarantee of time-bound delivery of government services to its 60 million plus population and reign in errant bureaucrats by holding them accountable with the use of numbers and metrics that are circulated through public displays like the Bangalore counter as also through other online media—data dashboards, Excel spreadsheets and pdf dashboards. In 2012, Saral emerged as a technopolitical response to a crisis that the incumbent government was facing as a result of a series of publicly aired scandals of corruption. The senior bureaucrats called upon to deal with this situation by the Chief Minister of Karnataka shifted the blame to the district-level bureaucracy, away from the Chief Minister's office, and turned it into a problem of lack of citizen centeredness. Bureaucrats then put together a strategic team that came up with a measurement system by building an application program interface (API) to digitally collect data from local offices about the time taken to deliver public services. These data, it was hoped, would then be used to contain bureaucratic derelictions through punitive actions such as deducting fines from the salary of bureaucrats who had delayed work in relation to hastily established time standards.
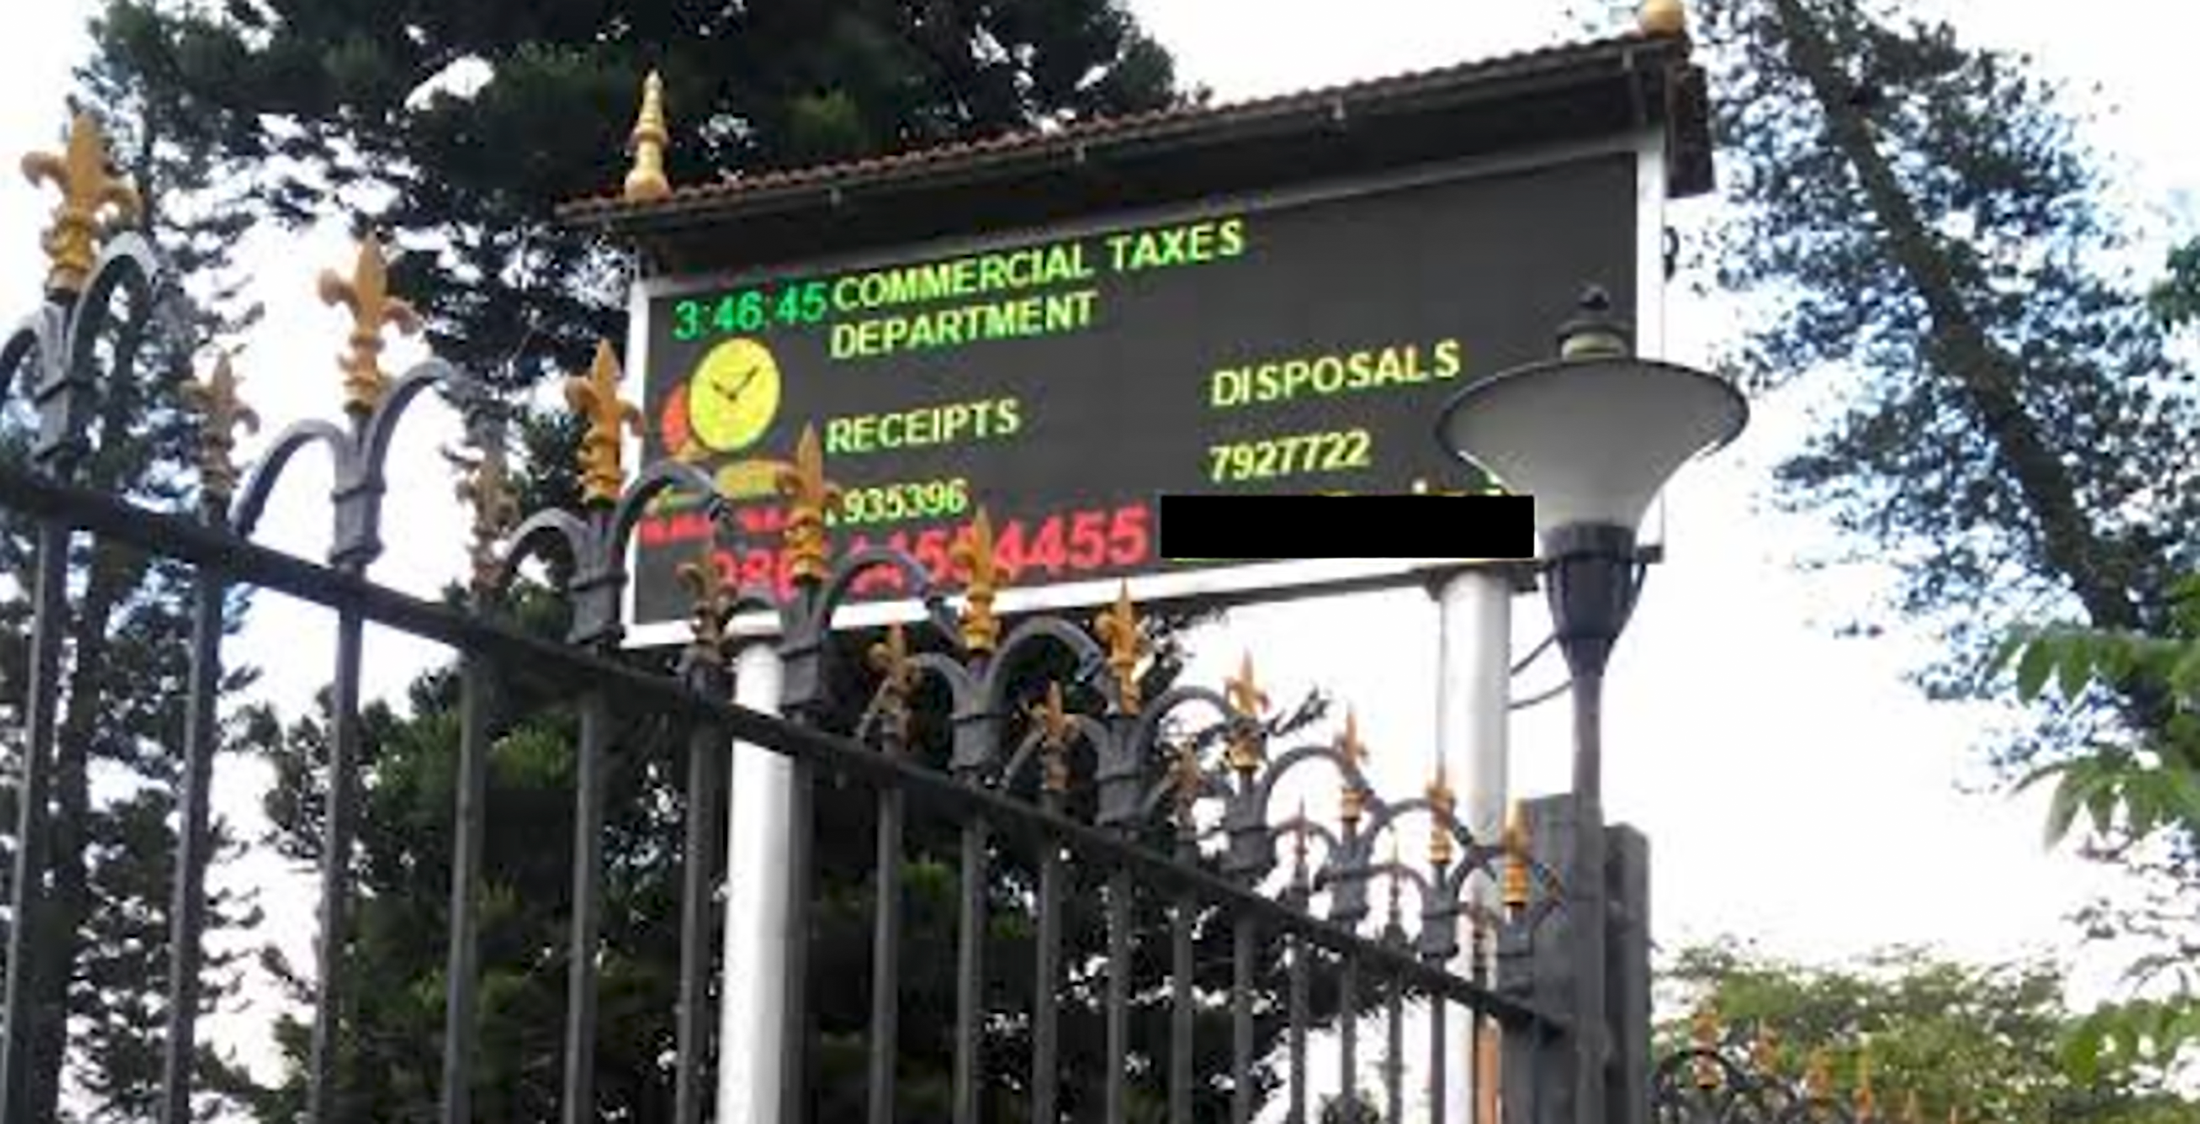
Public Services Delivery Clock. Photo by Author in May 2019.
However, as reported by multiple sources, ambitions to make bureaucracy accountable in this way quickly and quite expectedly fell flat. Observers reported the subsumption of Saral within existing informal and corrupt practices in local offices and in some other cases, the total avoidance of the data tracking system that could hold bureaucrats accountable (Kumar 2018).
By 2018-19, Saral, which began as a populist measure to recover one particular political party's poor image as corrupt and inefficient, had been promoted by successive political parties in the state and even had a ministerial portfolio dedicated to its operations. Yet there was a distinct change in focus. From the use of data as a means to usher in some form of bureaucratic accountability, the collection and presentation of data through data dashboards took center-stage. No instances of the aggressive measures of extracting fines were in sight. Instead, focus had shifted to the massive amount of data that the program had generated since inception; the technical workflow of extracting that data and the range of interpretive analysis it generated in creating an ordinal hierarchy of government departments visualized through dashboards. The architects of Saral won awards for the program's technical and process innovation, with less attention paid to the success of the program in upholding citizens’ rights to timely government services.
In Saral's original conception data may be seen as a representational medium for expressing bureaucrats’ lack of adherence to time. In the latter, data in Saral take on a more performative form, by bringing in the image and value of a metricized, number-oriented government, unhinged from its original function of using data representationally to fine bureaucrats.
Data are made to do performative work in Saral through a conjoined process of first creating standards and indicators, and then deploying them over a range of actors and interests. First, in responding to the program's failure to bring about a data-driven form of accountability, the bureaucratic and technical architects of Saral attribute the positive value of incremental change to the process of data creation, extraction and visualization. This is best captured in their recurrent use of the term “at least,” They claim that even if Saral did not lead to substantial change in the ground, “at least” it introduced a measure of bureaucratic time that had not previously existed. These architects often publicly stated that never in the history of the Indian bureaucracy were metrics created to measure time. I term this valorization of quantified time calculable bureaucratic time. It also signifies a deeper application of corporate ideology in the management of public bureaucracy than what had been previously attempted, as measuring time produces an idea of a measurable bureaucracy, or the valorization of a singular calculable time within bureaucracy. Second, the emergence of a range of interpretative analyses derived from Saral's data has effects on bureaucrats. The performative use of data reframes communicative relations among hierarchical orders of bureaucracy. It produces new opportunities for subjectifying bureaucrats by using communicative technologies to generate a discourse of acceleration, not as disciplined subjects made to pay for their dereliction—as the program's initial goal had suggested—but as subjects molded by the pressure of competitive rankings introduced by Saral.
Performativity and the Politics of Data
This article aims to unravel the materiality of calculable bureaucratic time and its effects on bureaucratic subjects and normative ideas about bureaucracy, by foregrounding the performativity of data in the context of a digitizing public bureaucracy in the Global South. Performativity is deployed in Science and Technology Studies (STS) to show “the institutive capacities of scientific and technical knowledge and the types of realities that are brought into existence or modified” (Muniesa 2014, 10). As Bruno Latour has stressed (1999), the performative is as “real” as the represented, and unravels multiple forms of knowledge and effects. According to Michel Callon (2009, 18), STS has shown that the performative aspect of these knowledge avowals cannot be dissociated from the “arrangements or agencements involved in the[ir] production.” Performativity helps focus on the making or materiality of those techniques, bureaucratic processes and agents that shape technical knowledge claims, in this case the claim made by Saral's architects that calculable bureaucratic time is a superior and novel form of knowledge in governing errant bureaucrats.
While primarily a theory of language, discourse and its pragmatics, performativity in STS has material dimensions. In Saral, new material modes that objectify bureaucratic time such as data dashboards exhibit forms of calculation and acceleration, performing effects that are visible attempts at refashioning the subjectivity of lower order bureaucrats. Thus, a second way in which this article draws on performativity is by analyzing the use of quantified data to signal legitimacy and authority over subjects. In the sense deployed by Judith Butler (2006) and Vikki Bell (2006), performativity can be used to show how quantified data are made to construct the institutional lives of bureaucrats. This idea of performativity depends on an ongoing performance of the thing, the making of an impression (Goffman 1959), which allows us to make sense of the material and discursive strategies adopted in promoting the value of calculable bureaucratic time, which is picked up by other actors to envision bureaucrats subservient to a regime of metrics.
As Pereira (2019, 354) reminds us, it is necessary also to draw up the limit conditions of performativity in science and technology, as the enactment of specific knowledge claims is always subject to social and political constraints. Although Pereira's aim is to point to situations when attempted performativity turns into “non-performativity,” I take their provocation to develop a contextual understanding of the performativity of technological mediation. In How to Do Things with Words, J. L. Austin (1975) describes the “felicity conditions” within which performative statements take meaning. Saral's shift from a representational idiom to a performative one also becomes legible within a set of felicity conditions that might be termed “dataism” (Söderström and Datta 2024). While “dataism” in India mirrors the global “belief in the objective quantification and potential tracking of all kinds of human behavior and sociality” (Van Dijck 2014, 198), it must be understood in a “relational” sense connected to specific “cultures of computing” in the Global South (Mertia 2020, 9). For the contributors to the edited collection Lives of Data, what digital data are and what they do cannot be divested of the contingencies which bring it to fruition. For instance, the proliferation of digital data and data dashboards in India is intrinsically linked to the liberalization of the Indian economy in 1991, which allowed for the entry of private digital technology vendors and consultants in state projects that afforded new means and incentives for collecting and analyzing data (Mertia 2020; Shah, Rajadhyaksha and Hasan 2022).
Similarly, while Saral's effects must be apprehended through “material-discursive” objects (Barad 2007) such as dashboards, the conditions of its emergence must be located in a broader, relational context, as scholars of science and technology in non-Western contexts are drawing attention to (Philip, Irani and Dourish 2012; Mertia 2020). For example, Saral's performativity is undergirded by a desire for calculation, but this must be located in a broader politics, as “calculation has dramatically reinserted itself in contemporary debates” in India (Sundaram 2020), after originating in the colonial logic of governance. At the same time, as Samdub shows (2022), the valorization of digitally mediated numbers proliferates by suppressing government statistics produced within slower temporalities of knowledge generation.
The conditions underlying the performativity of data have too often been attributed to a single source. For instance, Blouin (2020) locates the performativity of ECHI data in database architecture, while Currie (2020) locates performativity of open data maps in the US in their esthetic, visual presentation, backgrounding other “political” factors at work. In other cases, automated digital technologies have been seen as singular sources in producing performative effects of a crisis of legitimacy and comprehension among its users in state organizations of the West (Crawford and Schultz 2019; Calo and Citron 2021). While drawing on this work, I aim to provide a deeper, more relational understanding of the conditions that power Saral's performativity, connected to concerns in both digital and pre-digital India—that is, in a culture of hybridity, partial automation and continued presence of human discretion and agency. By framing shifts in Saral's approach to data as a performative turn, this article makes explicit a situated politics of data in the “ideological discourse” of “e-governance” (Mazzarella 2010, 784) that has too often been analyzed within its own avowed aims (Heeks and Bailur 2007).
Methods
The article draws from empirical data generated within the Saral program in Bangalore, India. Between April and July 2013, I studied the implementation of the program by locating myself in three bureaucratic offices where time-related data were being generated. I conducted 40 interviews with computer operators and lower level bureaucrats in charge of clerical work, office managers, and heads of office around the nodes of service delivery that Saral was guaranteeing. I also observed the receiving of applications and computer work in the kiosks in these offices and surveyed government orders, reports and other published material on Saral. In the following years, I kept track of news on Saral in local newspapers and have had a Google Alert active for Saral since 2017. Between September 2018 and June 2019, I spent time observing the working of computer kiosks and the making of data, and interviewed three management consultants, who had worked directly with a senior bureaucrat in designing the dashboard, along with interviewing bureaucrats charged with overseeing the functioning of government services under Saral. My study of Saral was embedded within a larger ethnography of the digitization of administrative bureaucracies in Karnataka, which introduced me to the use of Saral by specific senior bureaucrats and the response generated by lower level staff members within a district bureaucracy.
The Materiality of Measurement
Ever since modern forms of government bureaucracy emerged in India during colonial times, procedural reform has been one of their repetitive features (Taylor 1920). Historically, the control of societal time through mediatory artifacts, such as clocks, is also found in the development of modern bureaucracies, but the modes and techniques of this intervention as well as their ambitions were different from the development of capitalist time in factories or firms. Fredrick Taylor's (1911) time and motion study using stop clocks to measure productive time, a famous example of the mediation of time through devices, was never applied to the work of modern bureaucracies, even as the ethic of saving time through a commitment to productivism (Scott 1998) was central to the moral claims of public administration (Weber 1978). As Paul Du Gay (2000) reminds us, distributing resources fairly requires precision, which necessitates a certain slow, procedural temporality of public bureaucracy that is not amenable to quantification. Material attempts at controlling time with clocks, calendars, typewriters and computers have been subjugated (in part or in whole) to this ethic of procedural flow, producing not quantitative but “qualitative and socially constructed aspects of working time” (O’Carroll 2008, 181). In other words, even as logistical media has come to intervene in the work of public bureaucracy, it has not necessarily led to the production of logistical or discrete time.
Saral focuses on measuring time in bureaucracy and making it calculable. Speed and acceleration as valued temporalities of societal processes (Wajcman 2015) have become central to a new politics of the pace of government, in which quick policymaking and speedy bureaucracies are marked as a new horizon for an aspirational public (Rämö and Skålén 2006). Time has gained a new salience in public politics as an object of critique. For instance, at a parliamentary level, the slow, labored processes of democratic law-making are being ridiculed and substituted, in many instances, by speedier executive processes, around the world (Glezos 2013; Vostal 2019).
However, even as Saral, backed by metrics and digital data, is connected to these new urges to accelerate government, it is also responding to an age-old distinction between a higher, urban born-and-bred, modern Civil Service, portrayed as time-sensitive and time-bound, and a lower, custom-bound, rural bureaucracy, seen by the former as wasteful of time (Kaviraj 1984). The senior bureaucrats in charge of Saral, who are representative of the former, invoked this distinction to justify the introduction of a measure to track time, arguing that it was not the council of ministers who were corrupt, but the lower order bureaucrats sitting in district offices who needed to be kept in check.
Saral must also be connected to a longer history of post-Washington Consensus bureaucratic reform (Bussell 2012), which over time has moved away from deepening accountability mechanisms and more toward producing indicators and metrics, that is, tools for visualizing reforms (Samdub 2022). Following the recently adopted maxim of “maximum governance, minimum government” the state's role in ushering reforms has become “to deregulate and make space for private actors … or to use its coercive apparatus to set up infrastructures for the collection and visualization of data” (Samdub 2022, 485).
The politics of Saral, which is also a form of data politics, understood as the consequences of data on relationships that generate modified forms of performative power (Bigo, Isin and Ruppert 2019; Söderström and Datta 2024), are materialized through the selective assembly of standards and methods of data extraction and presentation. Excavating this is a matter of “infrastructural inversion” (Bowker 1994), as more recently applied within digital STS frameworks (Ribes 2019) to the study of the imaginings and politics involved in the presentation of data hitherto available to select “inner” circles, to larger publics (Loukissas 2019). This is also a question of enactment. In the context of Saral, enactment or how an object comes to be stabilized requires an engagement with the materials and discourses that constitute bureaucratic time as a calculable object. STS scholars have studied the role of artifacts in generating new temporalities that irrevocably shape people's perception of time. For instance, STS scholar Ruth Müller (2014) has looked at the acceleration of life in academic spaces under New Public Management. In describing the pressures on academics to perform productivity, Müller developed the concept of “anticipatory acceleration” to indicate how the pressure of acceleration leads to future-oriented behaviors. Data dashboards displaying time metrics may be seen as a medium for anticipatory acceleration of this kind, as bureaucrats are expected to accelerate their work in response to the visualization of their temporal rhythms. Analyzing Tony Blair's much popularized “Number Ten” governance dashboard, Bartlett and Tkacz (2017) point to the work of dashboards in producing digital aggregates that are repurposed to shed light on people and things for governance. The materiality of Saral connects with the mechanisms that power these dashboards such as use of APIs and real-time data, thus linking it to a broader, worldwide investment in dashboarding life (Tkacz 2022) and governance (Stehle and Kitchin 2019).
Making Standards, Generating Data
Saral brought within its fold a host of government services, assigned a time standard to each service and then proceeded to measure the delivery of every instance against that time. The accompanying two-dimensional dashboard (see Figure 2) hosted on a web platform was akin to dashboards encountered in other sectors: visual representations of multiple data points (Tkacz 2022, 7). The data in this case were ever-changing indicators, such as applications “received,” “disposed” within and outside the prescribed time, and those “pending” beyond their stipulated time, as a diagnostic of the ongoing reform initiative. Data from the dashboard were used to generate analytics—ranks, indexes and temporal comparisons, which circulated among senior bureaucrats, politicians, and the media.
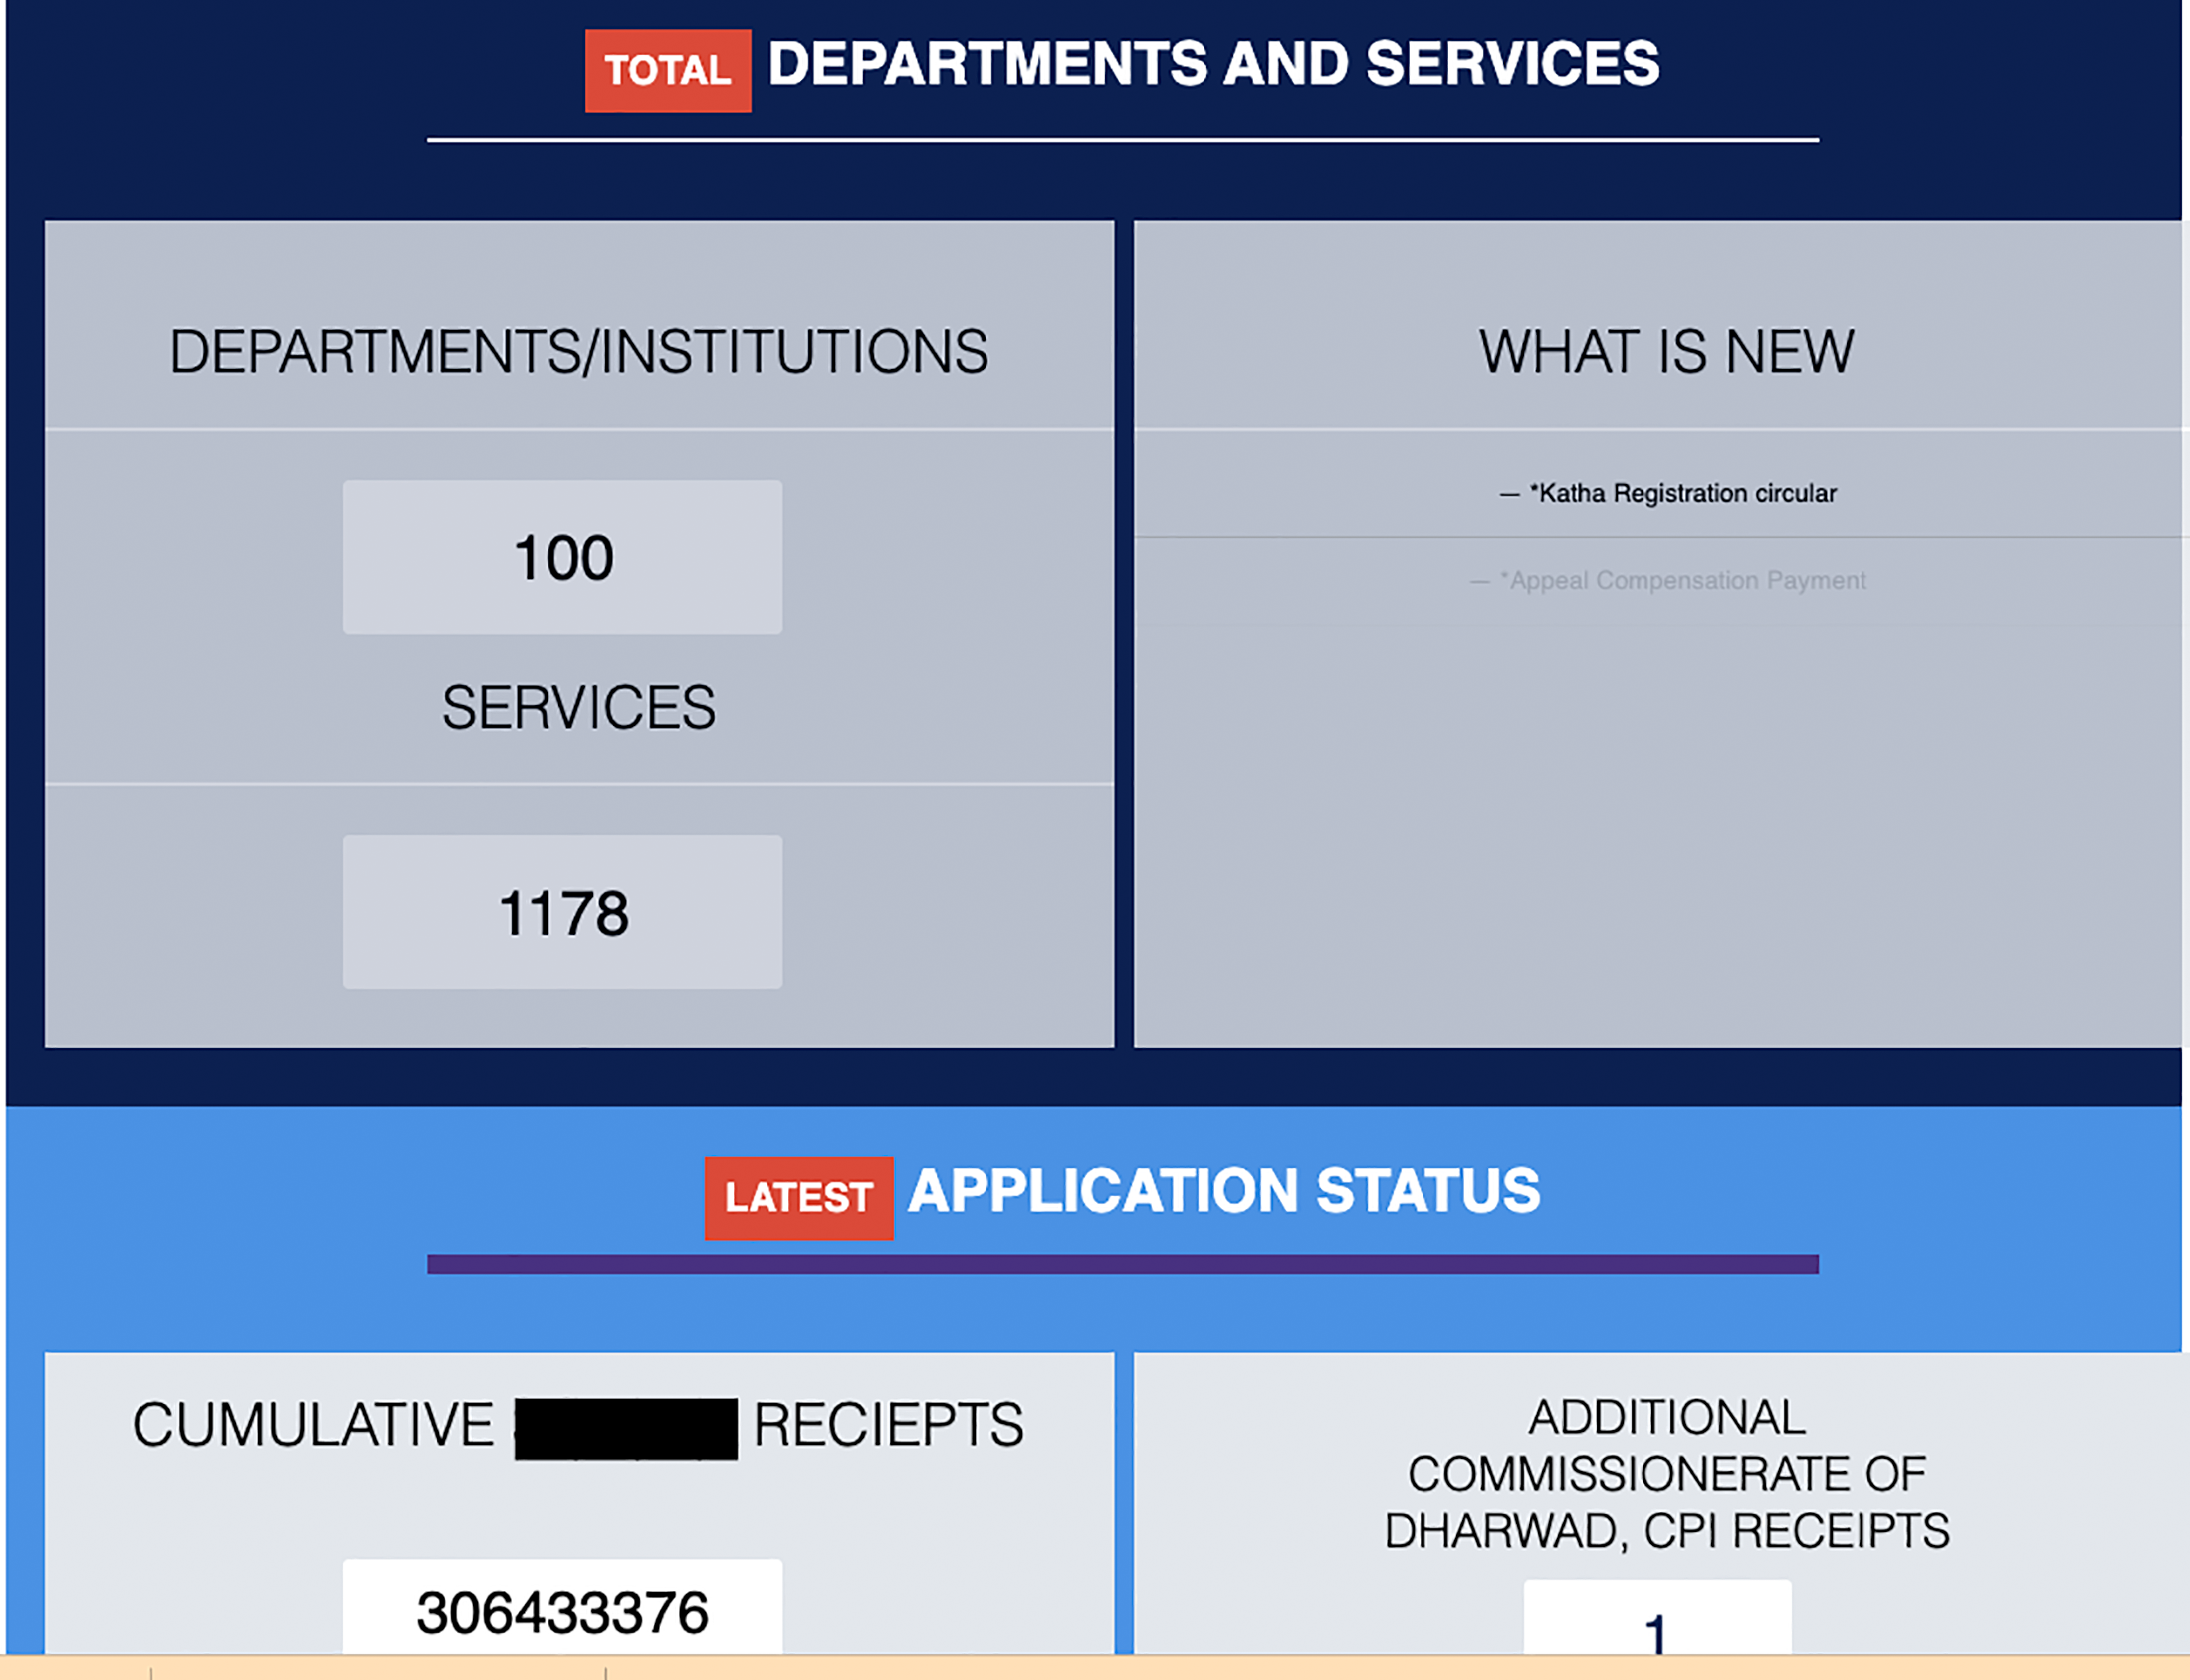
Saral Dashboard. Screenshot by Author on May 31, 2023.
The senior bureaucrats who oversee Saral, aware of the density of time enmeshed in bureaucratic work, extolled the virtues of making incremental progress. They invoked the term at least to explain how Saral made every application at least trackable, and even if dates of processing applications were not guaranteed, it at least provided an expected timeline of whatever could be determined.
This sentiment was repeated by the consultants. They argued that even when dashboards were not ushering in permanent change in their offices, they at least marked a beginning for the collection of data around the time taken to deliver services, or at least lower levels were forced to encounter a tracking mechanism, or at least districts were being ranked which might spark a desire to improve services. This framing was also used to point to novelty—never before was the time of their office staff measured in such a discrete and objective way, akin to factory work. The presentation of time metrics depended on identifying the time for each service, broken down by its component parts, against which the performance of individual services and offices could be measured.
A preference for presenting data rather than the methods and contexts in which data was produced was evident in the calculation of time standards. Dashboard makers were not concerned with how much time a service should take, which was the first step in developing the indicators presented by the dashboard. According to a consultant: the undersecretary was the one who defined the timelines. There was a nomination of some undersecretary from each department and he would be the one who would kind of gather this information and be the one who would do the negotiation between us and the end department … he was the guy to fill in the document and give it to us. We were never in the business of setting timelines. We were only in the business of measuring adherence to the time line.
Another consultant doubted whether much attention was paid when thinking about timelines, but he was not hugely concerned with what the departments decided for themselves, as long as there was information on time a service should take. The time committed was bottom-up to the extent any undersecretary would have done it (laughs) … and we know how it would have been. Even seasoned and well-meaning bureaucrats can’t get bottom-up done. It is what it is, right. We want to measure ourselves by meeting the timeline. You can’t measure anything in government. Or, you know, they would only want you to measure what they want you to measure. Measuring something was kind of drastically new. In some months [Saral data] went missing because, you know how the government functions.
Time for services was arbitrarily estimated, in many cases estimated more than would normally be taken for that service by that department. In some cases, when departments underestimated time for services, their representatives did come back with new timelines after realizing they had overcommitted. As departments determined each service's time by adding up the time that would be needed for each step of the process (Figure 3), in some cases service time was overestimated because of departments incorrectly including additional steps to complete a service. In other words, the work of sorting out how much time a service should command was not carefully determined as there was no established way of doing so, but that did not stop the business of measuring and conducting month-on-month comparisons on the dashboard. A third consultant pointed not only to the arbitrary ways in which time standards were determined but also to confusion about how measurement should happen: There were so many departments that interpreted the API differently, so they were sending wrong data, which gave us a wrong picture. For example, someone had put in an expected timeline of one year, so that they never actually exceed their prescribed timeline … . In other departments there is an option, which still remains a problem for some departments till date—if the application is pending on a citizen, then basically you should stop counting the timeline, and resume it when the citizen has acted upon it.
Once the services to be tracked and the standards used to measure them were set, the business of measuring data was set in motion. The production of data on service delivery times ran parallel to the service itself, without much overlap. This separation helped to create data about services without interfering with the regular bureaucracy that ran the services. Crucially, this was achieved by a physical separation between the computerized environment in which data for the dashboard were produced and the regular space of bureaucracy where files pertaining to the application were worked on, as in Figure 4.
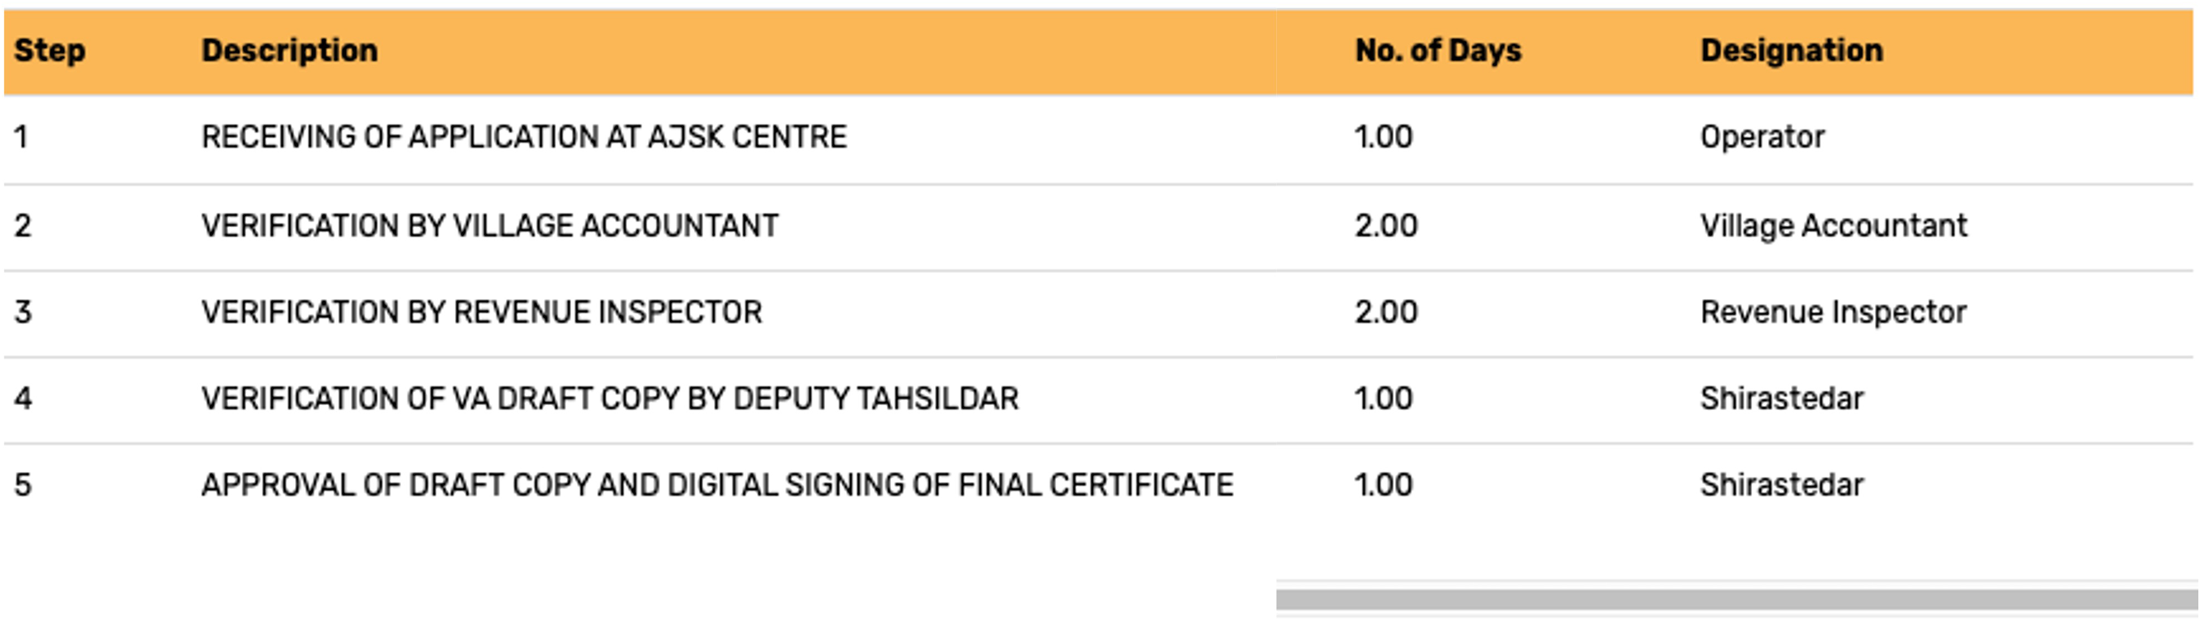
Breakdown of Time by Service Component. Screenshot by Author on May 31, 2023.
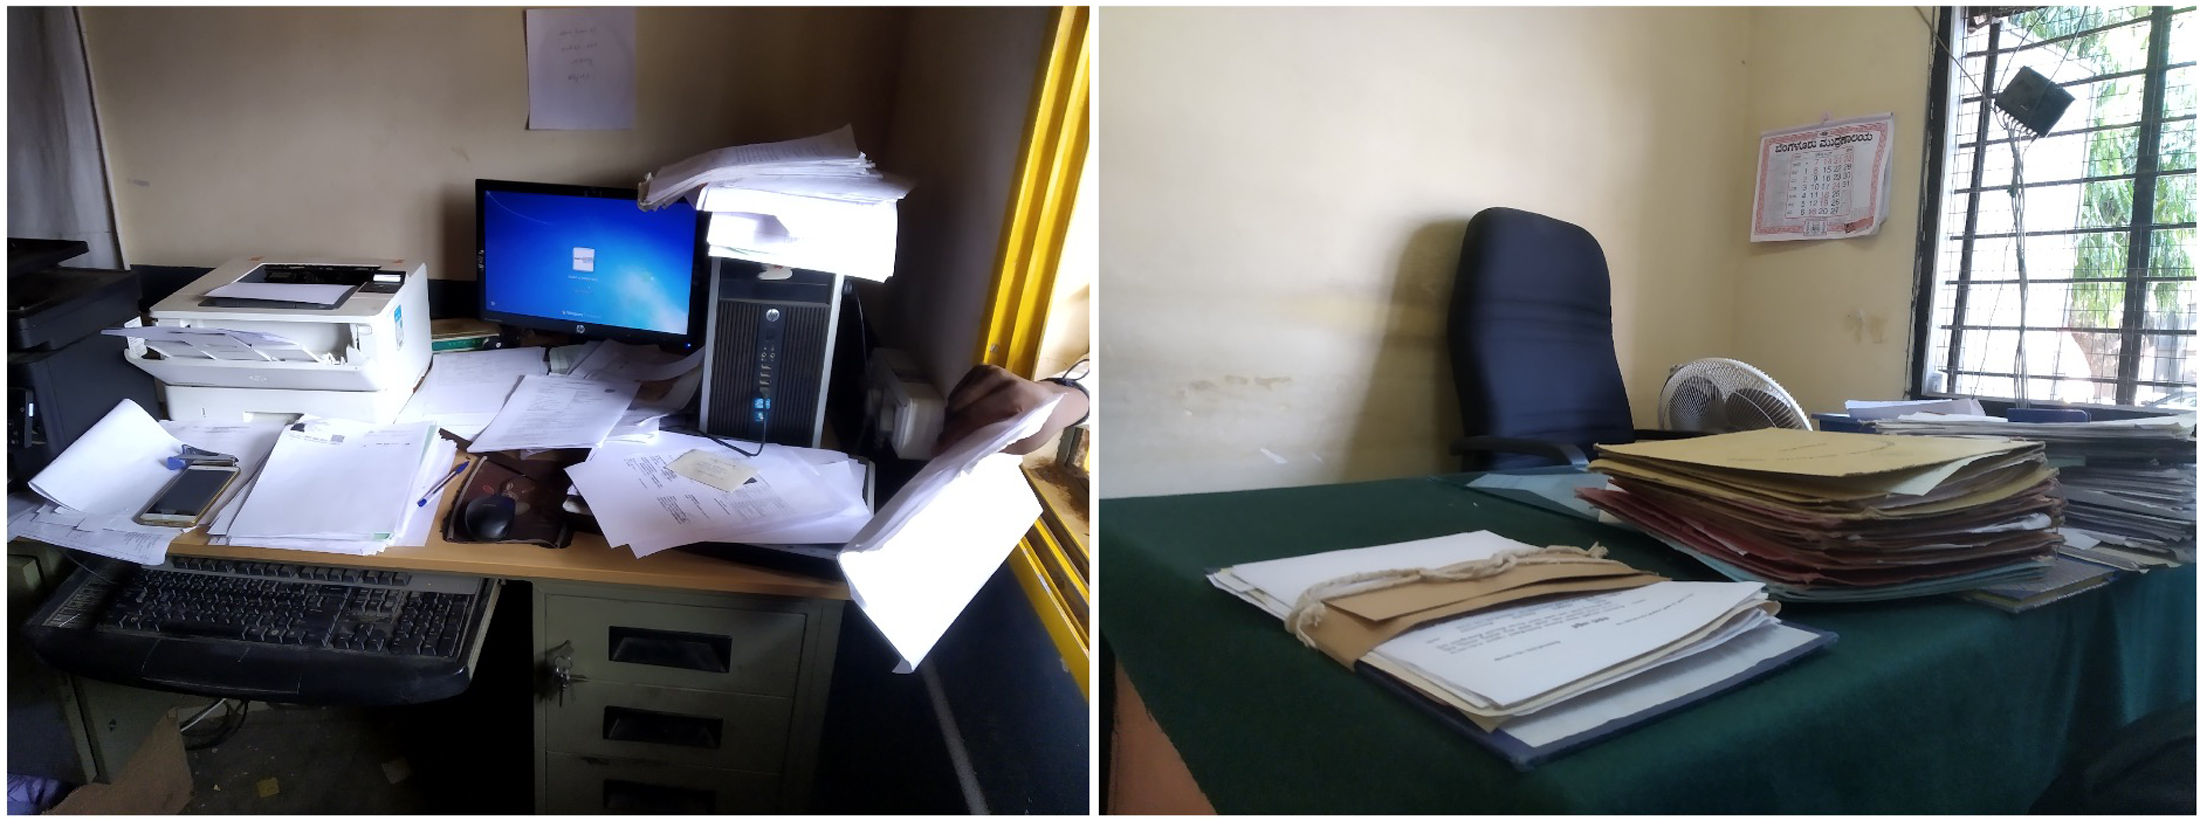
A Data Collection Kiosk on the Left, and a Bureaucrat's Table on the Right. Photograph by Author in May 2019.
Disposal Index Generated From Services Data. Screenshot By Author on July 19, 2019.
Tracking a service [such as the issuance of an income or caste certificate] required first that an application for the service be made by a member of the public at a computer kiosk, which were run by poorly paid, contractual staff, logging in the date and time when the request for a service came in. However, once the service was logged, the “file” which consisted of sheets of documentation that the applicant had submitted and collated under a bureaucratic form, was sent to a bureaucrat's desk, who then went on to consult their own paper records and conduct on-site verifications when needed in order to process the application. Once complete, the file was brought back by attendants from the bureaucrat's table to the kiosks where the computer operators then logged in the date and time of service completion. I never saw a bureaucrat enter information into the screen themselves, some citing inability to use the computers, others pointing out plainly that it was not their job to enter data into the computers. The measurement of time did not interfere with the working of bureaucracy, with the separation between the bureaucrat's table and the computer kiosk allowing for continuing entrenched ways of working, while also generating time data that served an image of a transforming bureaucracy. The architects of the dashboard I interviewed believed that this was an ingenious strategy. Having spent several years administering offices, they were acutely aware of bureaucrats’ temporal practices and stayed clear of meddling with them, while still developing a technological mechanism that visualized productivity. The creation of data in this manner is not akin to “data fabrication” or falsifying data described in other Global South contexts (Kingori and Gerrets 2016), but is rather descriptive of a situated, contingent materiality, evocative of the politics that shape data.
Visualizing Time Data Through Dashboards
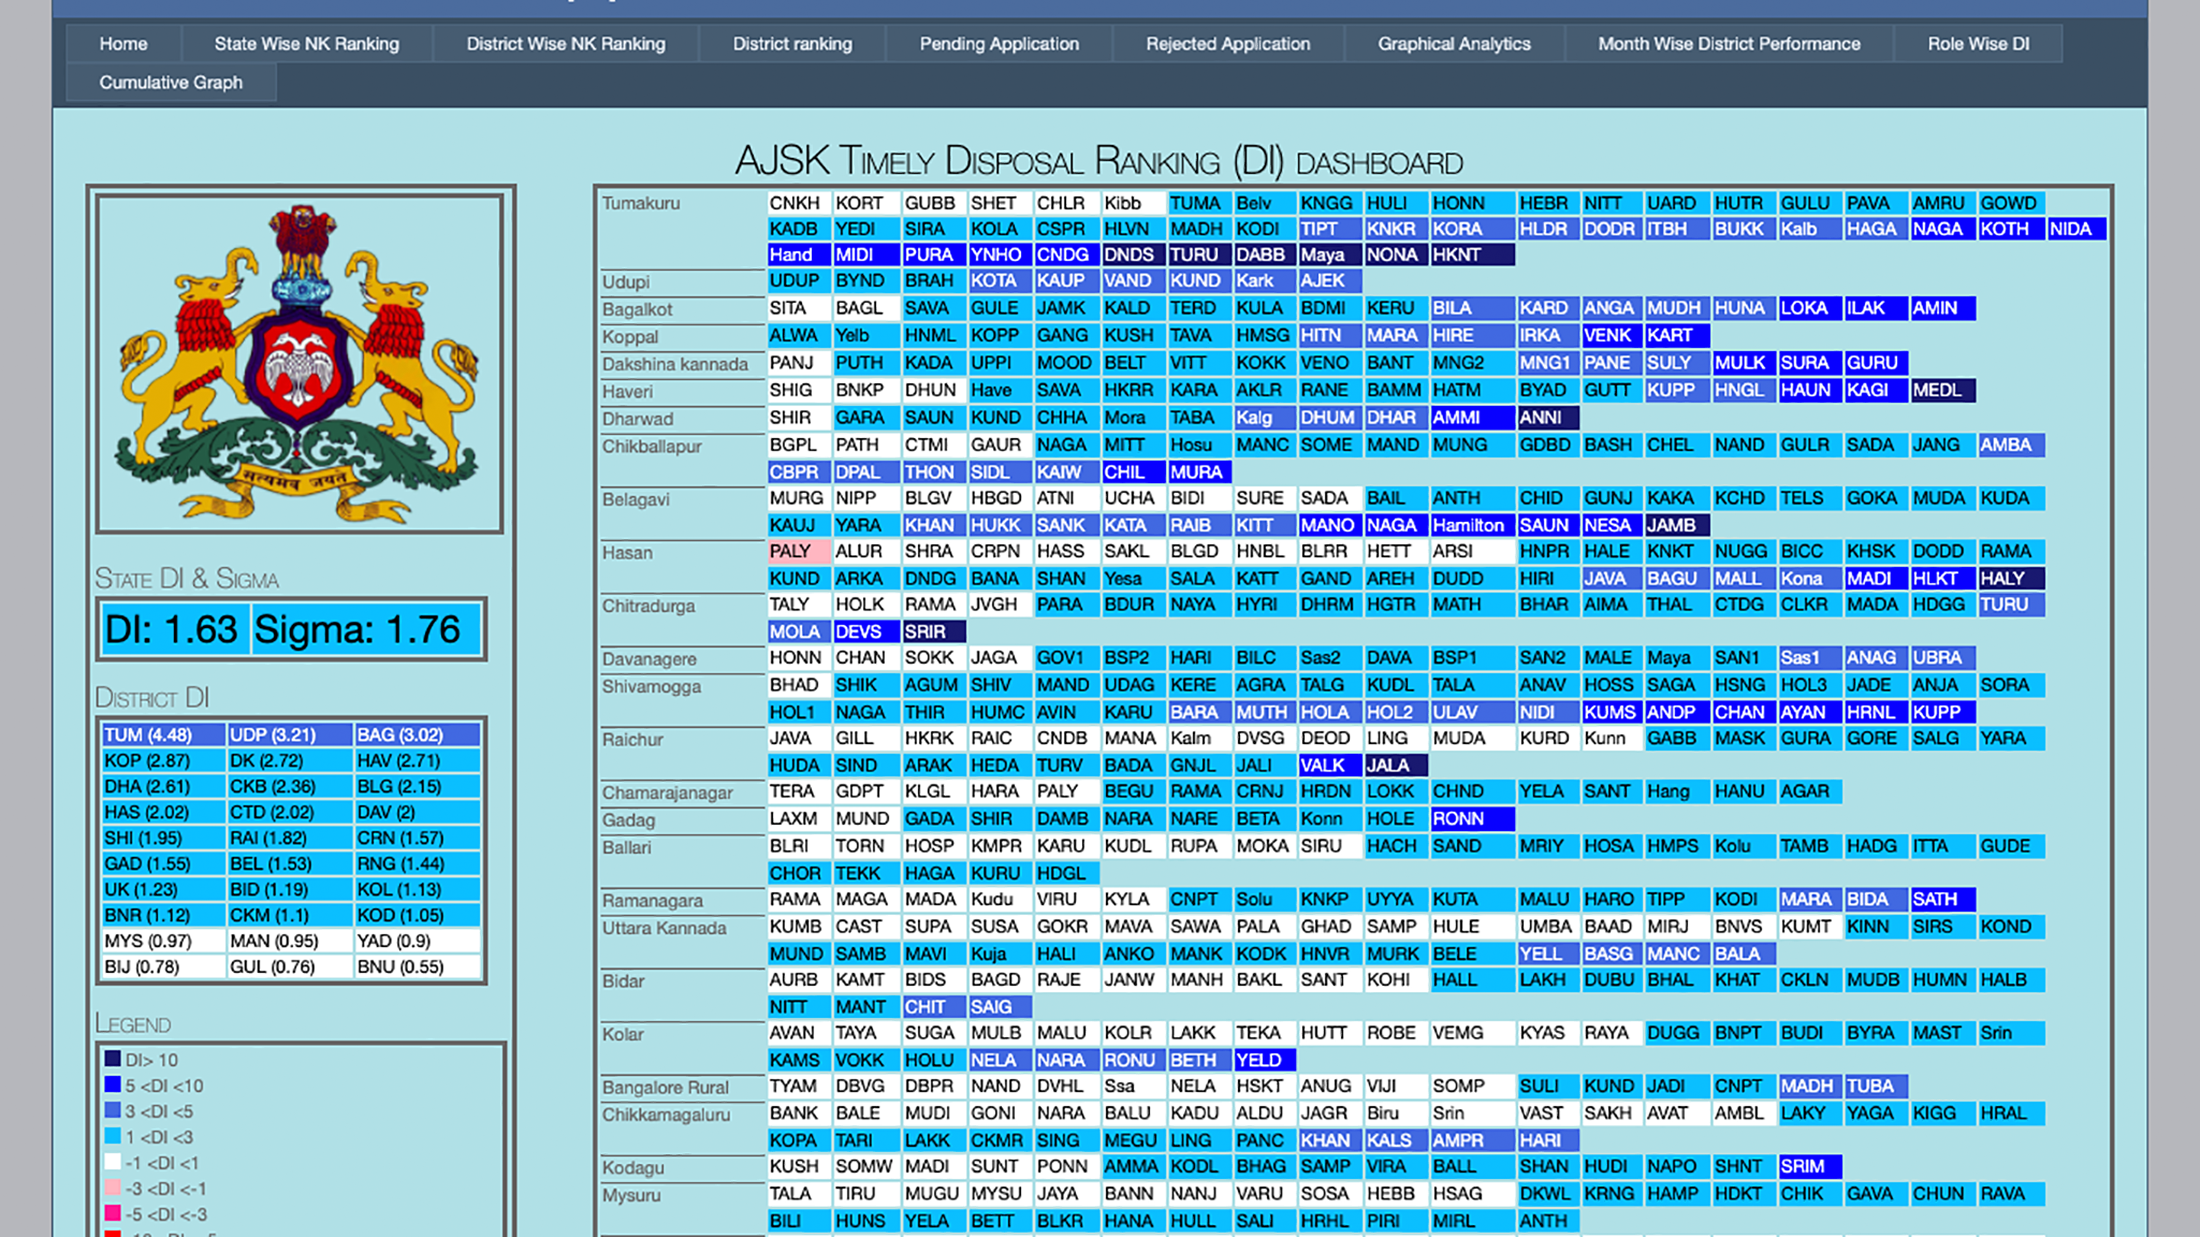
The presentation of time metrics took the form of a higher order analytics, in which data about service delivery timeliness are further represented as a sign of incremental change. An example of this is the “Timely Disposal Ranking,” which ranks administrative offices against a standard benchmark, color-coding performance Figure 5.
The dashboard calculates a “Disposal Index” or DI to rank districts. The DI represents “How many times faster than Prescribed” time for the listed services are offices delivering services. The greater the DI, the better the performance. There are color-codes for different ranges of DI: a DI greater than 10 is color-coded black, and below 10 is color-coded magenta. This color-coded scheme changes every time the server is refreshed, suggesting incremental change. The DI is used to compare offices under one district with another. Here too, less attention was given to how this ratio was identified and what it signified. Going behind the numbers revealed that the ratio is created by adding up all the time taken to deliver services in an office at a given point in time, divided by the total time prescribed for the same services that the departments had identified at the start of the program. While this might appear as a fair comparison, my experience in the offices revealed that the time taken to deliver individual services is determined by contextual factors that are not consistent across offices. For example, the bureaucracy is not exempt from pressures from local politicians to serve a particular clientele when it comes to the requirement of a service, such as land ownership records, thereby impacting the time it takes to deliver that service to applicants. Some applications are de-prioritized over others only because they may not have adequate support from local politicians (Bussell 2012; Gupta 2012). These contextual practices change by office and by service, which a comparison of cumulative scores does not adequately capture.
The summative powers of the visual display give the representational aspects of the dashboard an air of legitimacy. They also lead to an esthetic of data as viewed on dashboards. In Karnataka, visual representations of analytics found their way into reports that were sent to the Chief Minister and to bureaucratic leaders of administrative districts, who used them to create their own narrative of accountability and intra-district competition. District commissioners looked up analytics, which were sent to them periodically on their mobile phones. The visualized metrics found their way into Microsoft PowerPoint presentations made to senior ministers, sometimes a monthly affair, involving a wide variety of people including local media journalists.
Visualizing metrics of incremental change on dashboards serves the purpose of intermediate reporting and displaying improvement to various audiences. They are less about representing a stable, accelerated, epoch of governmental time, and more about investing in change. The dashboard is a platform for showcasing this visualization because, as a visual device it has a “cognitive function,” as Tkacz (2022, 9) reminds us. Dashboards are meant to produce thoughts and action among people of different persuasions, depending on the context. The visual descriptions on time-measuring dashboards described here initially aimed to make the voting public think that their respective governments were improving the pace of work—a sentiment that the architects of the dashboard hoped would translate into more votes for the party in power. But the data on these dashboards were also enrolled into a project of molding bureaucrats in the image of their own data, through multiple discursive strategies, which both proliferated and were resisted.
Impacting Bureaucrats: Accelerating Bureaucratic Work
The production of a single calculable time through the generation of data and subsequent presentation through dashboards has effects on bureaucrats. These effects, however, need a conceptualization different from the accounts of bureaucratic transformation brought in by, first, by computerization (Zuboff 1988) or databases (Hasan 2024), and later, algorithms (Eubanks 2018) and social media (Johns 2021). While these accounts are based on significant material changes to the work of bureaucrats, Saral, as I described above, deftly avoided interfering with bureaucratic procedures, as its operators went about collecting the data that powered its calculations of bureaucratic time. Rather, Saral represents a mode of governing public bureaucrats through the collection of digital data and its promotion through engagement with interfaces. Saral can be said to be “eliciting, conditioning and directing human behavior” (Johns 2021, 54) but not through pre-determined computational rules in the form of algorithms or “algocratic governance” (Aneesh 2009), nor through the platformization of governance, i.e., assembling laws, codes and technical materials into a singular form. Saral's effects on the subjectification of bureaucrats through its material-discursive performativity may be best understood through Butler's (2006) description of performativity as emerging in a symbolic system of power relations. Categories and systems of comparisons created out of Saral's quantifications are put to symbolic use to shape bureaucratic subjectivity.
To understand how the creation and presentation of time-metrics data is put to the work of modeling bureaucrats in the image of data, we turn now to the circulation of these data through the capillaries of political and bureaucratic institutions. Drawing on a globally circulating desire for “open government data,” the approach taken by the management team was to “put out” these data, as recounted to me by a management consultant. This commitment to openness took the form of making dashboards available for public viewing but also, as mentioned above, channeling specific aspects of the data from the dashboard to department heads. In public interviews, Saral's architects stressed the availability of district-wide rankings and the responsibility of district commissioners to maintain district-wide rankings, which would lead to competition among district commissioners.
In September 2018, a commissioner of a district outside Bangalore set up a weekly online meeting with their 400-odd staff through a mobile conference calling application called “grptlk,” to monitor their work. In these calls, they aimed for informational transparency from his audience by focusing on “why” questions that the documentary apparatus was not set up to answer clearly: why were records not updated, notices not sent, or data not entered? The very reason why grptlk was installed, the commissioner had noted to a newspaper journalist, was to resuscitate information that should have traveled up from multiple sub-offices that constituted his district administration but had stalled in the quagmire of paper. A common device they used for measuring employees’ progress was information sent by their “technical consultants” from the Saral dashboard. This daily report, sent via WhatsApp, relayed the status of receipt and disbursal of services offered by the revenue department, of which they were the head. Their focus in these meetings was to reduce “pendencies,” that is the number of applications not marked as “complete” on the Saral dashboard, as that pushed down the district's ranking. For instance, in one meeting they said, When I did the meeting last month, you brought pending application down from 82 to 8, but today overdue pendencies are 52. I request the concerned RRT shriestadar [Office Manager] or Grade II Tahsildar [Head of the office] to complete this. If I see anyone pending in Saral in future, I will initiate action on the concerned people. Nobody should take these pendencies to overdue.
In another instance, they said: In Saral after the due date 744 applications are pending. Last month we used to have only single or double digits like 45 or 50, but this month it is 744 pending. It shows that no Grade 2 Tahsildar is working.
Sometimes, they would be more congratulatory: Congratulations to our revenue staff because on 1st August in Saral we were in the 28th position. Now we are in the second position in the entire state. We didn’t come first. There is only one district above us, which is Udipi. You brought us from 28th to 2nd so by 5th August, next Saturday, I hope we will be in the first position.
The district commissioner's fixation on ranks and numerical improvement was indicative of a pressure they were facing from their superiors, who were also receiving Saral's rankings. While they wanted their staff to work faster and complete pending applications so that their district's ranking always remained high, they were constrained by their distance from these offices and their inability to meddle with work. Their threats of “taking action” against errant bureaucrats could not be carried out as it was beyond the realm of the power of their office.
2
In the absence of punitive powers, the commissioner took to supervising staff work by getting them to send out discrete pieces of information in what they called the “format,” most often pdf documents or Excel sheets sent through WhatsApp. The format aimed to extract discrete amounts of information pertaining to the services being tracked by Saral, with quick turnarounds from staff, attempting to accelerate slow, measured, bureaucratic cultures of verifying and recording information. For instance, to speed up processing of applications related to an Old Age Pension Scheme by the government of Karnataka, they asked staff to fill out this information in a specified format: I will send out the format on WhatsApp. According to that, enter names of all the people who are not alive but are getting pensions in instalments. Find out their serial number in the voter IDs and their serial number in their ration cards and put it down in the format.
Another time, for applications related to demarcating land for village graveyards and solid waste disposal they told their staff: For all graveyards and solid waste disposal, through WhatsApp groups I will send you a list of villages in which this should happen … your Tahsildar will forward it to you. By next Saturday, you all should send information to reserve land for graveyards and solid waste disposal
Staff, in particular village accountants, considered “street-level bureaucrats” (Lipsky 2010), the lowest rung in the district bureaucracy, were the main targets of these tasks of speedily collecting and sending information. They in turn contrasted the slow work of recording changes in physical documents, which they have been historically entrusted with (Smith 1996), to the immediacy with which data about the villages under their administration were required to be produced and circulated through digital media. The immediacy of WhatsApp and the mechanisms built into it to demand at least a quick response, if not accountability, pushed village accountants to nurture a parallel system of contract labor 3 to fill in data in the formats that proliferated through their work-day. Thus, the calculative performativity of measuring bureaucratic time made senior bureaucrats competitive and insecure about ranks, which in turn led to the expectation, materialized through communication devices such as WhatsApp, that staff operate in an accelerated work mode, a style at odds with the layered and slow process of bureaucratic work. Even as this imposed acceleration was resisted by offloading work onto a burgeoning group of contractual staff, the performativity of Saral, its ability to spur a host of responses that attempt to modulate both existing work practices and bureaucrats’ relationship to their work, are made visible. Scholars have noted that visual interfaces are made to prioritize data in such a way that one kind of information suppresses other forms of information and knowledge (Samdub 2022). Similarly, village accountants pointed to their neglected writing records and registers, a documentary mainstay of the administration, to highlight the debilitating effects of digital media and competitive rankings on the production of administrative knowledge about villages under their jurisdiction. They argued that a culture of bureaucratic writing was being diminished by the dissemination of discrete data unhinged from the bureaucratic record. These responses suggest that the ambition of Saral's architects to bring about what they called “behavioral change” was set in motion. In this vision, as articulated by the management consultants, first, being measured would need to be “internalized” by the departments, a “culture of being measured,” a “mindset” would need to be generated, and the processes of data generation would become “institutionalized,” then, a “behavioral change” would come about. As Muniesa (2014, 11) argues, the performative here is “an idea of practice as ongoing accomplishment, as acting and staging.”
Saral-led modeling of accelerated bureaucratic activity also found an institutional home in official bureaucratic training. 4 Training and “capacity building,” often used as a catch-all phrase to denote some form of lecture-based instruction (Eade 2007), are common features in government departments. Karnataka, like other Indian states, has a centralized administrative training center with multiple district training institutes, whose sole job is to organize cross-departmental trainings and publish manuals and handbooks for department use. Like the publicly visible clock, training about the working of time-conscious programs and their manifestation in dashboards aimed to modulate the “mindset” and “attitude” of functionaries who were being measured by the dashboard and its tracking devices. The training was aimed at a specific set of people, who would then become “tutors” for the rest of the staff in their office. Trainings were a productive site to frame an image of a bureaucrat who might have undergone the time-sensitive behavioral change imagined by Saral's architects.
The training modules, handbooks and manuals that followed Saral produced a vision of an ideal employee, one that is “time-bound,” “process-bound” and “citizen-centric,” and asked trainees to aim for that model. This model bureaucrat emerged not only through a didactic one-way process, but through “group activities” in which participants were asked to enact their future selves; quizzes that tested and prepared them with knowledge they would need; and “field visits” to “model offices” to practice what they have learned.
Trainees responded to these demands. I attended a training session for a mixed cadre of about 30 bureaucrats from across Karnataka. One participant, who claimed to have been specifically asked by the Chief Minister to spread the word of change after the launch of Saral, asked the group, “are you happy about the way people look at you?” A resounding “no” propelled him further. “Do you want to change for the better?” One man from the group took this opportunity to say, “you know sir, my son came and asked me, is government servant an abuse [insult]? … someone addressed him as ‘Oh you son of a government servant.’” Another person stood up and said: “it's not that all of us are bad. Just 20 percent we know are black sheep, the rest 80 percent are hardworking.” The first speaker changed gears to make his main point— Today if I go and ask clerks in my district offices, how many applications are there, how many have you done in how much time, they have no clue. Because there is no documentation as of now. Let's document it and put it in one single portal and prove to the world for anybody and everybody to see. That, look, I got so many applications and this is what my turnover is, this is my workload and this is what my achievements are.
They all agreed. Getting employees to see that the main problem at hand was how bureaucrats appeared in the eyes of citizens, which could be resolved through a data presentation about the work they do, was a strategy visible in many public engagements about the emergence of dashboards. Repeated presentation of data could bring about a reputational change that was collectively desired. The time-tracking dashboard helped conceptualize a future that was always imminent but not just present.
As is being comprehensively documented across the world, indexes, indicators and ranks have become global technologies of enumeration. These mediations take the form of a “soft law” (Merry 2016) that begin to shape the communicative strategies and choices made by senior agents of the state (Sundaram 2020). This is materialized through interfaces such as data dashboards which, although global in form, intervene in very specific political situations in the Global South. For instance, Samdub (2022, 480) shows that global governance interfaces adopted by India's planning authority re-frame an existing tussle between center and states as indicator-led “competitive federalism,” eventually giving more power to the national government to decide on which parameters the states are ranked. These indicators are performative as they produce effects beyond simply measuring or representing a particular activity. For instance, Kaur (2020) argues that Indian political and corporate heads take every opportunity to advertise India's performance on various indicators at venues such as Davos, which culminates in the dramatization of social capital under the banner of a “brand new India.”
Yet, like the village accountants who turn to contractual labor when made to accelerate their work practices under Saral, the performativity of visual communication is also muted by more vernacular practices, as Raval (2020) argues for the case of gig taxi drivers who keep their own accounts. Here, drivers engage in a “social life of quantification” by keeping their own analog accounts in parallel with the mobile app's calculations, which makes “data intimate” and “renarrativizes it through situatedness” (Raval 2020, 133). In Saral's case, village accountants work the political economy of public bureaucracy (Hull 2012) that depends on the relations between official and extra-official cultures of work, to service the higher bureaucracy's desire for accelerated data mobility, and at the same time generate a critique of the enervation of bureaucratic knowledges in the age of indicators.
Calculable Bureaucratic Time
Public bureaucracies are classically described as rationalized spaces of work and order (Weber 1978). Importantly, this order is in the service of an ethic of precision in the fair and equitable distribution of public services, as rendered in organizational theory, which aims to make a lasting case for public bureaucracy in response to trenchant calls to slim it down (Du Gay 2000). In this framework, the indeterminate temporal flow of bureaucratic process is an unavoidable component for meeting the ethical goals of bureaucracy. Yet, focus on speed and acceleration in society at large (Wajcman 2015), has led to making bureaucratic time more discrete and calculable as a way to measure, compare, rank and evaluate bureaucratic offices.
The enactment of calculable bureaucratic time through the generation of standards and data and their circulation through data dashboards that project metricized time indicators have become a popular tool to showcase this investment in time. India has pioneered several dashboards to track and measure bureaucratic activity (Solanki 2019; Samdub 2022). These interventions have been inspired by multiple milestone reform agendas—the New Public Management that began in the UK and was exported to India and other countries in the Global South, albeit unevenly (Desai and Imrie 1998), and the more recent reform impetus at the turn of the twenty-first century that speaks in the language of rights, propelled by information and communication technologies (Bussell 2012).
Saral, a digital system to track the progress of select government applications in the south Indian state of Karnataka offers an opportunity to think about the affordances of a technical arrangement for the reforms of public bureaucracy. I do not take these affordances to simply mean their usefulness in seeing through pre-determined goals of reform, but rather how reform is conceptually determined in and through the material artifice marshaled to bring it to fruition and the effects it produces among its constituency of users and recipients. In doing so, this article illuminates how technologies of measurement and presentation become sites for the novel production of calculable bureaucratic time, which in turn activates the use of communicative media to generate an avowed culture of speedy bureaucratic transactions. Calculable bureaucratic time, expressed through data and dashboards, has a performative purchase. Rather than viewing it as an objective representation of bureaucrats’ work, its value must be perceived through the technopolitical contingencies within which it is produced and the circuits of action and reaction it generates.
When viewed against the long history of colonial bureaucracy, dashboards through which calculable bureaucratic time circulates might be thought of as the latest material investments in a long tradition of intervening in the socio-materiality of bureaucratic organization. Clocks, calendars, handbooks, guides and typewriters (Rangaswami 1984; Raman 2012; Arnold 2013) introduced as part of the British colonial apparatus, are eminent examples of the introduction of logistical media in the working of bureaucracy. Yet, these interventions did not result in the production of discrete time, as might be observed in the colonial factory or corporate firm. Saral's intervention with assembling and circulating time data through dashboards aims precisely to make time more discrete and controllable. Calculable bureaucratic time has governance effects, not by directly changing the conditions within which bureaucrats work, but by creating a parallel flow of data and activating other mediatory technologies such as information-seeking formats on WhatsApp, and its effects on cultures of bureaucratic work. Beyond envisioning states as working in “cyber time” by using digital technologies (Nair 2019), calculable bureaucratic time is neither permanently fast nor slow. It is the presence of data pertaining to the purported work of lower level bureaucrats and its near-instantaneous circulation that gives this time a measure of anticipatory acceleration and political respectability. Time-related data stand in for both a representation of an incrementally improving bureaucracy and a future model of speedy bureaucrats.
Fleur Johns (2021, 58), in their annual review on Governance by Data, points out that data are reconstituting the objects and subjects of state governance. Calculable bureaucratic time exemplifies the “performativity turn” (Muniesa 2014) that scholars of different hues have attributed to data production and flows. While the enactment of performativity is always based on “felicity conditions” (Austin 1975), the conditions underlying data's performativity cannot be attributed to a singular source. In the context of India, any description of these conditions and their effects must take into account the enmeshing of a drive to “dataism” with the legacy of colonialism, administrative hierarchies and historical tendencies to mediate governance with new technologies.
Footnotes
Acknowledgments
Many thanks are due to Narayan A at Azim Premji University, Bengaluru, for introducing me to the questions of digitization and bureaucracy in Karnataka way back in 2012 and for helping me sustain my research on Saral with scholarly advice and field connections. Immense thanks to Vikas S R for research assistance in 2019 and for our insightful conversations. I am grateful to Akhil Gupta, Chris Kelty and Jessica Cattelino at UCLA for reading an early draft of the article and providing comments. Many thanks to Lilly Irani for urging me to think harder about my key concepts. Finally, Nikhit Agarwal’s first-hand understanding of a Saral-like intervention in North India, served as a sounding board, which I am very grateful for.
Funding
The author disclosed receipt of the following financial support for the research, authorship, and/or publication of this article: This work was supported by the American Institute of Indian Studies, Social Science Research Council, Wenner-Gren Foundation, Grant number 2020 Junior Research Fellowship, 2018 International Dissertation Research Fellowship, Dissertation Fieldwork Grant (no. 9819).