
Abstract
Synaesthesia has often been linked to an artistic or creative temperament, but the nature of this link (and, hence, the possible underpinning mechanisms) are poorly understood. This study focusses primarily on people with synaesthesia who have visual experiences, including color, that are induced by music. We determine how this impacts their musical preferences and musical sophistication using previously validated self-report measures and contrast them against non-synaesthetes and synaesthetes with non-musical types. Our data show that people with music-color synaesthesia gravitate toward certain genres (e.g., Reflective and Complex) and show more active engagement with music relative to controls and other synaesthetes. However, synaesthesia as a whole is also linked to greater musical sophistication (e.g., perceptual abilities). A second study examines in detail the nature of associations from musical notes to colors in synaesthetes relative to non-synaesthetes. Synaesthetes have a distinctive way of associating colors with notes: They are more consistent over time, show a more sensitive pitch-luminance correspondence, and have a distinctive color palette (e.g., more browns, fewer greens). These indicative features can be used to determine the presence of this form of synaesthesia.
For some people, music is not just an auditory experience but also an animated visual spectacle of colors and shapes in motion. This is a form of synaesthesia referred to here as music-color, although noting that color is but one element of the experience. People with synaesthesia have involuntary percept-like experiences that are induced. This has been reported in a number of contemporary musicians such as Billie Eilish (J. Fallon, interview, August 9, 2021) and Lorde (J. Weiner, interview, April 16, 2017) as well as historical composers such as Olivier Messiaen (Bernard, 1986) and Alexander Scriabin (Peacock, 1985). The stimulus that elicits the synaesthesia (here, music and other sounds) is termed the inducer and the resulting experience (here, color or vision) is termed the concurrent (Grossenbacher & Lovelace, 2001). Synaesthesia can occur in a wide number of types (i.e. inducer-concurrent pairings) and a general view in the literature is that these different types likely stem from a common cause (e.g., Hubbard et al., 2011). That is, there are differences in neurocognitive development that makes synaesthesia, in all its guises, more likely to emerge in certain people and not others (including a genetic component; Tilot et al., 2018). Synaesthesia tends to aggregate in families even though its precise manifestation does not (e.g., a brother with music-color and a sister with grapheme-color) and individual synaesthetes often possess multiple types (Barnett et al., 2008).
Synaesthesia has been linked to an artistic or creative temperament. Synaesthetes are more likely to be employed within the creative industries sector (Rich et al., 2005; Ward et al., 2008), enrolled on arts versus science degrees (Rothen & Meier, 2010), and are likely to report hobbies in visual arts and music (Lunke & Meier, 2022; Rich et al., 2005; Ward et al., 2008). Synaesthetes tend to score higher on the “openness to experience” personality subscale (Banissy et al., 2013; Rouw & Scholte, 2016) even from a young age (Rinaldi et al., 2020) and this trait is linked to artistic and creative pursuits. However, we do not yet understand the mechanism through which synaesthesia is associated with creativity and the arts. One possibility is that it is the synaesthetic experience itself (the concurrent) that acts as a driving force. For instance, having visual experiences to music may act as a motivating influence to engage with music (by creating one’s own private “art show” of experiences). Another possibility is that synaesthesia in general is linked to a particular skillset, irrespective of how it manifests itself (i.e., irrespective of the pattern of inducers and concurrents), such that it is the presence of this skillset that acts as a biasing influence on lifestyle choices. This has been termed a “synaesthetic disposition” (Ward, 2019) or a “general synaesthetic trait” (Rouw & Scholte, 2016). The basic idea is that whatever it is that causes synaesthesia (e.g., genetic differences affecting brain wiring) has other impacts on the cognitive profile of synaesthetes beyond the synaesthetic experiences themselves. For instance, synaesthetes have been shown to have certain perceptual skills (such as visual attention to detail in change blindness; Ward, Brown, et al., 2018), a distinctive style of thinking (e.g., more vivid mental imagery; Meier & Rothen, 2013), and better episodic memory (including for music: Lunke & Meier, 2018; Mealor et al., 2019). These skills may be well adapted to artistic niches. These two possibilities (synaesthetic concurrents to music acting as a tool versus a general synaesthesia skillset) lead to different predictions as to whether creative pursuits, such as music, will gravitate around particular types of synaesthesia (music-color) or be a more general feature of synaesthesia itself (consistent with being part of a wider skillset).
To give a previous example of this approach, Ward et al. (2008) asked synaesthetes “How much time do you spend playing a musical instrument?.” They found that greater musical engagement was driven by synaesthetes for whom music was an inducer, rather than synaesthetes per se. They concluded that the main role of synaesthesia was as a motivating influence due to having rich and often beautiful visual experiences to music. (Note: the same pattern was not found for engagement in visual arts which was higher in all kinds of synaesthesia to various extents). However, playing a musical instrument is only one measure of musicality, and one that relies on explicit training. Musicality might be demonstrated in other ways (e.g., being a DJ or sound engineer), and some people are avid consumers but not producers of music (e.g., downloads, concerts). A significant amount of musical expertise is acquired through implicit learning as a result of cultural exposure to music (e.g., as evidenced by studies in infants and young children; Trehub, 2006). Moreover, we know very little about the ways in which synaesthetes’ engagement with music differs from other people (e.g., do they gravitate toward certain genres?). The present research is aimed at addressing these questions using established self-report measures of musical preference (Rentfrow & Gosling, 2003) and musical sophistication (Müllensiefen et al., 2014). The former was the STOMP (Short Test of Music Preferences), a measure of musical preferences that groups together different genres based on a reliable factor structure with external validity (genres within a factor have common musical features such as tempo, presence of vocals). The latter, the Goldsmiths Musical Sophistication Index (Gold-MSI), was developed as a self-report measure of musical sophistication in adults that captures individual differences even among non-musicians (Müllensiefen et al., 2014). Different subscales compare formal musical training with more informal engagement and also consider singing ability, perceptual skills, and emotional responses to music. Several recent studies have documented the characteristics of synaesthesia among musicians (Glasser, 2021; Glasser, 2023; Itoh & Nakada, 2018), but a characterization of musicality among synaesthetes is lacking.
Music-color synaesthesia can be considered an umbrella term for somewhat different manifestations. Indeed, the suitability of the terms “music” and “color” can themselves be debated as many of these synaesthetes report that a wide range of sounds act as inducers (e.g., voices, noises) and that the synaesthetic experience often consists of shape, texture, and movement in addition to color (Ward & Simner, 2022). The music-color sample in the present study self-reports this wider phenomenology, although we only document it with respect to musical notes (as inducer) and color (as concurrent). The terms sound-vision synaesthesia, or chromesthesia, are also sometimes used. Imagery of music can also elicit synaesthetic experiences in some people (Glasser, 2023), consistent with the suggestion that synaesthetic inducers can be non-sensory (e.g., Curwen, 2018). Some synaesthetes report colors for notes that derive from their pitch class names (C, D, E, and so on or do, re, me, and so on; Itoh & Nakada, 2018; Itoh et al., 2017) which would require some degree of formal musical training. As these associations stem from the names, such individuals may not necessarily have colors to all sounds. Other manifestations of music-color are timbre-to-color or pitch height-to-color, and beyond single notes, musical intervals and keys have been noted to elicit color (e.g., Day, 2005; Glasser, 2023). More complex musical stimuli tend to elicit more complex synaesthetic experiences, which makes this type of synaesthesia particularly challenging to study. The standard diagnostic test for synaesthesia is test-retest consistency (smaller distance in color space between different observations to the same inducer), but the difference in consistency scores between synaesthetes and non-synaesthetes may be larger in grapheme-color (Eagleman et al., 2007) than music-color (Ward et al., 2006). This might mean that synaesthetic experiences to sounds are too complex to be condensed to just a single color choice for each test stimulus (e.g., perhaps a single sound gives multi-colored percepts) but might also reflect the fact that non-synaesthetes, too, can generate reasonably consistent and non-random associations. For instance, both synaesthetes and non-synaesthetes tend to choose lighter colors for high pitch and darker colors for low pitch (Ward et al., 2006). These systematic mappings across sensory features are in the general population termed cross-modal correspondences (Spence, 2011). Given these potential difficulties in using consistency as a measure of synaesthesia, we consider more carefully potential differences in music note-color associations generated by synaesthetes and controls beyond consistency itself. Specifically, we consider whether synaesthetes differ quantitatively in their pitch-luminance mappings (e.g., the sensitivity or slope of the relationship) or in other aspects of their musical note-color associations. For example, Rouw and Root (2019) reported that grapheme-color synaesthetes have a distinctive color palette of associations (they are more likely to choose colors such as white and less likely to choose blue). The palette is not about specific associations for particular stimuli but rather about a pattern across all the stimuli in the sample. Here, we further examine the potential diagnostic value of the color palette, but separately from consistency. One application of this might be to identify child synaesthetes who tend to be less consistent than adults (Simner & Bain, 2013). It is unclear whether there is a synaethetic color palette for musical note-color associations and, if so, is it the same as the palette for grapheme-color?
Methods
The study was not pre-registered. All data, stimuli, and scripts are openly available at https://osf.io/2bvgs/. The study was approved by the Sciences and Technology Cross-Schools Research Ethics and Governance Committee of the University of Sussex.
Participants
There were three groups of participants: music-color synaesthetes (N = 68), non-sound-inducing synaesthetes (N = 91), and non-synaesthetic controls (N = 101). The mean ages (and SD) for the three groups were: 35.25 (14.04), 37.03 (11.80), and 33.28 (10.42) years, respectively. The male:female:non-binary ratios for the three groups were 11:52:5, 12:78:1, and 35:66:0, respectively. A sensitivity analysis (power = .8, alpha = .05) suggests that effect sizes of d = .41–.45 and above can be reliably detected with these group sizes.
Both groups of synaesthetes were recruited in the same way, having volunteered for research via our website (www.sussex.ac.uk/synaesthesia) and filling in a questionnaire that asks about the kinds of synaesthesia that they experience. The music-color group reported music-color synaesthesia, potentially alongside other kinds of synaesthesia, and their synaesthesia was verified using musical notes as inducers (see below). The other synaesthesia group did not report music-color synaesthesia (nor any other synaesthetic experiences to music or other sounds such as voices). This latter group had previously taken and passed a test of consistency for either grapheme-color synaesthesia (Rothen et al., 2013) or an additional form of synaesthesia (here, sequence-space synaesthesia, in which sequential units like days are associated with specific locations in space; Ward, Ipser, et al., 2018). Controls were recruited via an online research participation platform (Testable Minds; www.testable.org), and we confirmed they did not have synaesthesia during the course of our testing (see Results for Music note-colour associations).
Materials
The questionnaires consisted of the STOMP (Rentfrow & Gosling, 2003) and the Gold-MSI (Müllensiefen et al., 2014). The STOMP asks about preferences for 14 musical genres (Classical, Blues, Folk, Jazz, Alternative, Rock, Heavy Metal, Country, Religious, Pop, Soundtrack, Dance/Electronic, Rap/Hip-hop, and Soul/Funk). Participants indicated their liking on a 1–7 scale ranging from strongly dislike (1) to strongly like (7). For analysis, the 14 genres are grouped into four dimensions (Reflective and Complex [R&C]; Intense and Rebellious; Upbeat and Conventional [U&C]; Energetic and Rhythmic). The GOLD-MSI consists of 38 questions grouped into five subscales, together with an overarching “General Sophistication” factor which contains items drawn from each subscale (Müllensiefen et al., 2014). The five subscales with representative items are: Active Engagement (e.g., “I often read or search the internet for things related to music”), Perceptual Abilities (e.g., “I can tell when people sing or play out of tune”), Musical Training (e.g., “I can play ___ musical instruments”), Singing Abilities (e.g., “After hearing a new song two or three times, I can usually sing it by myself”), and Emotions (“I sometimes choose music that can trigger shivers down my spine”). Participants self-reported on a 7-point scale. Most questions (N = 31) used a Likert scale from Completely Disagree (1) to Completely Agree (7), and eight questions used other 7-point scales (e.g., number of instruments played ranging from 0 to 6+ with integers in between).
For the musical note-color test, the sounds were a subset of those used previously by Ward et al. (2006) and consisted of 24 tones made up of 3 timbres (piano, strings, and pure tones) × 8 fundamental frequencies (from 73.4 to 1244.5 Hz). These correspond, in the Western music scale, to an ascending “cycle of fifths” (D, A, E, B, F#, Db, Ab, Eb) which are perceived as linearly spaced pitch intervals. The sounds were all of 3 seconds in duration recorded as 16-bit stereo files, at a sampling frequency of 44,100 Hz (CD quality) and 65 dB. The visual display showed a color-picker, which comprised a vertical “hue bar” adjacent to a “shade box.” The shade box displayed the full range of saturation and luminance for each hue, with saturation varying on one axis and luminance on the other (and axes randomly alternating across trials), as shown in Figure 1. In this type of display, chromatic colors (blacks, grays, whites) are located around the edges of the shade box. A color choice is made by clicking the hue bar, then choosing the exact shade from the shade box, which allowed a choice from approximately 16 million discrete colors.
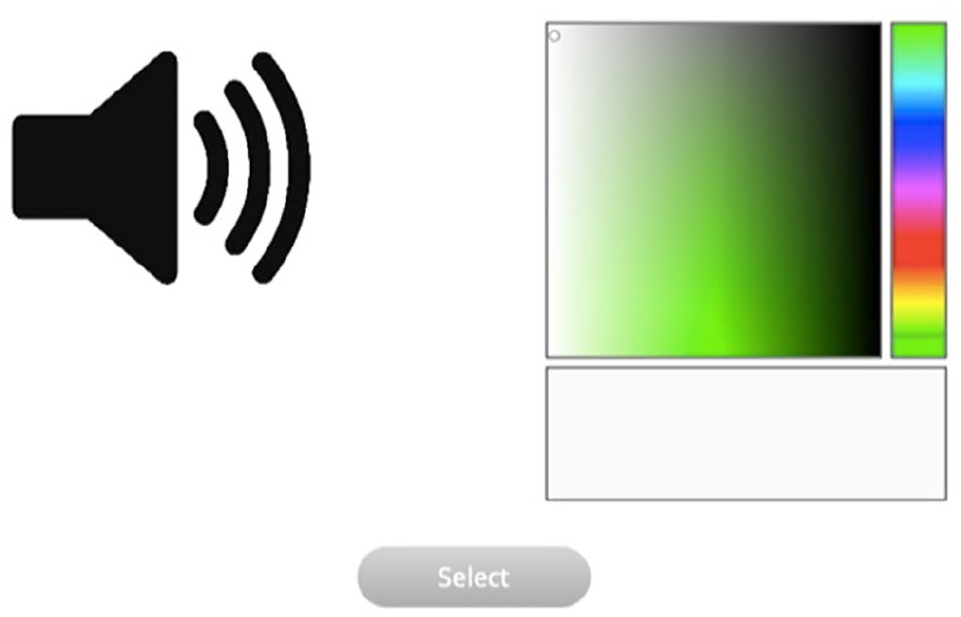
Layout of the Sound-Color Test.
Procedure
There were two sets of tests administered in the same session sequentially each taking up to 20 minutes. The first part of the test session consisted of the questionnaires. These were taken by all three groups. The questionnaires were administered in an online survey (Qualtrics, Provo, UT), with items presented in a fixed standard order.
The second part was a test of musical note-color associations using the same principle as other tests of synaesthesia (e.g., Eagleman et al., 2007). This was administered only to the music-color synaesthetes and non-synaesthetic controls (given that the non-music synaesthetes had already been verified by other comparable tests). This test was administered on syntoolkit (www.syntoolkit.org). Participants were instructed to wear headphones whenever possible and select a comfortable volume. Each of the 24 sounds were played on three occasions (with random selection within each batch of 24), and participants were free to listen to each sound several times (by clicking on a sound icon). They were then required to choose an appropriate color response using the RGB color-picker (with the initial color being randomly generated on each trial). The control group was randomly assigned to one of two slightly different versions depending on whether a “no color” button was also present (N = 55) or absent (N = 46). If the “no color” option was absent, then they were forced to choose a color on each and every trial (termed forced-choice controls). If the “no colour” button was present, then participants could choose this button instead of picking a color (termed free-choice controls). It was reasoned that selecting “no colour” on a high number of trials would be indicative of not having this type of synaesthesia. However, it was also important to have a group of controls who generated a sufficient number of colors to permit a fair comparison against synaesthetes. Synaesthetes were always presented with the “no colour” option but rarely selected it (see below).
Participants were instructed as follows: “Some people habitually and automatically associate colors with sounds. This is a type of synaesthesia. For those people, this will feel like a very natural task. You may feel frustrated that you are struggling to choose an exact color that matches your experience—just do your best. For other people, this will feel like a strange task. That’s ok. [Free-choice controls then read] You can choose ‘no colour’ if you genuinely do not experience anything, and you can choose this option as many times as you like. [Forced-choice controls read instead] Just try to imagine a colour that might go with the sound and feel free to guess if unsure.”
Analysis plan (musical note-color associations)
Consistency
First, we looked at within-item consistency (i.e., comparing the different color selections to the same sound). This comparison was based on Euclidean distances in CIE Luv space (transformed from RGB using the R convertColor function). Thus, a smaller distance is indicative of higher color similarity, that is, more consistency. Given that each sound (N = 24) was presented three times, there were three pairwise comparisons (time 1 vs. 2; time 1 vs. 3; time 2 vs. 3). These 72 distances were averaged together to give a single consistency score for each participant across all stimuli. Where “no colour” was selected in a pair, the distance was excluded from the numerator, and the denominator adjusted (i.e., to <72).
Pitch-luminance correspondence
For each participant, the luminance was averaged across all three stimulus repetitions, and the fundamental sound frequency (Hz) was log10 transformed to lie on a linear perceptual scale. The slope in terms of rate of change in luminance per unit change in pitch (log scale) was calculated for each participant and each timbre.
Representational similarity analysis
This analysis asks whether similar sounds evoke similar colors (by contrast, a measure of consistency only considers identical sounds). Here, we consider timbre, pitch height, and pitch class as separate dimensions of similarity. As mentioned previously, distances in color space were measured as Euclidean distances in CIE Luv space. Similarity in sound space was calculated as shown in Figure 2 and explained in detail as follows. In terms of timbre, pairs of sounds that are from the same instrument (piano, pure tones, strings) are coded as 1, and pairs of sounds that are from different instruments are coded as 0. This occurs irrespective of any pitch differences. In terms of pitch height, a more graded similarity metric is possible given that there are eight evenly spaced pitch levels. Pairwise similarity between sounds is coded between 0 and 1 in steps of 1/7, and this occurs irrespective of any timbral differences. Our alternative coding of pitch uses pitch class; that is, based on categorical perception of pitch on a musical scale (A–G). In this categorical system, notes of the same pitch class (e.g., A) would be maximally similar irrespective of timbre or pitch height (i.e., across octaves), while adjacent notes (e.g., B vs. C) would be as dissimilar as other note pairs.
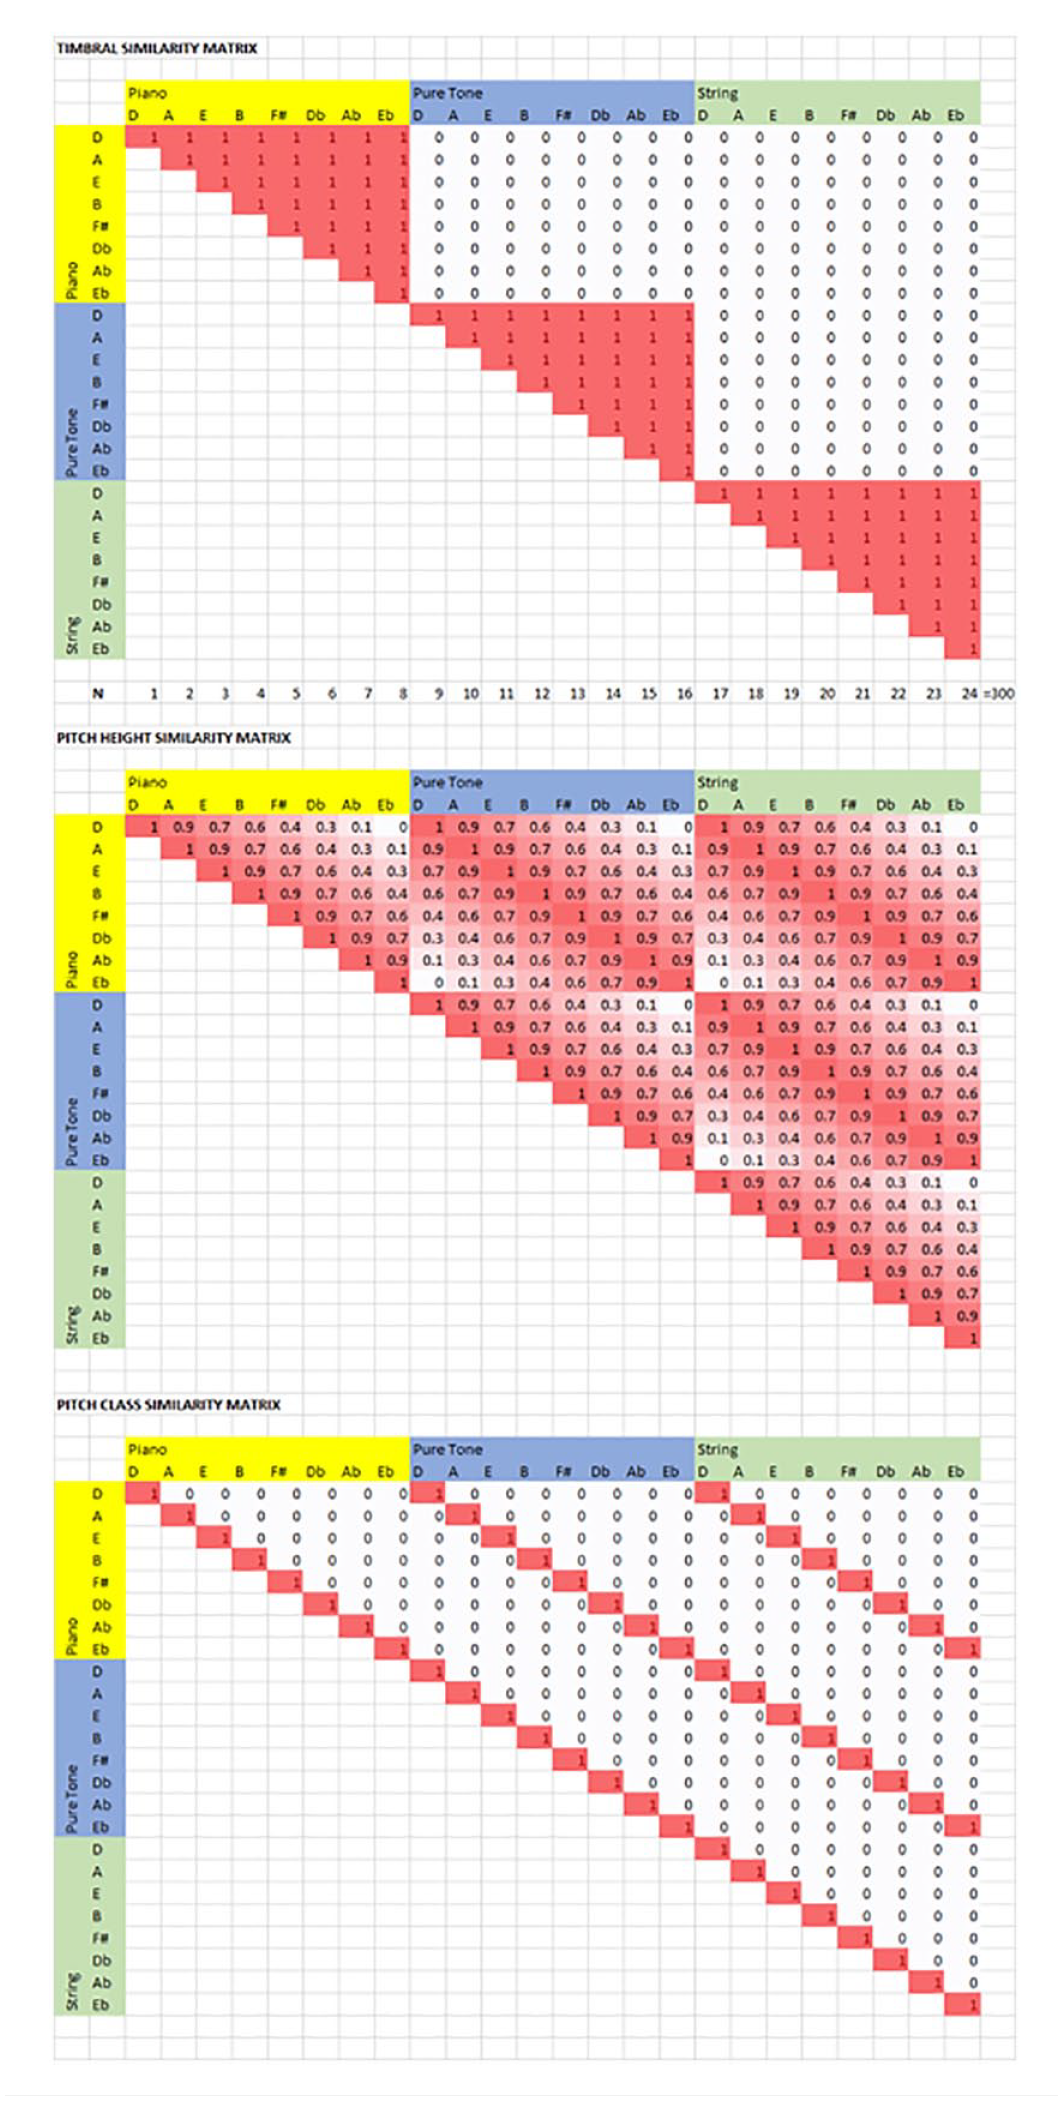
Pairwise Sound Similarity Matrices (1 = Maximally Similar, 0 = Maximally Dissimilar) for 300 Sound Pairs Derived From Three Timbres (Piano, Pure Tones, and Strings) and eight Pitch Levels (Ascending From D to Eb in a Cycle of Fifths).
Given 24 different sounds, there are 300 unique pairwise comparisons per participant (24 stimuli generates 24 + 23 + 22 + . . . + 2 + 1 = 300 pairings) after averaging across repetitions of the same tone. For example, a comparison of colors generated for string/A-flat and piano/E-flat would be a single value that is an average of nine numbers (given that each note is repeated three times giving nine pairwise permutations). A Pearson’s correlation between the 300 sound similarity values and the corresponding 300 color similarity values is computed as a dependent variable (separately for timbre, pitch height, and pitch class).
Synaesthetic color palette
This analysis was similar to the procedure described in Rouw and Root (2019) in which one of eleven categorical colors (black, white, red, green, yellow, blue, brown, purple, pink, orange, and gray) were assigned to the first color choice for each sound. This was done using the ColourNamer of Mylonas et al. (2013) taken from https://colornaming.net/. For each color in our dataset, we found the closest matching Berlin-Kay color based on the highest posterior probability in the Colournamer algorithm. The distribution of colors was then used to train a Naïve Bayes Classifier (using the naiveBayes function in R’s e1071 package) to classify synaesthesia status (music-color synaesthetes vs. forced-choice controls) using only the participant’s distribution of colors, applying leave-one-out cross-validation. As a further test, a classifier trained to detect the color palette of grapheme-color synaesthesia (Rouw & Root, 2019) was applied to predict group membership based on the synaesthetic colors generated from sounds and vice versa (i.e., predicting grapheme-color synaesthesia status from the classifier trained on the palette derived from music-color synaesthesia).
Results
Musical preference
The results for the STOMP measure of musical preferences are shown in Figure 3. These were analyzed as a 4 × 3 mixed analysis of variance (ANOVA) contrasting music preference dimension (R&C, Intense and Rebellious, U&C, Energetic & Rhythmic) against group (music syns; non-music syns, controls without syn). There were significant main effects of group, F(2,257) = 3.399, p = .035, η2 = .026, and music preference dimension, F(3,771) = 10.147, p < .001, η2 = .038, and a significant interaction between them, F(6,771) = 4.996, p < .001, η2 = .037. Post-hoc tests (one-way ANOVA) revealed significant group differences in the R&C dimension, F(2,257) = 16.927, p < .001, and the U&C dimension, F(2,257) = 3.904, p = .021. In both cases, the effect was driven solely by the music-color synaesthetes who differed from both the non-music synaesthetes, R&C t(157) = 4.310, p < .001, d = .69; U&C t(157) = 2.674, p = .008, d = .43, and the controls, R&C t(165.268) = 6.104, p < .001, d = .90; U&C t(167) = 2.377, p = .019, d = .37. The controls and non-music synaesthetes did not differ from each other, R&C t(190) = 1.724, p = .086, d = .28; U&C t(190) = −.211, p = .833, d = −.03. To confirm that our controls were a typical sample, we can confirm that their pattern of data resembles STOMP published norms across all ethnicities which show highest overall ratings for Intense and Rebellious (Gosling, 2024).
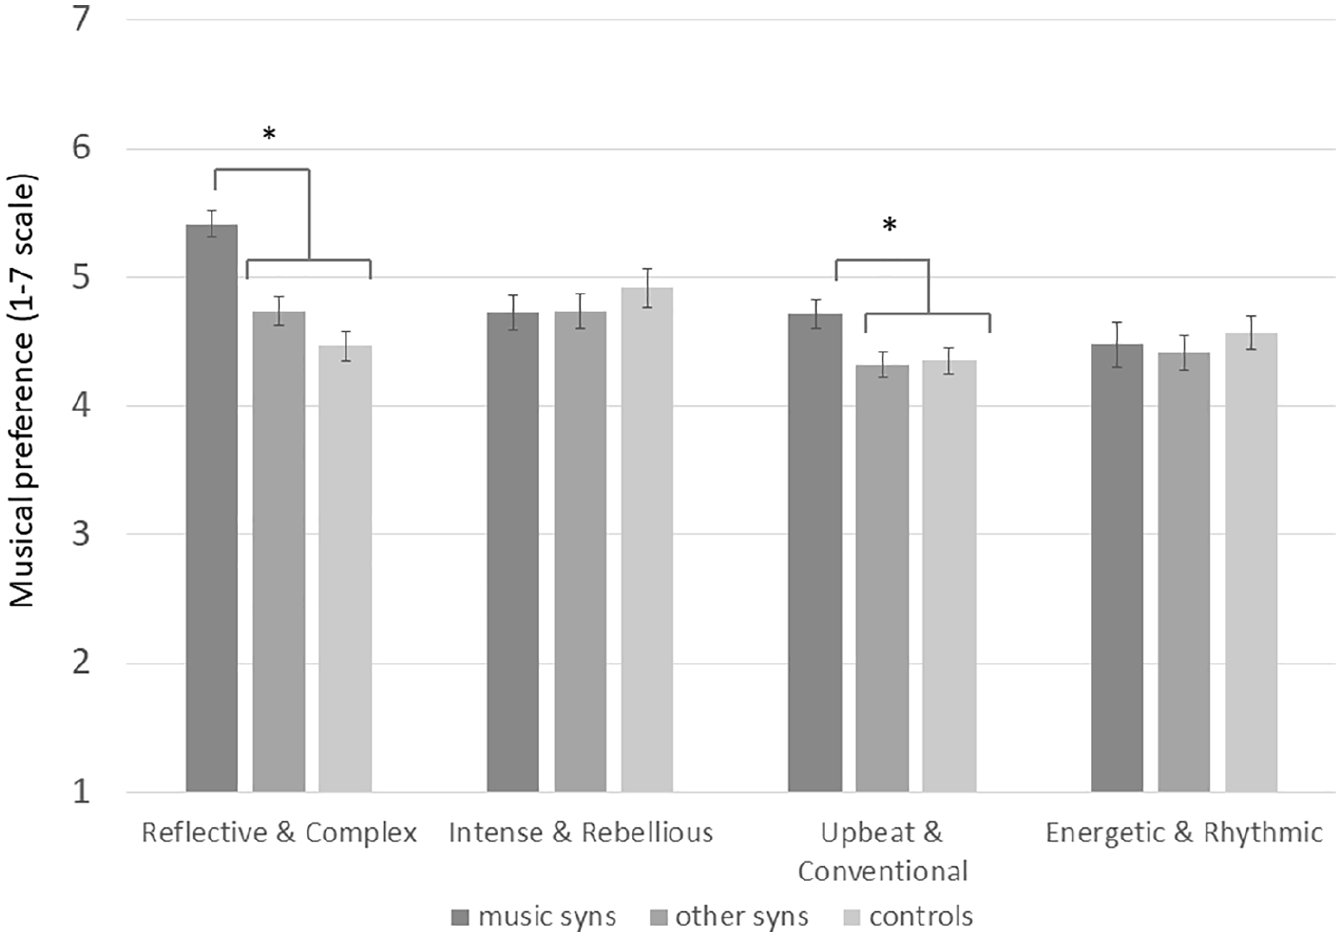
STOMP Survey Results (Mean, Error Bars ± 1 SEM) Reveals Between-Group Music Preferences for Reflective & Complex and Upbeat & Conventional, Driven by the Sound-Color Synaesthetes (*p < .05).
In summary, the findings suggest that musical preference is directly biased by the synaesthetic experiences to music rather than the presence of synaesthesia per se. It leads to a greater preference toward certain musical genres, albeit without detriment to other genres.
Musical sophistication
The results for the Gold-MSI are summarized in Figure 4. For Musical Sophistication, the General Sophistication measure (a composite of the subscales) revealed a main effect of group, F(2,257) = 17.891, p < .001, with post-hoc analyses revealing that all three groups differed from each other, music syns vs. controls: t(122.71) = 6.056, p < .001, d = .991; music syns vs. non-music syns: t(157) = 3.489, p = .001, d = .559; non-music syns vs. controls: t(190) = 2.354, p = .020, d = .340.
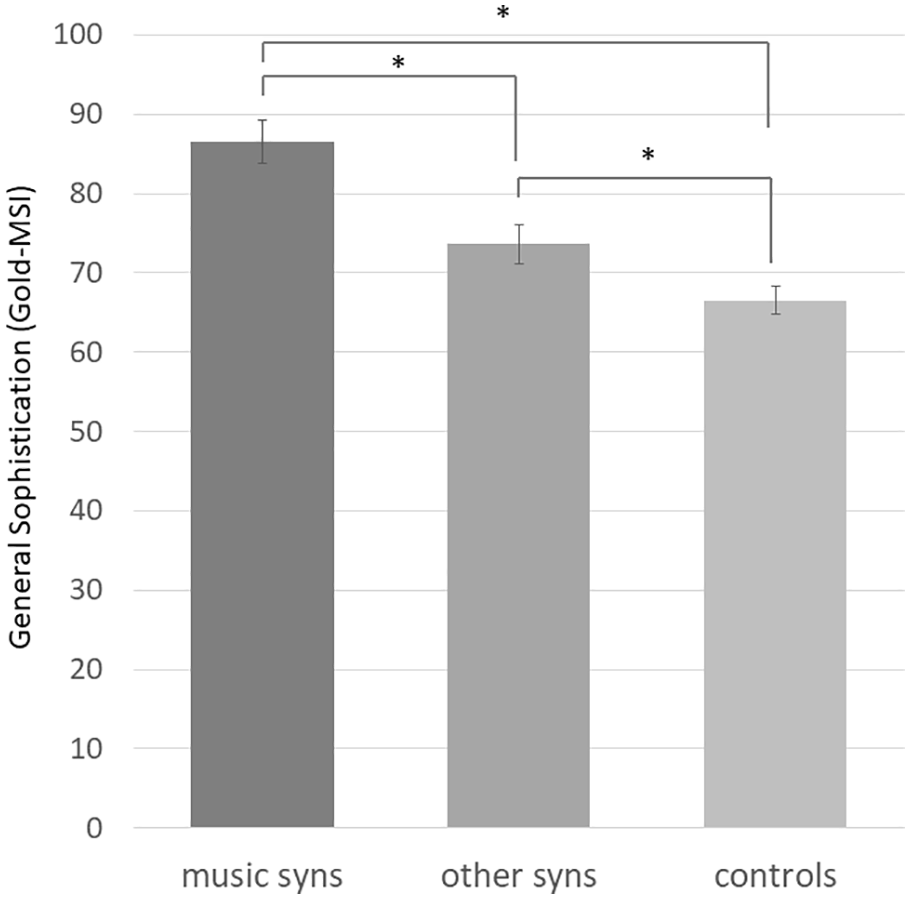
General Musical Sophistication Scores From the GOLD-MSI (Mean, Error Bars ± 1 SEM) Differed Across All Groups (*p < .05).
To explore this further, the separate subscales were considered. There were significant group differences (one-way ANOVAs) across all five subscales that fell into one of two patterns. For Active Engagement (e.g. time and money spent on music), the group effect, F(2,257) = 12.301, p < .001, was driven solely by the music-color synaesthetes who differed from both non-music synaesthetes and controls but where the latter groups did not differ from each other (i.e. music syns > other syns = controls). For all other subscales, all three groups differed significantly from each other, with music synaesthetes showing the greatest musical sophistication and non-music synaesthetes being intermediate (i.e. music syns > other syns > controls): Perceptual Abilities, F(2,257) = 13.549, p < .001, Musical Training, F(2,257) = 18.902, p < .001, Emotions, F(2,257) = 18.400, p < .001, and Singing Abilities, F(2,257) = 17.891, p < .001. The post-hoc analyses are shown on Figure 5.
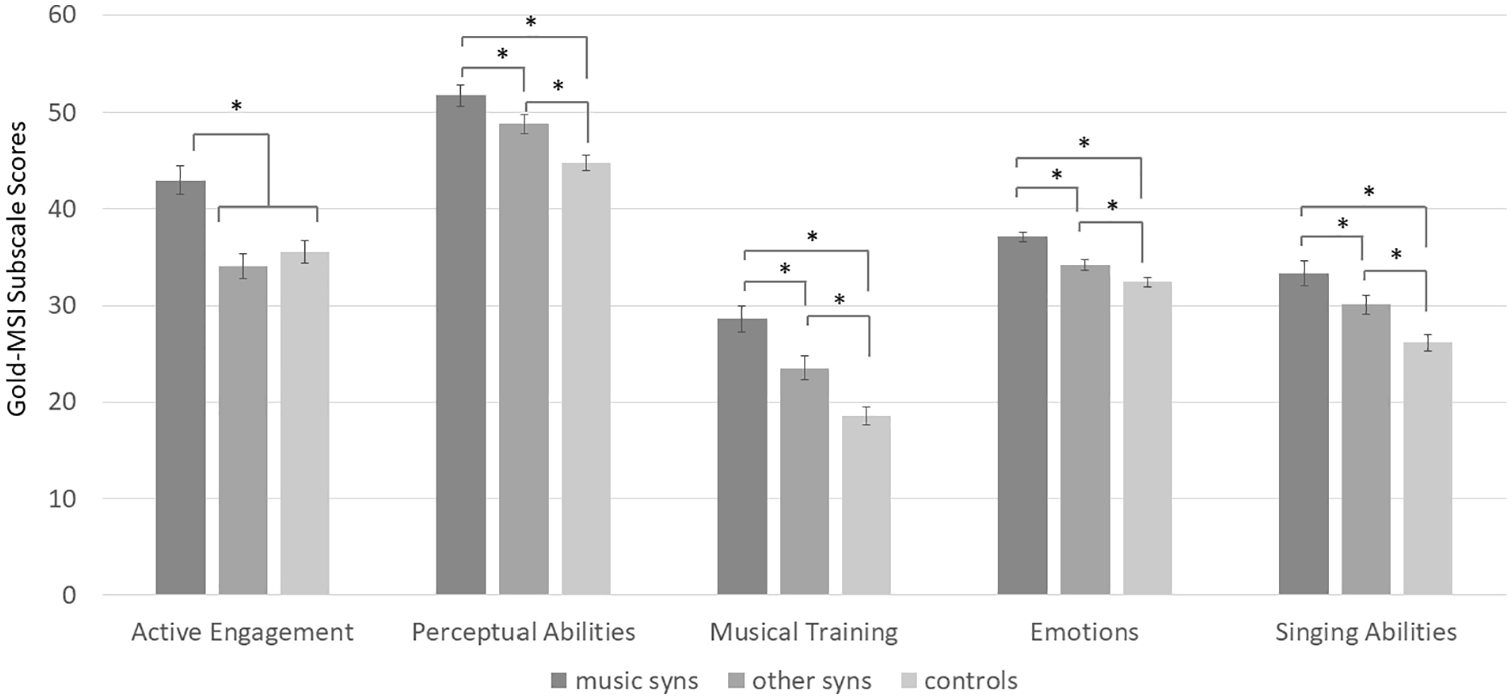
Factor Scores From the GOLD-MSI (Mean, Error Bars ± 1 SEM) Across the Three Groups (*p < .05).
Summary
The presence of music-induced visual experiences was linked to changes in musical preference (favoring R&C and U&C genres, albeit not at the expense of other genres). There was no evidence that other forms of synaesthesia were linked to changes in musical preference. With regards to musical sophistication, the presence of music-induced synaesthesia was linked specifically to greater active engagement with music (such as the amount of time devoted to it)—that is, having these kinds of experiences is a significant motivator to engage in music-related activities. However, beyond this, synaesthesia is more generally linked to a variety of self-reported musical abilities (e.g., to sing back tunes or detect an out-of-rhythm beat) irrespective of whether music is an inducer or not (although having music-induced experiences may still convey an added benefit).
Music note-color associations
We recall that for these analyses, the relevant comparison is between music-color synaesthetes and controls, where the latter are split into two sub-groups with slightly different instructions (depending on whether “no colour” is an available option or not). We aim to find indicative differences between the groups (e.g. in consistency) that may be used diagnostically in future research.
Number of colors selected
The synaesthetes tended to choose colors on most trials (M = 95.36%, SD = 11.51, range = 43.06–100), whereas controls, in the free-choice condition, tended to choose significantly fewer colors overall, M = 58.51%, SD = 37.95, range = 0–100; t(62.07) = 6.948, p < .001, d = 1.377. The distribution is shown in Figure 6. The propensity to choose colors during the task is itself a good group discriminator (area under the curve [AUC] = .835, 95% CI = [.764, .906], specificity = .727, sensitivity = .838, with threshold determined by the maximum sum of sensitivity and specificity here and throughout).
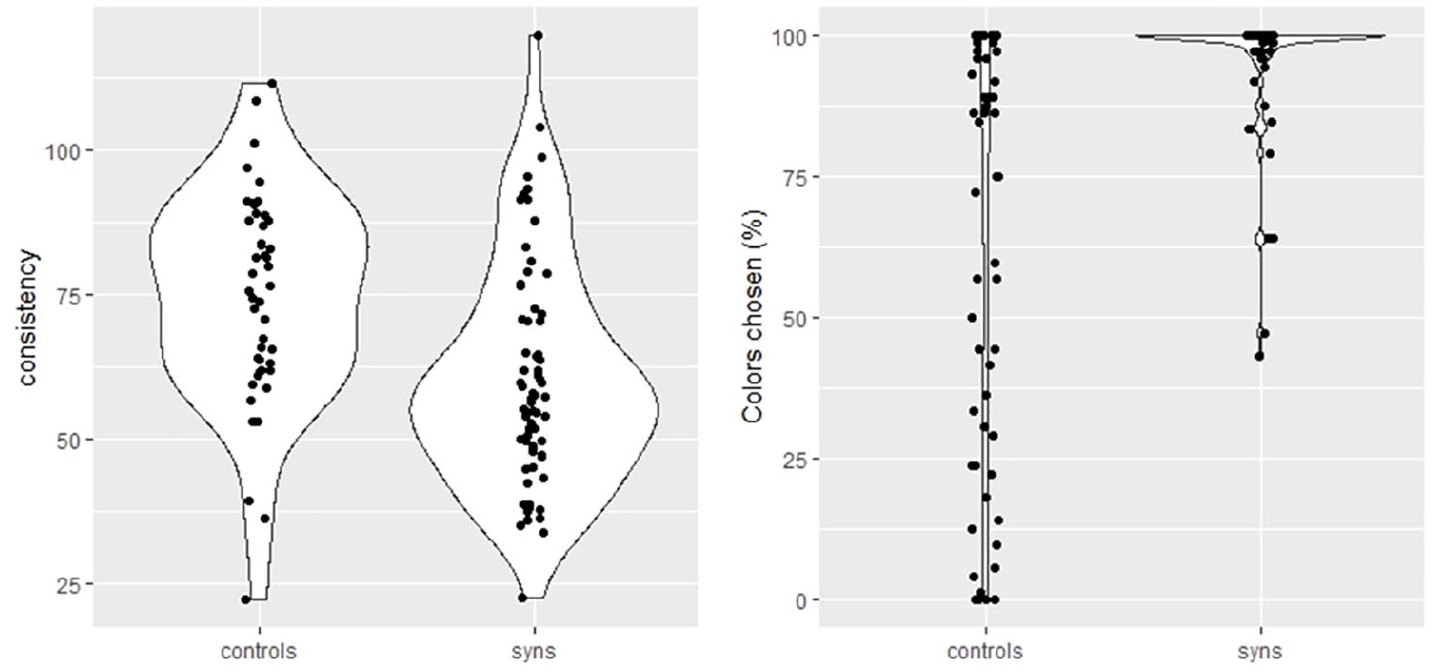
Violin Plots Showing Consistency of Colors Chosen for Repetitions of Identical Stimuli (Distance in CIE Luv Color Space) for Synaesthetes and Forced-Choice Controls (Left) and Percentage of Colors Chosen for Synesthetes and Free-Choice Controls (Right).
Consistency
The average consistency of synaesthetes was 60.61 (SD = 19.40), and for the forced-choice controls, it was 74.51 (SD = 18.29), with synaesthetes being significantly more consistent, t(112) = 3.839, p < .001, d = .73. If we use these data to establish a diagnostic threshold for music-color synaesthesia, the optimal cutoff would be 60.51, which gives an AUC of only .723 (95% CI [.627, .819]; sensitivity = .603, specificity = .826), a value which is lower than the equivalent test for grapheme-color synaesthesia (Rothen et al., 2013, report AUC = .93). This makes consistency a less viable diagnostic measure for this form of synaesthesia. Note the equivalent mean consistency values for grapheme-color are 28.5 (synaesthetes) and 73.1 (non-synaesthetes), taken from Rothen et al. (2013), so the drop in consistency across stimuli (musical notes vs. graphemes) lies primarily with synaesthetes. Either the color experiences are more complex or the auditory representations less precise.
Pitch-luminance correspondences
Figure 7 shows the average luminance across all stimuli, together with the pitch-luminance slopes. The slopes were entered as dependent variables in a 2 × 3 mixed ANOVA contrasting group (synaesthetes, forced-choice controls) and timbre (piano, string, pure tone). There was a significant effect of group with synaesthetes having steeper slopes, F(1,112) = 21.644, p < .001, η2 = .162, and a group × timbre interaction, F(2,224) = 4.291, p = .023, η2 = .037, such that the group difference was more pronounced for pure tones. There was no main effect of timbre, F(2,224) = 1.470, p = .232, η2 = .013. Averaging across timbres, the group difference was d = .89, which discriminates between groups (AUC = .726, 95% CI [.628, .825], sensitivity = .750, specificity = .673, at a threshold of 31.196).
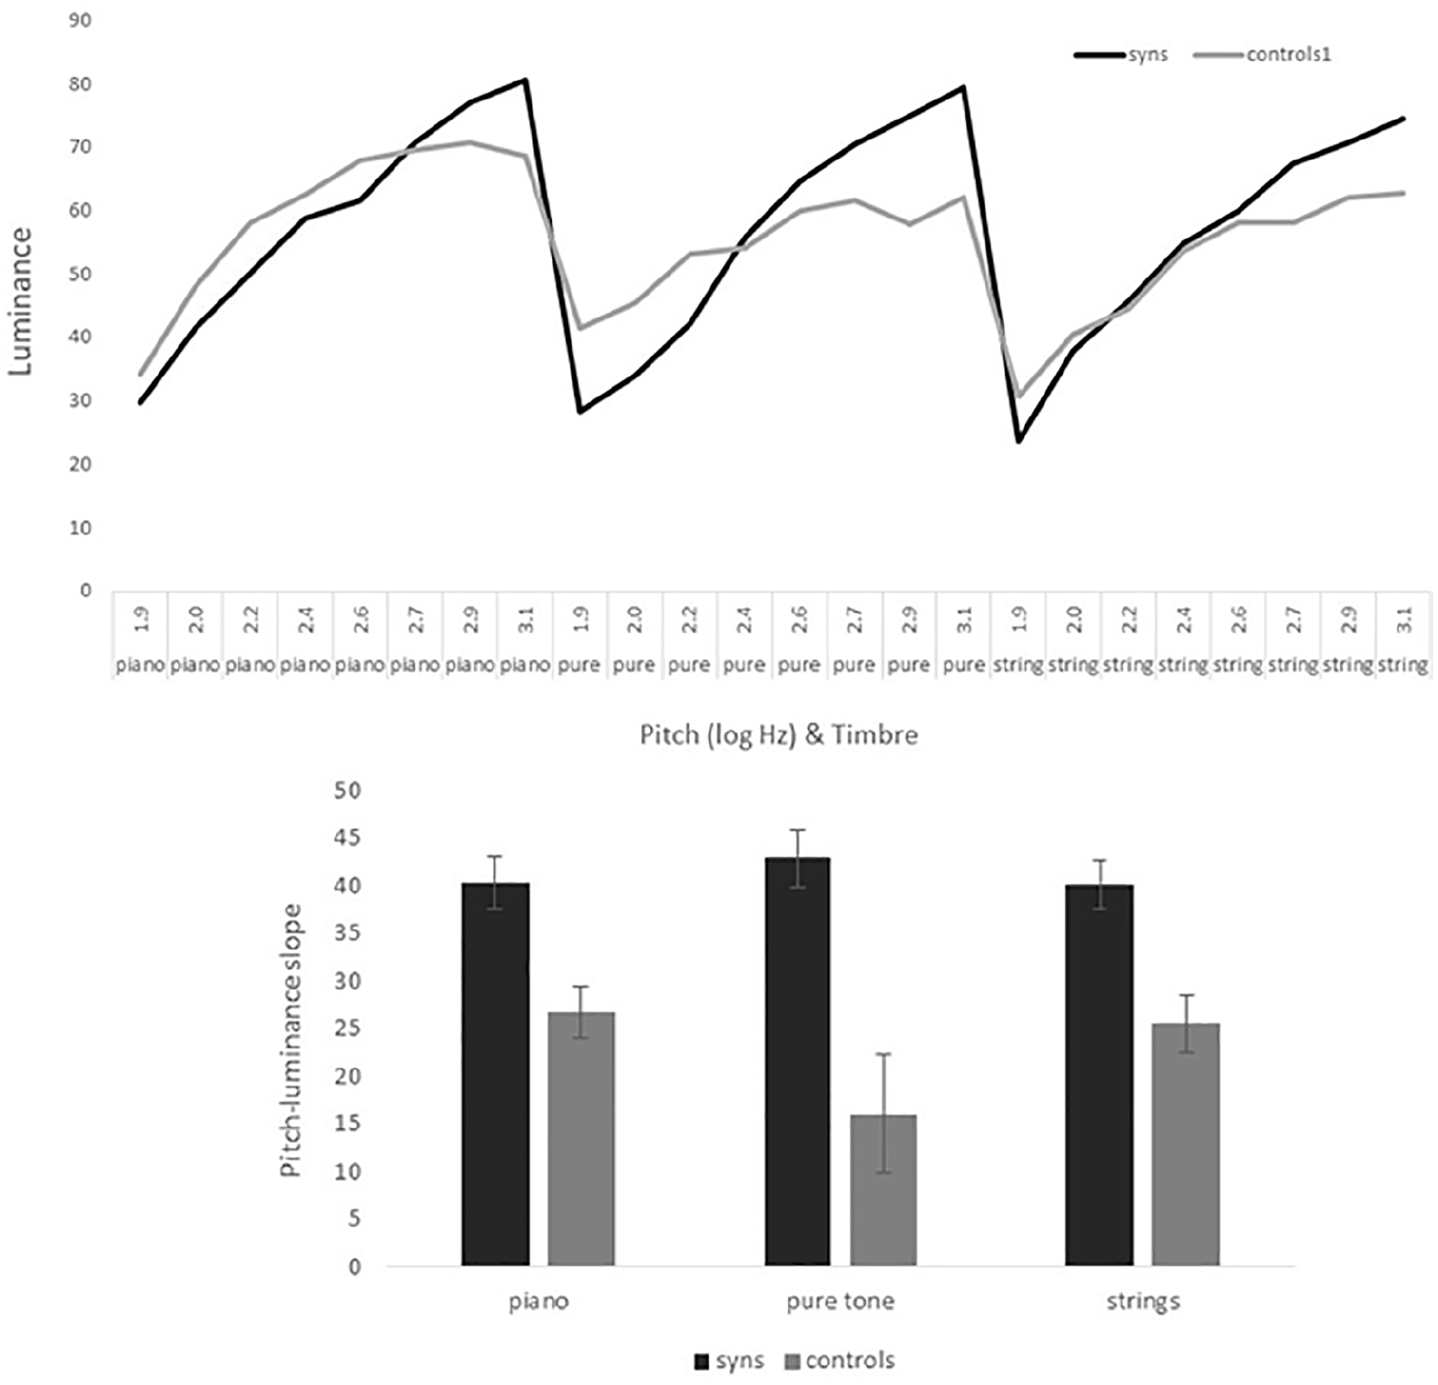
Top: Average Luminance Values Across 24 Tones Varying in Pitch (8 Levels) and Timbre (Piano, Pure Tones, Strings). Bottom: The Average Luminance-Pitch Slope for Each Timbre (Error Bars Show 1 SEM).
Representational similarity analysis
This analysis asks whether similar sounds evoke similar colors. In other words, if two sounds are musically similar, are their associated colors visually similar? Unlike test-retest consistency, which considers similarity between repetitions of identical stimuli, a representational similarity analysis (RSA) considers all pairwise comparisons between stimuli. This also offers a way of identifying potentially different music-color manifestations, such as timbre-color and pitch-color synaesthesia. The measure is a Pearson’s correlation (r) based on the degree of association between distance in sound space against distance in color space.
The correlations between color versus pitch height on the one hand, and timbre on the other, can be represented on a two-dimensional space as shown in Figure 8 for synaesthetes and controls (in the forced-choice condition). Deviations from zero provide increasingly strong evidence in favor of timbre-color or pitch-color regularities. Counting the proportion of participants who cross a threshold of a medium effect size (r > ±.30), there are 36.8% of synaesthetes who present as pitch height-color (compared to 19.6% controls), 25.0% of synaesthetes who present as timbre-color (compared to 13.0% controls), and 10.3% of synaesthetes who show medium effect sizes for both pitch height and timbre (compared to 2.1% controls). There were three participants, all synaesthetes, who showed a medium correlation with pitch class but not pitch height or timbre. An example is shown in Figure 8 (r = −.586 between pitch class and color similarity). Taking the optimal strategy for each person (pitch height, pitch class, or timbre) yielded a mean r of .367 (SD = .155) for synaesthetes compared with .196 (SD = .157) for controls (d = 1.104). This is a significant difference, applying Fisher’s r-to-z transformation to normalize: t(112) = 4.629, p < .001, that is a good group discriminator (AUC = .765, 95% CI [.674, .857], sensitivity = .735, specificity = .739, at threshold of .322).
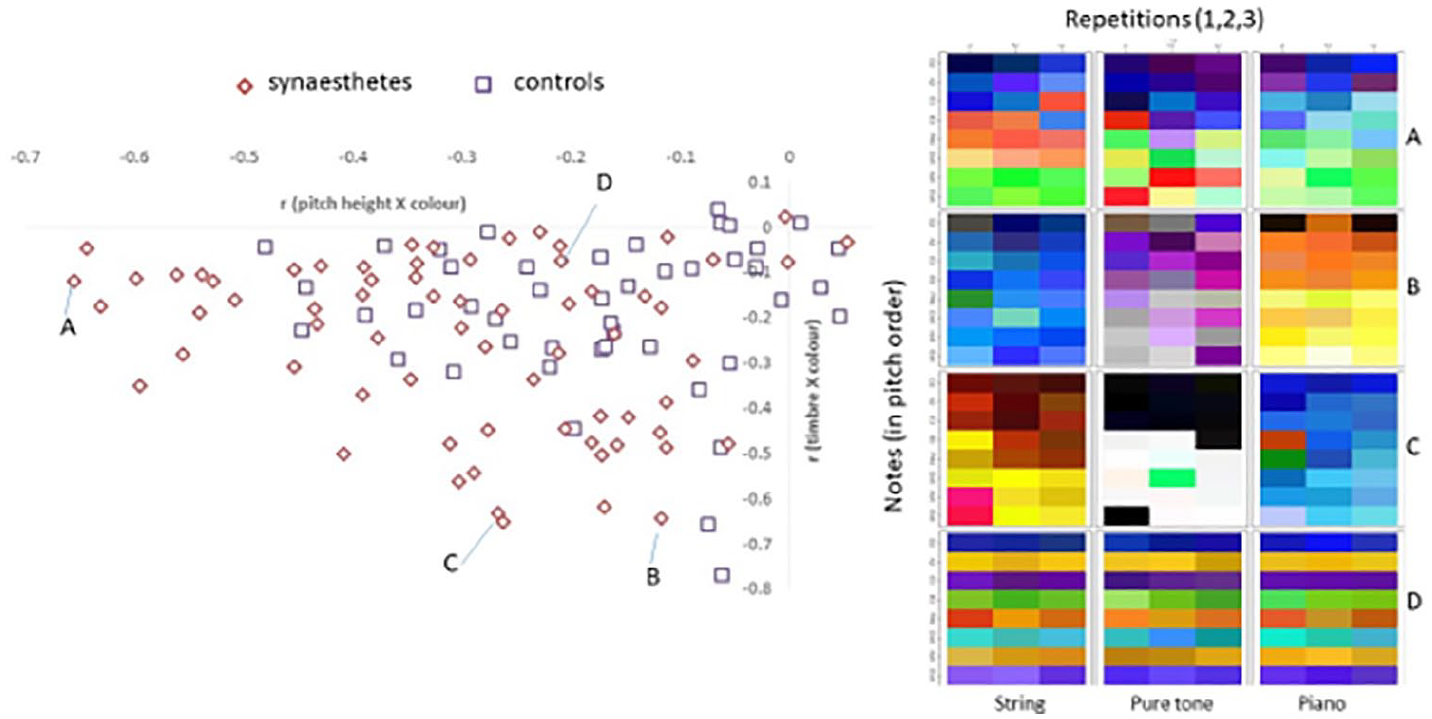
Representational Similarity Analyses (RSA) Correlates Similarity in Sound Space Against Distance in Color Space (A Negative Correlation Means That Similar Sounds Generate Close Colors).
Is there a synaesthetic color palette for sounds?
Here we looked at colors in terms of 11 basic color categories (red, blue, green, and so on). The relative probability of choosing a certain color category (irrespective of sound stimulus) differed between synesthetes and non-synesthetes: A chi-squared test showed significantly different distribution of Berlin-Kay color categories, χ2(10) = 188.059, p < .001. Figure 9 shows the standardized chi-squared residuals for each color; synaesthetic musical note-color associations are significantly more likely to be yellow, brown, orange, and significantly less likely to be black and green. The difference in color palettes can be exploited by a Naive Bayes classifier to discriminate synesthetes from non-synesthetes with a good degree of accuracy (accuracy = .807, sensitivity = .809, specificity = .804, AUC = .805, 95% CI [.722, .889]). This corresponds to an effect size of d = 1.22 (Rice & Harris, 2005).
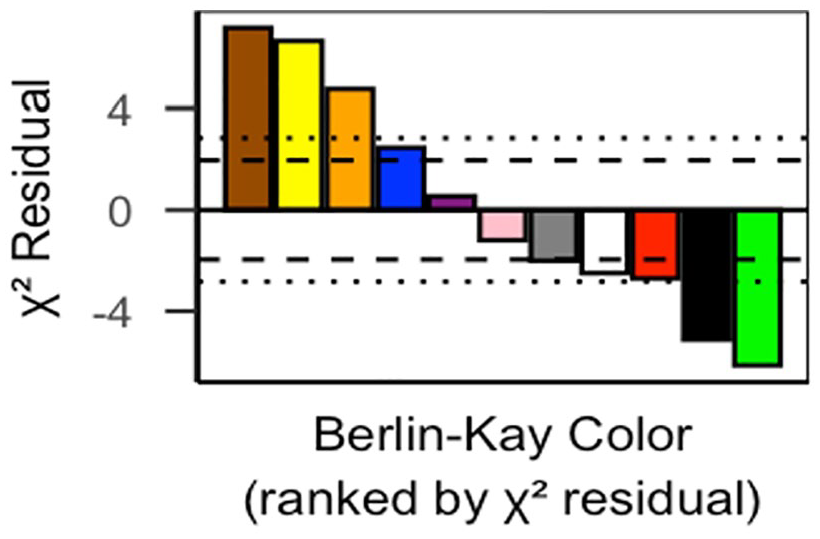
A Synaesthetic Sound-Color Palette.
In summary, there is evidence of a distinctive synaesthetic color palette for musical note-induced colors. This parallels that reported for grapheme-induced colors (Rouw & Root, 2019), but they are not exactly the same. When using the grapheme-color palette classifier (from Rouw & Root, 2019) to classify music-color synesthetes in the present study, the AUC was only .526 (p = .368). When using the musical note-color palette classifier in the present study to classify grapheme-color synesthetes from Rouw and Root (2019), the AUC was .69 (p < .001). A post-hoc analysis shows that this discrepancy may be driven largely by achromatic colors (black, white, gray) that are more diagnostic in grapheme-color synaesthesia. Excluding these yielded significant results (AUC > .7) in all directions (i.e. both types can be diagnosed from both palettes). That is, the chromatic color palette may be a distinguishing feature of synaesthesia across disparate inducers.
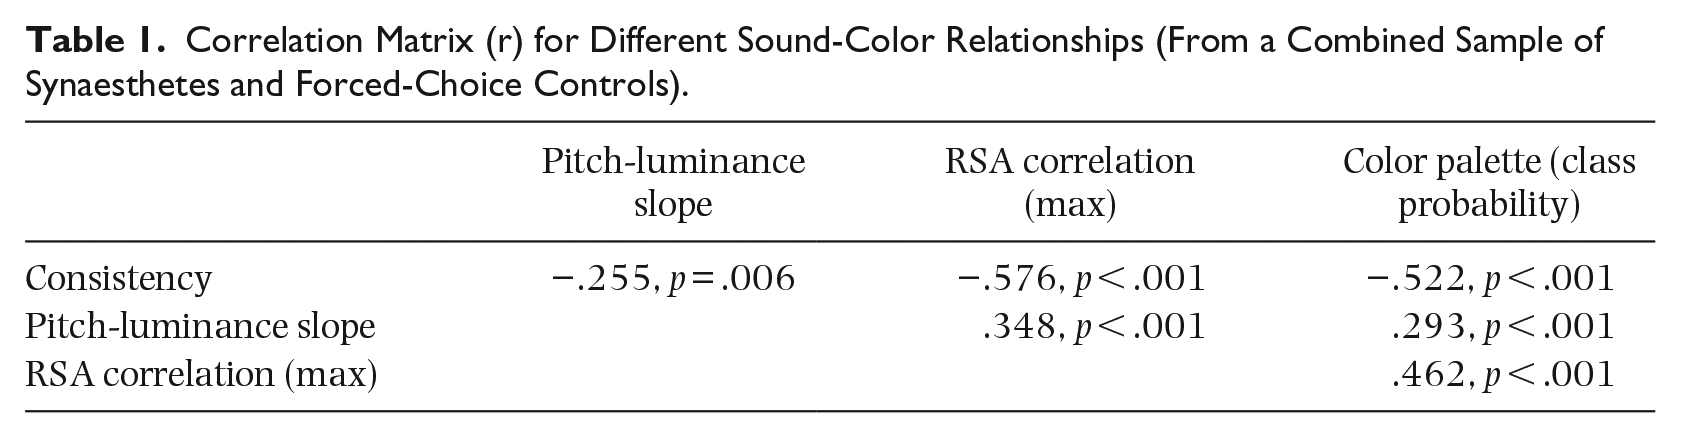
A diagnostic measure for musical note-color synaesthesia?
Selecting a high proportion of colors would be an initial step for identifying candidate synaesthetes, so the main challenge lies in delineating synaesthetes from controls when many colors have been selected. The four indicative musical note-color characteristics identified here tend to be correlated with each other (Table 1), although not so high as to suggest redundancy. As such, one diagnostic solution is to take a composite measure of these characteristics. Figure 10 shows the results of simply pooling whether each person meets the criteria for being a synaesthete based on the prior unidimensional ROC curve analyses; thus, each person can be given a score between 0 and 4 depending on whether they behave like a synaesthete in terms of the four dimensions namely consistency, pitch-luminance slope, RSA correlation (i.e., having systematic sound-color relationship to timbre or pitch), and color palette. Synaesthetes tend to pass far more of these criteria (M = 2.853, SD = 1.175) than controls (M = .935, SD = 1.012), and the effect size is very large (d = 1.720); far larger than any of the other features in isolation (range = .73–1.22).
Correlation Matrix (r) for Different Sound-Color Relationships (From a Combined Sample of Synaesthetes and Forced-Choice Controls).
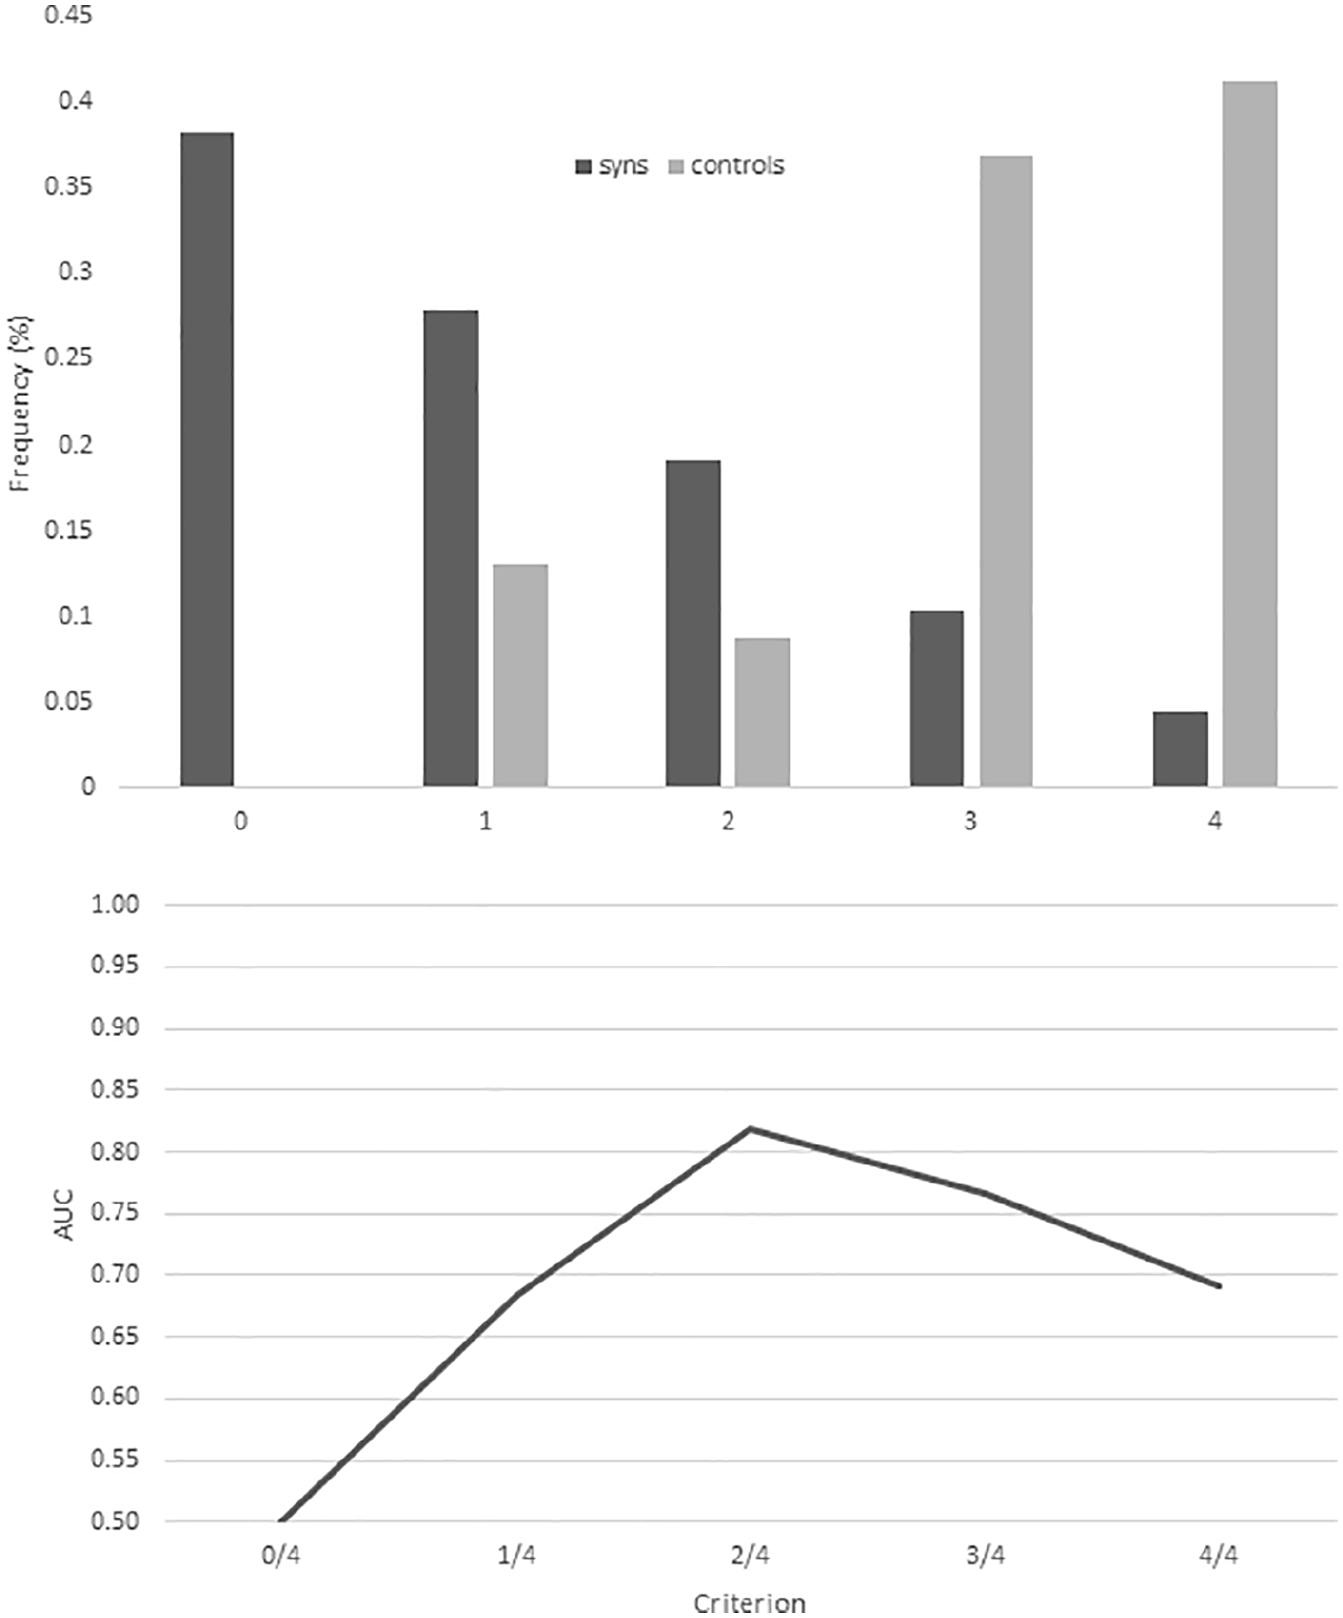
Top: The Probability of Passing Four Different Measures of Sound-Color Association That Are Indicative of Synaesthesia: Within-Item Consistency; Pitch-Luminance Slope; Representational Similarity Analysis (Maximum Correlation Based on Timbre, Pitch Height, or Pitch Class); and Color Palette.
Discussion
The first part of this study assessed musicality and musical preference, using previously validated measures, in people with and without synaesthesia. A key part of our experimental design was to contrast synaesthetes for whom music (and other sounds) elicits color versus those with other forms of synaesthesia. We aimed to determine whether musically-induced visual experiences might have a direct impact, versus synaesthesia more generally having an impact (because it is linked to different cognitive abilities and traits). We find evidence consistent with both. Music-color synaesthesia has a direct and specific impact on musical preference and active musical engagement (i.e., not found for other forms of synaesthesia). Synaesthesia per se was linked to other measures of musicality (e.g., singing, perceptual skills) albeit with an additional advantage for music-color synaesthetes. The second part of the study examined musical note-color associations themselves, this time contrasting music-color synaesthetes against non-synaesthetes. We show consistent and structured mappings between musical notes and colors in synaesthetes, some of which are qualitatively similar across synaesthetes and non-synaesthetes (pitch-luminance correspondences), and others which appear special to synaesthetes (a different color palette). The discussion considers these two broad areas in turn considering theoretical implications, limitations, and future directions.
Synaesthesia, music preference, and musicality
The fact that differences in musical preferences are linked specifically to music-color synaesthetes (rather than synaesthesia in general) points to one candidate mechanism: Some music is presumably more interesting to look at (e.g., more colorful). What is more surprising is that it does so in a systematic way, that is, synaesthetes agree on what types of music they prefer. Synaesthetic experiences to music, while variable, are not idiosyncratic (as shown by our analysis of musical note-color associations), and this may explain the origin of this group-wise bias in preferences. Further research using musical excerpts from each genre and quantifying the nature of the visual experiences (not limited to color) will be needed to understand why it particularly affects the R&C category, which includes classical and jazz. Rated excerpts are available that would be suitable to explore this (Rentfrow et al., 2011).
With regards to musicality, there is evidence that synaesthetes differ from non-synaesthetes in many respects, including general musical sophistication, even if they do not report music-color synaesthesia. This observation requires verification with objective tests, but at the very least, these self-report measures (e.g., the Perceptual Abilities subscale of the Gold-MSI) have been shown to be related to performance on objective tests of beat perception and melody memory (Müllensiefen et al., 2014). Enhanced musicality in synaesthetes who lack visual experiences to music may be explained in terms of synaesthetes possessing a wider skillset that is conducive to musicality. This includes better memory (for both musical and non-musical stimuli), mental imagery, and personality traits linked to creativity (e.g., Lunke & Meier, 2018; Rouw & Scholte, 2016; Spiller et al., 2015). Music-color synaesthetes showed higher musicality than other synaesthetes and non-synaesthetes, which suggests some additional mechanisms in them beyond those linked to synaesthesia more broadly. Here, it may be that their visual experiences function like a tool: They can “see” the structure of music, “see” when they sing out of tune, and so on. However, there is another possibility that cannot be discounted, namely that their visual experiences drive more engagement with music, and it is the extra engagement itself that hones their expertise. In either account, visual experiences are important either directly or indirectly (via engagement).
Musical note-color associations in synaesthetes and non-synaesthetes
Several studies have shown that music-color synaesthetes are more consistent in their associations to notes than non-synaesthetes (Ward et al., 2006), but there is no consensually agreed set of stimuli or normative values for using this diagnostically, unlike for other forms of synaesthesia. The aim of this study was to provide such a test, as well providing novel data concerning the characteristics of music note-color correspondences. By “diagnostic” we mean some reproducible method for determining who has (or is likely to have) this form of synaesthesia but noting that this is a purely scientific judgment (as opposed to a medical or legal diagnosis). Although the study was successful on these fronts, the solution is not entirely simple: Music-color synaesthetes differ in multiple ways from non-synaesthetes (any of which can be considered diagnostic), and music-color synaesthetes differ from each other. With regards to the latter, we used a method called RSA (e.g., Haxby et al., 2014) which is most commonly used in neuroimaging but is suitable here (for a similar approach in synaesthesia, see Watson et al., 2012). This measures the degree of similarity between sounds (defined a priori) and colors (observed in the data) to identify three patterns: timbre-color, pitch height-color, and pitch class-color. Most music-color synaesthetes show some mix of the first two. Although these distinctions have been noted before (e.g., Day, 2005; Glasser, 2023), we provide a novel means of quantification of these patterns.
Cross-modal correspondences found in the general population between pitch and luminance have sometimes been taken as related to synaesthesia, for example, as remnants of early synaesthetic states that might hypothetically exist in all neonatal brains (Maurer & Mondloch, 2006). However, the fact that these appear to be found in a wide variety of groups including chimps (Ludwig et al., 2011), infants (Haryu & Kajikawa, 2012), and adults both with and without synaesthesia (Ward et al., 2006) might imply that they are not related to synaesthesia at all (Deroy & Spence, 2013). Here, however, we simply argue that music-color synaesthetes do differ at least in some ways from non-synaesthetes, even while both show similar trends (e.g., higher pitch = more luminant colors). The pitch-luminance difference we found here emerged from using a larger sample than prior research (e.g., Ward et al., 2006) and, arguably, a more sensitive metric (slope of the pitch-luminance function). The most obvious explanation is that synaesthetes are more tuned in to pitch-luminance correspondences because they can “see” them (whereas others infer them), although differences in musical engagement may also play a role. A somewhat different argument would be that pitch-luminance correspondences are absolute in synaesthetes (a piano tone of 440 Hz is a fixed luminance) but relative in non-synaesthetes (a tone of 440 Hz could be high or low depending on context, and making the inferred luminance more unstable). There is evidence for the latter from cross-modal matching studies (for a review and discussion, see Spence, 2019). But one outstanding question is whether sensitivity to pitch-luminance correspondences is related to having music-color synaesthesia specifically, rather than having synaesthesia per se (we did not have a group with other forms of synaesthesia that would speak to this).
Beyond pitch-luminance, relatively little is known about why sounds evoke the particular colors that they do (at either an inter-subject or intra-subject level). One theory is that emotion acts as the bridge such that, for instance, unpleasant music is associated with unpleasant colors (Palmer et al., 2013, 2016). Whether this still applies when using single tones, as here, rather than music per se is unknown. However, there are group differences in the distribution of colors, which suggests a possible unique contribution of synaesthesia that goes beyond a mechanism of this kind. Synaesthetes are more likely to experience brown/orange/yellow sounds and less likely to have green sounds. This color palette is as diagnostic for music-color synaesthesia as any other measure we found. Similar colors were also reported to discriminate grapheme-color synaesthetes (with black/white/gray also being important here too; Rouw & Root, 2019). We can only speculate why these colors are more likely to dominate. Natural objects relative to backgrounds tend to be warmer colors (Rosenthal et al., 2018), and synaesthetic “objects” may tap into this statistical association. It is also important to establish that this finding is generally true and not limited to the pool of stimuli used here (which did not probe all notes within the musical scale).
Given that there are multiple ways in which music-color synaesthetes differ from non-synaesthetes, there are multiple ways in which one could apply a diagnostic measure. Here we considered four such characteristics assuming participants choose enough colors in the first place (e.g., >50%): consistency, pitch-luminance slope, sound-color representational similarity, and overall color palette. Notably, at least for the variant of synaesthesia studied here (music-color), there is no statistical reason for choosing consistency as a single diagnostic measure (although one might do so to maintain comparability within this field). However, we demonstrate that combining measures, that is, passing through multiple cutoff thresholds, is likely to be useful diagnostically. Although one could suggest a binary cutoff (e.g., passing two or more of these), it would be more reasonable to consider different degrees of evidence for being a synaesthete. Having two or more of these features indicates that a person is more likely to be a synaesthete relative to control; having three is strong evidence; and having all four is compelling evidence (nobody from our control group showed this pattern).
In summary, we have provided important new insights into the nature of synaesthesia (similarity and difference to cross-modal correspondences or imagined colors to sounds) and also the reach of synaesthesia into other cognitive domains (namely, music). We speculate that there might be direct benefits linked to having music-color synaesthesia (i.e., the concurrent experiences may be useful in musical cognition) as well as indirect benefits linked to synaesthesia per se (because synaesthesia is linked to certain traits and skillsets that go beyond its manifestation as specific inducer-concurrent associations). The findings have important implications for the music profession: Not only are synaesthetes likely to be over-represented but they may also bring with them different skillsets or gravitate toward certain roles or types of music. For the wider public, the results chime with a wider interest in neurodiversity and support the view that differently wired brains may be suited to different niches.