
Abstract
Divergent thinking (DT) enables flexible thinking and the generation of a wider range of original ideas that form the basis of creativity. Although personality traits and music listening have been found to be positively correlated with DT performance, the association remains inconclusive. Furthermore, there is a debate regarding whether originality should be included as an index to measure DT. The present study examines the association between DT, personality, and classical music listening. There were 162 Malaysian adults who participated in this experiment. Participants were randomly allocated to either happy, sad classical music (i.e., listen to a repeated clip of happy or sad music), or silent conditions (i.e., no music was played). DT and personality were assessed with Figural and Realistic DT Tests and 44-item personality model with five broad factors, respectively. Positive intercorrelations were found between fluency, flexibility, originality, and DT total score. A weak positive correlation was revealed between DT total score and openness trait. However, there was no significant difference between happy, sad music, and silent conditions on DT performance. The findings support the notion that fluency, flexibility, and originality are the essential indices in measuring DT performance. The results suggest that open-minded people have better DT performance.
Divergent thinking (DT) and convergent thinking are the thinking processes required in creativity (Guilford, 1950). Convergent thinking typically requires only one best-fit or correct answer to a given question (Fasko, 2001; Jones & Estes, 2015), whereas DT allows the generation of multiple alternative and original ideas (Acar & Runco, 2017; Runco, 2014). DT is a form of thought process that usually occurs in a spontaneous and unstructured way to generate creative ideas by exploring as many solutions as possible (Guilford, 1968). Some researchers have argued that DT is more closely related to the concept of creativity as compared with convergent thinking, because for a person to be creative, they need to think from various perspectives and to be able to generate various alternative solutions (Kaufman et al., 2008; Runco & Acar, 2012).
In typical measures of DT, individuals are required to generate as many ideas as they can for every question. The generated ideas will then be assessed on indices such as fluency, flexibility, originality, elaboration, and/or usefulness (Acar et al., 2017; Acar & Runco, 2014; Campion & Levita, 2013; Frith & Loprinzi, 2018; Ritter & Ferguson, 2017). Fluency, flexibility, and originality, as selected in this study, are the most commonly adopted indices in measuring overall levels of DT. Fluency refers to the number of distinct ideas produced. It reflects an individual’s ability to generate a variety of ideas to a given question or scenario (French et al., 1963; Runco & Acar, 2012). Some previous studies in DT only measured fluency due to ease of scoring (Benedek et al., 2014; Preckel et al., 2011). However, simply equating fluency with DT may be insufficient, as it may ignore the quality of the ideas (Acar et al., 2017; Runco & Acar, 2012). Next, flexibility refers to either the number of shifts from one conceptual category to another, or the number of conceptual categories used, such as whether the ideas are coming from the same aspect, category, or domains (Kenett et al., 2018; Nijstad et al., 2010). Last, originality refers to the quality of ideas and how the ideas are distinct from one another (Abraham, 2019; Acar et al., 2017; Weiss et al., 2020).
A few studies reported a strong positive correlation between originality and fluency (Jung et al., 2015; Silvia, 2008), and thus argued that these two indices are redundant, and originality can be dropped. As measuring originality requires more effort, it may be relatively straightforward to just measure fluency. However, some researchers stressed that originality is statistically different from fluency and is theoretically essential, especially when the participants are well instructed (Forthmann et al., 2016; Nusbaum et al., 2014). Specifically, when the participants were instructed to “be creative,” they gave more novel ideas, whereas when they were instructed to “be fluent,” more ideas were being generated (Forthmann et al., 2016; Nusbaum et al., 2014).
The relationship between fluency and flexibility also varies depending on the tests used. For instance, previous studies found a very strong positive correlation between fluency and flexibility with the Alternative Uses Task for brick (Abdulla Alabbasi et al., 2021; Ritter & Ferguson, 2017) and tin can (Gocłowska et al., 2018), and the Berlin Intelligence Structure Test (Käckenmester et al., 2019); a moderate strong positive correlation with Alternative Uses Task for brick and string (Gocłowska et al., 2018), and the Problem Generation Test (Abdulla Alabbasi et al., 2021); and no correlation with the Figural Divergent Thinking Test (FDTT) (Abdulla Alabbasi et al., 2021). The existence of a strong positive correlation between fluency and flexibility challenges the independence of these two indices in measuring overall DT. Thus, some researchers (Käckenmester et al., 2019) decided to focus on fluency only, as flexibility involved less reliable and highly repetitive information. However, some researchers suggested that fluency and flexibility function differently and independently in measuring DT (Guilford, 1967; Kharkhurin, 2008).
Although fluency, flexibility, originality, and overall DT have been found to be interrelated (Beketayev & Runco, 2016; Ritter & Ferguson, 2017), the relationship between fluency, flexibility, and originality are inconsistent. To date, there is no conclusive decision on how many indices are required to measure overall DT (Forthmann et al., 2019, 2016; Jung et al., 2015; Nusbaum et al., 2014; Silvia, 2008).
Personality and DT
Personality refers to the individual differences in the characteristic patterns of affection, behavior, and cognition (Matthews & Corr, 2016). A common model used to assess personality is the personality model with five broad factors (FFM-44), which includes traits like extraversion, agreeableness, conscientiousness, neuroticism, and openness. Researchers consistently found a positive correlation between openness and DT (Forthmann et al., 2018; Käckenmester et al., 2019; Scratchley & Hakstian, 2001; Sun et al., 2018; Walker & Jackson, 2014). While some studies have reported a positive correlation between extraversion and DT (Chamorro-Premuzic & Reichenbacher, 2008; Gocłowska et al., 2018), and a negative correlation between agreeableness and DT (Batey et al., 2009; Myszkowski et al., 2015), these two patterns were not consistent. Based on a systematic review by Puryear et al. (2017), openness is the only personality trait that consistently and positively correlates with DT.
Open-minded people are more likely to notice and appreciate unusual, complex, and novel information in a variety of ways, which is attributed to their higher levels of DT (DeYoung et al., 2014; Käckenmester et al., 2019; Walker & Jackson, 2014). Sun et al. (2018) revealed that open-minded people showed greater cognitive flexibility, with a co-activation of brain activity in several regions, namely, the prefrontal cortex, inferior parietal lobule insula, and middle temporal gyrus insula during creativity tasks. These brain regions are associated with executive functioning, visuospatial processing, and cognitive processing, respectively (Goyal et al., 2008; Sturm et al., 2016; Xu et al., 2015). It is apparent that DT is a higher-order cognitive ability that involves a variety of cognitive abilities.
Effects of music listening on DT
Music can alter people’s moods (Baylan et al., 2016; Fox & Moore, 2021) and has also been found to contribute to an individual’s DT performance (Phillips et al., 2002; Ritter & Ferguson, 2017). A growing body of literature has revealed that DT performance and/or creative cognition can be facilitated by listening to various types of music before or during the tasks, including happy classical music (Callaghan & Growney, 2013; Eskine et al., 2020; He et al., 2017; Ritter & Ferguson, 2017), sad classical music (Callaghan & Growney, 2013; He et al., 2017), relaxing music (Hilton et al., 2004; Papuc et al., 2017), jazz (Yamada & Nagai, 2015), electronic music (Campion & Levita, 2013), and hip-hop (Eskine et al., 2020). A few explanations have been proposed to explain why listening to music contributes to better DT.
First, listening to uplifting and happy music induces a positive mood that facilitated flexible thinking and helped people come up with more novel and divergent ideas (Campion & Levita, 2013; Ritter & Ferguson, 2017). The hedonic contingency theory (Wegener & Petty, 1994) suggested that people in a positive mood use more critical observation and think from various perspectives while doing problem-solving tasks (Baas et al., 2008; De Dreu et al., 2008). In comparison, the “broaden” hypothesis of positive mood (Fredrickson, 2001) proposed that positive mood will broaden people’s attention span and promote a wider than usual range of creative and alternative ideas (Ansburg & Hill, 2003; Fredrickson & Branigan, 2005; Rowe et al., 2007; Yamada & Nagai, 2015). This evidence may imply that DT is facilitated by the induction of positive mood rather than a direct effect of the music itself.
Second, neurological evidence revealed that music listening promotes modulation of the cerebral circulation and music-associated activation of the limbic system (Baumgartner et al., 2006; Frühholz et al., 2014; Koelsch, 2010, 2015), which involves emotional regulation (Schumacher et al., 2018; Zhu et al., 2019). Blood and Zatorre (2001) suggested that listening to uplifting music will decrease cerebral blood flow in the hippocampus and amygdala while increasing the midbrain blood flow. This enhances positive moods and inhibits negative moods, and subsequently facilitates flexible thinking (Blood & Zatorre, 2001; Wang et al., 2017; Wilkins et al., 2014).
Some studies found that sad and relaxing music (Callaghan & Growney, 2013; He et al., 2017; Hilton et al., 2004; Papuc et al., 2017) and negative mood (Gasper, 2003; George & Zhou, 2002) affected DT performance. George and Zhou (2002) proposed that listening to sad music signals a problematic sense and triggers the exertion of extra effort to come up with alternative and novel ideas. However, Papuc et al. (2017) suggested that listening to relaxing and low arousal music causes an increase in alpha brain waves that function to diminish cognitive load and produce innovative ideas.
Several studies found no correlation between listening to music and DT (Črnčec et al., 2006; Frith & Loprinzi, 2018; Hilton et al., 2004; Threadgold et al., 2019). Background music, especially with lyrics, was suggested to act as a distractor that potentially draws people’s attention away from the tasks (Lohse & Sherwood, 2011; Perham & Vizard, 2010; Threadgold et al., 2019). Frith and Loprinzi (2018) suggested that music listening may cause a cognitive shift to attentional constriction. Music has also been proposed as an effective distraction to reduce pain and anxiety levels in a clinical setting (Chirico et al., 2020; Young et al., 2010).
Based on the above-mentioned evidence (e.g., He et al., 2017; Ritter & Ferguson, 2017), it seems that there is an interplay between music and mood on DT (Garrido & Schubert, 2015; Stewart et al., 2019), although this is not supported by all (Frith & Loprinzi, 2018; Threadgold et al., 2019). Therefore, the present study intends to examine the effect of music listening on DT performance, with the following three conditions: happy classical music, sad classical music, and silent control conditions.
The present study
To the best of our knowledge, the relationship between DT, personality, and listening to classical music has remained largely unexplored in Asia. Due to (1) the importance of DT, (2) inconsistent intercorrelations between fluency, flexibility, and originality, as part of the DT indices, (3) inconclusive use of various indices to measure DT, (4) inconsistent findings between personality traits and DT, and (5) inconsistent findings of the effect of music listening on DT, the present study aims to fill these gaps by examining the association between DT, personality, and listening to classical music. We hypothesized that (1) there is a positive intercorrelation between fluency, flexibility, originality, and overall DT; (2) overall DT is positively correlated with openness, but not with the other four domains of FFM; (3) fluency, flexibility, and originality are positively correlated with openness, but not with the other four domains of FFM; (4) there is a significant difference in overall DT scores between the three experimental conditions (happy, sad, and silent); and (5) there is a significant difference between the three experimental conditions (happy, sad, and silent) in fluency, flexibility, and originality.
Methods
Design
This experiment used a between-sample design. The dependent variable was overall DT score, which was made up of the three indices, that is, fluency, flexibility, and originality; whereas the independent variables were personality traits and music conditions (with three levels: happy, sad, and silent). Participants were randomly allocated into one of the three conditions by using a Gorilla™ randomizer.
Materials
This experiment was conducted using Gorilla™ software (www.gorilla.sc) (Anwyl-Irvine et al. 2019).
DT questionnaire
The Runco Creativity Assessment Battery (rCAB) was chosen to measure participants’ DT performance (Creativity Testing Services, 2019). Two out of the eight subtests in rCAB were selected, namely, the FDTT and the Realistic Divergent Thinking Test (RDTT).
To avoid fatigue effects, we selected only 2 subtests (FDTT and RDTT) instead of administering all tests, after consulting with the test creator. Such an approach has been used by other researchers (see Yu et al., 2020; Zhang & Zhang, 2017). Furthermore, not all tests are applicable to the current sample or the selected medium—specifically, SWOT (strengths, weaknesses, opportunities, and threats) entrepreneurial DT is beyond the scope of current study, while verbal DT test may not be appropriate for the online medium, and the Tangible 3D DT test was designed for preschool children.
Both subtests consisted of three items and answers given by participants were later rated by 2 independent raters for three indices: fluency, flexibility, and originality. For FDTT, a line(s) or shape(s) drawing was shown in each item, and participants were required to look at the figure and list as many answers as they could. For RDTT, a real-life problem was shown for each item, and participants were required to give as many solutions as they could. There was no time limit for all the tasks given. rCAB has been found to have good reliability with Cronbach’s α of .86 (fluency), .69 (flexibility), .83 (originality), inter-rater reliability of higher than .95 (Ren et al., 2017; Yu et al., 2020; Zhang & Zhang, 2017).
Personality questionnaire
FFM-44 was chosen to measure participants’ personality traits (Benet-Martínez & John, 1998; John et al., 1991, 2008). The five domains of FFM-44—extraversion (E), agreeableness (A), conscientiousness (C), neuroticism (N), and openness (O)—have 8, 9, 9, 8, and 10 items, respectively. The participants were required to indicate their level of agreement for each item using a range from 1 (Disagree strongly) to 5 (Agree strongly). All 16 reverse-scored items were re-coded before further analysis. The total mean scores were calculated for each domain. Lower scores indicated lower levels of that personality trait. According to Hee (2014), FFM-44 has good reliability and validity, with Cronbach’s α ranging from .74 to .90 for reliability, and .57 to .80 for validity, based on data collected in Malaysia.
Music stimuli
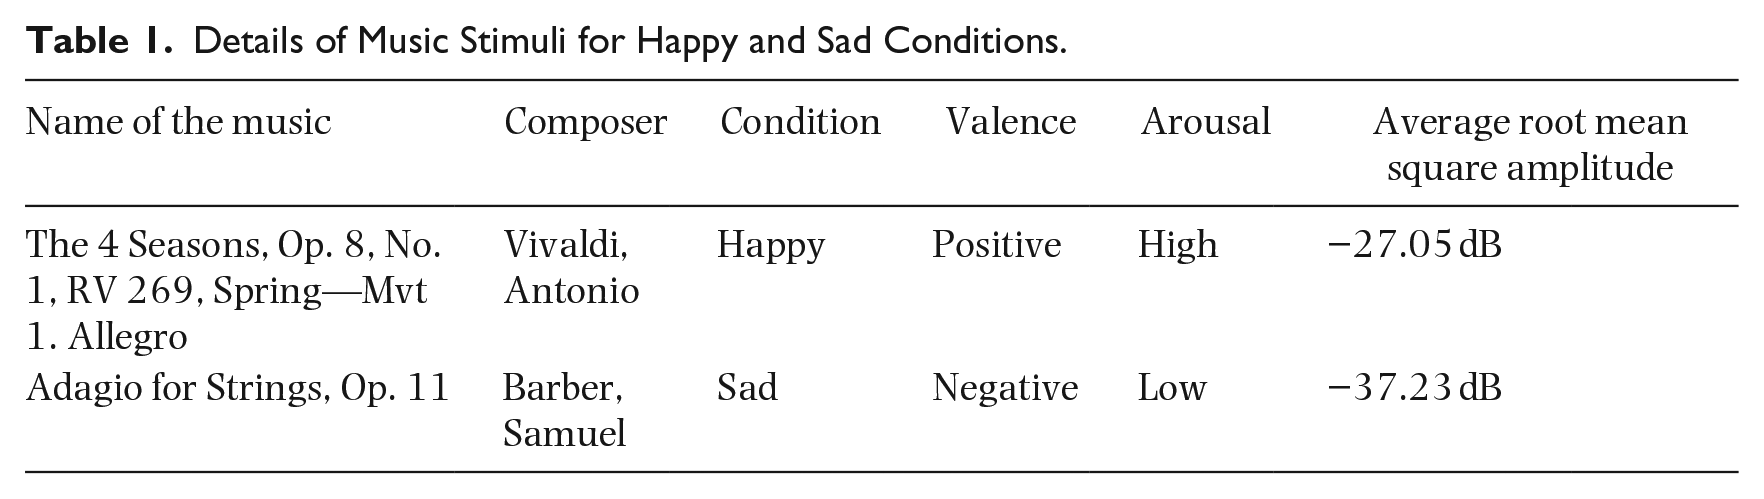
Two pieces of music were chosen based on previous research (Ritter & Ferguson, 2017). Detailed information about the music stimuli used can be found in Table 1. Happy and sad music were repeated automatically and continuously while the participants were completing the DT tasks. An audio clip saying “computer” was inserted into both pieces of music every 3.39 min. The participants were required to indicate the word they heard (“computer”) at the end of the experiment to double-check if they hear the audio. In the silent condition, participants performed the tasks without any background music.
Details of Music Stimuli for Happy and Sad Conditions.
Procedure
The experiment was conducted online due to the need for physical distancing during the Covid-19 pandemic. Participants were automatically randomly assigned to one of the three conditions. After informed consent was obtained, participants were asked to provide a unique password in case they wanted to remove their data. Participants were reminded to complete the test in a quiet condition. They were asked to wear earphones to ensure standardization and avoid distraction. For the music conditions, participants were required to click a button to start the music. They were then asked “Did you hear any music? If ‘Yes,’ please adjust it to your comfortable volume; if ‘No,’ please contact the researcher via the email provided.” All participants then completed the FDTT and RDTT. For music conditions, the music was played and repeated until the participants had completed both tests of DT. Participants were then asked to write down the “word” they heard when the music was playing. Following that, all participants completed the FFM-44 and demographic questions. Participants were debriefed upon completion. The overall experiment took approximately half an hour.
Participants
The targeted populations were young and middle-aged Malaysian adults. Prescreen restrictions were set for the following criteria: Malaysians, aged between 18 and 55 years and with hearing within the normal limits. Psychology students gained course credit of .5 hr, whereas the rest of the participants were recruited through social media platforms, email, or word-of-mouth. Power analysis using the G*Power 3.1.9.7 software (Faul et al., 2007) showed that with an effect size of .25 (Ritter & Ferguson, 2017), an α value of .05, and power of .80, a minimum sample size of 158 participants was required. One hundred and sixty-two participants participated in this online experiment, with 53 males, 107 females, and two participants who preferred to not disclose their gender, aged from 18 to 54 (M = 28.15, SD = 11.59). Among the overall 162 participants, the happy music condition consisted of 59 randomly assigned participants, with 20 males, 38 females, and one preferred not to disclose, age range from 18 to 54 (M = 27.39, SD = 11.25); the sad music condition consisted of 50 randomly assigned participants, with 16 males and 34 females, age range from 18 to 50 (M = 28.36, SD = 11.51); and the silence control condition consisted of 53 participants, with 17 males, 35 females, and one preferred not to disclose, age range from 18 to 54 (M = 28.79, SD = 12.20).
Data analysis
The analysis was conducted using the Statistical Package for the Social Sciences (Version 26).
Results
Intercoder reliability for rCAB
Intraclass correlations were used to check for the reliability of the scores calculated by the raters. The intraclass correlation between the two raters for all three DT indices was excellent (1.00), with intraclass correlations of .998 (originality), .998 (flexibility), and 1.00 (fluency).
Split-half reliability for FFM-44
The split-half reliability for all FFM-44 five domains was good, with the Spearman–Brown coefficient ranging from .73 to .85, and with .80 (extraversion), .73 (agreeableness), .73 (conscientiousness), .85 (neuroticism), and .75 (openness).
Intercorrelations between fluency, flexibility, originality, and overall DT scores
Parametric test assumptions were tested and approved, with a normal distribution of data, no outliers, and homogeneity of variances. A Pearson correlation coefficient was computed to examine the relationship between fluency, flexibility, originality, and overall DT scores. There were very strong positive correlations observed between fluency, flexibility, and overall DT scores; whereas moderate positive correlations were observed when originality was tested with fluency, flexibility, and overall DT scores (see Table 2 for details). Hypothesis 1, that there would be a positive intercorrelation between fluency, flexibility, originality, and overall DT score was accepted.
Descriptive Statistics of Each Domain in rCAB and FFM-44, and Correlations for Overall Divergent Thinking Scores and FFM-44 (n = 162).
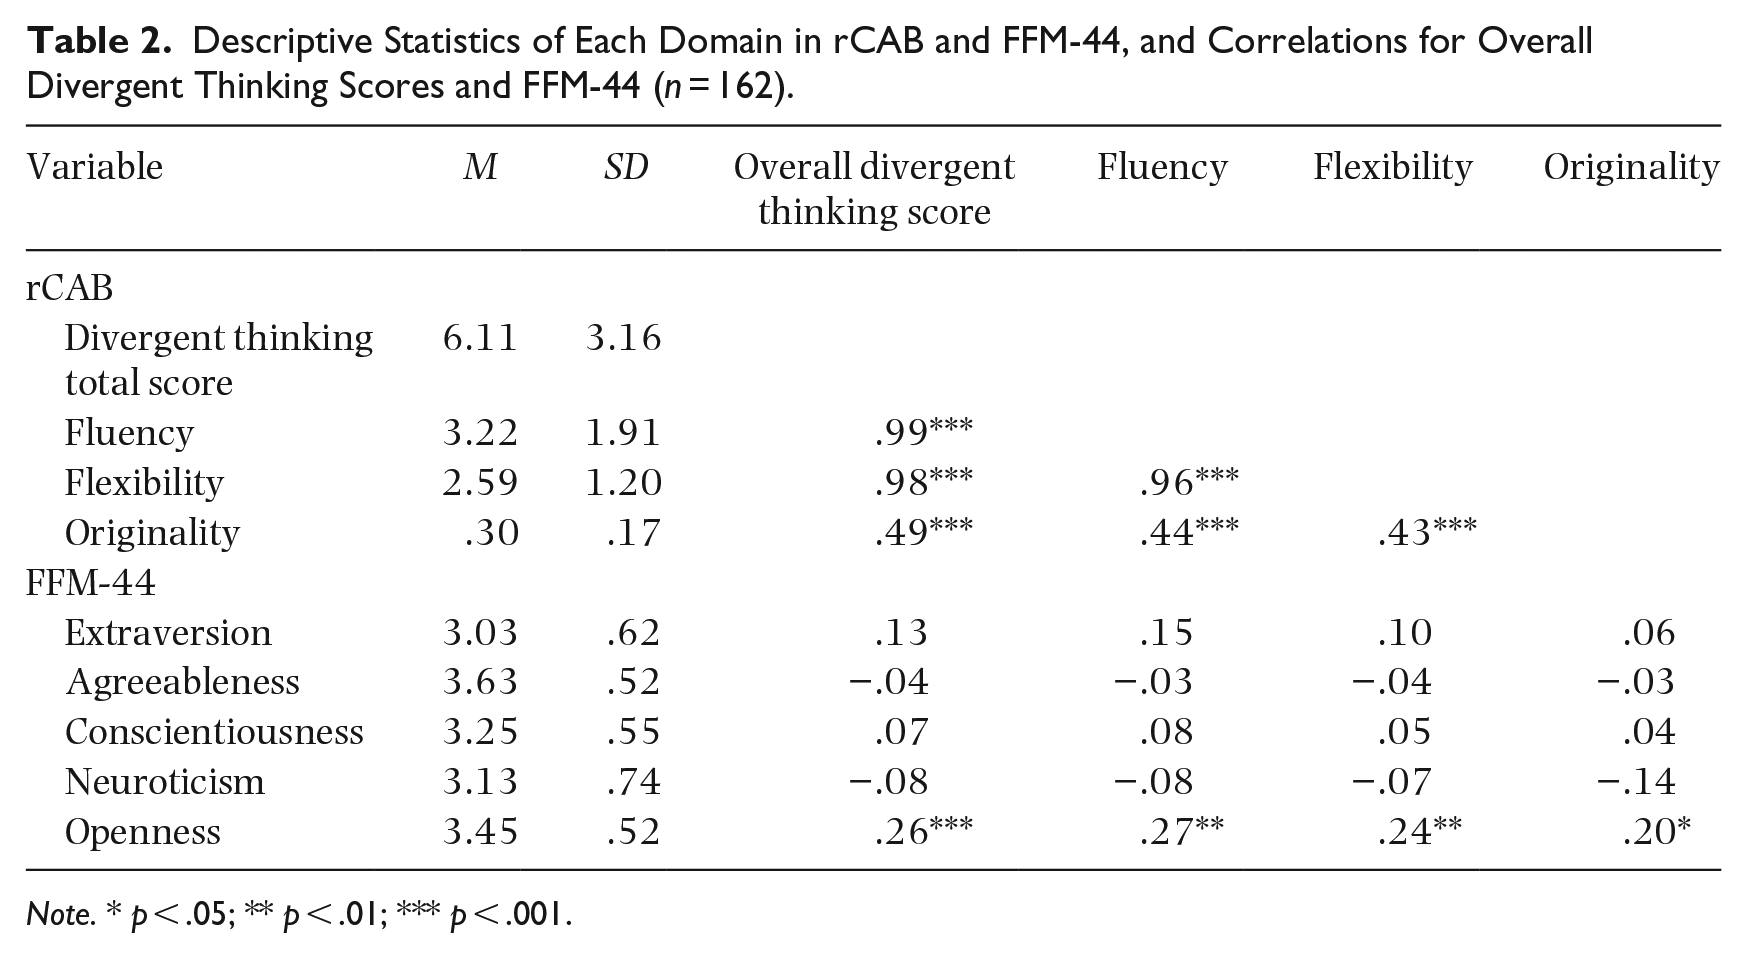
Note. * p < .05; ** p < .01; *** p < .001.
Correlation between DT total score and domains of FFM
A Pearson correlation coefficient was computed to examine the relationship between overall DT scores and the FFM personality traits. There was a weak positive correlation between openness and overall DT scores, whereas there was no correlation for the other four domains of FFM with overall DT scores (see Table 2 for details). Hypothesis 2, that the overall DT score is positively correlated with openness, but not with the other four domains of FFM was accepted.
Correlation between fluency, flexibility, originality, and domains of FFM
In addition, weak positive correlations were found between openness and the three DT indices, whereas no correlation for the other four domains of FFM with openness (see Table 2 for details). Note, however, there is a trend to significance for extraversion and fluency, r(162) = .15, p = .05. Hypothesis 3, that fluency, flexibility, and originality would be positively correlated with openness, but not with the other four domains of FFM was accepted.
The difference in overall DT scores between conditions (happy, sad, and silent)
A one-way ANOVA with overall DT score as the dependent variable and music conditions as the independent variable revealed no significant difference between the conditions, F(2, 159) = .35, p = .71; thus, there is no significant evidence to support hypothesis 4. This result indicates that there is no significant difference between music and silent conditions on DT performance, with happy music (M = 6.34, SD = 2.64), sad music (M = 5.83, SD = 3.61), and silent condition (M = 6.11, SD = 3.29). The bar chart of this result is presented in Figure 1.
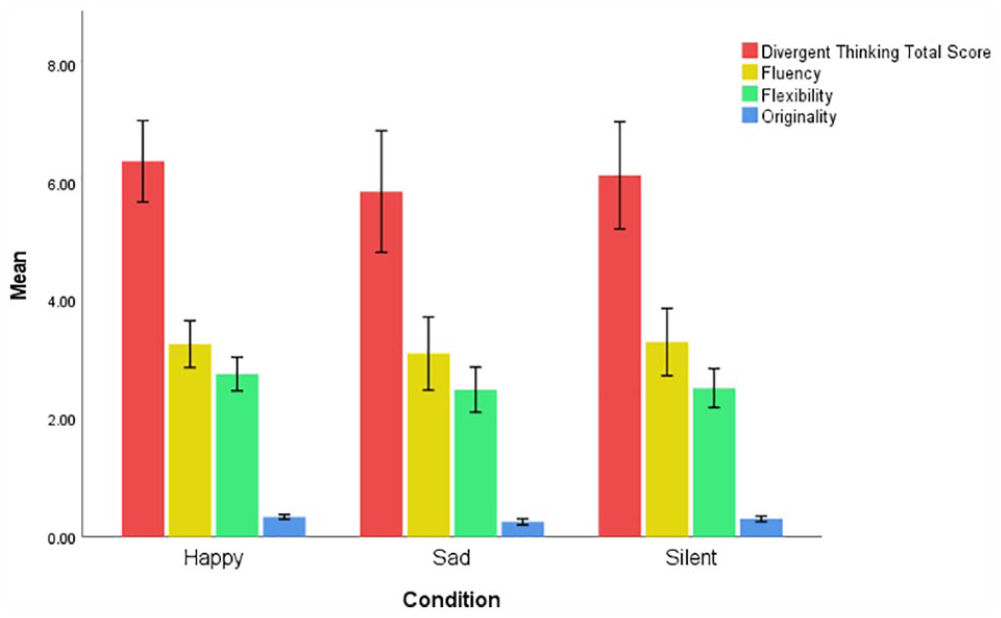
Mean Value of Overall Divergent Thinking Scores, Fluency, Flexibility, and Originality in Happy, Sad, and Silence Conditions.
The difference in fluency, flexibility, and originality between the conditions (happy, sad, and silent)
A one-way ANOVA with fluency as the dependent variable and music conditions as the independent variable revealed no significant difference between the conditions, F(2, 159) = .15, p = .86. A one-way ANOVA with flexibility as the dependent variable and music conditions as the independent variable revealed no significant difference between the conditions, F(2, 159) = .82, p = .44. However, a one-way ANOVA with originality as the dependent variable and music conditions as the independent variable revealed a significant difference between the conditions, F(2, 159) = 3.48, p = .03. Thus, Hypothesis 5 was partially accepted, as there was a significant difference between originality and music conditions (hypothesis supported) but no significant differences between fluency, flexibility, and music conditions (hypothesis not supported).
Post hoc multiple comparisons using the Bonferroni test between originality and music conditions, that is, happy music (M = .34, SD = .15), sad music (M = .25, SD = .18), and silent condition (M = .30, SD = .17) indicated that there was a significant difference between happy music and sad music conditions (Mean Difference = .08, p = .03), with participants in the happy music condition scoring higher than those in the sad music condition. However, there was no significant difference between happy music and silent conditions (Mean Difference = .03, p = .88) and no significant difference between silent and sad music conditions (Mean Difference = .05, p = .37).
Discussion
The current study investigated the association between DT, personality, and listening to classical music in a sample from a novel culture, namely Malaysian. There was a positive relationship between fluency, flexibility, originality, and overall DT scores. There was a positive correlation between overall DT scores and openness, but not with the other four domains in FFM. It was also found that DT performance was not enhanced by listening to classical music, suggesting that there was no effect of music listening on DT over a short timeframe.
The current findings were consistent with previous studies (Beketayev & Runco, 2016; Ritter & Ferguson, 2017), as there were positive intercorrelations between the DT indices, that is, fluency, flexibility, and originality, and positive correlations between the three indices and DT total score.
There was a moderate positive correlation between fluency and originality which in line with some studies (Forthmann et al., 2016; Nusbaum et al., 2014) that suggested originality was statistically different from fluency and was theoretically essential, especially when the participants were well-instructed.
The current results show a high correlation between fluency and flexibility, which challenges the independence of these two indices in measuring overall DT. However, this may be related to how we drew distinctions between conceptual categories, and how flexible the participants were in their answers. For example, even though moon and basketball were categorized as distinctive groups (see Method), for Mandarin-speaking participants, this may not be perceived as distinctive as for English-speaking participants, as these two answers (basketball—lan qiu and moon—yue qiu) shared a similarity (ball-like object—qiu) in Mandarin. With that in mind, we could not conclude if these two indices should be treated as distinctive indices. This warrants further investigation, with a need for future researchers to be mindful and sensitive to the language used by participants. Specifically, while considering the diversity of the classification (similarity in terms of function, outlook, and pronunciation), one should also take potential language differences into consideration.
Based on our findings of positive correlations between the three indices and overall DT scores, we strongly recommend the inclusion of separate measures of fluency, flexibility and originality, and specific instructions to increase the potential for obtaining unconventional and creative responses from the participants. While fluency emphasizes the quantity of the ideas, flexibility emphasizes the different categories of the ideas, and originality emphasizes the quality of the ideas (Dumas & Dunbar, 2014; Runco & Jaeger, 2012), thus capturing the distinctive aspects of DT.
In relation to personality, the current study found a positive relationship between DT total score and openness but not with the other four domains in FFM, which is consistent with past studies (Forthmann et al., 2018; Käckenmester et al., 2019; Sun et al., 2018; Walker & Jackson, 2014). The weak correlation between openness and overall DT scores (r = .26) is also in line with some studies (Forthmann et al., 2018; McCrae, 1987; Scratchley & Hakstian, 2001), which suggested that the correlation between openness and overall DT scores would generally range between .18 and .27. The weak correlation may be due to the types of DT tasks chosen and test instructions (see Kandler et al., 2016 and McCrae, 1987). Despite some earlier evidence showing an association between overall DT scores and extraversion (Chamorro-Premuzic & Reichenbacher, 2008; Gocłowska et al., 2018) and agreeableness (Batey et al., 2009; Myszkowski et al., 2015), we found no correlation between overall DT scores and the other four domains of FFM (extraversion, agreeableness, conscientiousness, and neuroticism). The current study found a weak positive correlation between the DT indices, that is, fluency, flexibility, originality, and openness but not with the other four domains in FFM. This is consistent with Käckenmester et al.’s (2019) study who found a weak positive correlation between fluency and openness; and Walker and Jackson’s (2014) study who found a weak positive correlation between fluency, originality, and openness. The current study found that there is a trend to significance for extraversion and fluency (p = .05) but with very weak positive correlation between extraversion and fluency, that is, .15.
Previous studies had highlighted the effectiveness of music listening on DT (Eskine et al., 2020; Ritter & Ferguson, 2017; Yamada & Nagai, 2015), but the present study failed to discern similar beneficial results. Our findings were consistent with some previous studies (Črnčec et al., 2006; Frith & Loprinzi, 2018; Threadgold et al., 2019).
There are a few possibilities to explain why music listening had no impact on DT here. First, the duration of music listening may be too short. Although the music was set to play for 30 min, 80.39% of the participants finished the tasks within 15 min, and only 7.84% of participants listened for 20 min or longer. According to Linnemann et al. (2017), a minimum of 20 min of music listening is needed to observe a beneficial effect. However, Campion and Levita (2013) claimed that only 5 min of music listening was sufficient to enhance participants’ DT, which supports the value of our findings.
Second, 94% of the participants in the sad music condition were able to answer “computer” correctly; however, only 58% of the participants in the happy music condition were able to answer “computer” correctly, whereas the rest either claimed that they heard nothing or that the music was distracting. We could argue that the volume of the music was set too low that participants were unable to hear the word, or perhaps participants were fully absorbed in the task, and it is also possible that the music on the testing platform might not have functioned properly at the time of testing for some participants. However, for the last assumption, the raw data indicated that all music was successfully played before the tasks within a 10-s window. Note also previous studies found that music may distract and negatively affect participants’ cognitive performance (Furnham & Strbac, 2002; Gonzalez & Aiello, 2019; Lohse & Sherwood, 2011; Perham & Vizard, 2010).
A recent study (Threadgold et al., 2019) shows that listening to music impairs creative thinking. The broad attentional scope (BAS) view of creativity proposed that background information such as music or sound may reduce people’s attention and result in the diffusion of attention for insight problem-solving (Jarosz et al., 2012). However, other psychologists argued that broadening attention may increase the generation of unconventional ideas (Friedman et al., 2003; Kasof, 1997; Liu, 2016; Moraru et al., 2016). Meanwhile, the focused attentional scope (FAS) perspective also stated that background information may reduce or draw the attention away from the focal task, hence negatively affecting the insight problem-solving skill (Lohse & Sherwood, 2011). Recent studies have proposed the importance of silence for cognitive tasks that require concentration (Radun et al., 2021). Researchers (Lohse & Sherwood, 2011; Perham & Vizard, 2010; Radun et al., 2021) suggested that people are more likely to focus and concentrate in the silent condition. As such, they may generate more ideas (fluency), increase the chance of having different categories of answers (flexibility), and have a higher chance of generating unique ideas (originality). However, the silent condition in the present study did not show any impact in facilitating DT either. Future studies are required to further investigate the effect of noise on DT, with the consideration of individual differences.
Since previous studies did find beneficial results of music listening before the DT tasks (Campion & Levita, 2013; Yamada & Nagai, 2015), future studies are suggested to explore long-term or habitual music listening (e.g., 4–8 months; Rizzolo et al., 2021) on DT. Future studies could also compare the results of this experiment obtained on the basis of a single listening episode with the results obtained on the basis of repeated listening, for instance, in weeks, months, or years.
The current study found that participants who listened to happy music had higher originality results that those in the silent condition, and with those who were being allocated to the sad music condition obtained the lowest score compared with the other two conditions. Ritter and Ferguson (2017) found that listening to happy music facilitated overall DT performance; whereas Campion and Levita (2013) showed that non-verbal originality and non-verbal fluency were enhanced after listening to music. However, our current finding suggests that listening to happy music only enhance performance on the originality aspect in DT but not in the fluency and flexibility aspects. Previous studies suggested that the underlying mechanism could be due to happy music listening induced a positive mood that facilitated people to produce novel ideas and helped in broadening people’s attention span, and thus, promoted a wider range of original and creative ideas (Ansburg & Hill, 2003; Campion & Levita, 2013; Fredrickson & Branigan, 2005; Ritter & Ferguson, 2017; Yamada & Nagai, 2015).
Limitation and suggestion for future studies
To the best of our knowledge, this may be the first experiment that research on the association between DT, personality, and listening to classical music in Malaysia. Malaysia is a multicultural, multi-ethnic, and multilingual country, with the three major ethnic communities, that is, Chinese, Malays, and Indians (Lewison et al., 2016). However, while the results can be compared with those from a Western context, this study did not examine any ethnic and cultural differences on DT performances. Therefore, future study is suggested to investigate whether there are any differences within ethnic groups in Malaysia and other multi-ethnic countries on DT performances. As mentioned in the “Discussion” section, language did play a role in scoring flexibility; thus, whether the same principle can be applied on different ethnic in Malaysia warrants further investigation.
Conclusion
The current findings provide evidence that originality is one of the essential indices used to measure DT performance, and it should be measured together with fluency and flexibility. The current findings suggest that DT and its indices (fluency, flexibility, and originality) are linked to open-minded people but challenge the view that music listening facilitates DT. Short-term exposure to music listening was found to show no effect on the overall DT performance. However, listening to happy music could enhance performance on the originality aspect in DT.
Footnotes
Acknowledgements
The authors would like to thank Randy Tong Wei Teck for his help with data analysis. They would also like to thank Wong Sheng Hong for his involvement in the early stage of this study.
Author contributions
H.L.Y. and T.K.W. designed the study and were involved in the article writing and revision. H.L.Y. performed the data collection and ran data analysis.
Data availability statement
The data that support the findings of this study are available on request from the corresponding author, Tan Kok Wei. The data are not publicly available due to privacy or ethical restrictions.
Funding
The author(s) received no financial support for the research, authorship, and/or publication of this article.
Ethics statement
This project has been reviewed by the UoRM Research Ethics Committee and was given a favorable opinion for conduct (UoRM REC 2020/7). Participation in this experiment was entirely voluntary, and the participants were free to withdraw at any time without giving any reason. The informed consent was received for all participants electronically.