
Abstract
We explored the hypothesis that musical emotions are embodied differentially by people according to their personality. Nine hundred and fifty two individuals completed the Big Five personality inventory. A subset of 60 participants were asked to spontaneously move to 30 short musical stimuli while being recorded with a motion-capture system. The musical stimuli were separately rated for perceived emotions. Embodied musical emotions were evaluated as the correlation between features derived from the motion-capture data and the mean ratings of perceived emotions. Correlations between embodied musical emotions and personality traits provided tentative support for our hypothesis. A series of linear regression analyses revealed that scores on Openness and Agreeableness were most strongly, and Neuroticism and Conscientiousness most weakly, predicted by embodied musical emotions. Overall, our results offer tentative support for the existence of differential relationships between embodied musical emotions and personality, and describe statistical models that might be empirically tested in future studies.
When someone spontaneously dances to music, their movement and posture may reflect characteristics of the music. In other words, dance may embody musical properties, beat, and rhythm usually being the most evident (Burger et al., 2014, 2018; Burger, Thompson, et al., 2013; Toiviainen et al., 2010). Likewise, more complex and abstract characteristics of music may be embodied in dance, such as emotional content (Van Dyck et al., 2017). However, it is likely that not everyone will embody musical emotions in the same way and to the same extent. One might ask, therefore, whether people have individual characteristics that affect how and how much they will embody musical emotions. Alternatively, might these individual characteristics be predicted by the way people embody musical emotions? These two questions are facets of the same relationship. Beyond scientific curiosity, acknowledging the effect of individual differences on bodily expression of musical emotions may be relevant to activities that involve music and dance with a variety of people, such as teaching music and dance, and the use of dance and music in therapeutic settings.
The relationships between people’s individual characteristics and musical emotions have been studied in various ways. Usually, such individual characteristics are examined in terms of personality traits and measured with a questionnaire, even though other characteristics may be considered, such as gender or cultural background. Musical emotions have been observed in terms of perceived emotions in music and felt emotions when listening to music or emotions induced by music. These can be evaluated with a questionnaire or by measurement of physiological activity. Gerra et al. (1998), for example, reported an experiment in which participants were presented with classical and electronic dance music, while several physiological and psychological measurements were recorded. Results showed that after listening to both kinds of music there was a change in emotional state. However, only after listening to electronic dance music was it observed that changes toward a negative mood and release of stress hormones had a positive correlation with “harm-avoidance” and a negative correlation with “novelty-seeking” temperaments of Cloninger’s personality scales (Cloninger, 1987). Another study, conducted by Park et al. (2013), looked at how “Big Five” personality traits (Extraversion, Agreeableness, Conscientiousness, Neuroticism, and Openness) modulate neural correlates of musical emotion processing. Participants completed the NEO-FFI questionnaire of Big Five personality traits (McCrae & Costa, 2004) and, while being scanned by a Magnetic Resonance Imaging device, listened to music expressing different emotions. The results showed significant correlations between brain activity and both Neuroticism and Extraversion as a response to music expressing happiness and fear, respectively.
Other studies on the relationships between musical emotions and personality have evaluated musical emotions, perceived or felt, solely by means of self-report. Vuoskoski and Eerola (2011b) conducted an experiment in which participants completed the Big Five Inventory (BFI) personality questionnaire (John & Srivastava, 1999), the POMS-A questionnaire to evaluate mood (Terry et al., 2003), and rated music in terms of perceived discrete emotions (happiness, sadness, anger, fear, and tenderness). Ratings of perceived sadness correlated positively with Neuroticism and negatively with all other traits except Conscientiousness. Also, mood was associated with mood-congruent biases in perceived emotions, moderated by Extraversion. In another experimental study, Vuoskoski and Eerola (2011a) asked participants to complete the BFI and to rate emotions felt when listening to music. Ratings in terms of three-dimensional affect—Valence (i.e., positive vs. negative), Energy, and Tension—yielded more consistent and differentiated responses compared with discrete emotions. However, the relation between personality and music-induced emotions was stronger for discrete emotions. In addition, Extraversion was significantly correlated with experienced happiness, sadness, and tenderness. In a similar vein, Liljeström et al. (2012) asked participants to listen to music and indicate if it was familiar, how much they liked it, which emotions they felt and how intensely. Participants also completed the NEO-PI-R questionnaire for Big Five traits (Costa & McCrae, 1992). A positive correlation was observed between Neuroticism and experience of negative emotions, while for all other traits the correlation was negative. This is consistent with the results of Vuoskoski and Eerola (2011b). Furthermore, the correlation between personality traits and ratings of emotion intensity was moderately positive for Agreeableness, Extraversion, and Openness, negligible for Conscientiousness, and weakly negative for Neuroticism.
The studies mentioned in the previous paragraphs reveal distinct relationships between personality traits and the perception and feeling of emotions in music. Trait Openness is a special case as it has been suggested to be related to transient emotional responses (colloquially referred to as “chills”) to music and other expressions facilitating aesthetic experiences (McCrae, 2007). Nusbaum and Silvia (2011) tested this hypothesis in an experiment, and found that Openness was the only Big Five trait that significantly predicted such responses as an effect of music listening. Furthermore, Silvia et al. (2015), found a significant and moderate correlation between Openness and the feeling of a profound experience (also referred to as “awe”) when listening to music, while the correlation with the other traits was much lower.
Although perception and experience of musical emotions may be observed by means of physiological measures and self-report questionnaires, still other possibilities exist. For example, one might examine characteristics of spontaneous movement to music, such as how such movements embody the music’s emotional content. Burger, Saarikallio, et al. (2013) asked participants to spontaneously move to music (i.e., dance) while they were recorded with a motion-capture system. Bodily features were computed, for example, the torso’s tilt and rotation, floor area used and acceleration of different body parts. Another group of participants rated the perceived emotional content of the same music in terms of both dimensional affect—Arousal (i.e., emotional activation) and Valence—and discrete emotions Happiness, Anger, Sadness, and Tenderness. A correlational analysis between bodily features and emotion ratings revealed significant relations between them, even though the two datasets were collected independently of each other and from different groups of participants. Using the same data, Burger, Polet, et al. (2013) found a mediation effect of emotion ratings on the relation between bodily features and features of the music, such as energy and activity in the low- and high-frequency ranges, attack time, and note density. That study also used Big Five personality scores of the dancing participants and found a moderation effect of Extraversion on the relation between head acceleration and the activity of low-frequency audio (i.e., low-frequency spectral flux). Furthermore, Conscientiousness was found to be a significant moderator of the relation between note density and movement fluidity.
Using the same motion-capture and personality data as Burger, Polet, et al. (2013), Luck et al. (2010) found that Extraversion was directly related to the level of overall acceleration. This was later confirmed in a study with different data by Carlson et al. (2016). The latter study also found that responsiveness to changes in tempo correlated positively with Conscientiousness and negatively with Extraversion. This suggests that conscientious people were compelled to follow tempo accurately while extraverts preferred to divert and follow their own beat. Bamford and Davidson (2019) measured the time to entrainment (i.e., the alignment of the periodicity of the movement of the body to the beat of the music) of participants that had completed the BFAS Big Five questionnaire (DeYoung et al., 2007) and the Empathy Quotient questionnaire (Wakabayashi et al., 2006). Results showed that Empathy and Agreeableness correlated negatively with time to entrainment. In other words, the more Empathic or Agreeable a person is, the faster (and arguably more easily) they will align their dancing motion with the beat of the music.
While these studies have identified significant relations between dancing motion and personality, the predictive power of the produced models and correlations is at best modest. However, a more recent study by Agrawal et al. (2020) traded the interpretability of bodily features for greater prediction power. Instead of using bodily features extracted by manual selection (e.g., speed or acceleration of body parts, or the distance or angle between them) or by dimensionality reduction (e.g., vertical or lateral speed), they used the covariance among the speed of body parts. As a result, predictions for all Big Five personality traits were remarkably close to their scores as measured by a questionnaire.
To summarize, there exists ample evidence that embodied responses to music are related to personality traits and to musical emotions. What is less clear, however, is how embodied musical emotions (i.e., the extent to which emotions are reflected in dancing) are related to personality. Consequently, we explored the hypothesis that musical emotions are embodied differentially by people according to their personality. We conducted a detailed and systematic analysis of relationships between personality traits and embodied musical emotions utilizing the following three different kinds of data: (1) Personality scores (measured by responses to the BFI) of individuals who moved spontaneously to music, (2) motion-capture data recorded from the same individuals, and (3) perceptual data concerning emotions perceived in the music they danced to. These data had been previously used in other studies as follows: Motion-capture data, personality data and ratings of perceived emotions had been used by Burger, Polet, et al. (2013), and Burger and Toiviainen (2020b); motion-capture and personality data had been used by Luck et al. (2010, 2014); motion-capture data and ratings of perceived emotions had been used by Burger, Saarikallio, et al. (2013); only motion-capture data had been used by Burger et al. (2014), Burger, Thompson, et al. (2013), Burger and Toiviainen (2020a), and Saarikallio et al. (2013).
Method
Participants
For the spontaneous dancing task, 60 participants took part (43 females, 17 males, ages from 19 to 32, M = 24, SD = 3.3). These individuals were selected from a total of 952 persons who had previously completed the BFI questionnaire. The scores of the selected participants were evenly distributed along the scales (i.e., a continuum covering low, middle, and high scores for each personality trait). All of them were students from different faculties of the University of Jyväskylä and all except two were of Finnish nationality. Six participants had received formal music education and four had received formal dance education. For the rating of perceived emotions, a different group of 34 participants took part (17 females, 17 males, ages from 21 to 47, M = 25.7, SD = 5.9), all musicology students of the University of Jyväskylä, familiar with research of music and emotions, and of Finnish nationality. The inter-rater agreement of perceived emotions was high and the ratings correlated significantly with movement features of the participants that danced spontaneously (see Burger, Saarikallio, et al., 2013). The university granted approval for non-invasive and non-inductive experiments involving human participants. All participants gave verbal consent to the procedures after they were explained to them. No records were kept linking participants’ identity and experimental data.
Stimuli
The stimuli used for the spontaneous dancing task were 30 audio excerpts of different popular music genres, chosen to have a variety of rhythmic complexity and tempo. All excerpts were 28-s long, solely instrumental, and had a binary meter. Further information can be found in the Appendix. At the beginning of each stimulus, one extra second of audio was added, composed by a sine tone at 300 Hz lasting 0.5 s followed by silence. The same excerpts were used for the rating of perceived emotions, although they were trimmed to 15 s by removing the first and last 6.5 s. This was done to shorten the duration of the data collection session thus reducing risk of fatigue in the participants.
Apparatus
For the task involving spontaneous dancing, bodily posture was recorded with a Qualisys Pro Reflex optical motion-capture system composed of eight infrared video cameras. This system tracked at 120 frames per second the three-dimensional position of 28 reflective markers attached to the body. The ratings of perceived emotions were written on paper. For these two tasks, stimuli were played on studio monitor loudspeakers and presented in random order.
Procedure
For the spontaneous dancing task, each participant was recorded in a separate session in which they were asked to move to the music “in a way that feels natural.” In the session, a motion-capture recording was made for each stimulus. For the rating of perceived emotions, data collection took place in two sessions, each comprising half of the participants. They were asked to rate perceived emotions in music on seven-point scales for dimensional affect in terms of Arousal and Valence, and for discrete emotions Happiness, Anger, Sadness, and Tenderness (see Eerola & Vuoskoski, 2011). The random order of stimuli was different for each session.
Preprocessing of motion-capture data
Reflective markers were visualized as skeletons (Figure 1(a)) and rendered as video for visual inspection. Missing or corrupted data did not exceed 3 s, and were reconstructed with an automatic procedure (Tits et al., 2018) whose parameters were adjusted manually using video of the reconstructed skeletons. A new set of markers was derived by retaining some of the originals and producing additional virtual markers by averaging some combinations of the original (Figure 1(b)). The new configuration of markers was designed so that there would be enough points for a reference plane to translate and rotate body parts to their own local coordinate system, as appropriate to each bodily feature (explained below). Furthermore, markers at the heels were removed as they did not provide further information than the markers at the ankles and tip of the feet. All motion-capture recordings were trimmed to the duration of the musical excerpts.
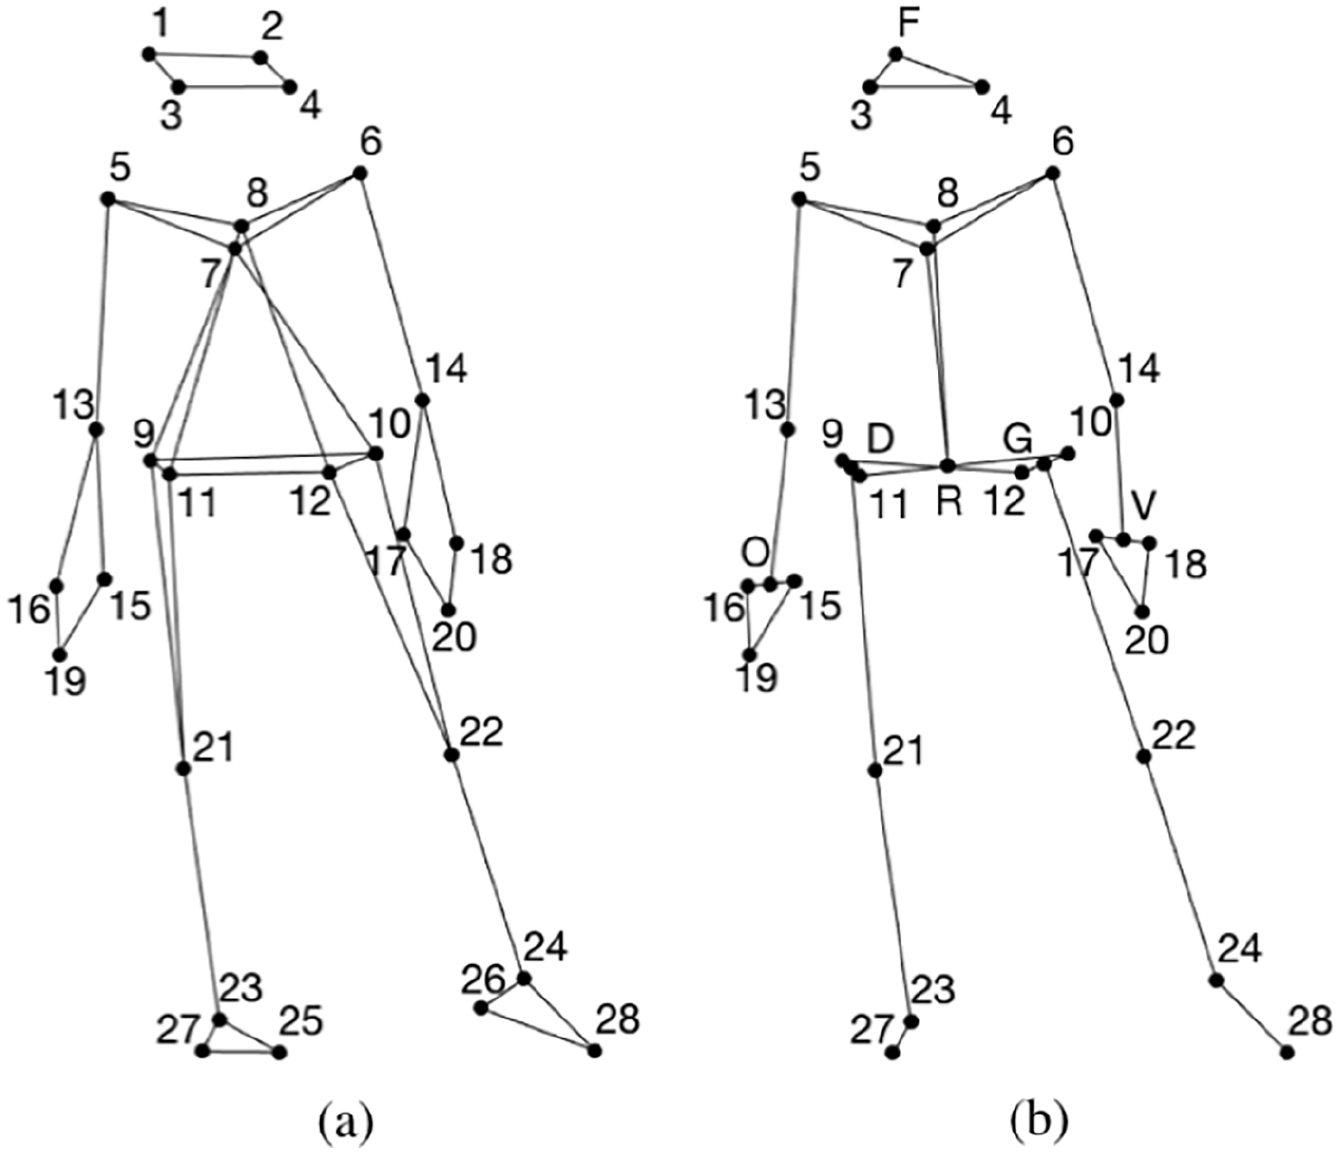
(a) Original Markers and (b) Retained Original Markers (Numbered) and Virtual Markers (Letters).
Kinematic and non-kinematic bodily features were computed using the motion-capture data. They were crafted to represent a variety of aspects of bodily motion and posture (see Table 1). Features that represent movement of individual bodily parts use subsets of markers locked to a local coordinate system defined by a reference plane. This reduces collinearity among features, which is desirable when they are used as regressors in linear models (see below). Collinearity arises because parts of the body will move when another part moves. For example, an arm will move as the torso moves, and the torso will move along with the whole body. By locking the arm to a local coordinate system, the only motion remaining is that of the arm alone. To wit, features representing bodily parts locked to a local coordinate system are more intuitively interpreted, as they are related more to muscle activation than to mere displacement. Kinematic features were speed, acceleration (acc.), jerk (jrk.), and the square of speed (speed2) of markers as detailed in Table 1, resulting in 32 features. The square of speed was included as a supplemental measure for kinetic energy. Kinetic energy is half the mass multiplied by the squared velocity. As the mass is constant, it can be omitted from the equation. The Euclidean norm was computed for each feature, resulting in a single value for data corresponding to each motion-capture recording. For the six non-kinematic features, the median was computed to obtain a single value for each recording. The median was used as a magnitude measure as it is less sensitive to outliers compared with other average measures such as mean or mode. An exception is the feature “Torso rotation,” for which the standard deviation was computed. The feature “Area” is defined as the smallest rectangular area of a marker projected to the horizontal plane in a moving window of 4 s with a hop of one frame. The result was 38 bodily-feature values for each motion-capture recording.
Kinematic (K) and Non-Kinematic (NK) Bodily Features.
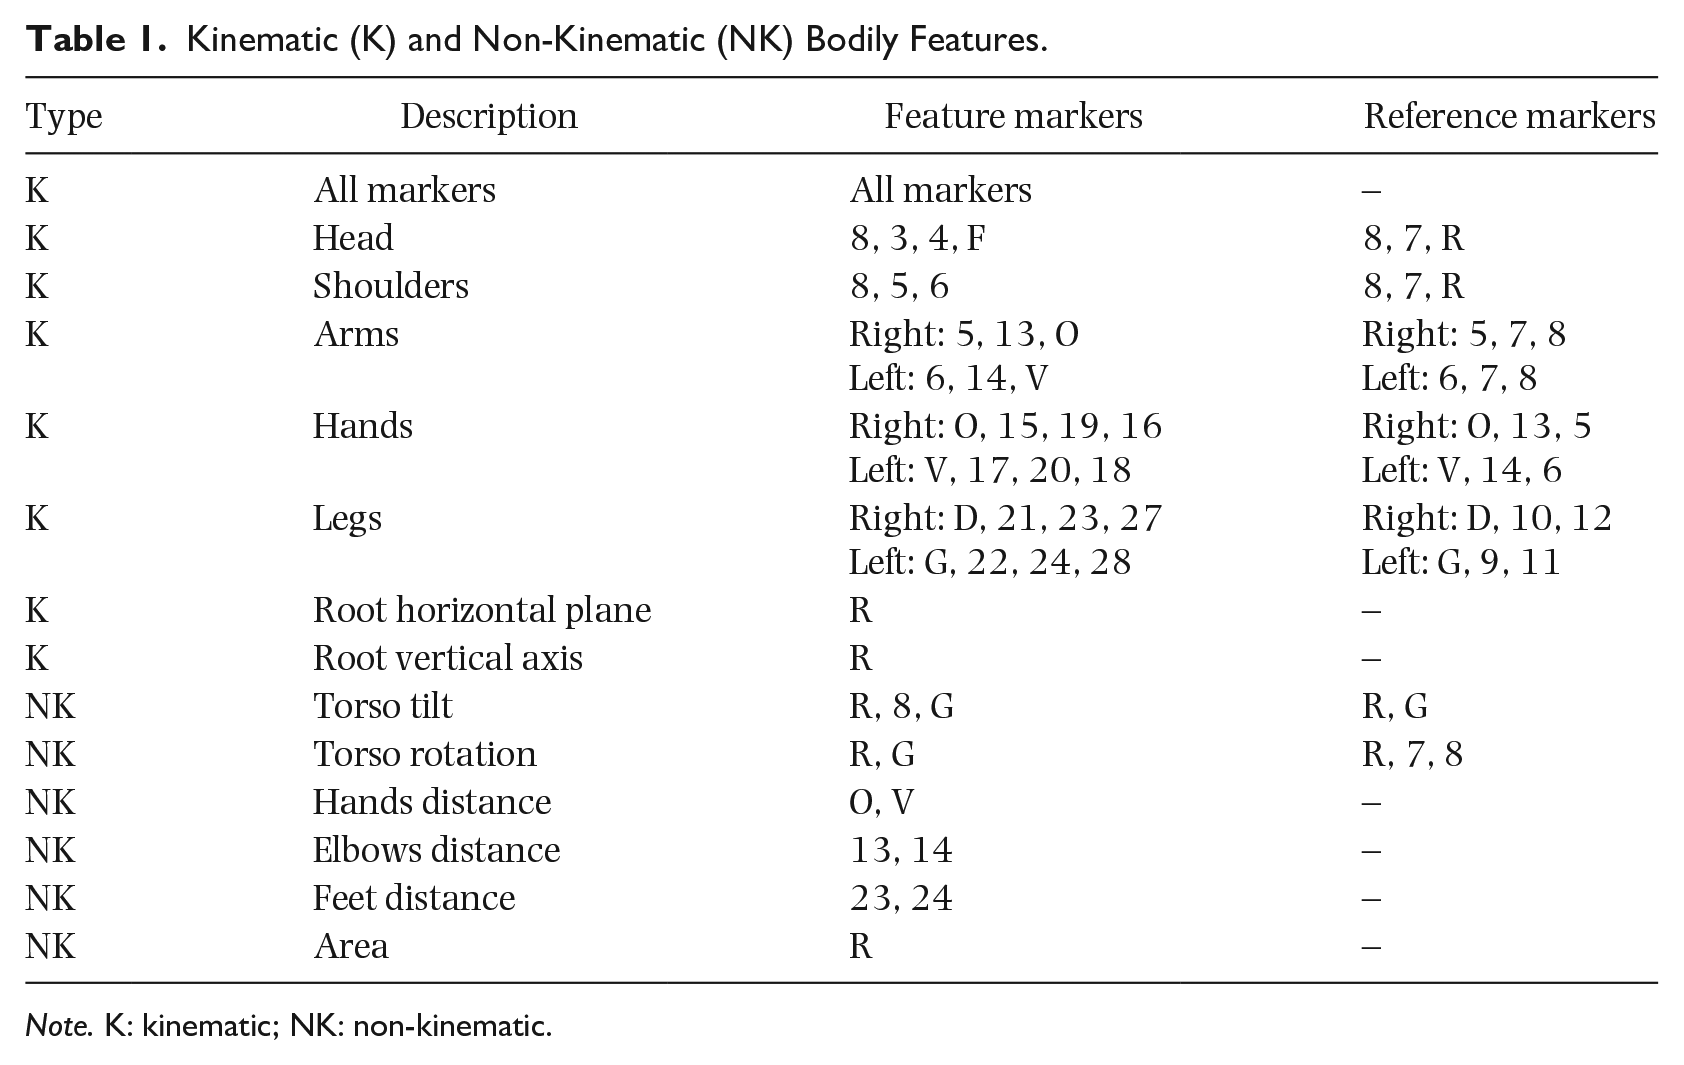
Note. K: kinematic; NK: non-kinematic.
Analyses
The bodily-feature data for each participant were composed of 38 features, each having 30 values (one for each motion-capture recording and musical stimulus). Each feature was correlated with each of the six ratings of perceived emotions, resulting in 228 values of embodied emotions for each participant. Rank correlation was used because an inspection of the correlated data revealed that they were not consistently normally distributed or linear. Kendall’s tau-b rank correlation was preferred as its interpretation is straightforward. Then, two analyses were performed to assess the relations between embodied emotions and personality traits.
Analysis 1 comprised the rank correlation between personality traits and embodied emotions. This was achieved by computing Kendall’s tau-b between scores of each personality trait and each of the 228 embodied emotions for all participants. Additionally, personality traits were correlated with six aggregated embodied emotions, one for each perceived emotion. These were computed as the sum of absolute values of embodied emotions corresponding to the same perceived emotion.
Analysis 2 consisted in ordinary least-squares linear regression models that predict each personality trait. Each model had regressors consisting of a combination of embodied emotions, but corresponding to only one bodily feature. This way, it was possible to examine the effect of each bodily part separately, though at the cost of reduced prediction power compared with using combinations of bodily features. The following equation describes a regression model for one personality trait:
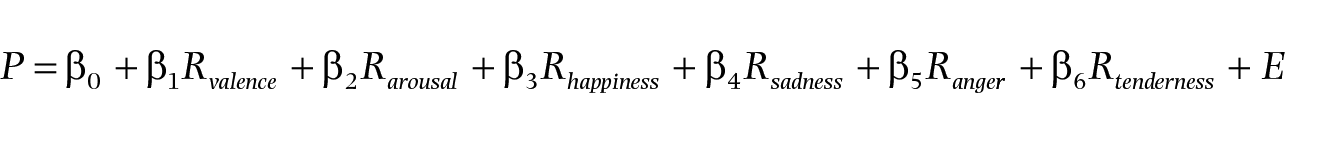
where P is scores of a personality trait, β are regression coefficients with β 0 being constant, R are embodied emotions (i.e., regressors), and E is error. In contrast to the aggregation measure of the first analysis, this is a weighted linear combination. All 63 possible combinations of perceived emotions for 38 embodied emotions (one for each bodily feature) resulted in 2,394 models for each personality trait.
Instead of selecting models by their statistical significance, relevance was assessed empirically by comparing the cross-validated error of a data model and the error of a null model. This has the advantage that there is no need to arbitrarily set a significance threshold (typically p-value less than .05). For each model, three-fold cross-validated Root Mean Squared Error (RMSECV) with 105 Monte Carlo realizations, and relevance measure

were computed, where RMSEnull is the error of a null model for each personality trait. A positive value for ΔRMSE indicates that the model is relevant, as it performs better than the null model and vice versa.
Results
The results of the first analysis reveal potential though weak relationships between each Big Five personality trait and the embodiment of each rated emotion by each bodily feature. Table 2 contains the rank correlations for all relationships with a p-value below .05, out of the 1,140 produced values. This threshold is used only to tabulate a subset of the results. The p-values were not adjusted to control for multiple comparisons as, due to the large number of values, any adjustment procedure would reduce statistical power to the extent that no results would remain significant. The interested reader may find further information about the appropriateness of adjustments for multiple comparisons in the work of Rothman (1990) and Althouse (2016). The p-values of rank correlations between personality traits and aggregated embodied emotions are shown in Table 3. These values are relatively high even though they were not adjusted. Figure 2 shows the corresponding correlation scores, which show tendencies that are weak and, as seen in Table 3, have poor statistical significance.
Kendall’s Rank Correlation (τB) Between Personality Traits and Embodiment of Emotions.
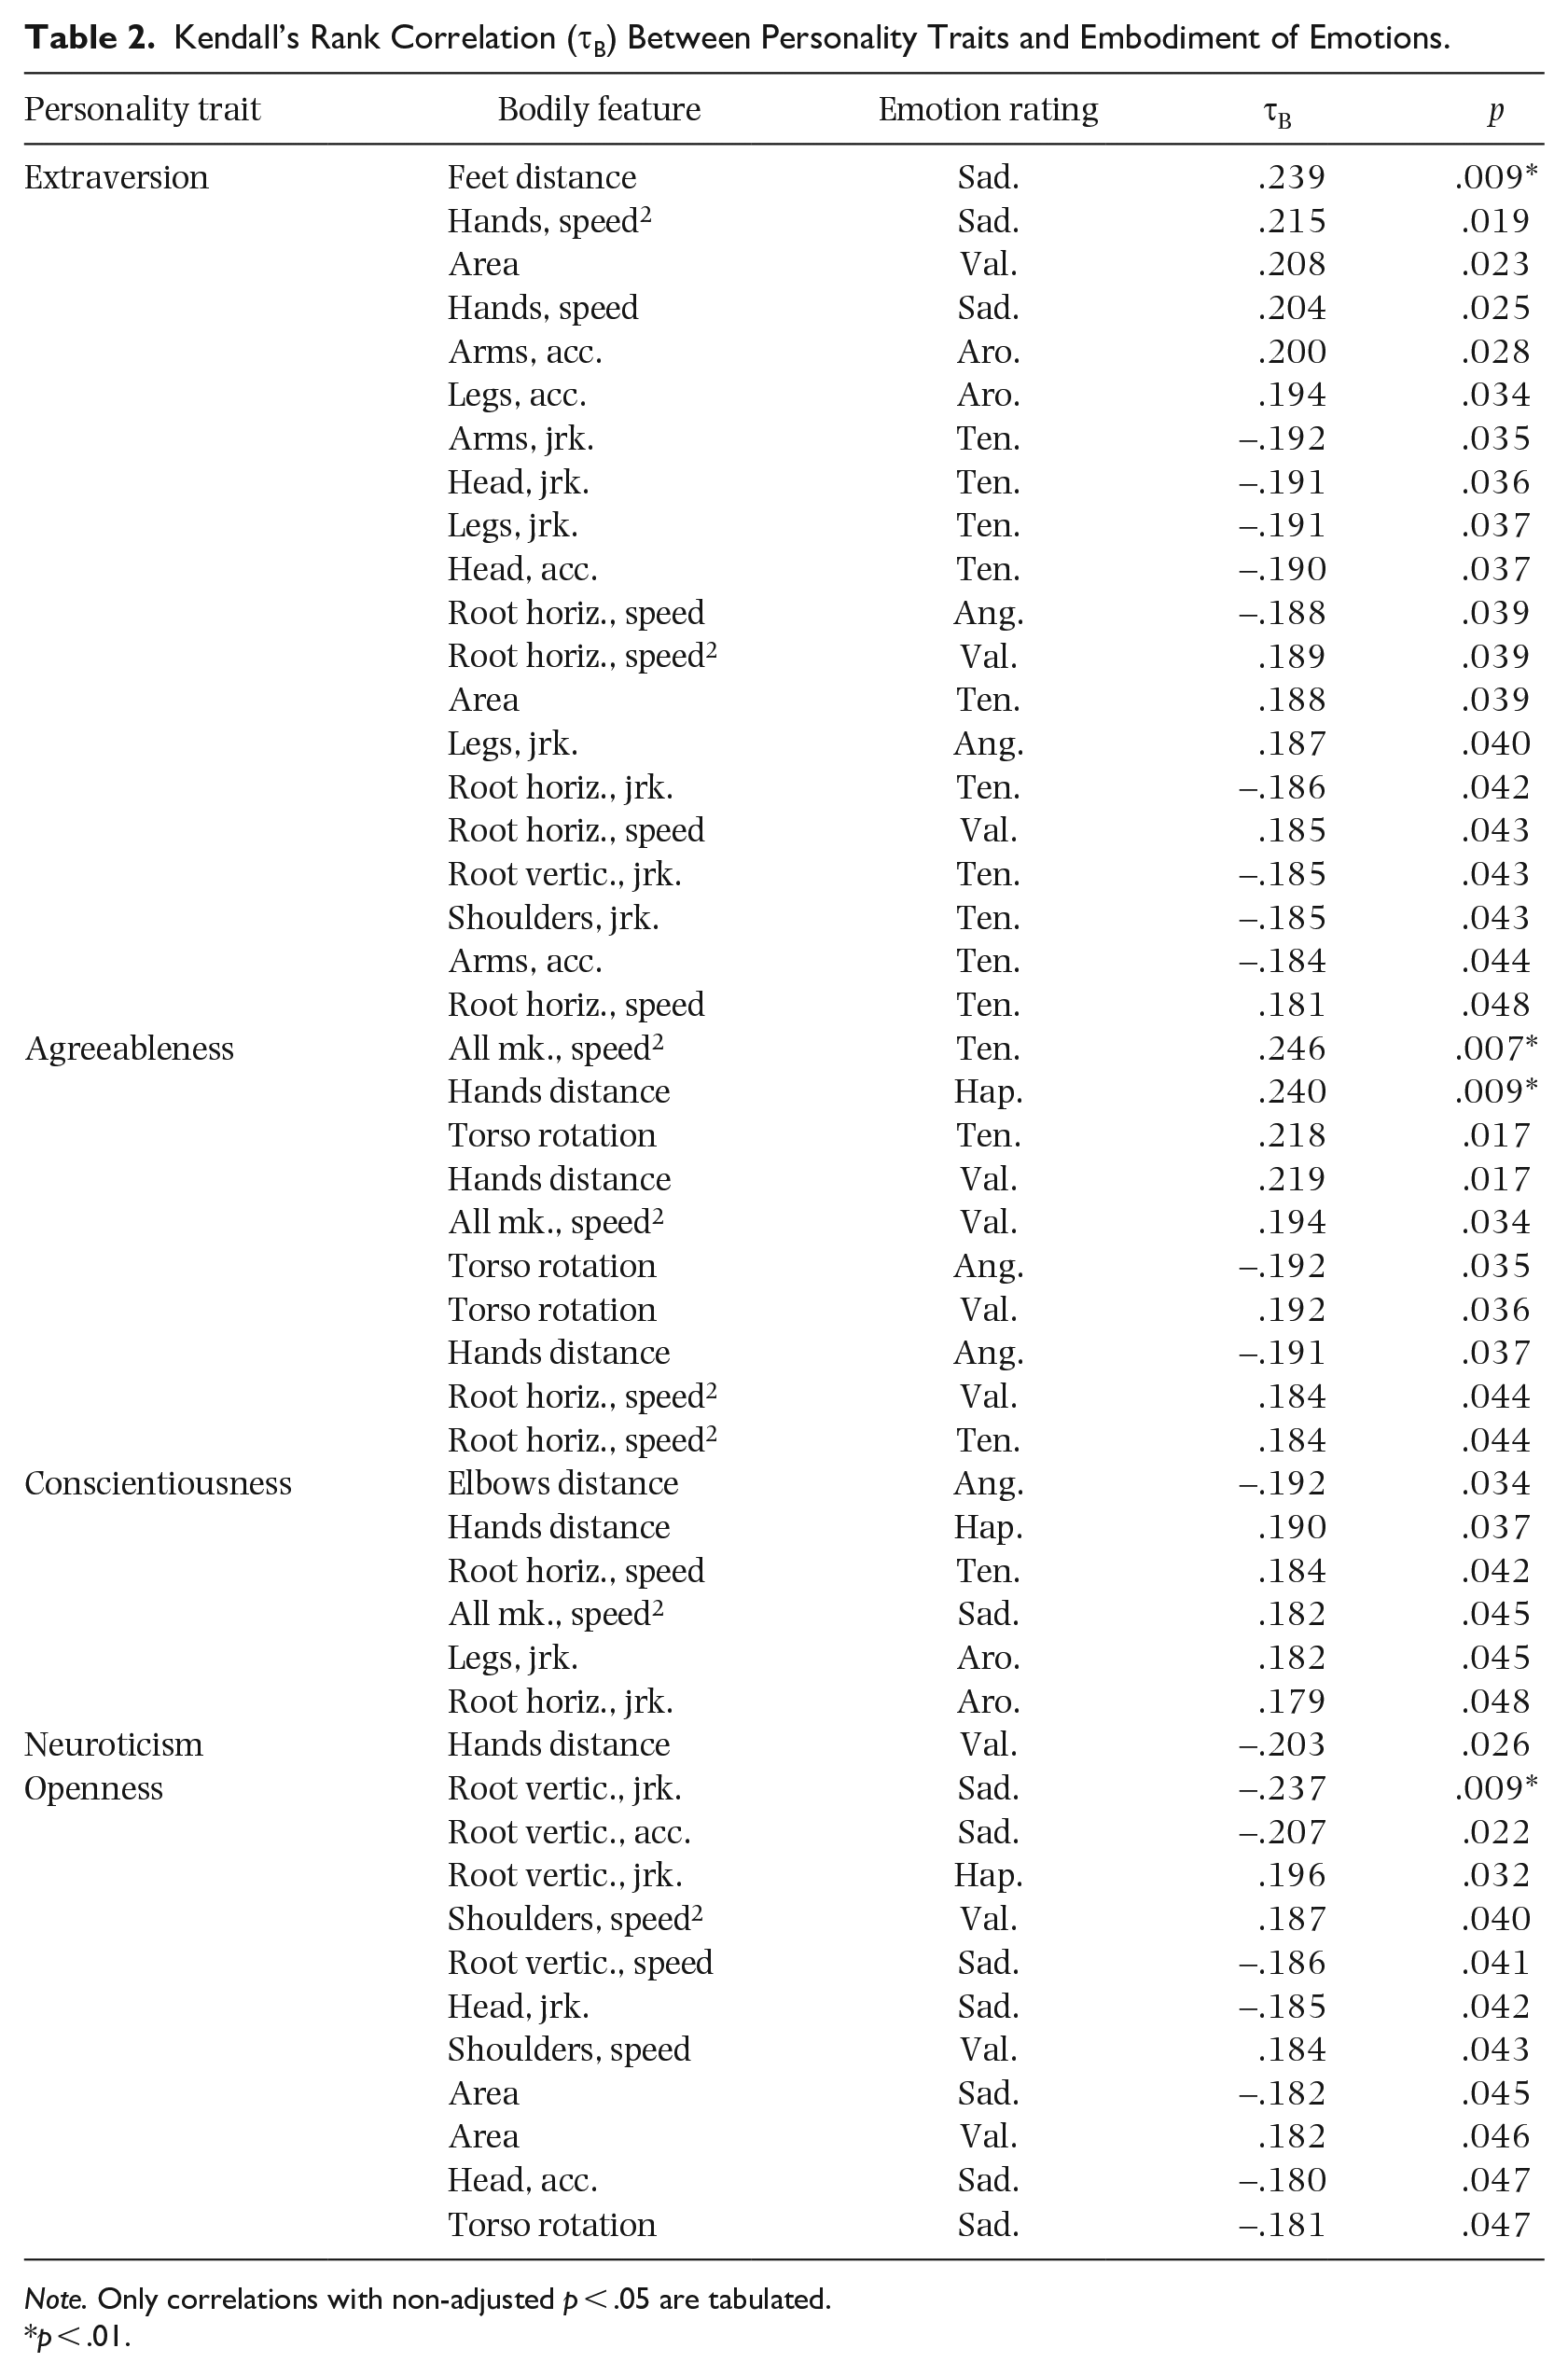
Note. Only correlations with non-adjusted p < .05 are tabulated.
p < .01.
Non-Adjusted p-Values for the Rank Correlation Between Personality Traits and Aggregated Embodied Emotions.
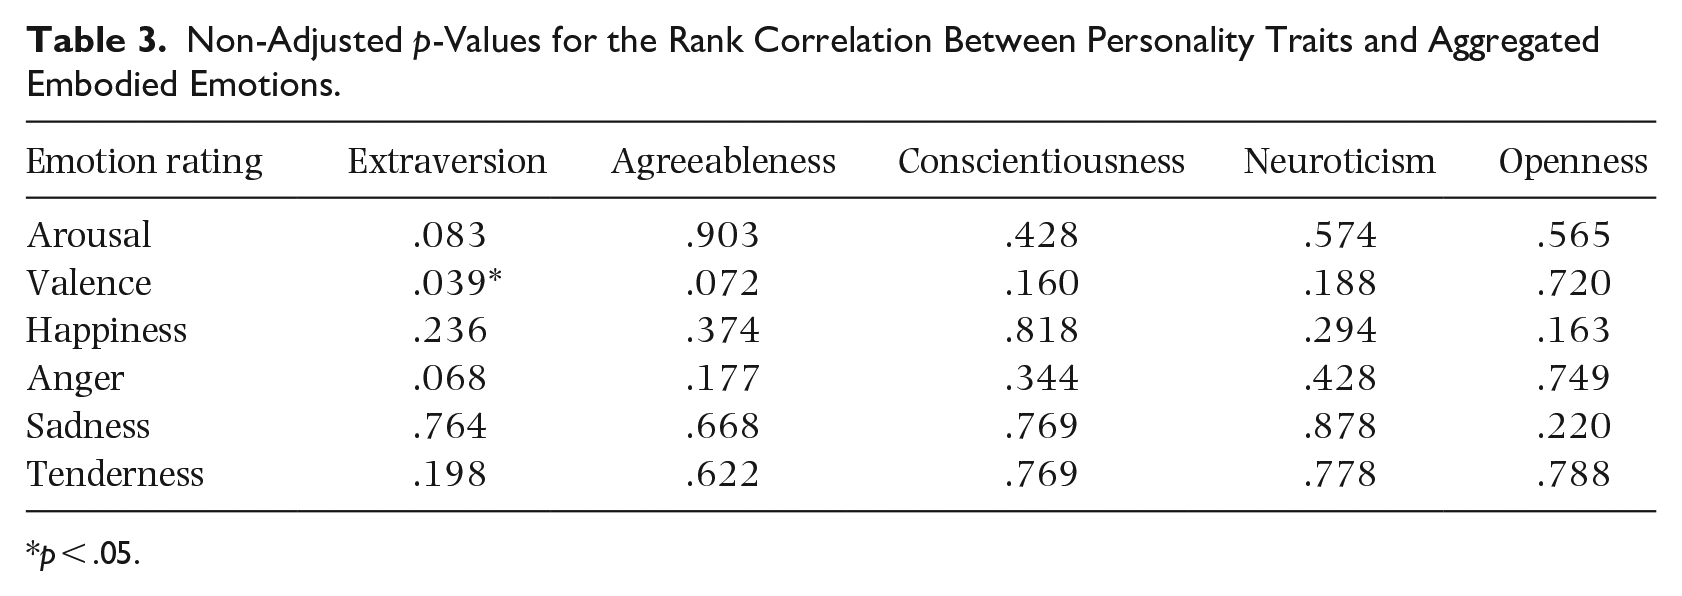
p < .05.
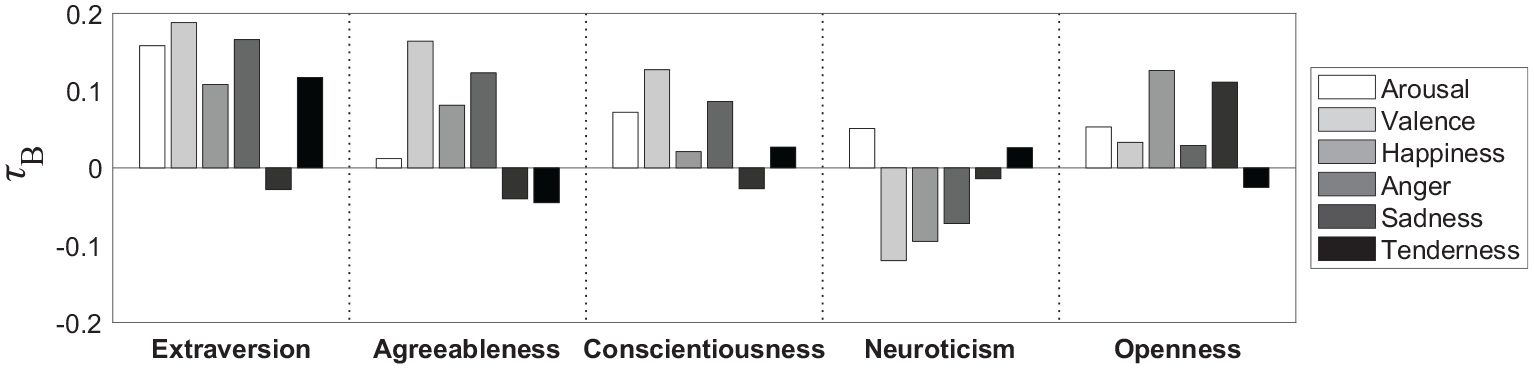
Kendall’s Rank Correlation (τB) Between Personality Traits and Aggregated Embodied Emotions.
The second analysis produced 11,970 linear regression models. Figure 3(a) shows the relevance measure ΔRMSE clustered by personality trait, for all models performing better than the null model. A quick visual inspection reveals that the highest values are for Openness, followed by Agreeableness and then Extraversion. The greater number of relevant models are for Agreeableness, followed by Openness and Extraversion. Conscientiousness and Neuroticism have both the weakest values and smallest number of models. Figure 3(b) shows only models whose regressors are correlations between a bodily feature and any combination of ratings for only dimensional affect. Notably, none of these models for Openness perform better than the null model, and most models for Agreeableness perform better than models for the other traits. Figure 3(c) shows only models whose regressors are correlations between a bodily feature and any combination of ratings for only discrete emotions. In this case, the pattern is similar to when all regressors are allowed, but the best performing models for Agreeableness are not as strong as for regressors considering only dimensional affect or for all models. This is consistent with Vuoskoski and Eerola’s (2011a) finding that, regarding music-induced emotions, discrete emotions have stronger relationships to individual differences than dimensional affect. When any combination of regressors for discrete emotions and dimensional affect is allowed, then the maximum ΔRMSE for Extraversion is significantly higher than when either only dimensional affect or discrete emotions are considered.
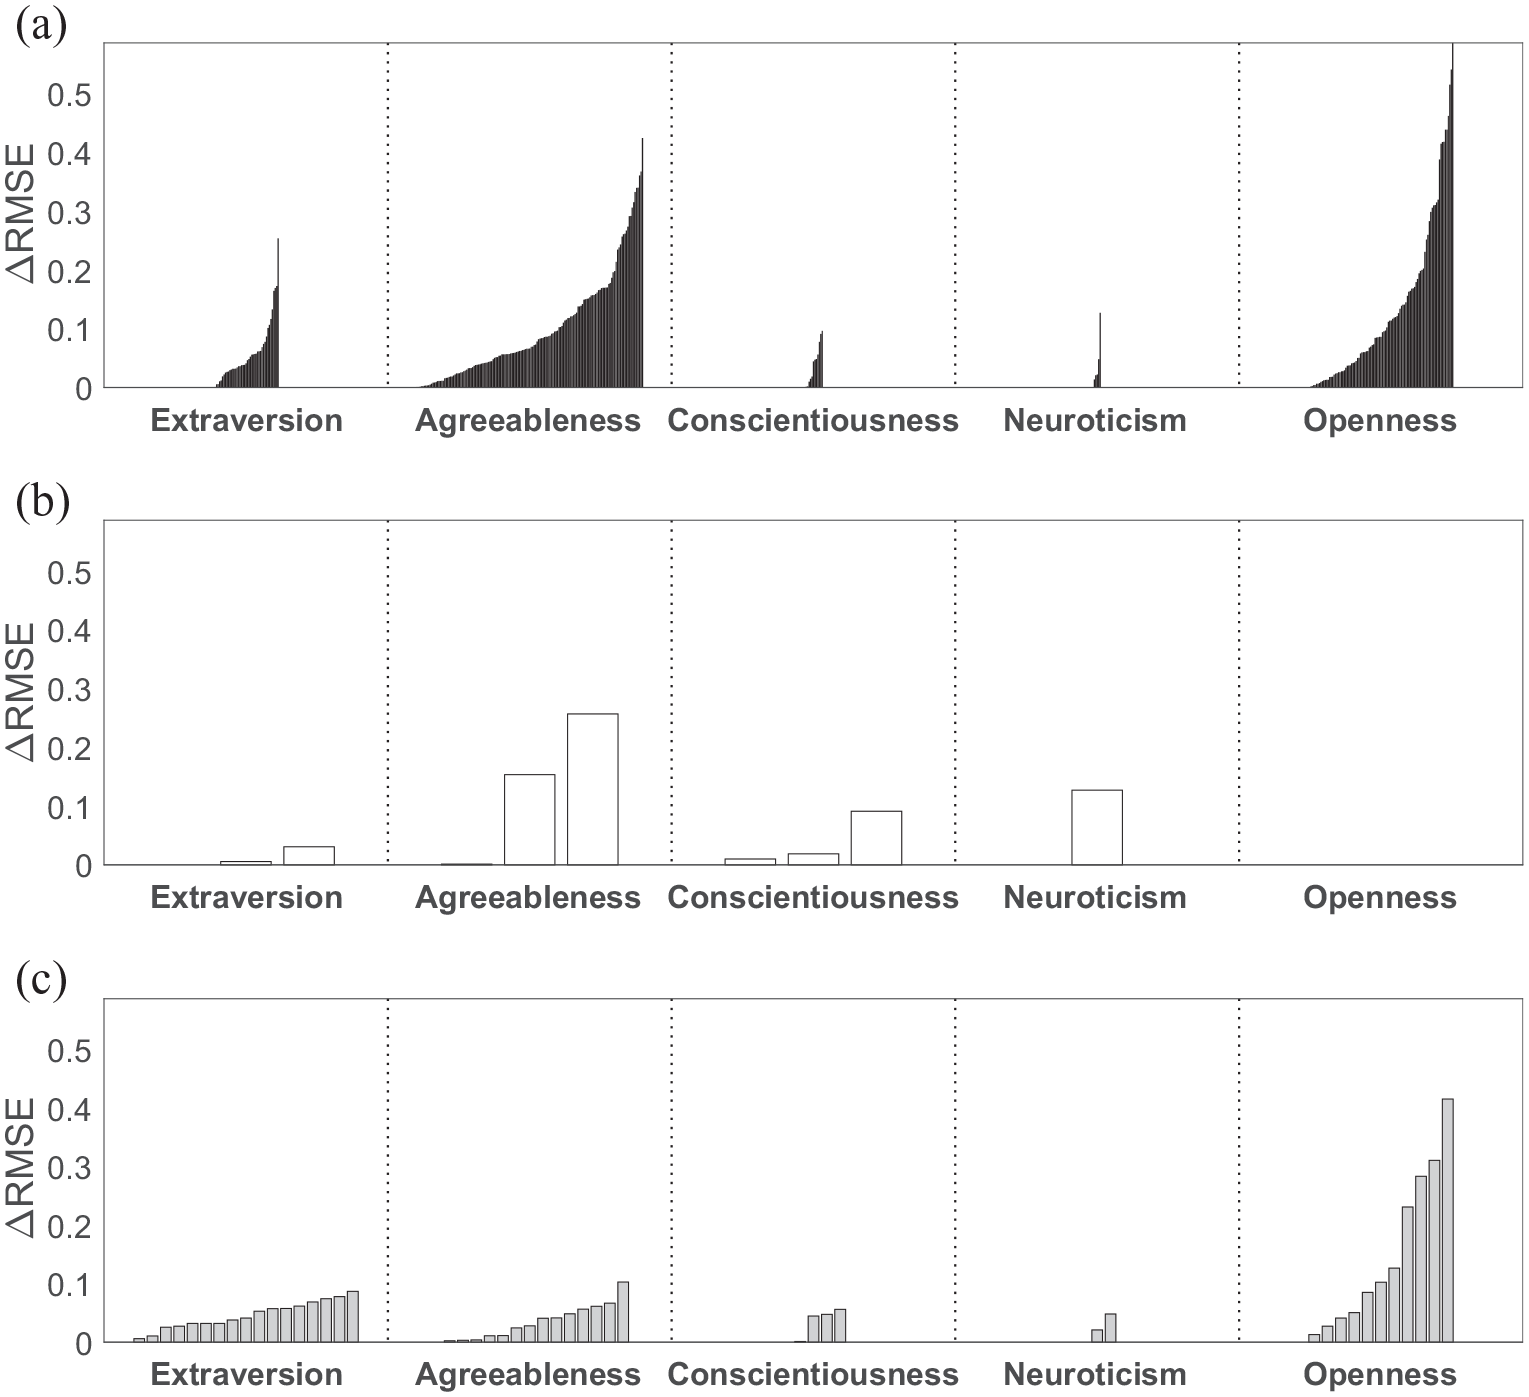
Relevant Models Sorted by Relevance, With Any Combination of Regressors Considering Correlation With All Emotion Ratings (a), Only Dimensional Affect (b), and Only Discrete Emotions (c).
Tables 4 to 8 contain information about the models with positive and highest ΔRMSE for each bodily feature. The R2 metric shows the performance of models fitted to the full data and the F-test p-value indicates the statistical significance of the fit. It is important to bear in mind firstly that the R2 metric is not used here as a measure of prediction power. Instead, it is used as an intuitive way of understanding the closeness of the fit to the observed values, as the metric has a unit maximum and is zero when it matches a null model. In fact, in the tables, it is possible to see that there is no perfect rank correspondence between R2 and RMSECV. This difference is due to the high variability of the errors from the cross-validation folds. Therefore, models for which that difference is higher may be less representative of the underlying phenomenon. Note that because models have been sorted by ΔRMSE (and therefore also by RMSECV), the rank correspondence between R2 and adjusted R2 is exact, therefore the latter was not tabulated. As for the first analysis, p-values were not adjusted for multiple comparisons.
Best Relevant Models for Each Bodily Feature, Predicting Extraversion.
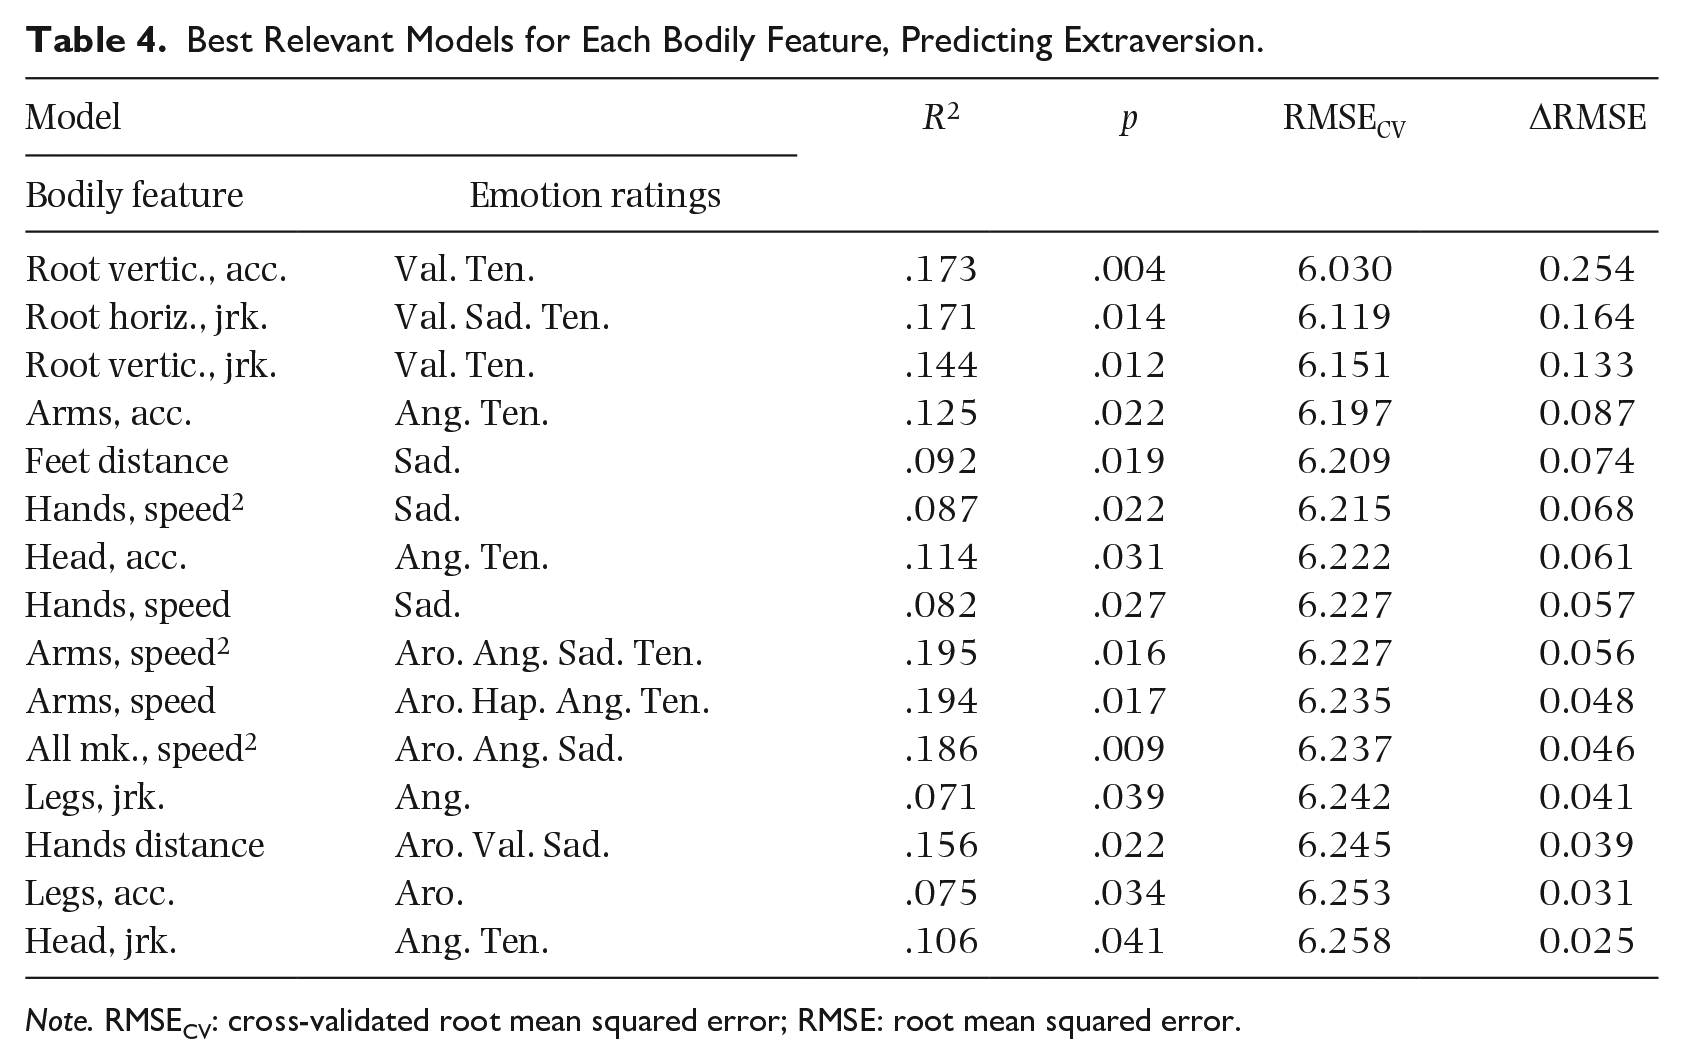
Note. RMSECV: cross-validated root mean squared error; RMSE: root mean squared error.
Best Relevant Models for Each Bodily Feature, Predicting Agreeableness.
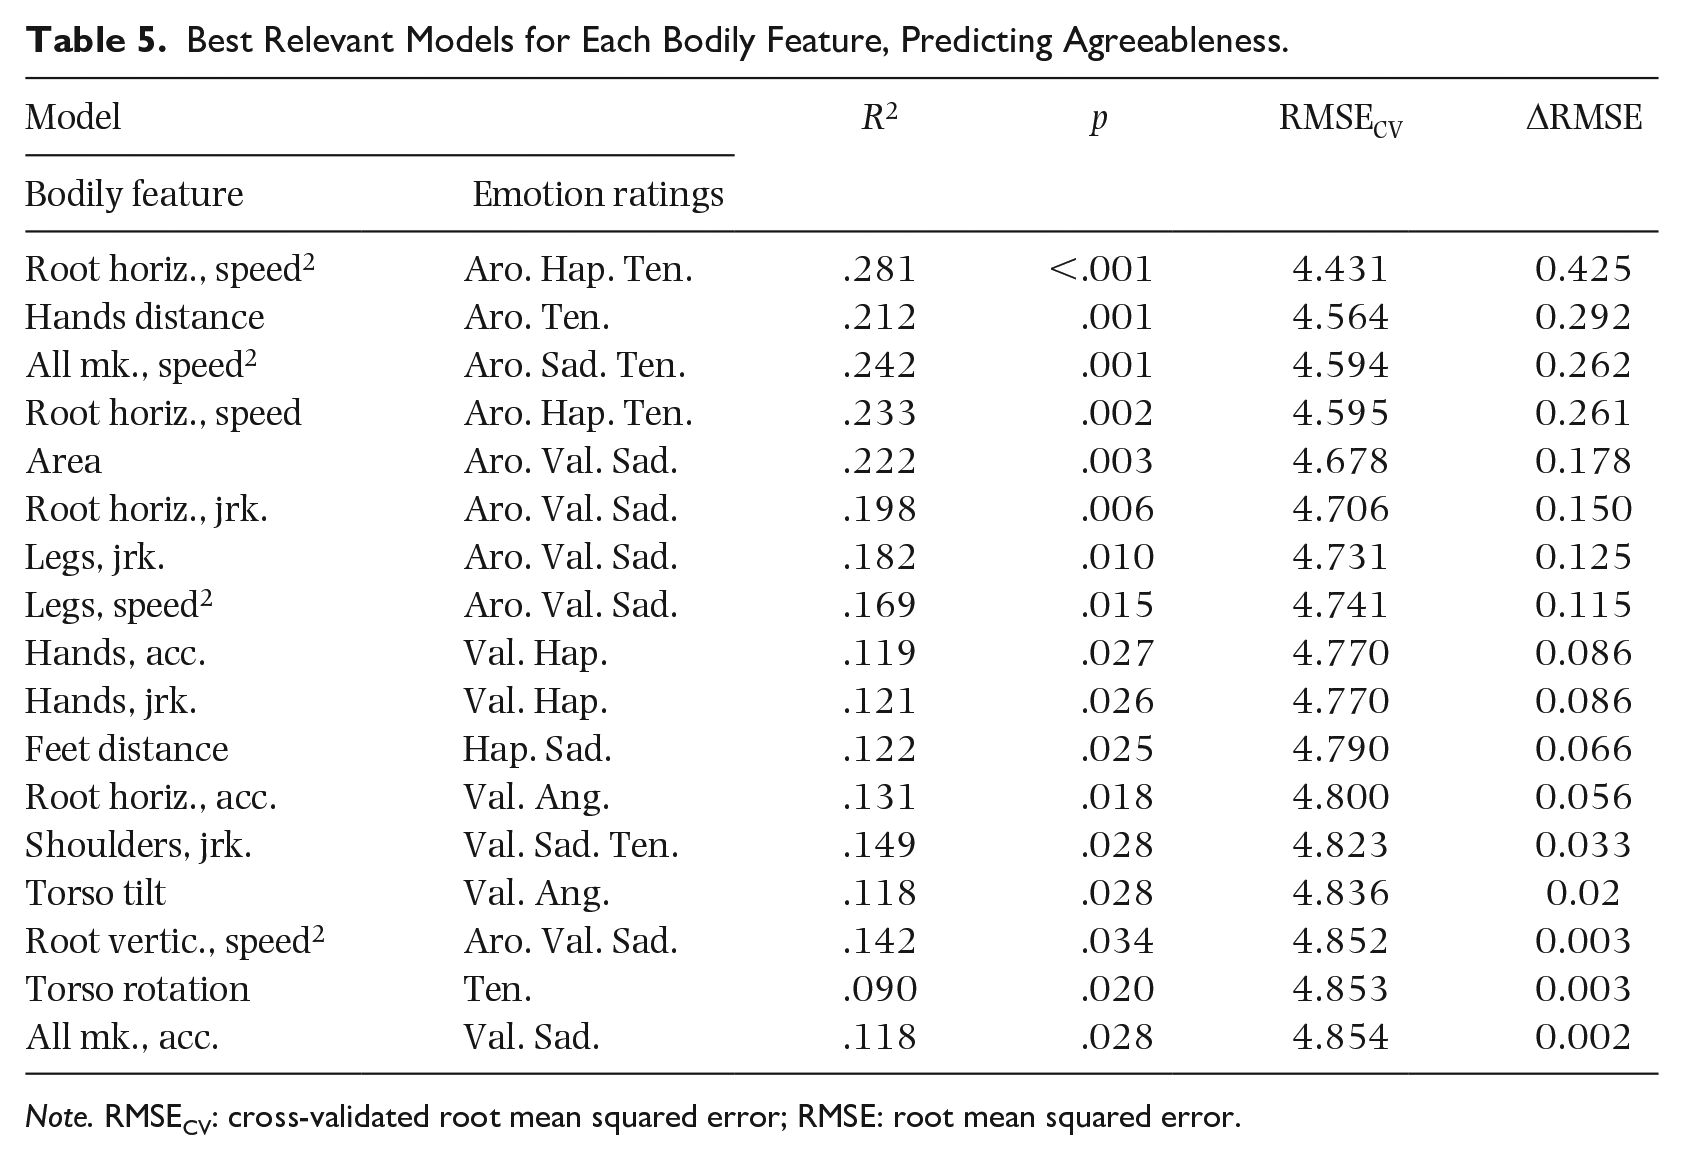
Note. RMSECV: cross-validated root mean squared error; RMSE: root mean squared error.
Best Relevant Models for Each Bodily Feature, Predicting Conscientiousness.
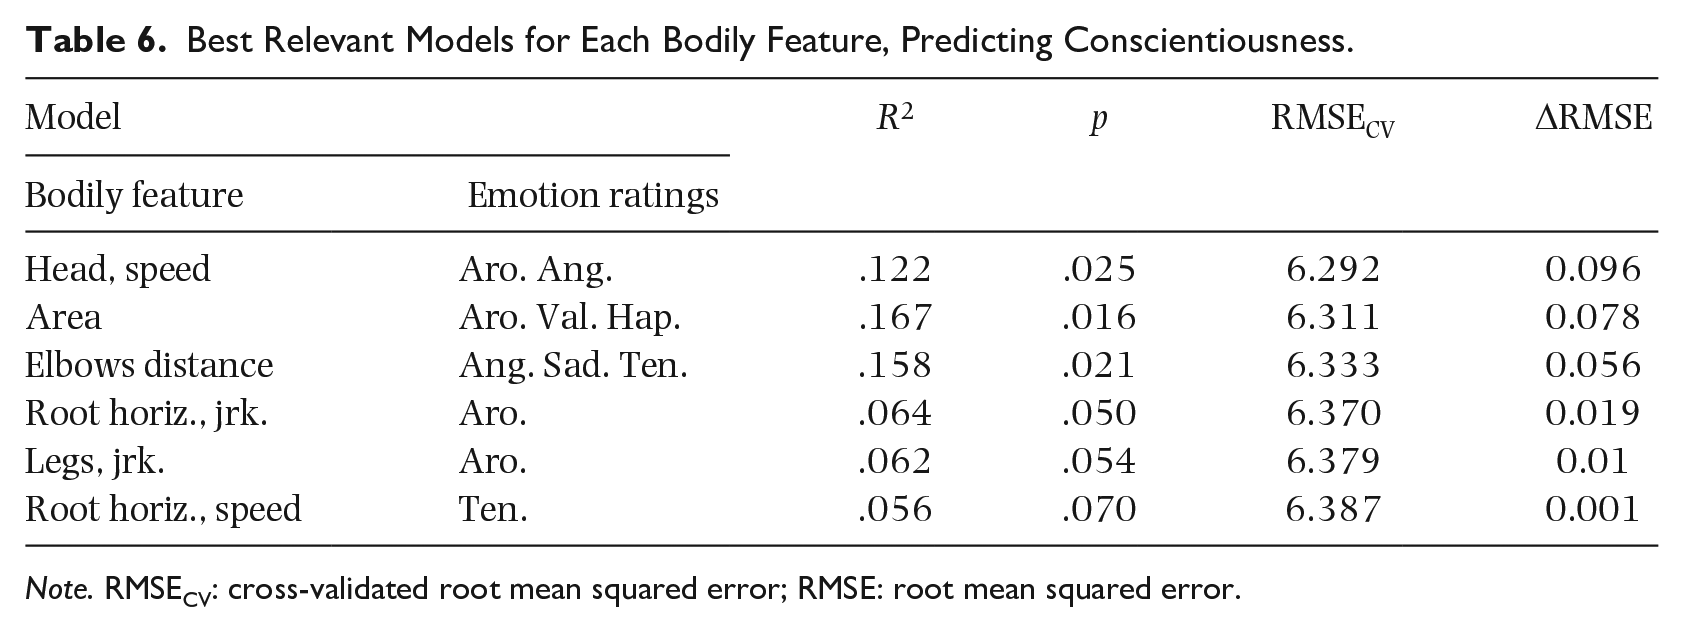
Note. RMSECV: cross-validated root mean squared error; RMSE: root mean squared error.
Best Relevant Models for Each Bodily Feature, Predicting Neuroticism.
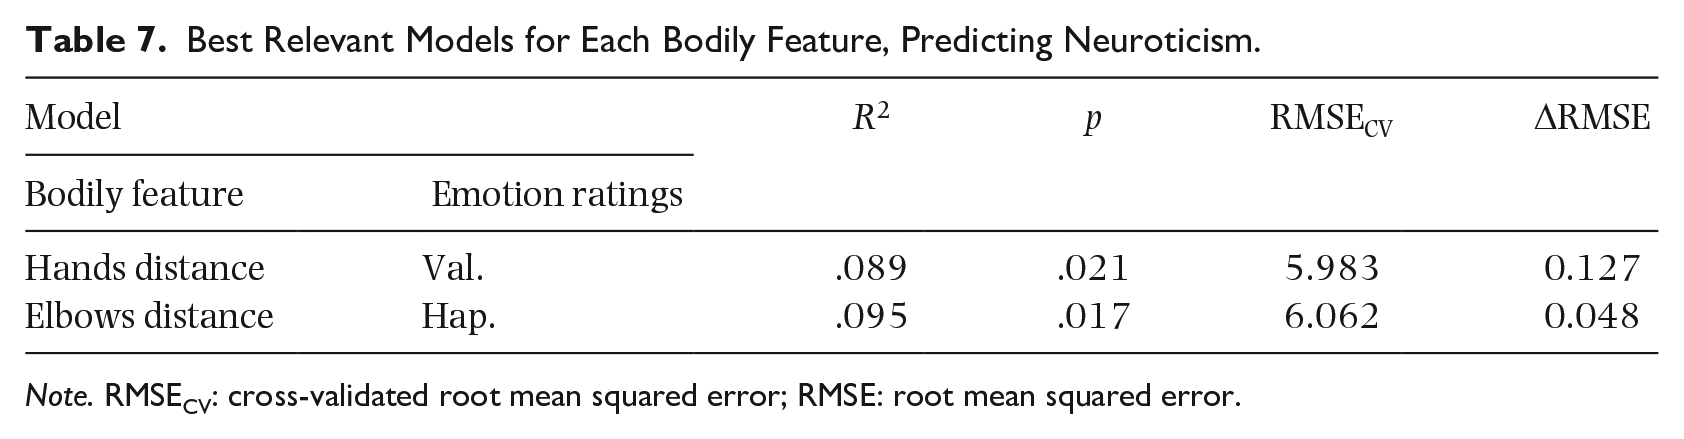
Note. RMSECV: cross-validated root mean squared error; RMSE: root mean squared error.
Best Relevant Models for Each Bodily Feature, Predicting Openness.
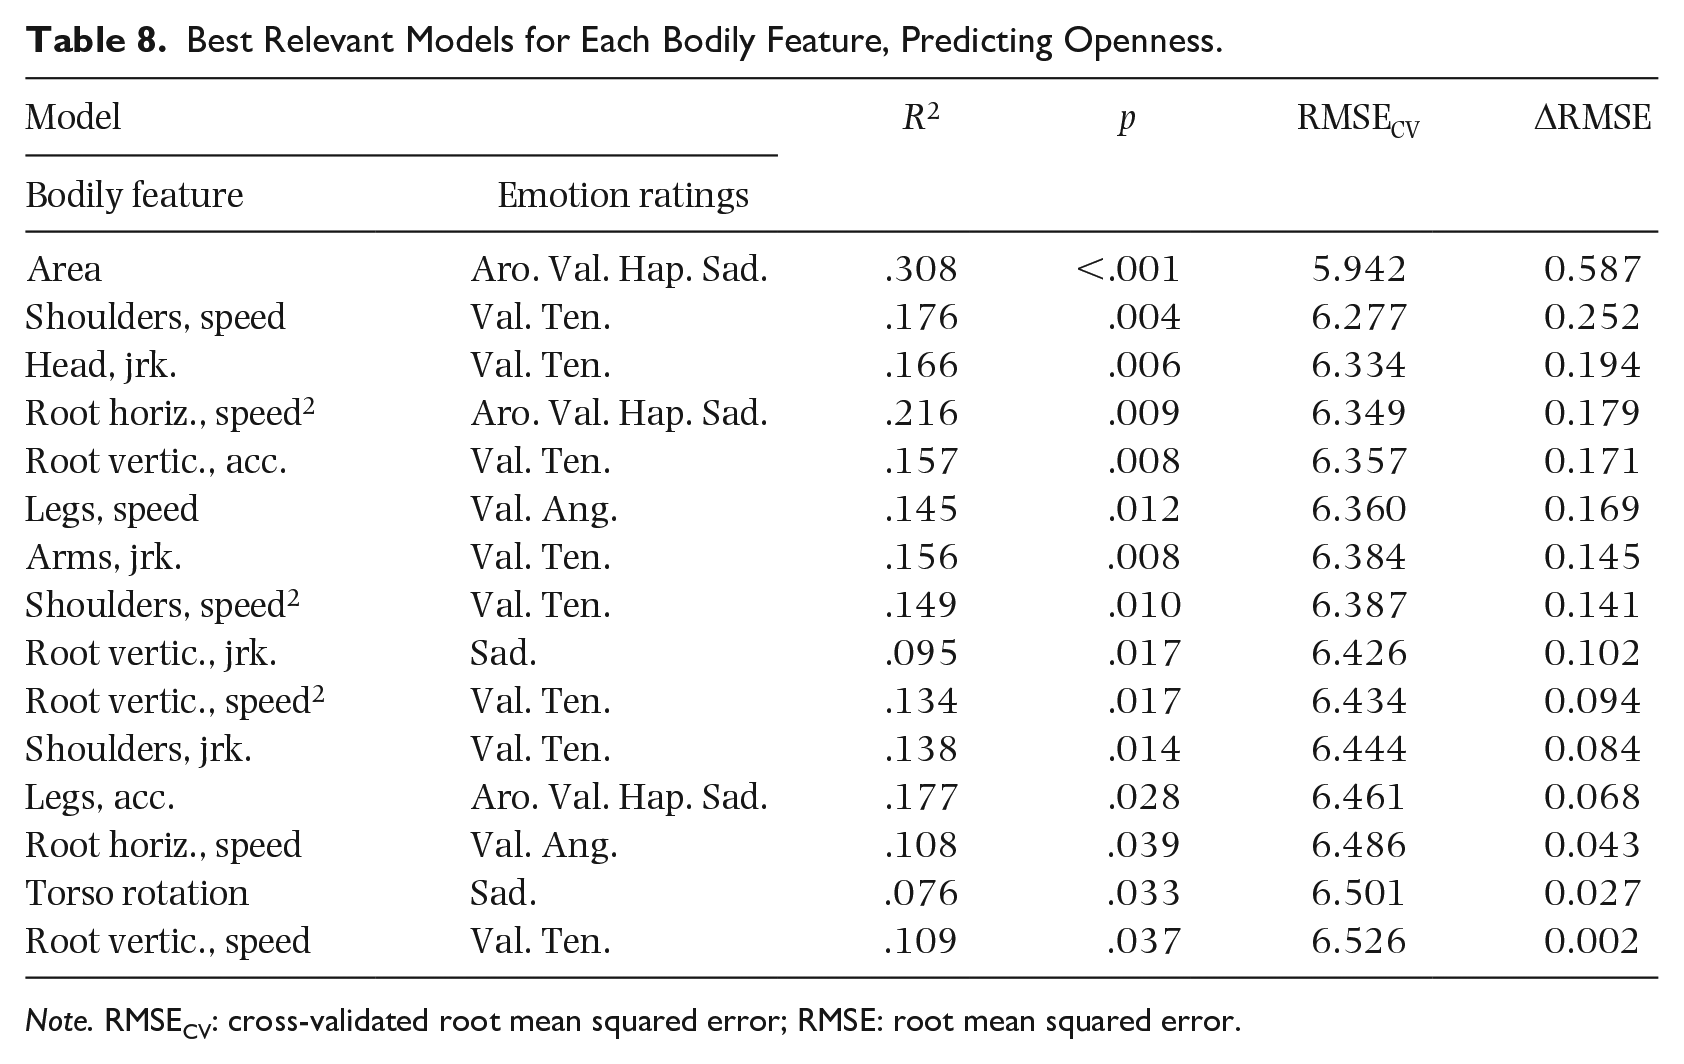
Note. RMSECV: cross-validated root mean squared error; RMSE: root mean squared error.
It is worthwhile to note that the embodiments of Valence and Tenderness by bodily feature “Root vertical, acceleration” are regressors for a model that is the most relevant for Extraversion and also one of the most relevance for Openness. A closer inspection of this model reveals that the coefficients for the regression fit are very similar for both personality traits. The coefficients for Extraversion are 21.857, 41.409, –48.245 and the coefficients for Openness are 34.011, 48.321,–47.252, where the first values are the constant and the remaining are the regressors’ coefficients. However, both the fit and the prediction power of this model are greater for Extraversion, as revealed by its R2 and ΔRMSE values.
The model selection method presented earlier is focused on the prediction performance of models, allowing the best combinations of regressors for each model, with the sole constraint of having regressors for only one bodily feature for each model. However, this means that regressors are removed from a model only to improve its prediction power. Even when the models have been cross-validated, it is possible that regressors remain in the model because of their noise instead of their true explanatory power. Therefore, it is convenient to also examine only those models that have all regressors for each type of emotional rating and also those models that have all emotional ratings. Table 9 shows all relevant models that have regressors considering all emotional ratings, all dimensional affect ratings or all discrete emotions ratings. In these conditions, no relevant models are found for Extraversion or Neuroticism. Additionally, all except the following bodily features appear in regressors for at least one relevant model: All markers’ speed, All markers’ jerk, Shoulders’ acceleration, and Head’s squared speed. These bodily features do not appear in Table 2. Hence, these features may be irrelevant.
Relevant Models That Have Regressors Considering All Emotional Ratings (AVHAST), All Dimensional Affect Ratings (AV), or All Discrete Emotions Ratings (HAST).
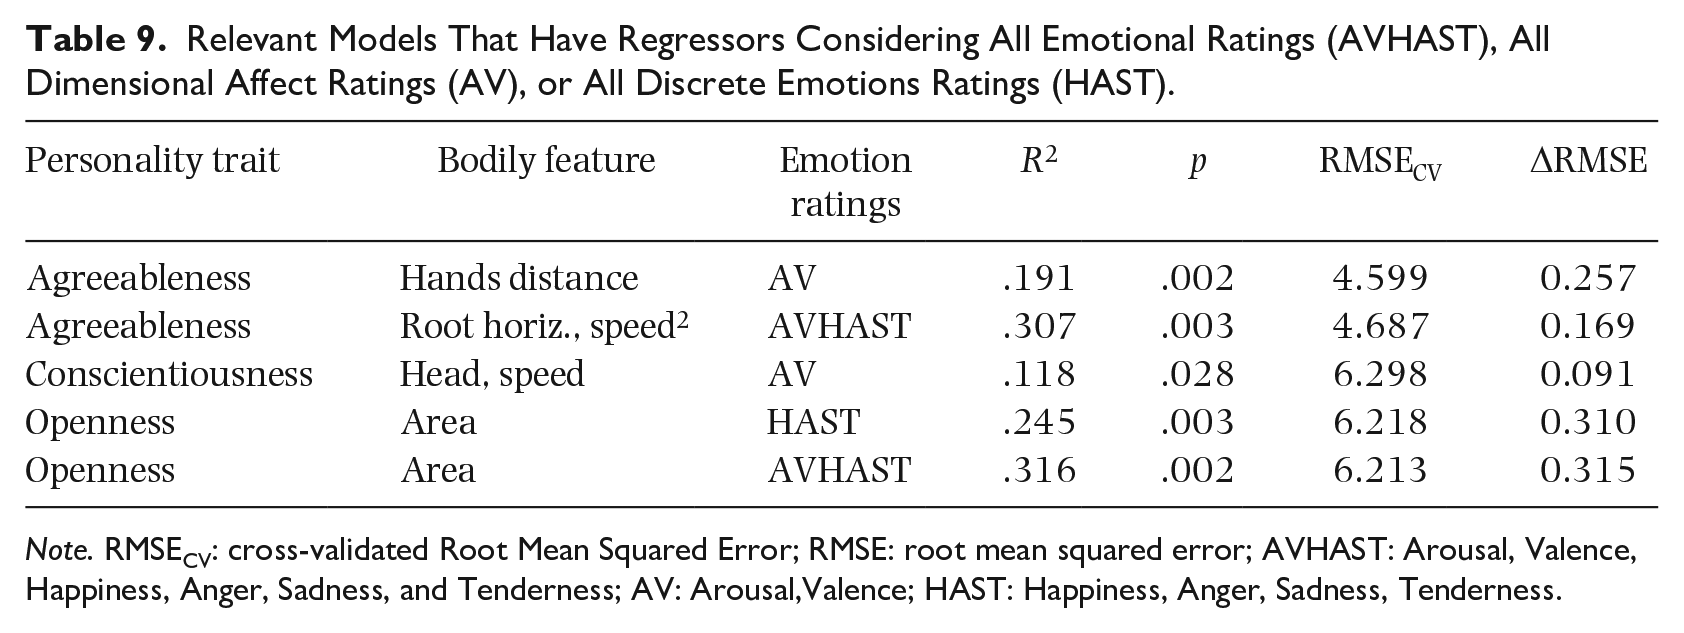
Note. RMSECV: cross-validated Root Mean Squared Error; RMSE: root mean squared error; AVHAST: Arousal, Valence, Happiness, Anger, Sadness, and Tenderness; AV: Arousal,Valence; HAST: Happiness, Anger, Sadness, Tenderness.
Discussion
We explored relationships between the Big Five personality traits and musical emotions embodied in spontaneous movement to music. Embodied emotions were evaluated as the rank correlation between characteristics of spontaneous movement to music and perceived musical emotions in the music moved to. Two analyses were carried out. Analysis 1 consisted of rank-correlating personality and embodied emotions. Analysis 2 involved creating multiple linear models that predicted personality traits with the weighted scores of embodied emotions. The purpose of these analyses was to evaluate and highlight relationships that might be empirically tested in future studies.
Analysis 1 revealed moderately weak monotonic relations between bodily features and perceived emotions for all personality traits. Conscientiousness and Neuroticism had the weakest of such relations when considering the rank-correlation values and the number of bodily features involved. The relations between emotions embodied by aggregated bodily features and personality traits were rather weak (see Figure 2), and statistical analysis provided limited evidence that such relationships exist (see Table 3). The p-values shown in Table 3 may be useful in future research, for example, to re-test the highest correlation obtained or to discard the aggregation method.
The results of Analysis 2, however, revealed that predictions using linear regression models that are better than the null model are possible for all personality traits, albeit they range from weak to moderate. Regarding the performance of all regression models, the strongest predictions were found for Openness, followed by Agreeableness and Extraversion. The predictions for Conscientiousness and Neuroticism were the weakest and, as in Analysis 1, this general assessment considers the goodness-of-fit of models and the number of models involved. Regarding models that have regressors for either discrete emotions, dimensional affect or both (Table 9), the strongest predictions were still found for Openness, followed by Agreeableness and Conscientiousness. In this case, no relevant models were produced for traits Extraversion or Neuroticism.
In both analyses, distinct bodily features were found to embody musical emotions correlating with or predicting personality traits. No single bodily feature embodying a musical emotion was a high rank correlate of all personality traits. Likewise, no single combination of bodily features embodying any combination of perceived emotions predicted all personality traits. However, some bodily features embodying an emotion did highly correlate with, or combine linearly to predict, more than one personality trait. For both analyses, the most relevant bodily features involved in the tested relationships were identified. These results may serve as hypotheses in further investigation.
The tabulated rank correlations (Table 2) and models with all regressors allowed (Tables 4 to 8) exhibit an overall distribution considering the number of tabulated bodily features and the strength of tested relationships. This distribution may be summarized in two clusters of personality traits. The first cluster is composed by Openness, Agreeableness, and Extraversion, whereas the second cluster consists of Conscientiousness and Neuroticism. However, this two-cluster pattern does not hold for rank correlation between personality traits and aggregated embodied emotions (Table 3). It also does not hold when regressors are forcibly embodiments of either dimensional affect, discrete emotions, or both (Table 9), and when the number of correct predictions is evaluated using the threshold method (Table 9). A special case is trait Openness, for which all assessments of prediction by regression models are the strongest (Tables 4 to 9). Also, trait Neuroticism is a special case, as it is related to the lowest number of bodily features (Tables 2 and 4 to 9).
The two-cluster pattern with the special case for Neuroticism is remarkably consistent with the results obtained by the meta-analysis conducted by Barańczuk (2019). That study found that lower levels of Neuroticism and higher levels of all other traits were associated with greater typically adaptive emotion regulation strategies (reappraisal, problem solving, and mindfulness) and lower typically maladaptive emotion regulation strategies (avoidance and suppression). In particular, the relationship between suppression of expression of emotions was found to be non-significant for Neuroticism and inverse for all other traits, Conscientiousness and Neuroticism being the weakest, and Extraversion being the strongest. While Extraversion does not appear in this study as a special case of strong direct relationships with embodied emotions, the relations observed for all other traits suggest that the embodiment of emotions may be related to the suppression of emotion. The relationships for Extraversion might have been affected by unobserved factors.
When the special case for Openness and the special case for Neuroticism are integrated to the two-cluster pattern, it is possible to observe that similar results were obtained by previous studies that have investigated the strength of correlation between personality traits and music preference or liking, across a variety of music genres and cultural backgrounds (Brown, 2012; Delsing et al., 2008; Dobrota & Reić Ercegovac, 2015; Dunn et al., 2011; Ercegovac et al., 2015; Fricke & Herzberg, 2017; Nave et al., 2018; Rentfrow & Gosling, 2003; Schäfer & Mehlhorn, 2017; Upadhyay et al., 2017; Vuoskoski & Eerola, 2011b; Zweigenhaft, 2008). These studies have found Openness to have the strongest correlations with music liking, followed by Agreeableness and Extraversion. Conscientiousness and Neuroticism were found to have the weakest correlations with music liking. Carlson et al. (2017) reported similar results, with the difference that correlation strength for trait Extraversion was much lower, closer to Neuroticism and Conscientiousness. Other studies measuring correlation between Big Five personality traits and preference for music have found distinct stronger correlations for Openness, and the other traits having weaker correlations (Cleridou & Furnham, 2014; Langmeyer et al., 2012; Upadhyay et al., 2017). Additionally, these observations are consistent with previous research that has found evidence that the preference for music is related to the emotional content of music (Hunter et al., 2011; Ladinig & Schellenberg, 2012; Naser & Saha, 2021; Schäfer & Sedlmeier, 2011) or that has hypothesized it based on the relation between preference and bodily features of spontaneous dance (Luck et al., 2014). Likewise, Openness, Agreeableness, and Extraversion have been found to be associated with positive correlations between music preference and the strength of emotional response to music, Openness having the strongest association (Liljeström et al., 2012; Nusbaum & Silvia, 2011).
The highest association between liking for music and perceived emotions, being for trait Openness, is consistent with results obtained by previous studies that have investigated a variety of related phenomena. Openness has been found to correlate positively with chills as an effect of listening to music (McCrae, 2007), awe for music (Silvia et al., 2015), and also with the direct relation between liking for sad music and emotions elicited by sad music (Vuoskoski et al., 2012). Trait Openness has consistently been thought to be related to the experience of complex and strong emotions as a result of sensitivity to aesthetic experiences (Reisenzein & Weber, 2009; Terracciano et al., 2003). These observations about Openness may explain the results of this study showing stronger relations to embodied emotions compared with other traits when a number of embodied emotions are combined as regressors in a linear model, in contrast to embodied emotions as correlators.
Other patterns similar to the ones found in this study may be found in previous studies on the relations between Big Five personality traits and trait Empathy. The special case of trait Neuroticism may be related to trait Empathy as Melchers et al. (2016) and Bamford and Davidson (2019) have observed direct correspondence between Empathy Quotient and all Big Five traits, except Neuroticism that had inversely weak and insignificant correspondence, respectively. Those studies and the work by DeYoung et al. (2010) have found Agreeableness to be strongly and directly related with trait Empathy, which might contribute to explain the high-rank correlations and linear fits found for Agreeableness in this study. Also Conscientiousness exhibiting weak relations with embodied emotions may be explained by this trait being the only Big Five trait not related to emotional dispositions (Reisenzein & Weber, 2009).
The comparison made of results of this study with previous studies, show that for each Big Five personality trait there may be underlying, moderating, or mediating factors of the embodiment of emotions. It may be worthwhile to test each of these as separate hypotheses in future research. While the regression models in this study predict personality traits separately, the relationship also holds, at least theoretically, in the opposite direction. This means linear models with personality traits as regressors, predicting embodied emotions.
Regarding limitations of this study, the first and most evident is the sample size and composition. The statistical power of this study is substantially limited by the amount of collected data and the generalizability is limited by demographics. A straightforward solution to increase statistical power is to replicate the experiment using the same stimuli and ratings of perceived emotions. However, such replication will require that participants have different characteristics than this study, like nationality and distribution of gender. This may not be an easy study to conduct, as data collection is costly. Apart from expensive laboratory equipment, substantial time is spent in motion-capture recordings and responding questionnaires. It is also challenging to find a homogeneous sample of Big Five traits and then having respondents to participate in motion-capture sessions. Therefore, each replication may not have by itself considerable statistical power and it may take several replications, by different laboratories, to achieve robust conclusions. The second limitation of this study is that ratings of perceived emotions were done by a separate group of participants. There is an advantage of this, however, as these ratings are a controlled variable, meaning that the same measure is used for all participants and could be used in replications of the experiment as a standard. Nonetheless, it may be worthwhile to explore the possibility of improving predictions of personality by using ratings made by the dancing participants. Also ratings of felt emotions may give further insights to the relation between personality and embodied emotions, as it has been observed that induced emotions affect dancing characteristics even if the music to which is being danced is emotionally neutral (Van Dyck et al., 2013). A further modification could be the use of self-chosen stimuli as this has been observed eliciting more intense emotional responses to music (Liljeström et al., 2012). The third limitation of this study is that the usability of linear regression models with few regressors is limited to observation or explanation of phenomena as they yield predictions with limited power. The predictive power of the best models found in this study may be not suitable, for example, to make clinical diagnosis or other kind of prediction that requires a very high degree of accuracy.
To conclude, this exploratory study provides empirical and quantitative evidence tentatively supporting the hypothesis that the emotional content of music expressed by spontaneous dance has distinct relationships with the Big Five personality traits. If one assumes that the observed characteristics of spontaneous dance are a result of the emotional content of music, and in light of previous research, it is possible to conjecture that the underlying causes of the embodiment of emotions are emotional dispositions, including empathy, as well as liking of the music being danced to. This study provides a foundation upon which future research could be built. Specifically, such work could empirically test the relationships and statistical models described herein, helping to further advance our understanding of the complex interrelationships between personality, movement, and emotion.
Footnotes
Appendix
Musical Audio Excerpts Used as Stimuli.

| Artist | Song (album) | Start time | BPM* | |
|---|---|---|---|---|
| 1) | Alice Deejay | Better Off Alone (Who Needs Guitars Anyway?) | 2:40 a | 137 |
| 2) | Andre Visior | Speed Up | 1:15 | 140 |
| 3) | Antibalas | Who is this America Dem Speak of Today? (Who Is This America?) | 1:00 | 121 |
| 4) | Arturo Sandoval | A Mis Abuelos (Danzon) | 1:53 | 108 |
| 5) | Baden Powell | Deixa (Personalidade) | 1:11 | 100 |
| 6) | Brad Mehldau | Wave/Mother Nature’s Son (Largo) | 0:00 | 143 |
| 7) | Clifford Brown & %Max Roach | The Blues walk (Verve Jazz Masters, Vol. 44: Clifford Brown & Max Roach) | 2:01 | 133 |
| 8) | Conjunto Imagen | Medley-Esencia de Guaguanco/ Sonero (Ayer, Hoy y Manana) | 2:18 | 87 |
| 9) | Dave Hillyard & The Rocksteady 7 | Hillyard Street (Playtime) | 0:15 | 135 |
| 10) | Dave Weckl | Mercy, Mercy, Mercy (Burning for Buddy) | 0:10 | 105 |
| 11) | Dave Weckl | Tower of Inspiration (Master Plan) | 0:00 | 125 |
| 12) | DJ Shadow | Napalm Brain/Scatter Brain (Endtroducing. . .) | 3:29 | 73 |
| 13) | Gangster Politics | Gangster Politics (Guns & Chicks) | 1:00 | 192 |
| 14) | Gigi D’Agostino | Blablabla (L’Amour Toujours) | 0:00 | 133 |
| 15) | Herbie Hancock | Watermelon man (Cantaloupe Island) | 0:00 | 132 |
| 16) | Horace Silver | The Natives Are Restless | 0:00 | 139 |
| 17) | In Flames | Scream (Come Clarity) | 0:00 | 100 |
| 18) | Jean Roch | Can You Feel it (Club Sounds Vol. 35) | 0:33 | 126 |
| 19) | Johanna Kurkela | Hetki hiljaa (Hetki hiljaa) | 3:22 | 122 |
| 20) | Juana Molina | Tres cosas (Tres Cosas) | 0:00 | 110 |
| 21) | Kings of Leon | Closer (Only by the Night) | 3:17 | 83 |
| 22) | Lenny Kravitz | Live (5) | 3:02 | 84 |
| 23) | Martha & The Vandellas | Heat Wave (Heat Wave) | 1:40 | 82 |
| 24) | Maynard Ferguson | Fireshaker (Live From San Francisco) | 0:00 | 91 |
| 25) | MIA | 20 Dollar (Kala) | 0:17 | 120 |
| 26) | Nick Beat | Techno Disco | 2:26 | 138 |
| 27) | Panjabi MC | Mundian To Bach Ke (Legalized) | 0:47 b | 98 |
| 28) | Patrick Watson | Beijing (Wooden Arms) | 2:30 | 154 |
| 29) | The Rippingtons | Weekend in Monaco (Weekend in Monaco) | 1:13 | 113 |
| 30) | Yuri Buenaventura | Salsa (Salsa Movie Soundtrack) | 2:17 | 102 |
*Beats-per-minute
a14s. repeated.
b19s. repeated.
Funding
The author(s) received no financial support for the research, authorship, and/or publication of this article.