
Abstract
Music therapy is efficacious for the treatment of depression. Compared to other psychotherapeutic forms, it allows for the emergence of various modes of mutual interaction, thus enabling multiple channels for emotional expression and fostering therapeutic alliance. Although musical interaction patterns between client and therapist have been regarded as predictors of therapeutic outcome in depression, this has not yet been systematically investigated. We aim to address this gap by analyzing the possible linkage between musical interaction features and changes in depression score. In a clinical trial, digital piano improvisations from 58 Finnish clients and their therapists were recorded over 12 sessions of music therapy lasting 6 weeks. Subsequently, a variety of symbolic features describing pitch, rhythm, duration, and velocity were extracted from the improvisations. We observed a number of relationships between client–therapist interaction and clinical improvement. Clients with largest improvements displayed higher overall interaction, particularly more musical interaction in the middle of the therapy process than in the beginning and end. In contrast, clients with lower depression change score exhibited overall lower interaction and yielded other temporal profiles of interaction. The association between clinical improvement and an inverted U-shaped curve of musical interaction is discussed in the light of process-outcome literature.
Keywords
Depression is the first cause of ill health and disability in the world (World Health Organization, 2017). Key symptoms of depression are persistent sadness, anhedonia, and an inability to perform daily activities. Retardation of sensory-motor and cognitive processes is apparent in people with depression (Shura et al., 2017). Psychotherapeutic treatment offers a safe environment in which clients with depression can process painful emotions and are able to put their emotional understanding into action in real-life situations. The establishment of a therapeutic relationship or alliance has been regarded as a robust predictor of psychotherapeutic treatment success (Ardito & Rabellino, 2011). Contended components of alliance include interaction and synchronous dyadic behavior (Koole & Tschacher, 2016).
A critical measure of efficacy in psychotherapeutic treatments is the client’s outcome. Outcome measures, however, do not suffice to fully characterize the impact of the therapeutic approach upon treatment success. For instance, it is relevant to understand and measure the relative contribution of processes—such as the relationship between client and therapist—to treatment outcomes. Process-outcome research focuses on investigating the relationship between estimates of what happens during the psychotherapy and the observed clinical effects (Gelo & Manzo, 2015). It has been shown, for instance, that the emotional clients’ emotional processing with depression is higher at midpoint than at beginning and end of therapy (Watson & Bedard, 2006), suggesting an inverted U-shaped pattern, and that clients who improve more exhibit an overall higher emotional processing than those with less improvement. More generally, process research studies have reported nonlinear dynamics of change in various psychotherapeutic measures (Hayes et al., 2007).
Typically, verbal communication has been the center of focus for psychotherapeutic interaction research. Paralanguage and non-verbal communication have been less studied, although verbal channels can be challenging for emotional expression. For example, movement synchrony (Ramseyer & Tschacher, 2014) and vocal measures have been linked to treatment success for various disorders (Mundt et al., 2012). A growing body of research suggests that interpersonal synchrony contributes to social functioning. For instance, behavioral (i.e., rhythmic) and physiological synchrony have been observed to yield a unique and independent contribution to group cohesion (Gordon et al., 2020). In psychotherapy, interpersonal synchrony is currently understood as one of the key factors behind successful therapeutic outcomes. This is due to converging results from different operationalizations of interpersonal synchrony, for example, based upon movement patterns, skin conductance, respiration, and heart rate (Ramseyer & Tschacher, 2014; Seikkula et al., 2015).
Music therapy refers to the use of music in clinical settings as an engaging means to address therapeutic needs of clients. This form of psychotherapy, which has evidenced efficacy in depression treatment (Aalbers et al., 2017; Erkkilä et al., 2011), stimulates non-verbal expression and allows for the emergence of various modes of mutual interaction. As a form of emotional communication, music characteristically operates at the non-verbal and embodied levels of interaction (Lesaffre et al., 2017). It has been argued that the embodied interpersonal coordination—mimicry and entrainment—is a key mechanism for how music promotes social connectedness (Hagen & Bryant, 2003; Hari et al., 2013; Hove & Risen, 2009; Kirschner & Tomasello, 2010; Sebanz et al., 2006; Tarr et al., 2015). In the context of music psychotherapy, musical improvisations can facilitate client–therapist interaction; this finding has motivated the development of computational tools for analysis of interaction in improvisations (Erkkilä et al., 2014).
Although various studies have explored client and/or therapist musical features (Luck et al., 2006, 2007; Sandak et al., 2019; Snape, 2020; Streeter et al., 2012), literature on client–therapist musical interaction is scarce (Foubert et al., 2017), especially in the context of depression treatment. Moreover, content-based analysis of musical improvisations has rarely been performed in the context of music therapy for depression (Snape, 2020). This is notable, considering the evidence for the efficacy of music therapy as a treatment for depression. The global health burden of this non-communicable disease further motivates such an endeavor.
The main objective of this study was to answer the following primary research questions:
To what extent is the change in depression as a result of a music therapy process predictable from musical interaction between client and therapist?
What is the pattern of musical interaction of depressed clients throughout the entire course of therapy and how does it relate to depression change?
Our hypothesis was that musical interaction would follow the inverted U-shaped pattern mentioned below, and that this would be clearer for clients with a higher clinical improvement. In this study, we performed a systematic musical feature analysis for a large dataset that was collected during a randomized controlled trial (RCT) on music therapy for the treatment of depression in working-age individuals (Erkkilä et al., 2008, 2021). The clinical model, which does not require previous musical skills from clients, is called integrative improvisational music therapy (IIMT) and is grounded on the creation of free improvisations via digital pianos and djembe drums. In this model, client and therapist alternate between music making and verbal dialogue. In IIMT, improvisations are understood both as a symbolic reflection of abstract mental content and as a means of expression that can help to evoke, for example, emotions and memories. The integrative aspect of IIMT echoes the integrative psychotherapy tradition, which embraces a flexible theoretical and methodological orientation (Norcross & Goldfried, 2005).
The aforementioned RCT (Erkkilä et al., 2021) studied the effects of music therapy with or without two enhancers: resonance frequency breathing (RFB) or listening homework (LH). The key finding of this trial was that the addition of RFB to the music therapy intervention resulted in enhanced therapeutic outcome for clients with depression. A supplementary research question that is relevant to further understand the effect of these enhancers concerns the relationship between their presence and absence, and the musical interaction between client and therapist. Identifying which musical interaction features can best predict client allocation, that is, understanding the possible effects of, for example, RFB presence upon musical interaction, would help explain what is the contribution of therapy processes to the observed changes in depression.
Methods
This study is based on musical improvisations obtained during a 2 × 2 factorial RCT (Erkkilä et al., 2021) in which all clients received IIMT. The intervention consisted of 12 bi-weekly sessions of music therapy, over a period of 6 weeks. The length of each session was 60 min. Clients were allocated to one of four groups (IIMT alone, IIMT + LH, IIMT + RFB, and IIMT + LH + RFB). Factor levels were derived from the presence or absence of LH (LHyes and LHno) and RFB (RFByes and RFBno).
Participants
The RCT was targeted at adults with a primary diagnosis of depression (categories F32 and F33 of the International Classification of Diseases (ICD)-10). Musical skills were not required, but their presence did not constitute a reason for exclusion. Ethical clearance regarding all procedures involving human subjects/patients was received from the Ethical board of Central Finland health care district, September 7, 2017, ref.: 17 U/2017. Written informed consent was obtained from every participant.
The original RCT sample consisted of 70 clients. One of these clients dropped out before the baseline measurement, so that, it was excluded from our study. After this, we excluded clients who played piano improvisations in less than six sessions (half of the therapy process). This resulted in a total of 58 clients who were used as the sample for all the analyses in this study.
Materials
Musical improvisations were created using two identical digital pianos placed opposite to each other, one for the client, and another one for the therapist (see Figure 1). In addition, both improvisers had a djembe drum placed next to the piano. No other musical instruments were used. The improvisations played during the music therapy trial were systematically recorded and stored in a computer; digital pianos were recorded both as musical instrument digital interface (MIDI) and digital audio, whereas djembe drums only as digital audio. Pro Tools sequencer software was used for recording the improvisations and controlled by the therapist. Due to systematic recording of the improvisations, it was possible for client and therapist to listen back to any of their past improvisations. This working method is also an element of the IIMT model.
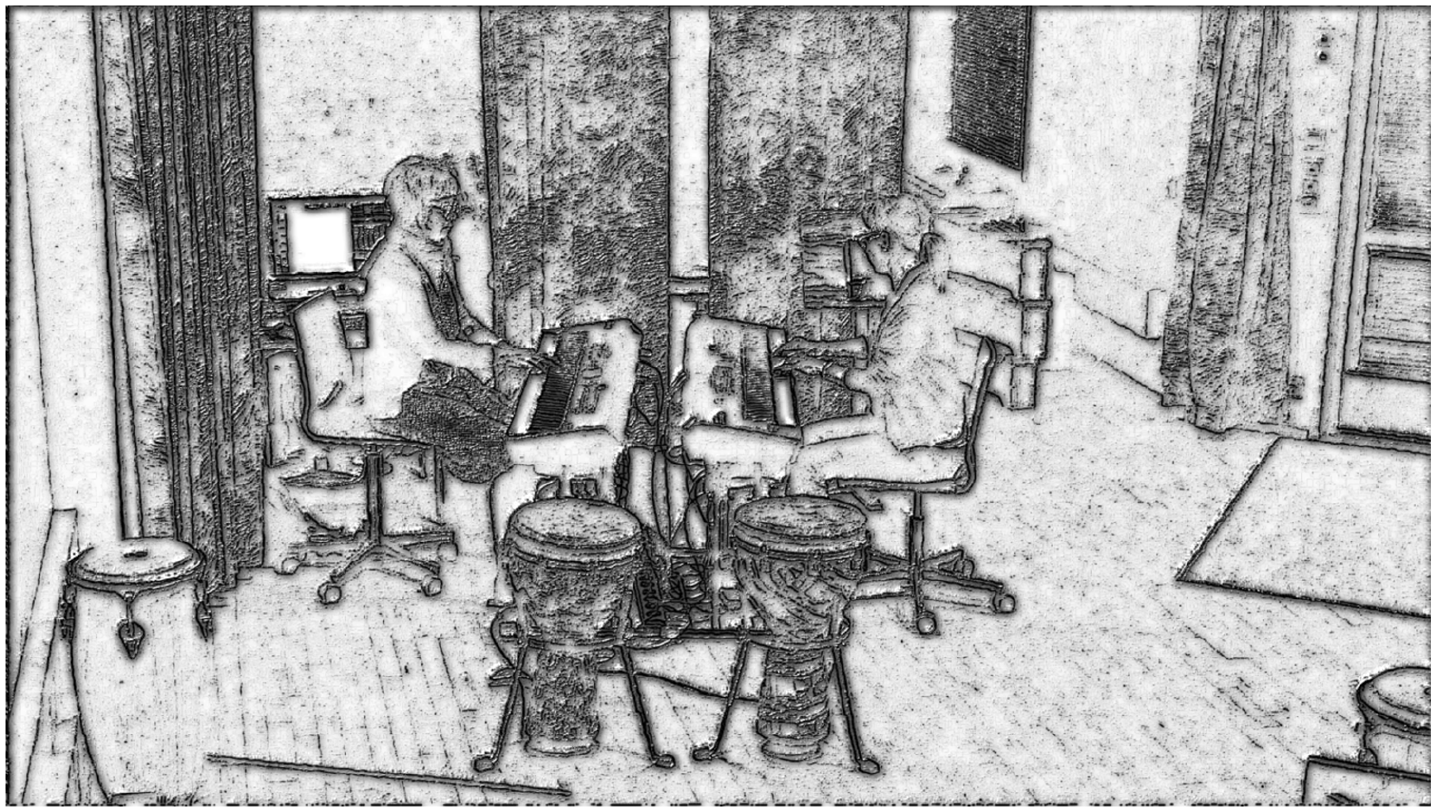
A Sketch of the Clinical Setting of the RCT.
Added component: RFB
RFB is a safe, easy-to-learn breathing technique derived from heart rate variability biofeedback (Lehrer & Gevirtz, 2014). It involves slow-paced breathing at the speed that maximizes heart rate variability, called the resonance frequency. This optimal speed is located around six breaths per minute in the adult population, and its exact individual value needs to be determined through a breathing assessment (Shaffer & Meehan, 2020). Generally speaking, slow-paced breathing methods can promptly shift the autonomic nervous system of individuals toward parasympathetic dominance, thus reducing stress and anxiety (Zaccaro et al., 2018). It has been shown that RFB can be used as a stand-alone intervention to treat a whole range of physical and psychological issues (Lehrer et al., 2020), including depression (Lin et al., 2019). The novelty of our approach was to integrate RFB into IIMT, to enhance the latter. During the music therapy trial (Erkkilä et al., 2021), RFByes clients performed this breathing technique for 10 min at the beginning of each session, while following visual breathing cues provided by a tablet computer.
Added component: LH
Clients within the LH condition (LHyes) were given the possibility to listen back at home to recordings of the improvisations that they created during the sessions, since these were automatically transferred to their computers and could be accessed via a dedicated music player. Clients were able to listen whenever and as many times as they wished throughout the therapy process, while therapists were advised to discuss the listening experiences in the therapy sessions. This procedure was inspired by findings suggesting that homework compliance during psychotherapy is beneficial in depression (Kazantzis et al., 2010) and was meant to encourage clients to bring back and further process therapeutic themes (e.g., emotions, images) that were related to the improvisations.
Measures
Outcome measures
A set of outcome measures was collected during recruitment (baseline), 6 weeks after beginning the intervention (post-intervention), and 6 months after beginning the intervention (follow-up). The Montgomery–Åsberg Depression Rating Scale (MADRS) (Montgomery & Åsberg, 1979) was used to assess depression severity. The anxiety subscale (HADS-A) of the Hospital Anxiety and Depression Scale (HADS) (Aro et al., 2004) was utilized to assess anxiety. RAND-36 (Aalto et al., 1999), a quality of life survey, was aggregated into its two summary scales, representing a mental component (RAND-36 MCS) and physical component (RAND-36 PCS). The Global Assessment of Functioning (GAF) scale (Jones et al., 1995) was utilized to assess how mental health symptoms affected clients’ daily life and general functioning. Based on the direction of the change in these scales, client improvement can be characterized by a decrease in MADRS and HADS and by an increase in RAND-36 MCS, RAND-36 PCS, and GAF. In other words, better therapeutic outcomes would be associated with positive change scores for MADRS and HADS and negative change scores for RAND-36 MCS, RAND-36 PCS, and GAF.
Musical features
A total of 31 symbolic musical features were extracted from the MIDI improvisations (see Musical features for a description of the procedure and 2.1 and 2.2 in Supplementary Materials online for a description of extracted features). The analyses presented in this article therefore only address piano improvisations, that is, not those on djembes. An algorithmic feature selection procedure, explained below, was used to select the two most relevant features for subsequent analyses.
Analysis procedure
Treatment efficacy analysis
To facilitate interpretation of results for this specific sample of clients, a treatment efficacy analysis was conducted through repeated-measures linear mixed-effects models (Twisk et al., 2018), following the approach described in the aforementioned RCT (Erkkilä et al., 2021).
Musical data preprocessing and feature extraction
Musical improvisations were imported from Pro Tools session files to MIDI using a parser 1 . Subsequently, they were manually checked for correctness and completeness. Next, all MIDI files were imported into MATLAB as note matrices using MIDI Toolbox (Eerola & Toiviainen, 2004) to perform musical feature extraction. Although our main goal was to focus on dyadic interaction, we extracted both individual, that is, client features (n = 16), and client–therapist interaction features (n = 15) describing statistical properties regarding pitch, duration, and loudness. This was done to find out what feature types (individual or dyadic) would yield higher relevance according to an automatic selection procedure (explained below). For each client, the first recording of each therapy session was chosen unless the client had played less than 10 notes or for under 60 s; this was done to ignore too short and possibly interrupted improvisations. In that case, the next available recording that would comply with this criteria was used for analysis. If none of the recordings were suitable, the session was labeled as missing data. In addition, there were three sessions (1, 6, and 12) in which the first recording of the session was not a free improvisation, but a structured one; these data have been collected for a different study. Hence, in these cases, the second recording (or the next suitable recording according to aforementioned criteria) was chosen instead.
Optimal feature subset selection
Feature values were mean averaged across the 12 therapy sessions. Subsequently, a data-driven model selection approach based on logistic regression (Cenkerová et al., 2018) was applied to further focus on a smaller subset of MIDI features. The aim was to classify the factor levels of the clients (LHno/LHyes and RFBno/RFByes) based on musical features. Due to the relatively small sample size (58 clients) for this kind of approach, only subsets with a size of two features were considered. Two binary classifications were performed, using a decision threshold of 0.5, for each possible combination of features: one classified clients as RFBno/RFByes, whereas the other one classified them as LHno/LHyes. Standard performance measures were computed to examine the classification results and a set of selection criteria were applied to choose an optimal model (see 2.3.1 in Supplementary Materials online). Subsequently, a 10-k, 10-fold cross-validation logistic regression was performed for the optimal model to obtain a more realistic estimate of model performance.
Differences between factor levels based on musical features
Two-sample t-tests were computed to find whether each of the selected musical features could be used to separate these grouping variables. Mean feature values across sessions were used to investigate to what extent each feature could discriminate clients based on their group membership.
To find out whether the degree of musical interaction followed a U-shape or an inverted U-shape over time, two nonlinear models of musical interaction were computed for each client, one for each of the selected musical interaction features (see 2.3.2 in Supplementary Materials online for a detailed description). Standardized second-degree polynomial (quadratic) coefficients were computed by modeling interaction feature values as a function of session number. Since our models of musical interaction described dissimilarity between dyad members, here a positive quadratic coefficient is associated with an inverted U-shaped interaction curve, whereas a negative one relates to a U-shaped interaction curve.
Subsequently, we investigated possible differences between factor levels with respect to temporal patterns of musical interaction among sessions. Independent samples t-tests were conducted to assess the separability between factor levels based on the aforementioned standardized quadratic coefficients that were obtained for each client.
Mixed-effects modeling of musical interaction
To further investigate the assumption of an inverted U-shaped curve of musical interaction, linear and quadratic mixed-effects models of musical interaction as a function of time were compared using model selection techniques (log likelihood, Akaike information criterion [AIC], and Bayesian information criterion [BIC]). For these models, a random intercept was included to adjust for differences between clients in musical interaction at baseline—which would, in turn, correspond to differences in depression. Five linear models and five quadratic models were computed for each of the two musical features: one per factor level (RFBno, RFByes, LHno, and LHyes) plus a model including the total sample of clients.
Musical features as predictors of outcome change scores
Next, possible relationships between client improvement and musical features were investigated using the whole sample of participants. Mean feature values across sessions were correlated with change scores of the outcome measures (level of depression and secondary outcomes). We also assessed whether the quadratic models of musical interaction were associated with their clinical improvement. To this end, we computed correlations between standardized quadratic coefficients from fitted polynomials and change score of outcome measures.
Results
The following section presents results regarding clinical characteristics of the sample of clients, selection of optimal features for further analysis, associations between client improvement and musical interaction features, and relationships between musical interaction features and client allocation into factor levels.
Sample demographic characteristics and treatment efficacy
Both sample demographics (Table 1 in Supplementary Materials online) and treatment efficacy analyses (Tables 2 and 3 in Supplementary Materials online) of the selected 58 clients were similar to previously reported results for the full sample of 70 clients (Erkkilä et al., 2021). The RFB factor yielded significant overall effect of treatment for all outcomes (favoring RFByes), whereas LH did not reach significant treatment effects. These results corresponded with the mean change scores of the outcome measures (see Table 8 in Supplementary Materials online).
Selection of optimal musical features via logistic regression
A set of two musical interaction features that would best predict client allocation was identified using an exhaustive combinatorial search (see 2.3.3 in Supplementary Materials online for a detailed description): rhythmic complexity dissimilarity, which refers to the absolute difference between client and therapist in entropy of note duration distribution, and beat clarity dissimilarity, which describes the absolute difference between client and therapist in maximum of note onset autocorrelation at lags greater than zero (see 2.3.4 in Supplementary Materials online for examples of musical improvisations with low and high values for this feature). Since these features describe differences between the playing of client and therapist, lower feature values would be associated with higher client–therapist interaction.
Relationship between client improvement and musical features
Next, we tested the hypothesis that clients with higher musical interaction throughout the music therapy process would clinically improve more. Table 1 shows the correlation between change scores and mean musical interaction features across sessions for all clients. Correlation coefficient magnitudes were weak, but the direction of most of the coefficients—all except for RAND36 PCS versus rhythmic complexity dissimilarity—suggests a positive relationship between client improvement and musical interaction. Correlations reached statistical significance for MADRS with both features, for RAND36 PCS with beat clarity dissimilarity, and for GAF with rhythmic complexity dissimilarity.
Correlation Between Change Score of Outcome Measures and Mean Musical Interaction Features Across Sessions for Total Sample of Clients.
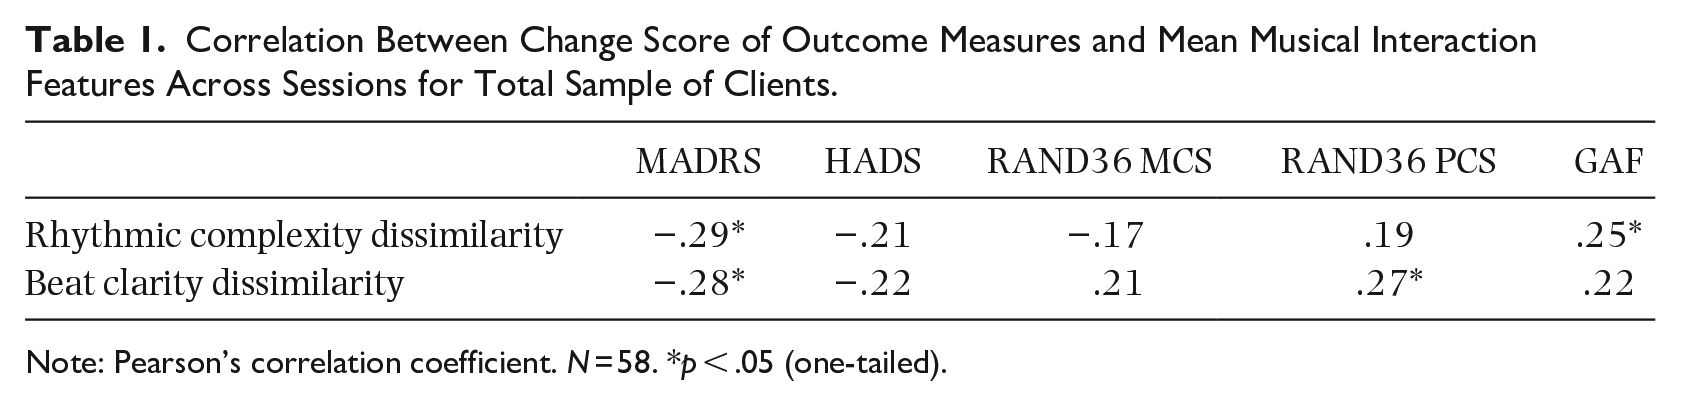
Note: Pearson’s correlation coefficient. N = 58. *p < .05 (one-tailed).
Relationship between client improvement and quadratic models of musical interaction
We further investigated the possible relationship between client improvement and the aforementioned polynomial coefficients, which represented the session-to-session musical interaction profiles as an upward- or downward-facing parabola (see Table 14 in Supplementary Materials online for a similar exploration through a linear model of musical interaction). Our hypothesis was that higher client improvement would be associated with an inverted U-shape of musical interaction and vice versa. Correlation coefficients between change scores and standardized quadratic coefficients of interaction features are presented in Table 2. The direction of most correlations indicates a positive relationship between client improvement and standardized quadratic coefficients. Only two correlations, namely rhythmic complexity dissimilarity versus MADRS and rhythmic complexity dissimilarity versus RAND36 PCS did not follow the expected direction. Beat clarity dissimilarity exhibited statistically significant correlations for all outcome measures.
Correlation, for Total Sample of Clients, Between Change Scores of Outcome Measures and Quadratic Models of Musical Interaction.
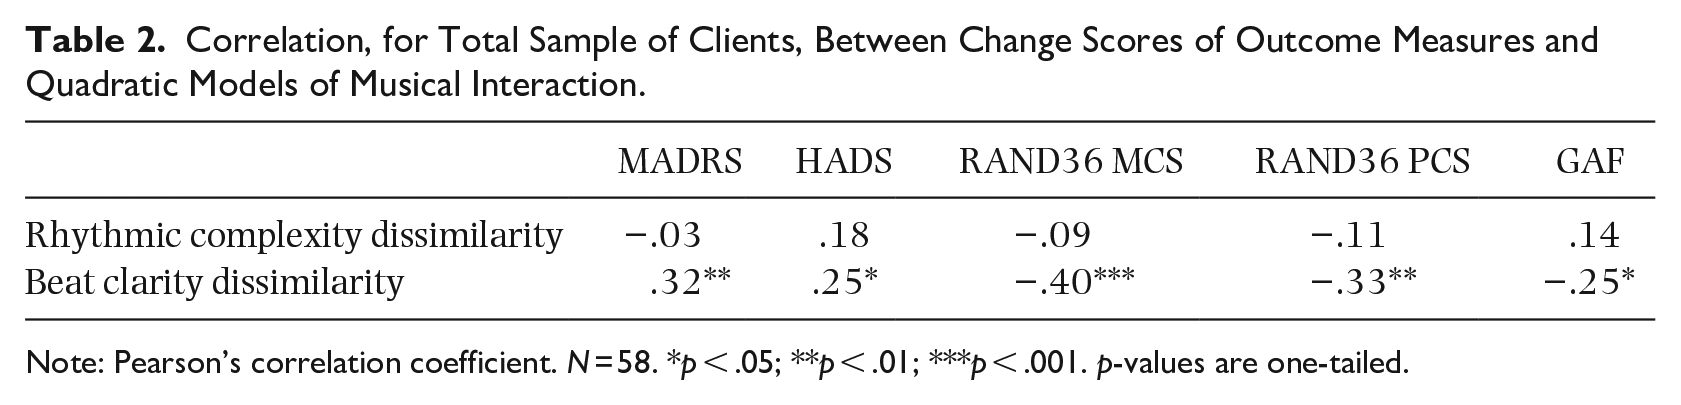
Note: Pearson’s correlation coefficient. N = 58. *p < .05; **p < .01; ***p < .001. p-values are one-tailed.
Relationship between musical features and client allocation
Classification performance based on the selected musical features
A first step to understand whether the musical feature values would allow to separate clients into groups were the performance estimates obtained from the feature selection procedure. Regarding the chosen model, we found that both the correlation between rhythmic complexity dissimilarity and beat clarity dissimilarity and their variance inflation factor (VIF) were insufficient for assuming model collinearity, r = .53, VIF = 1.38. Absolute standardized beta coefficients did not exceed one either for RFB (rhythmic complexity dissimilarity ß = −0.61; beat clarity dissimilarity ß = −0.80) or for LH (rhythmic complexity dissimilarity ß = 0.21; beat clarity dissimilarity ß = −0.45). According to the direction of these coefficients, the RFByes group exhibited higher musical interaction than the RFBno group; results for LH were more ambiguous but the direction of the strongest predictor (beat clarity dissimilarity) suggests higher musical interaction in the LHyes group compared to the LHno group.
The obtained classification performance measures for each factor are shown in Table 3. According to these metrics, the classification performance based on musical interaction was higher for RFB than for LH, meaning that RFByes and RFBno groups differ more in terms of musical interaction than LHyes and LHno.
Performance Measures for Binary Classification into Factor Levels Based on Optimal Musical Features.
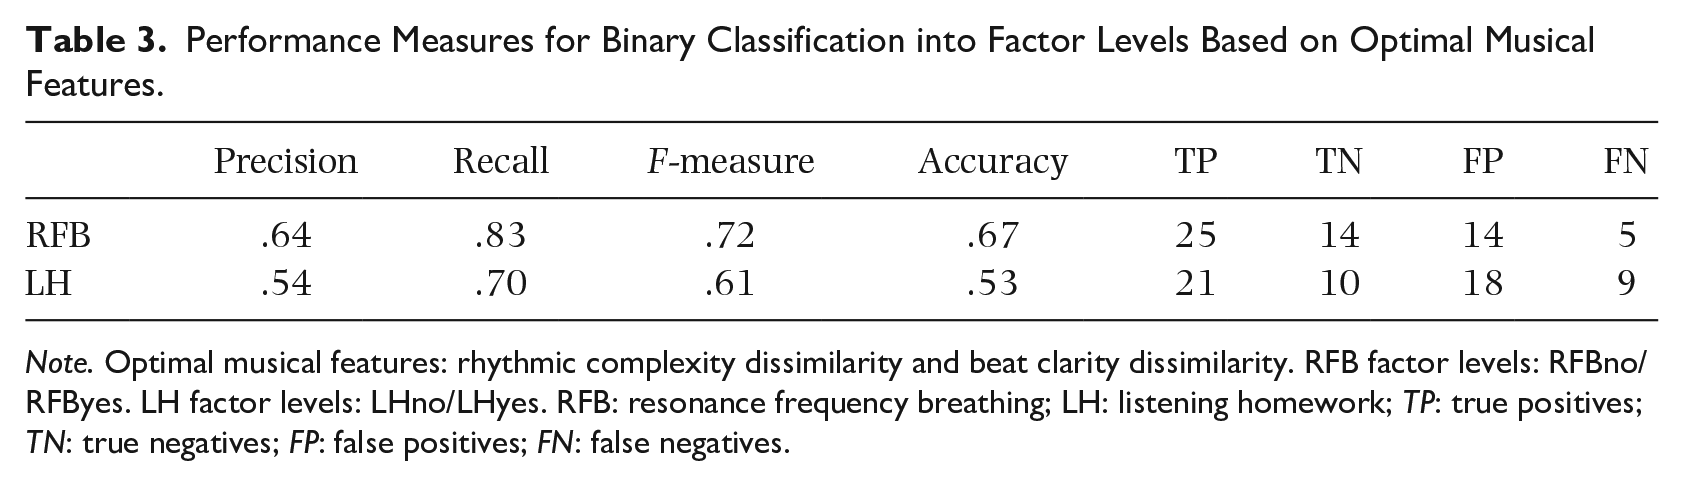
Note. Optimal musical features: rhythmic complexity dissimilarity and beat clarity dissimilarity. RFB factor levels: RFBno/RFByes. LH factor levels: LHno/LHyes. RFB: resonance frequency breathing; LH: listening homework; TP: true positives; TN: true negatives; FP: false positives; FN: false negatives.
A 10-k, 10-fold cross-validation logistic regression was performed with the selected features to obtain a more generalizable performance estimate. The mean F-measure across runs of the mean across folds was .68 (SD = 0.04) for RFBno/RFByes classification and .53 (SD = 0.05) for LHno/LHyes classification, again indicating higher performance for RFB than for LH.
Feature-based discrimination ability between factor levels
Next, we estimated the ability of each of the two selected musical interaction features to separate “Yes” from “No” groups. Compared to the aforementioned classification procedure, which focused on the yes/no separability through a linear combination of musical interaction features, this analysis investigated the stand-alone potential of each feature. Two-sample t-tests, shown in Table 4, were conducted to estimate the separation ability between factor levels based on each musical feature. For both features, RFByes yielded significantly lower feature values (i.e., more musical interaction) than RFBno. The comparisons for LH did not reach statistical significance.
Two-Sample t-Tests Between Factor Levels for Interaction Musical Features.
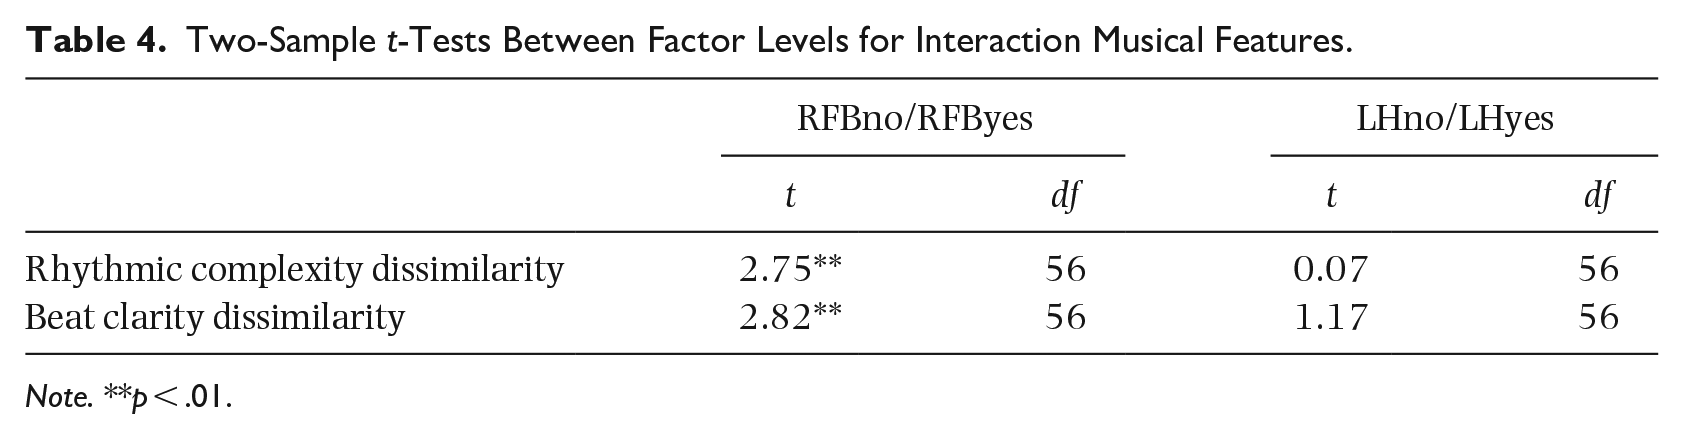
Note. **p < .01.
T-tests comparing the standardized quadratic coefficient of a second-degree polynomial fit
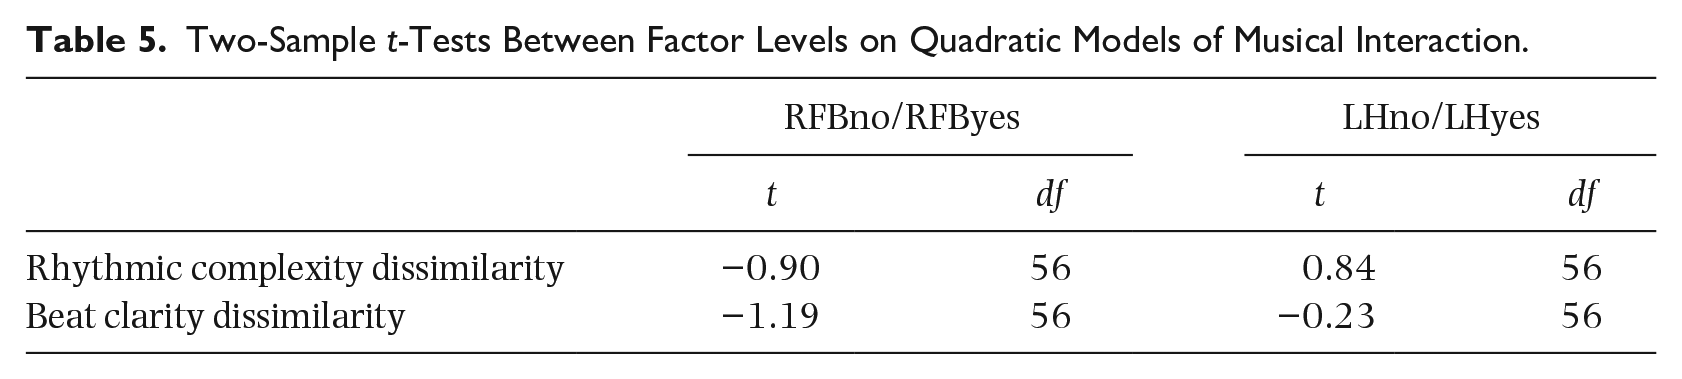
Following our hypothesis that clients with better therapeutic outcomes would follow a clearer inverted U-shaped musical interaction pattern, we fitted a vertical parabola over the session-to-session musical interaction profile of each client (see Table 6 in Supplementary Materials online for a similar analysis based on a linear model of musical interaction). The musical interaction profile of each client was then described via the narrowness of the parabola and the direction of its opening: clients with better therapeutic outcome, such as those in the RFByes group, were expected to display a musical interaction parabola opening downward and vice versa. Table 5 shows one-tailed two-sample t-tests comparing factor levels based on standardized quadratic coefficients of the fitted polynomials for each interaction feature. The results did not reach significance, but RFB yielded larger t-statistic magnitudes and a trend toward higher coefficients for RFByes (RFBno
Two-Sample t-Tests Between Factor Levels on Quadratic Models of Musical Interaction.
Linear and quadratic mixed-effects estimation
As a further exploration of the assumption of an inverted U-shaped curve of musical interaction, a comparison between linear and quadratic mixed-effects models of musical interaction as a function of time was performed. From the five linear models and five quadratic models that were computed for each of the two musical features, only the five quadratic models were found to be optimal with respect to log likelihood and mean squared error. This was to be expected due to the increased complexity of these models. However, quadratic RFByes models (illustrated in Figures 2 and 3) yielded optimal results for two model selection methods that penalize for the number of model parameters, namely, AIC and BIC. Regarding the characteristics of the RFByes group—relatively higher initial depression and highly positive outcome—it could be speculated that inverted U-shaped curves are more salient for clients with higher depression who significantly improved throughout the therapy process.
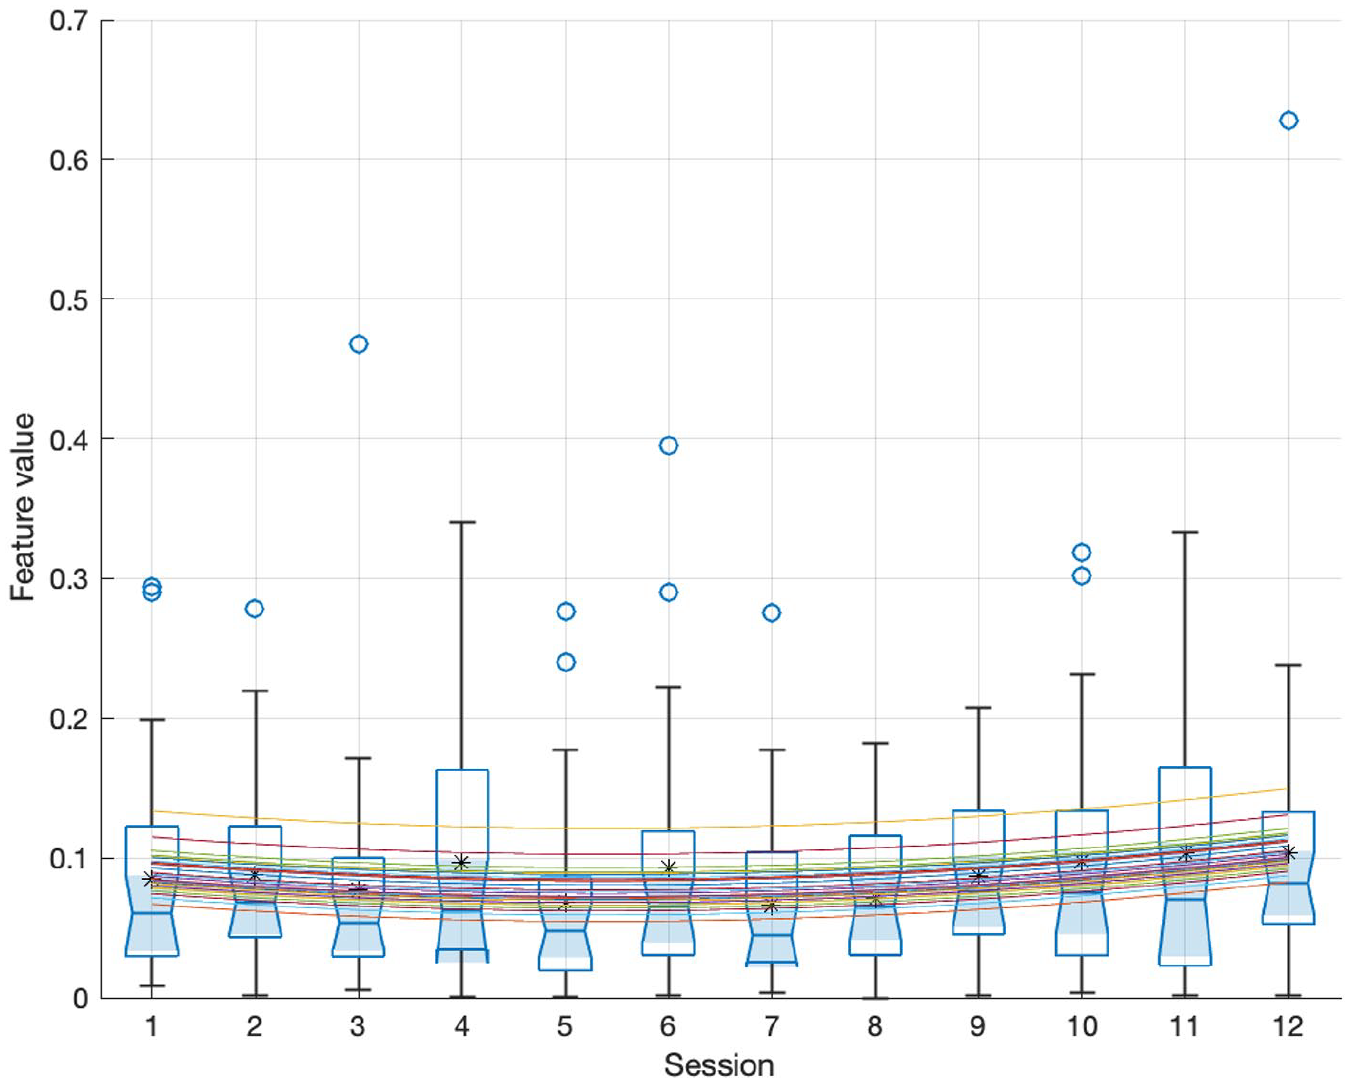
Distribution, for Each Session, of Rhythmic Complexity Dissimilarity Across Sessions for RFByes. Means Are Shown With Circle Markers and Medians as Red Segments. A Random Intercept Quadratic Mixed-Effects Estimation Is Plotted Through the Data; Each Curve Corresponds to a Different Client.
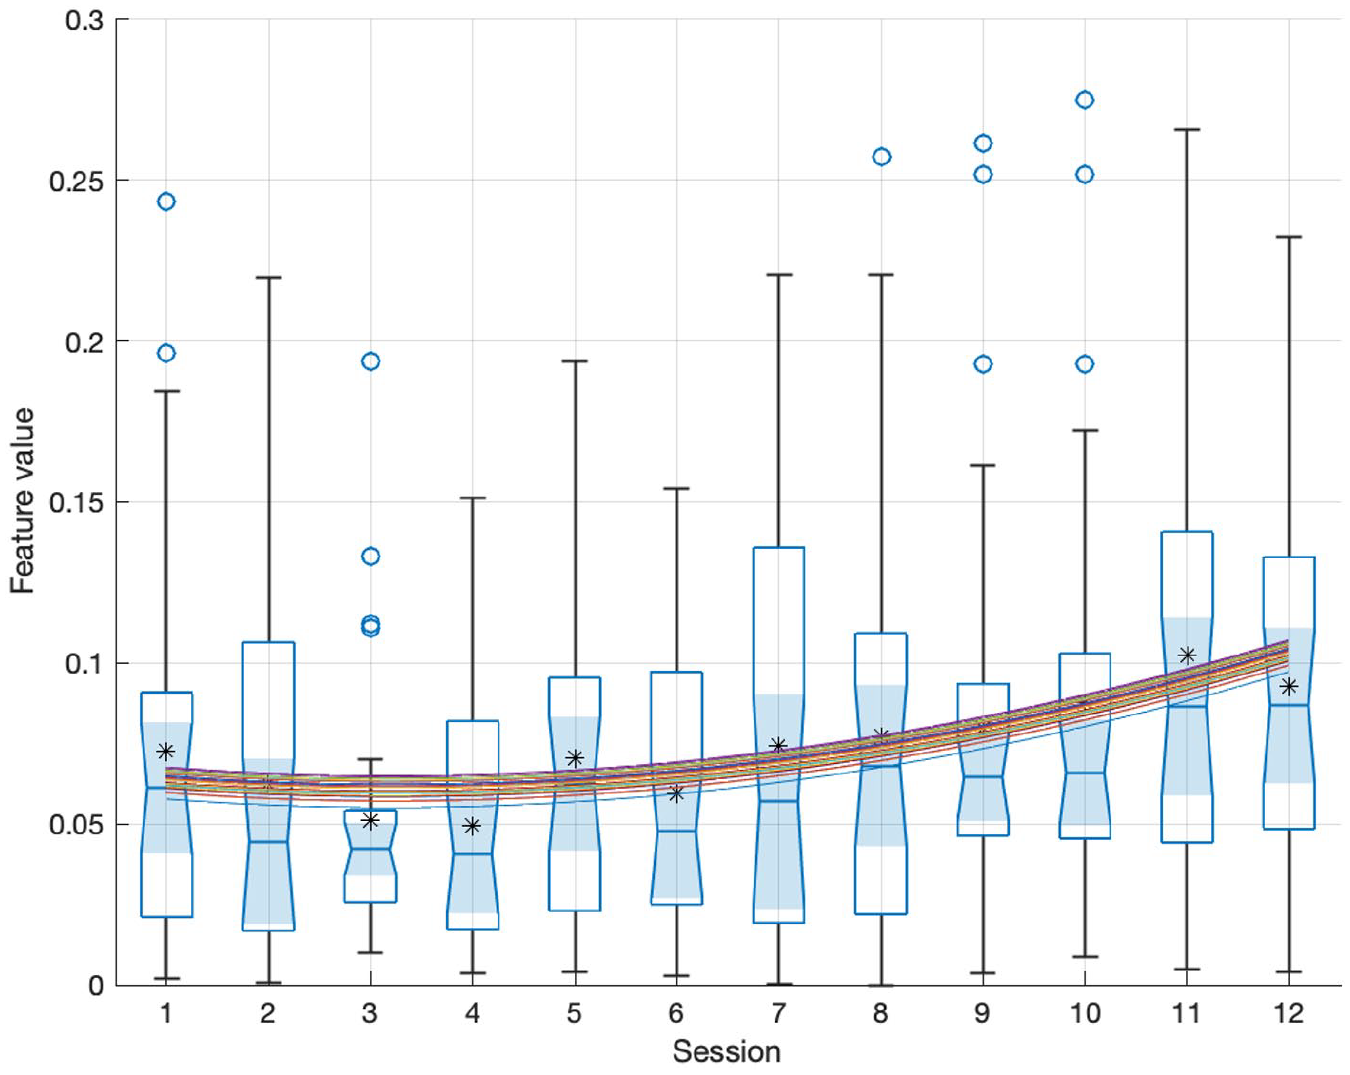
Distribution, for Each Session, of Beat Clarity Dissimilarity Across Sessions for RFByes. A Random Intercept Quadratic Mixed-Effects Estimation Is Plotted Through the Data.
Discussion
This study is a follow-up to an RCT of music therapy for the treatment of depression. Its focus was to investigate the role of musical interaction in improvisations between client and therapist throughout a therapy process upon client improvement and differentiation between client allocation. To that end, we focused on both global estimates of musical interaction across the therapy process and on nonlinear—that is, quadratic—change across therapy sessions in musical interaction. Our main finding is that musical interaction seems to be associated with clinical improvement; in particular, we found that quadratic models of musical interaction could be used to predict clinical improvement. Our results obtained through standardized quadratic coefficients derived from musical improvisation descriptors show that clients whose pattern of musical interaction more clearly resembled an inverted U-shape profile (i.e., those who achieved more musical interaction in the middle of the therapy process than in the beginning and end) were those who improved the most, compared to clients with other profiles (e.g., flat or U-shaped). Another relevant finding was that clients with a higher clinical improvement tended to display more musical interaction throughout the therapy process. In a nutshell, our findings showed that clients with larger change scores (i.e., with a higher difference in level of depression between beginning and end of therapy), tended to exhibit higher musical interaction and to follow an inverted U-shaped curve of musical interaction, whereas other clients exhibited lower interaction and yielded other profiles. In the same vein, conditions exhibiting significant differences with respect to treatment effects, such as RFByes and RFBno, could also be separated based on their musical interaction: RFByes clients, who showed a significantly higher decrease in MADRS than RFBno clients, exhibited significantly higher musical interaction than RFBno. On a more general note, global estimates of interaction across sessions and quadratic models of musical interaction seemed to be satisfactory predictors of client outcome.
Musical interaction was investigated in this study via two musical interaction features. The first feature, rhythmic complexity dissimilarity, roughly describes whether therapist and client exhibit differences in their playing with respect to the distributions of note durations in their improvisations; for instance, this feature would yield a high value if one of the dyad members tended to played notes with equal duration (low note duration distribution entropy), whereas the other dyad member played using a large variety of note durations (high note duration distribution entropy). The second feature, beat clarity dissimilarity, describes whether both client and therapist exhibit different levels of adherence to a metrical level, regardless of whether they follow the same metrical level. For instance, the feature would yield high values if the note onsets played by one dyad member were rather regular, for example, occurring every half a beat (high maximal onset autocorrelation), whereas the other dyad member tended to play more irregularly (low maximal onset autocorrelation).
Our main goal was to investigate possible correlates between client improvement and musical interaction. In this respect, both musical interaction averages across sessions and nonlinear models of session-to-session musical interaction profiles showed results that are in line with our hypotheses. Table 1 indicates a positive relationship between mean musical interaction across sessions and client improvement, suggesting that clients who benefited more from the therapy also interacted more with their therapist and vice versa. Table 2 further shows that clients following a more inverted U-shaped pattern of musical interaction exhibited higher clinical improvement. In both tables, most correlations followed the expected direction. Notably, all outcome measures exhibited significant correlations with quadratic models of beat clarity dissimilarity, which was the most consistent of the two musical interaction features analyzed. Although the majority of the correlations in Tables 1 and 2 did not reach statistical significance, it is worth noting that MADRS, one of the most frequently used and validated instruments in depression research, yielded significant results for most comparisons. In addition, MADRS has the highest mean correlation with other outcome measures (Table 13 in Supplementary Materials online), suggesting that other scales could help to reach a more comprehensive profile of the clients but might not necessarily evaluate characteristics that are intrinsic to depression. To give an example, according to the GAF scale, there were no significant treatment effects post-intervention, neither for RFB nor for LH (see Table 2 in Supplementary Materials online); in this vein, scoring difficulties with this scale have been previously reported (Aas et al., 2018). Future work might shed light on the relationship between different modalities of client–therapist interaction dynamics and clinical improvement in psychosocial dimensions that are common to depression, such as social functioning and anxiety.
The selection of these two musical interaction features was based on their performance for binary classification between levels for two participant grouping variables in an RCT—RFB and LH. Our approach showed that client–therapist interaction musical features seem to be more relevant than client features for discriminating clients with higher improvement (RFByes) from those with lower improvement (RFBno). Comparing these two musical interaction features, we found that beat clarity dissimilarity yielded higher separability between RFB and LH levels and higher correlations with client improvement than rhythmic complexity dissimilarity. Indeed, only one of the features—beat clarity dissimilarity—seemed to yield consistent results in our analyses. Our findings thus underscore that similarities in beat salience between client and therapist could be used to predict therapeutic improvement.
Other interesting relationships between treatment efficacy results and musical interaction were observed. Treatment efficacy results revealed (Tables 2 and 3 in Supplementary Materials online) significant treatment effects for RFB but not for LH, and generally more favorable outcomes for “Yes” conditions than for “No” conditions. This pattern of results resembles the outcome of our feature selection procedure. First, the RFB classification (cross-validation F-measure = .68) was rather accurate and the contribution of the extracted musical interaction features was easy to interpret; in contrast, the LH classification (cross-validation F-measure = .53) led to a less accurate and more complex model with regards to interpretability. Second, beat clarity dissimilarity, the coefficient with largest magnitude for both RFB and LH, described higher musical interaction for “Yes” than for “No” levels, both in the case of RFB and LH.
Our results regarding feature-based discrimination ability based on two-sample t-tests also show this relationship between treatment efficacy results and differences in musical interaction between groups characterized by clearly different therapeutic outcomes. As shown in Table 4, mean musical interaction across sessions can function as a distinguishing feature, at least for distinguishing RFByes from RFBno clients. Indeed, RFByes clients exhibited significantly higher mean musical interaction than RFBno for both features. Along the same lines as the results from the treatment efficacy analysis (see Section 1 in Supplementary Materials online), mean interaction values tended to be higher in LHyes than LHno, but these differences did not reach statistical significance. These results suggest that clients allocated to groups that yielded higher clinical improvement also displayed higher musical interaction.
While the aforementioned results are based on musical interaction averages across sessions, comparable findings were obtained via both nonlinear and linear modeling of session-to-session musical interaction profiles. Based on nonlinear modeling of beat clarity dissimilarity profiles, RFByes and LHyes tend to follow an inverted U-shaped curve of musical interaction, whereas for LHno and RFBno, the pattern of musical interaction tends to be flatter or to follow a mildly U-shaped curve (Table 5; Table 5 in Supplementary Materials online). Linear modeling of beat clarity dissimilarity profiles (Table 6 in Supplementary Materials online) further suggests that the RFByes group exhibits a clearer decrease in musical interaction over time than RFBno. According to these findings, inverted U-shaped curves with a salient decrease in musical interaction (see Figure 1 in Supplementary Materials online, where the average musical interaction peak occurs before the middle of the therapy process) are associated with better therapeutic outcomes. Despite the mean increase in interaction across clients between sessions 1 and 4, RFByes seems to be better characterized by a linear decrease from that session onwards. RFBno, in turn, exhibited a flatter profile of mean interaction across clients. It might be speculated, in this respect, that clients with better therapeutic outcomes started relatively early to rely less on therapist cues and carve their independent paths in the musical improvisations.
One of the limitations of this study is that the selected features are rough descriptors of musical interaction. Indeed, the extracted musical interaction features could be better labeled as descriptors of global similarity between client and therapist. On the other hand, it is valid to assume that musical similarity between client and therapist can serve as a measure of musical interaction between them. Future work could focus on implementation of local interaction descriptors that would allow for a dynamic quantification of musical synchrony between client and therapist.
Related to this, it is interesting to note that, from our initial set of 31 client and interaction features, only interaction features were selected through the model selection approach. This has facilitated our interpretation of the results: while the study of relationships between individual client features and clinical improvement has a clear exploratory nature—it is difficult to establish hypotheses regarding what types of musical features would be associated with clinical improvement—the study of musical interaction is motivated by a considerable amount of work that posits a connection between therapeutic alliance and clinical improvement.
Implications for clinical practice
Computational analysis of clinical improvisations is still a marginal field in music therapy research. This is mainly because there is a lack of clarity regarding what aspects of improvisations should be targeted (Erkkilä, 2007). The current challenge is to ascertain whether or not musical behaviors reflect aspects of pathology or improvement. In other words, musical behavior as such, or changes in it in the course of time, cannot be easily connected to a specific pathology or to other types of outcomes due to individual and situational differences as well as to the multidimensional nature of music. Recent research, however, is gradually diminishing this confusion, as are large-scale studies where various correlations between different data sources can be made. In the context of psychiatric music therapy, aspects of interaction derived from computational musical analysis seem to become a potential source of information, while allowing for connections to the idea of recovery. Recently, it has been shown that borderline personality disorder (BPD) patients’ musical improvisations deviate from normal controls with respect to temporal interpersonal synchrony in free improvisation (Foubert et al., 2017). The current study, now in the context of depression, emphasizes interactive aspects of clinical improvisation as the key change factors.
Throughout the sessions, an intersubjective field of playing will be developed, which starts from a subtle and fine-tuned attunement of the therapist during music therapy improvisations (Erkkilä et al., 2012). This way of intervention creates a “sensing of each person’s ways of being with others” (The Boston Change Processes Study Group [TBCPSG], 2010, p. 63), which becomes more complex and articulated with repeated sessions and thus repeated patient–therapist encounters. An articulated sensing leads to the emergence of more coherent and adaptive forms of interaction (TBCPSG, 2010). This results in the emergence of more coherent fittedness in the system (Sander, 1997), a tendency that our findings also show.
An increase of interaction could be hypothesized as an intensification of creative “now moments” that are contained in “moments of meeting” (TBCPSG, 2010). Such present moments support the development of interpersonal trust and recognition in clinical improvisations (Foubert et al., 2021), and are considered as a condition for the emergence of an “open space,” that is, a new, still unknown intersubjective field that opens the possibility for change in the therapeutic process (TBCPSG, 2010). Here, therapist and patient disengage from their specific meeting and can be alone, in the presence of the other. It would be interesting to study this hypothesis in relation to the decrease and quality of interactions in the final sessions as found in the findings of our study.
Our results, which suggest that clinical improvisations seem to be more interactive in the middle of music therapy than at its ends, resemble earlier psychotherapeutic findings in which emotional processing of clients tended to be higher in the middle of the therapy process than at the beginning and end of it (Watson & Bedard, 2006). This inverted U-shape phenomenon is typical for clients with relatively high depression scores at the beginning of therapy who benefited most from the therapy (Hayes et al., 2007). Interestingly, we also found that the inverted U-shape phenomenon concerning the amount of interaction in clinical improvisations was often observed for clients with higher depression scores at the beginning and who clearly benefited from music therapy. A possible conclusion is that interaction intensive clinical improvisations are indicators of increased emotional processing and that therefore by carefully analyzing the development of interaction in clinical improvisations, a music therapy clinician gets a valuable, intervention specific tool for assessment of clinical music therapy.
Supplemental Material
sj-docx-1-pom-10.1177_03057356221084368 – Supplemental material for Musical interaction in music therapy for depression treatment
Supplemental material, sj-docx-1-pom-10.1177_03057356221084368 for Musical interaction in music therapy for depression treatment by Martin Hartmann, Anastasios Mavrolampados, Petri Toiviainen, Suvi Saarikallio, Katrien Foubert, Olivier Brabant, Nerdinga Snape, Esa Ala-Ruona, Christian Gold and Jaakko Erkkilä in Psychology of Music
Footnotes
Acknowledgements
The authors would like to thank Inga Pöntiö for the psychiatric assessments, Markku Pöyhönen for his constant support in administrative, practical, and logistical matters, Mikko Leimu for setting up the music recording platform, and Emily Carlson for her proofreading and comments on the manuscript.
Author contributions
Declaration of conflicting interests
The author(s) declared no potential conflicts of interest with respect to the research, authorship, and/or publication of this article.
Funding
The author(s) disclosed receipt of the following financial support for the research, authorship, and/or publication of this article: This work was supported by the Academy of Finland (Project Numbers: 298678, 314651, 316912, 332331, and 346210).
Supplemental material
Supplemental material for this article is available online.
Notes
References
Supplementary Material
Please find the following supplemental material available below.
For Open Access articles published under a Creative Commons License, all supplemental material carries the same license as the article it is associated with.
For non-Open Access articles published, all supplemental material carries a non-exclusive license, and permission requests for re-use of supplemental material or any part of supplemental material shall be sent directly to the copyright owner as specified in the copyright notice associated with the article.