
Abstract
Maceral composition is a key parameter used in the assessment of metallurgical coals and coke quality prediction. However, coal particles are typically a mix of different macerals and minerals. Fluidity development in coal particles depends on particle size and the extent of association between constituent maceral grains. As such, determining the composition of coal particles is crucial to understanding the drivers of thermoplastic fluidity. In this work, coal grain analysis (CGA) was used to determine the maceral grain compositional information of individual coal particles for two pairs of metallurgical coals demonstrating different thermoplastic behaviour, as determined by standard Gieseler fluidity and dilatation testing. Each pair was comprised of coals with comparable ranks and both similar (coals A and C) and dissimilar (coals B and D) maceral compositions. The experimental results showed that coals of finer vitrinite particle size and higher degrees of maceral grain association, i.e., finely dispersed macerals within coal particles, demonstrated lower dilatation and higher permeability. It was postulated that coals with close maceral associations are more prone to volatile gas escape during thermoplasticity, hindering bubble growth and thermoswelling while also increasing melt viscosity, leading to decreased Gieseler fluidity measurements. It was also observed that coals with different degrees of maceral grain associations demonstrate different thermoplastic behaviour, where the presence of pure forms of reactive macerals enhanced coal fluidity. Results suggest that some coals possess a higher “effective fluidity” than reported from standard Gieseler testing. Conversely, coals with limited maceral grain association and high compositions of vitrinite prolific particles benefit from enhanced bubble growth and coalescence. Apparent fluidities of such coals are more accurately represented by standard Gieseler testing.
Keywords
Introduction
Coke is the pyrolyzed and annealed yield of metallurgical coal which plays several vital roles in the blast furnace (BF) ironmaking process. As a hard and porous material, coke acts as a skeletal support media against the weight of the ferrous burden charged to the BF while also providing pathways that facilitate the transport of gas and liquid through the BF. Coke also serves as fuel for combustion and is the main source of heat in the BF as well as the primary reducing agent of iron ore via direct reduction as well as gasification reactions with oxygen or carbon dioxide to produce carbon monoxide. All these factors contribute to coke being considered largely indispensable in the BF with respect to its utility and performance. One of the main properties of coke which facilitates its use in the BF is a high mechanical cold and hot strength. Cold strength is measured by various standard tumble tests (ASTM, ISO, JIS) and hot strength by tumbling after reaction with CO2 (CSR). As such, much effort is made in developing models which aid in the design of coal blends to produce strong, high-quality cokes. The use of coal plasticity data measured by standard methods such as Gieseler plastometry as input variables in these models is commonplace. However, coals with similar properties of rank, volatile matter, and maceral composition often show different fluidity values, leading to a misprediction of their strength in coke strength models.
The development of thermoplastic fluidity in coal particles is dependent on particle size and the degree of association between constituent grain macerals. As such, it is crucial to determine the maceral composition of coal particles to better understand the effect on coal fluidity. Stopes 1 provided a basis for the definition of coal composition based on optical properties and the “maceral concept”. 2 This led to the general understanding of how the ratio between reactive and inert coal components affects coal carbonization properties and behaviour. The three distinct coal maceral groups of inertinite, vitrinite and liptinite, each including several maceral types, can be identified by their relative greyness in reflected light under a microscope. Vitrinite, liptinite and part of semifusinite are classed as reactive macerals owing to their tendency to soften on heating, effectively acting as a binding agent of inertinite constituents such as fusinite, macrinite, micrinite, inertodetrinite, secretinite and the remainder of semifusinite which do not soften during conversion or carbonization.3,4,5 Generally, an increase in the inertinite content of coal increases its O/C atomic ratio, aromaticity factor and ring condensation index while lowering its H/C atomic ratio and pyrolysis reactivity at lower temperatures.4,6 As such, there exists an optimum ratio of reactive to inert coal components that will yield the highest strength cokes.
However, the general classification of coal reactive and inert constituents is not equally applicable to all coals. In particular, the division of the amount of semifusinite acting as reactive or inert is controversial. 7 One line of reasoning for this discrepancy is that the behaviour of macerals may vary from region to region due to different coalification and depositional conditions. 7 The inert grind also affects resultant coke properties, with relatively large inerts typically acting as centres of weakness to the coke,7,8 and fine inerts reducing the thermoplastic fluidity of the blend in the 350–500 °C temperature range. Karcz et al. 9 related coal particle size to internal pressure generation (IGP) within the coal charge via particle swelling behaviour during thermoplastic transformation. It was observed that smaller particles (< 50 μm) fragmented during softening while those closer to conventional coke oven feed size (< 2.85 mm) formed hollow cores, inhabited by volatiles, which induced swelling in individual coal particles. Jenkins and Mahoney 10 developed a model describing the mechanism of coal particle swelling (Figure 1). In the initial stage of thermoplasticity (Figure 1(a)), small “proto-bubbles” form which expand or contract depending on the local concentration of dissolved gases within the softened particle surrounding the bubble. Bubbles toward the centre of the particle begin to expand due to gas evolution and transport into the bubbles while those closer to the particle boundary shrink and collapse owing to gas loss from the particle surface (Figure 1(b)). These bubbles continue to grow and begin to coalesce (Figure 1(c)), eventually forming a single bubble in the centre of the particle, with some smaller bubbles remaining around the periphery (Figure 1(d)). Throughout this process, particle diameter continues to increase as a product of bubble expansion.
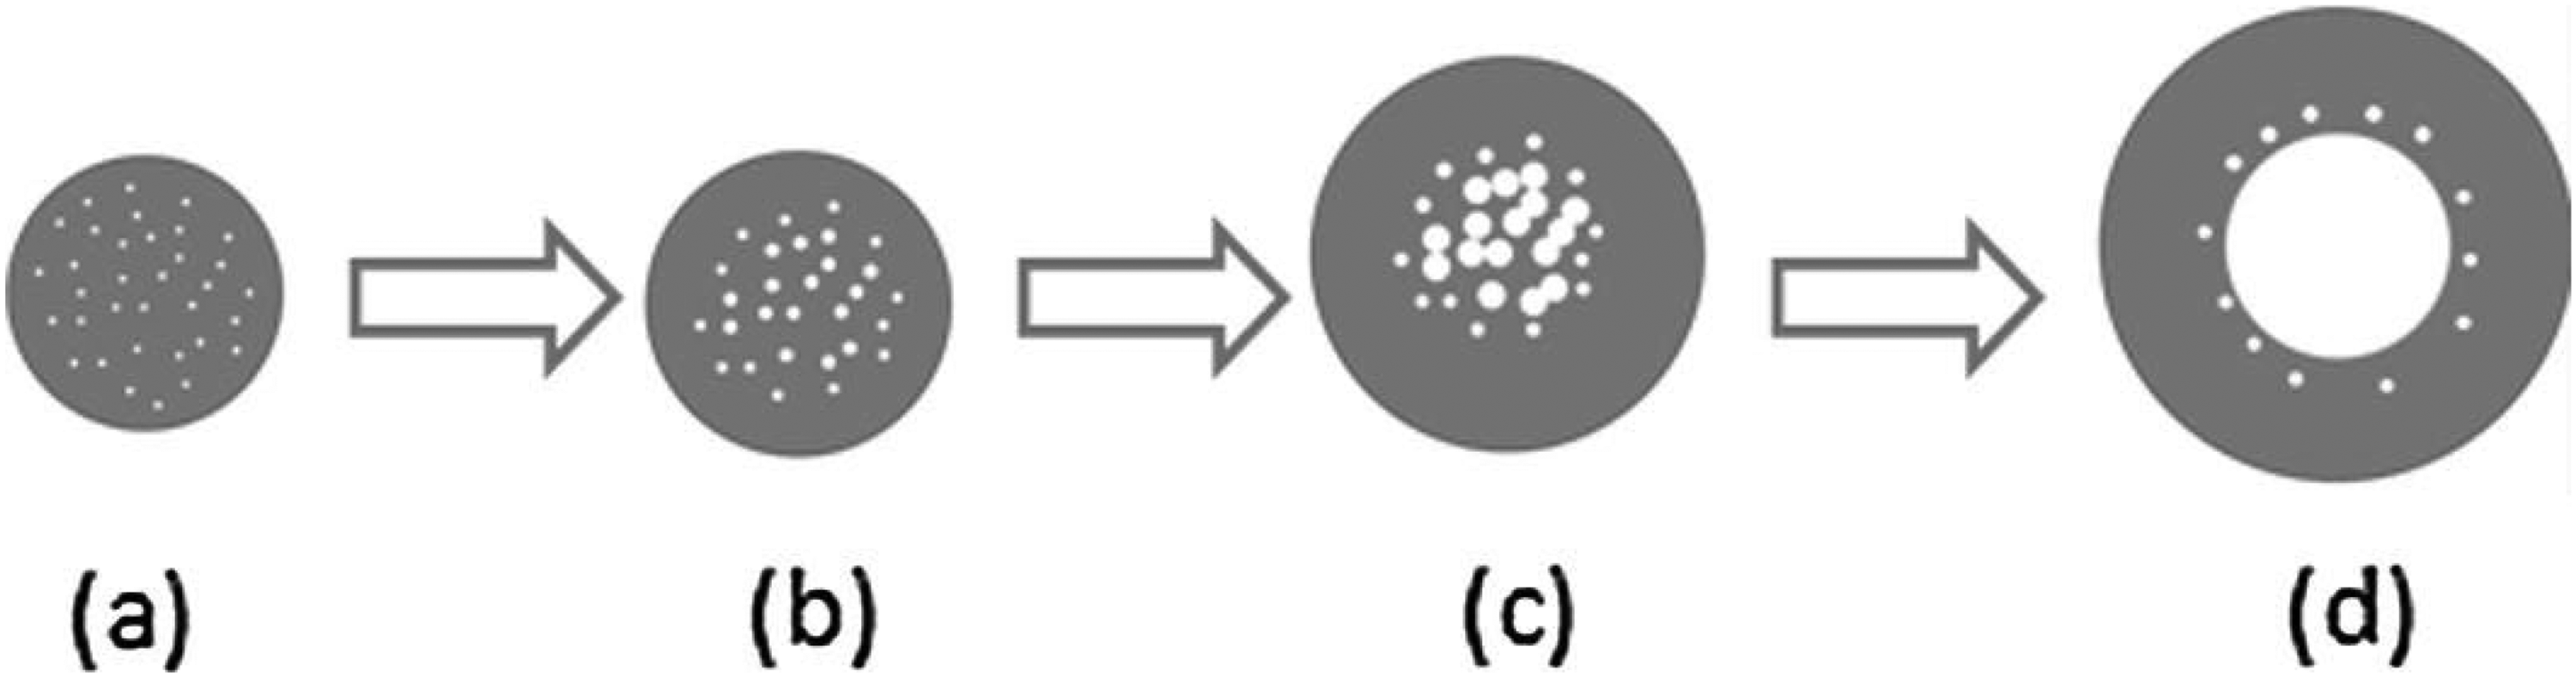
Schematic for the process of coal particle swelling due to expansion and/or contraction of bubbles, as well as coalescence. 10
This study aims to investigate why the quality of metallurgical coke yielded from some single coals exceeds expectations based on measurements of the coal thermoplastic properties, including the standard tests for Gieseler fluidity and dilatation. In particular, the influence of coal particle composition, i.e., the size distribution of particles and the degree of association/distribution of maceral grains within particles on plasticity development in coal particles was systematically investigated. The ultimate aim of this fundamental research work is to better inform the choice of input variables into coke quality prediction models through an enhanced understanding of the drivers of fluidity during cokemaking.
Materials and methods
Selected coal properties
Herein, we present results for two pairs of metallurgical coals: Coal A is a medium rank, medium vitrinite content coal with high fluidity and dilatation, and a wide plastic temperature range of 80 °C (Table 1). Coal C is also a medium rank, medium vitrinite coal. However, the measured thermoplastic properties of this coal are significantly lower than for those of coal A (the maximum fluidity for coal C is 15 ddpm whilst coal A reports 852 ddpm, and the maximum dilatation for Coal C is 22% whilst coal A reports 100% dilatation).
Properties of the coals used in this study, and corresponding coke quality.
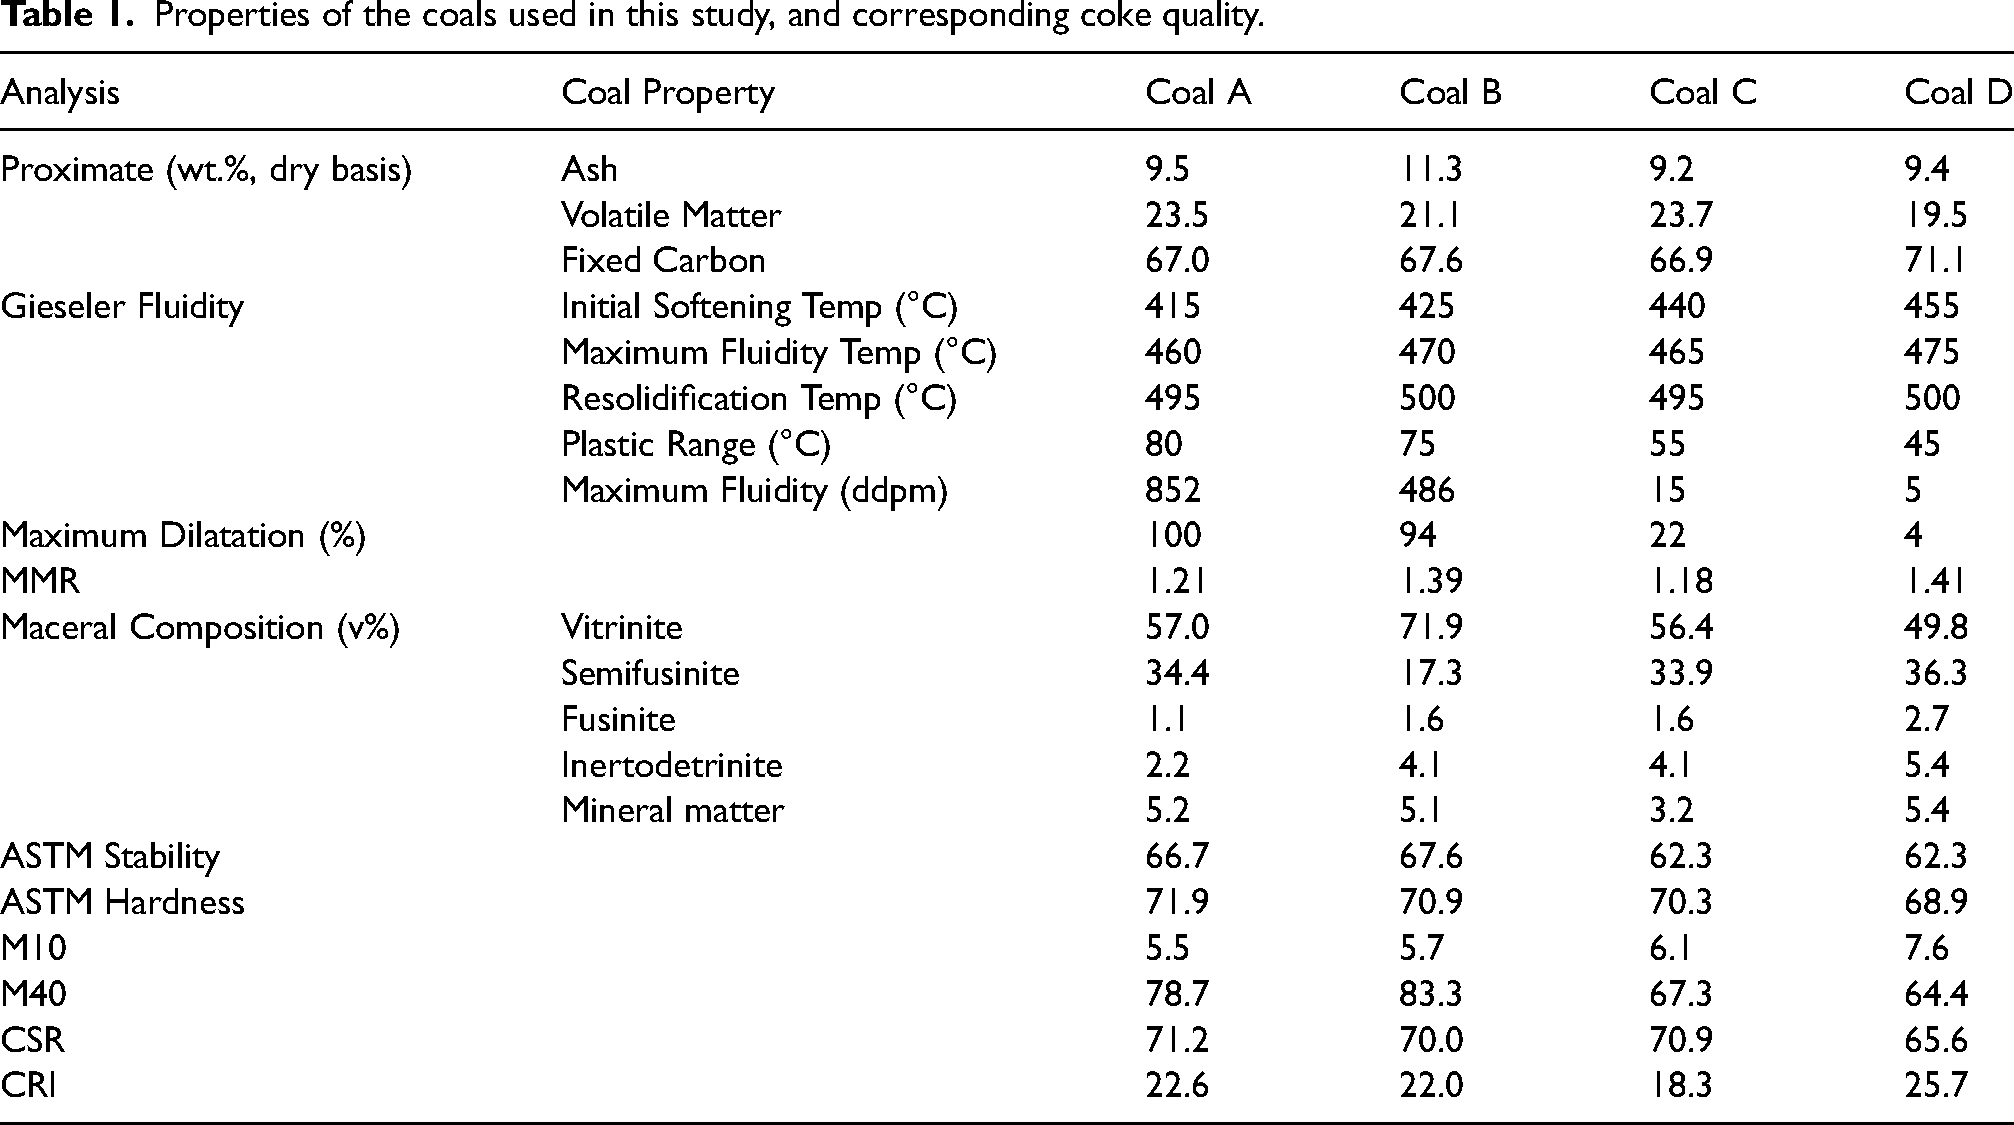
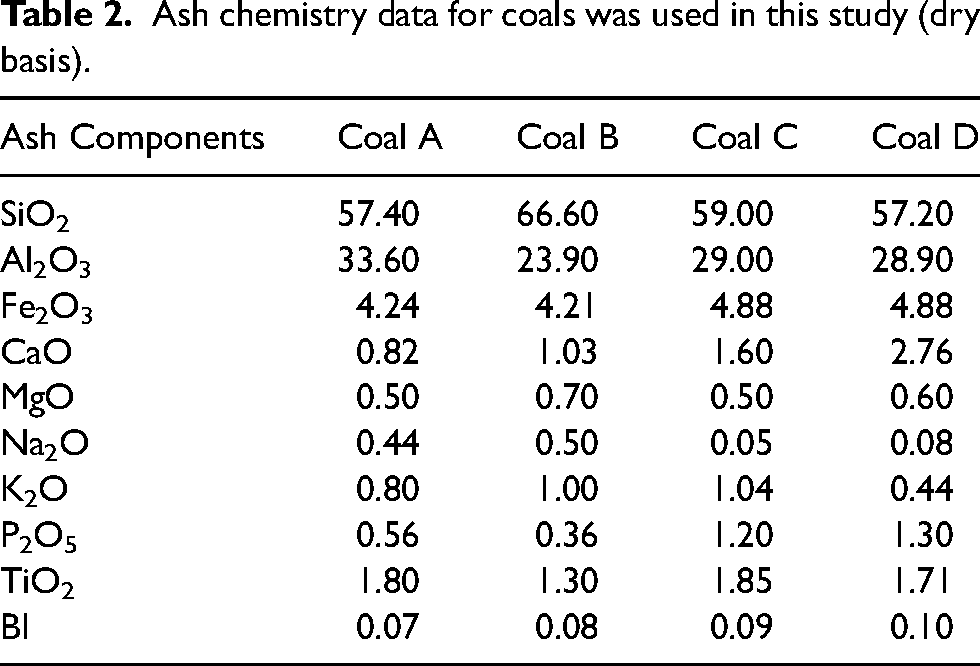
However, the cokes are of similar quality, as shown by their similar CSR indices albeit with some variations in Micum indices (Table 1). High rank coals B and D show similar disparities in thermoplastic properties but still fairly comparable coke CSRs to those of the medium rank parent coals, despite different maceral compositions. Ash chemistry data for all coals are presented below in Table 2. The basicity index (BI) was calculated from the ash chemistry analysis data using the following Eq (1).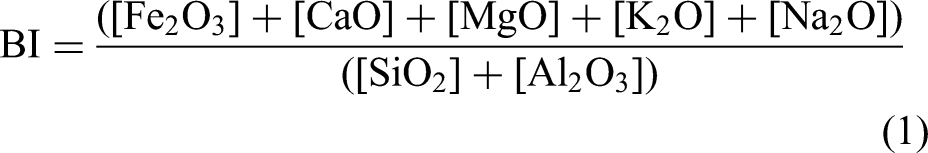
Ash chemistry data for coals was used in this study (dry basis).
Plastic layer permeability and dilatation
Thermoplastic permeability and dilatation behaviour were measured simultaneously for each coal sample using a permeability/dilatation testing apparatus developed at the University of Newcastle (UoN). 11 Figure 2 shows a schematic of the permeability/dilatation apparatus, consisting of three probes that measure permeability (probe 1), temperature (probe 2) and dilatation (probe 3). In probes 1 and 2, a coal sample is charged and packed between two wire meshes and perforated plates in the confined sample cell to restrict expansion during heating. The dimensions of the coal sample charge measure 10.5 mm in diameter and 10.5 mm in height. A key feature of the permeability/dilatation rig is that samples are tested at coke oven particle feed size (−3.35 mm). This is a significant point of difference between conventional dilatometer and Gieseler laboratory testing, which utilise a finely crushed particle size (−0.212 and −0.4 mm, respectively).
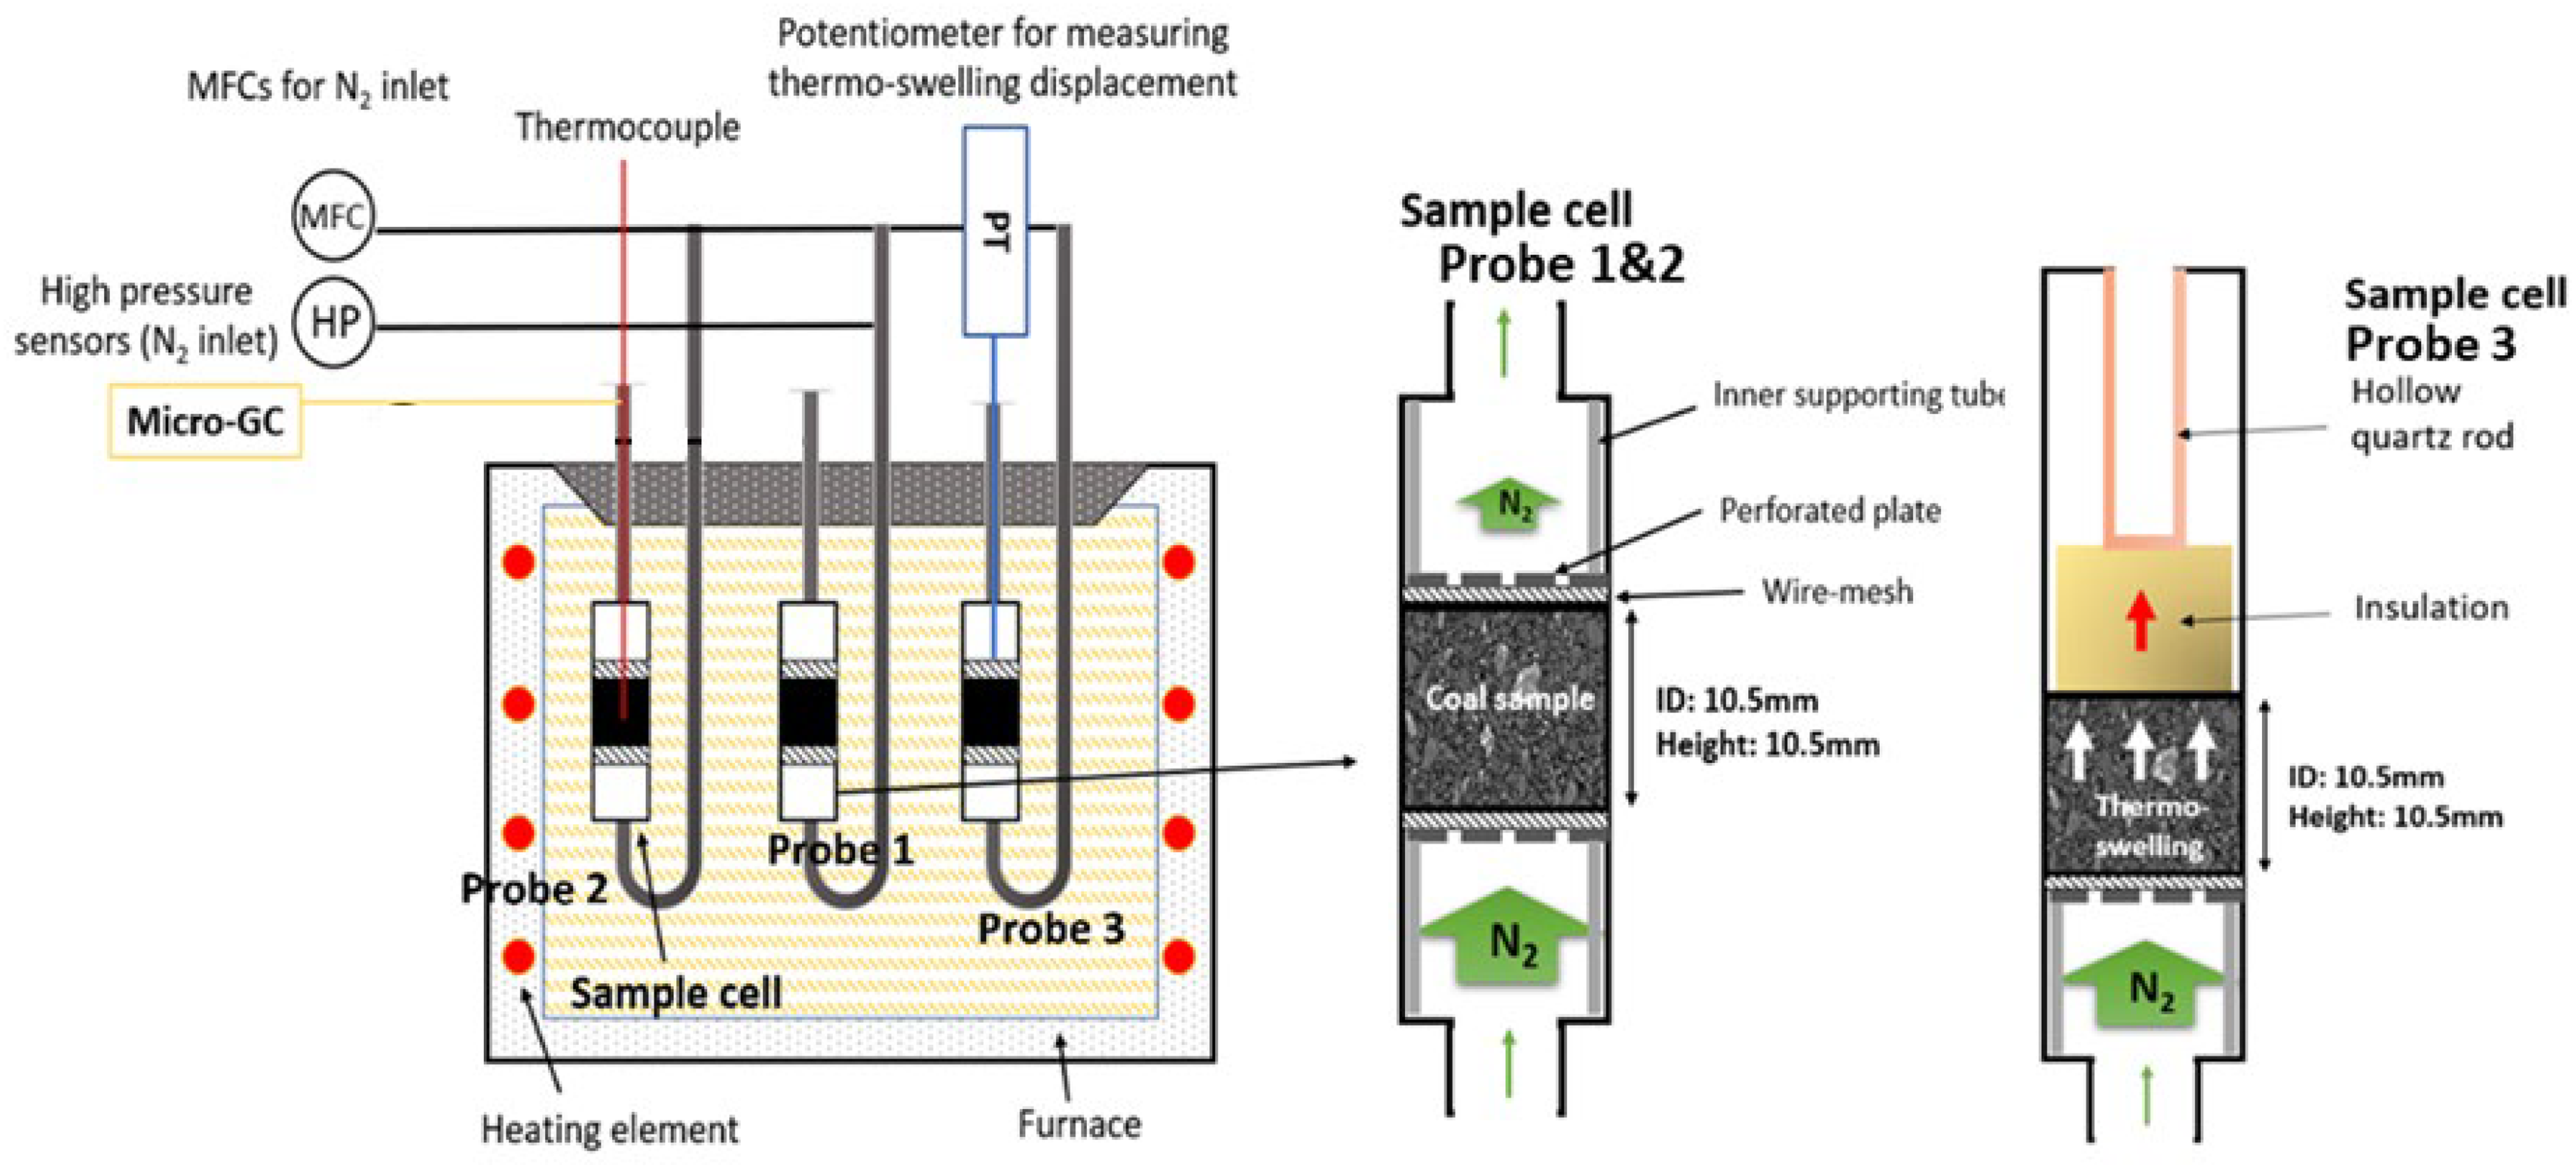
Schematic of the permeability/dilatation rig at the UON (left) and the sample cells for the permeability/temperature (probes 1 & 2) and dilatation (probe 3) measurements (right).
A controlled charging density of 815 kg/m3 was applied for each coal sample with measured moisture contents of ∼5 wt.%. The sample was heated to 300 ˚C at a rate of 10 ˚C /min and then to 700 ˚C at 3 ˚C /min. For the permeability measurement, a 100 ml/min nitrogen flow was induced through the sample. A pressure transducer installed at the nitrogen inlet monitored the back pressure generated during the thermoplastic transformation, which was converted to permeability using Darcy's law (Eq. 2):
In probe 2, a thermocouple was inserted into the middle of the coal bed to measure the temperature profile during heating. The thermoswelling displacement of the sample during the thermoplastic stage was measured in probe 3 using a potentiometer connected to a quartz rod. The probes are designed such that a negligible temperature gradient exists through the samples in each test. This allows for samples to undergo a uniform thermoplastic transformation, thus negating the effects of plastic layer migration from the test results.
Rheological testing
The rheological properties of the coal samples were tested at the University of Queensland (UQ) to investigate their viscoelastic properties in the thermoplastic phase. 12 For each sample, two tests were conducted: (1) samples crushed to 100–300 µm, and (2) coal at coke oven feed size (−3.35 mm). For each rheometry test, the sample was pressed into a 25 mm diameter pellet under 15 t force for 30 s using a hydraulic press. The pellet was immediately loaded into the rheometer (AR2000ex, TA instruments) under a steady nitrogen flow rate of 10 mL/min to sweep volatiles away. The AR2000ex has a parallel plate measuring system whereby the sample is placed between two round 25 mm diameter plates and parameters such as the plate gap and the normal force load can be controlled. Each sample was heated at 20˚C/min up to 200 ˚C followed by 3˚C/min up to 525 ˚C before being allowed to cool down to room temperature. The rheometer applied an oscillatory strain of 0.1% at a frequency of 1 Hz, and measured the stress response under a constant applied normal force of 5 N. The rheometer provides a measurement of sample viscosity as a function of temperature.
Microstructural characterization of the thermoplastic layer
Plastic layer samples were prepared using the unique fast sampling capability of the UoN's custom-designed dual-heated 4 kg coke oven under a thermal gradient condition. Figure 3 shows a schematic of the plastic layer sampling probe. Five thermocouples installed at 0, 25, 50, 75, and 100 mm from the heating wall measured temperature across the plastic layer sample. Coal samples with a particle top size of 3.35 mm were packed into a quartz sample tube at a controlled density of 815 kg/m3 and inserted into the heating side of the coke reactor.
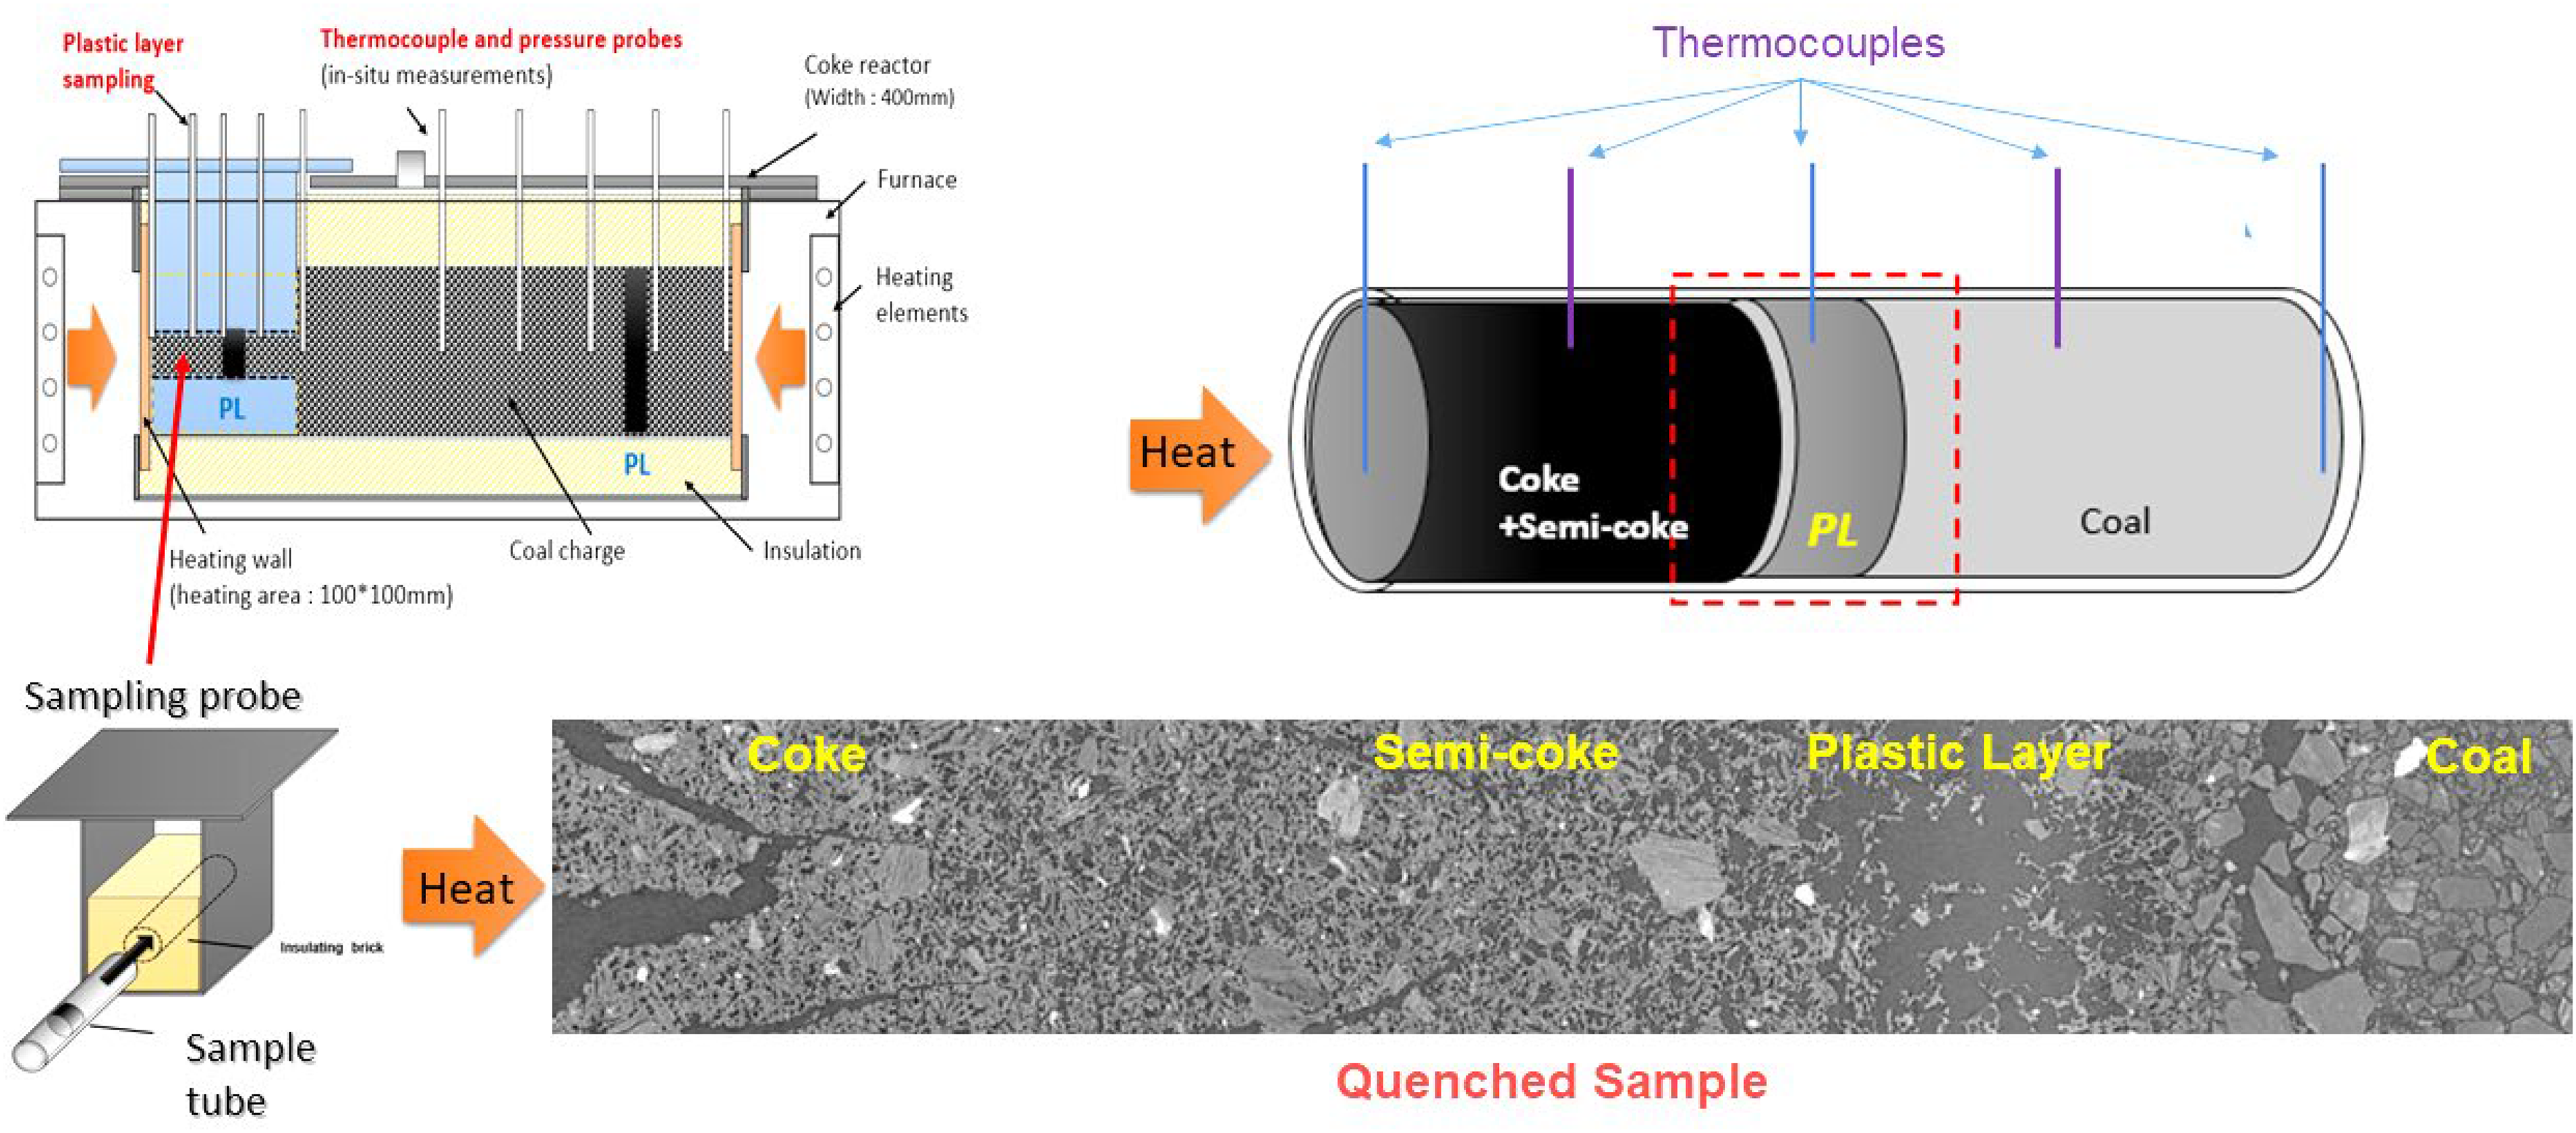
Schematic of the plastic layer sampling methodology carried out in the 4 kg lab-scale dual-heated coke oven with thermocouples embedded in the sample tube at various locations.
The reactor was heated to 1100 °C at a rate of 10 °C/min and dwelled at 1100 °C to the point where the thermocouple inserted 75 mm from the heating wall reached 400 °C. At this point, the sampling probe was removed and quenched with nitrogen gas in an inbuilt quenching chamber. The maximum temperatures recorded at each point in the sample tube were used to plot the temperature profiles for correlation with micro-CT images. CT imaging was conducted at the Imaging and Medical Beamline (IMBL) of the Australian Synchrotron in Melbourne.
3D images of the plastic layer microstructures were obtained and analysed using the GeoDict software to compile and treat the original micro-CT images received from the Australian Synchrotron. CT images were imported to GeoDict and horizontally stitched to create segmented 3D microstructures. The constructed 3D images were used to identify the onset of coal softening, the location of the intermediate plastic layer (area of highest relative porosity), and the point of resolidification. The softening and resolidification temperatures based on the CT image analysis were obtained by correlation with the measured temperature profiles. The measured plastic ranges were then compared with those from Gieseler testing.
Coal grain analysis
Individual coal particles are typically a mix of different macerals and mineral “grains”, the distribution of which within particles influences the physical bonding mechanism of reactive and inert components and volatile retention. As such, the determination of the discrete constituent grains of coal particles is vital to understanding the development of bulk coal fluidity and particle dilatation.
Coal grain analysis (CGA) testing was conducted at CSIRO Queensland Centre for Advanced Technology (QCAT), using the optical reflected light imaging CGA system, which provides compositional information on individual coal particles. 13 Samples were manually fractioned into −1.0 mm and 1.0–3.35 mm sizes. CGA testing provides the following information: (i) Grain size distribution of macerals and minerals with mapping images; (ii) Maceral and mineral compositional information to understand the degree of association; (iii) Distribution of grain types, e.g., the proportion of vitrinite grains in coal particles (pure vitrinite, vitrinite dominant, vitrinite rich, etc.).
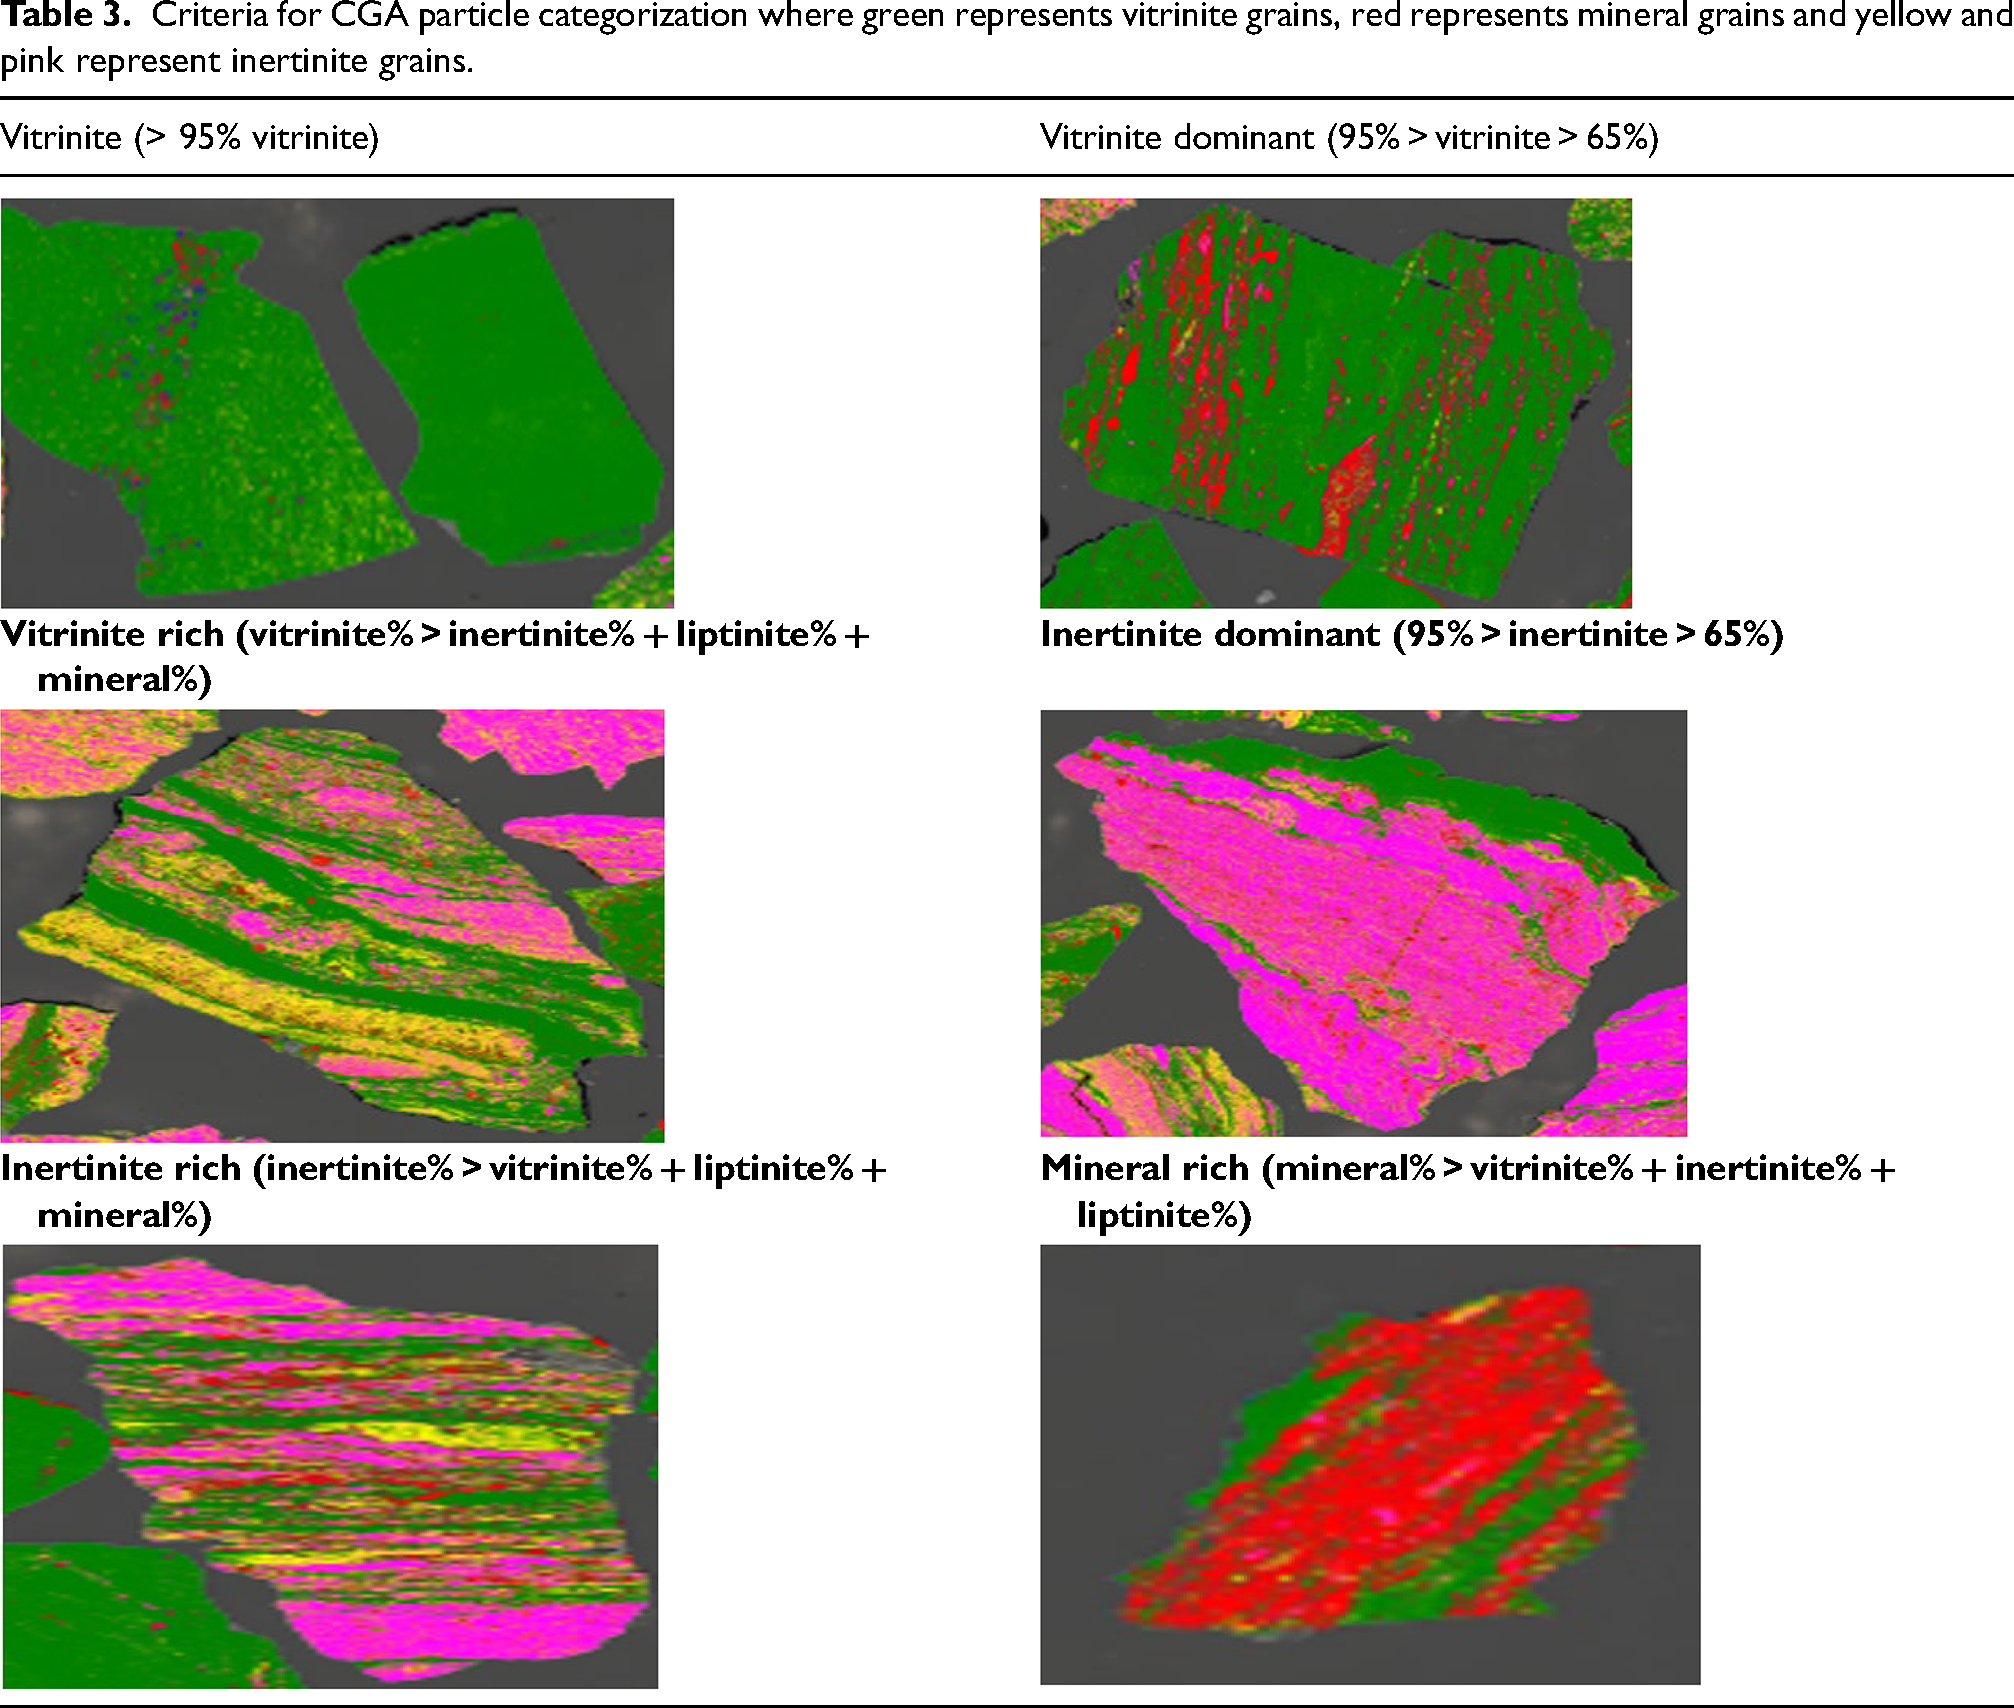
Table 3 shows examples of colour-mapped particle grains with particles characterized into different groups based on their maceral and mineral compositions. In the case of > 95% vitrinite particles, a very low association/distribution of maceral grains is observed. However, in the case of vitrinite rich and inertinite rich particles, a significant degree of association can be observed. This is important to consider in regard to fluidity development as volatile evacuation from particles is facilitated by high degrees of maceral association wherein inertinite grains serve as conduits for gas escape and hence hinder particle swelling. This analysis may prove more indicative of the real coking potential of some coals which report unexpected thermoplastic behaviour based on their petrographic properties.
Criteria for CGA particle categorization where green represents vitrinite grains, red represents mineral grains and yellow and pink represent inertinite grains.
Internal gas pressure (IGP) generation under coking conditions
The internal gas pressure (IGP) generated in the thermoplastic layer of each coal sample was measured in the UoN's 4 kg coke oven under a thermal gradient condition (Figure 4). 11 The 420 mm wide coke oven simulates the coking conditions in industrial slot ovens. The plastic layers form in the vicinity of the heating walls and transition to the centre of the coal charge. Four probes installed at 50, 100, 150, and 210 mm (centre) from the reactor heating wall measure the temperature and IGP generated across the coal charge. Samples with a particle top size of 3.35 mm were packed at a controlled 815 kg/m³ charging density in the reactor. Two additional thermocouples were inserted close to the heating wall to measure the wall temperature. The reactor was then heated to 1100 ˚C at a rate of 10 ˚C /min and dwelled at 1100 ˚C to the point where the IGP measured at the centre (210 mm) returned to the baseline pressure. The typical total coking time for the completion of these tests was 8–9 h.
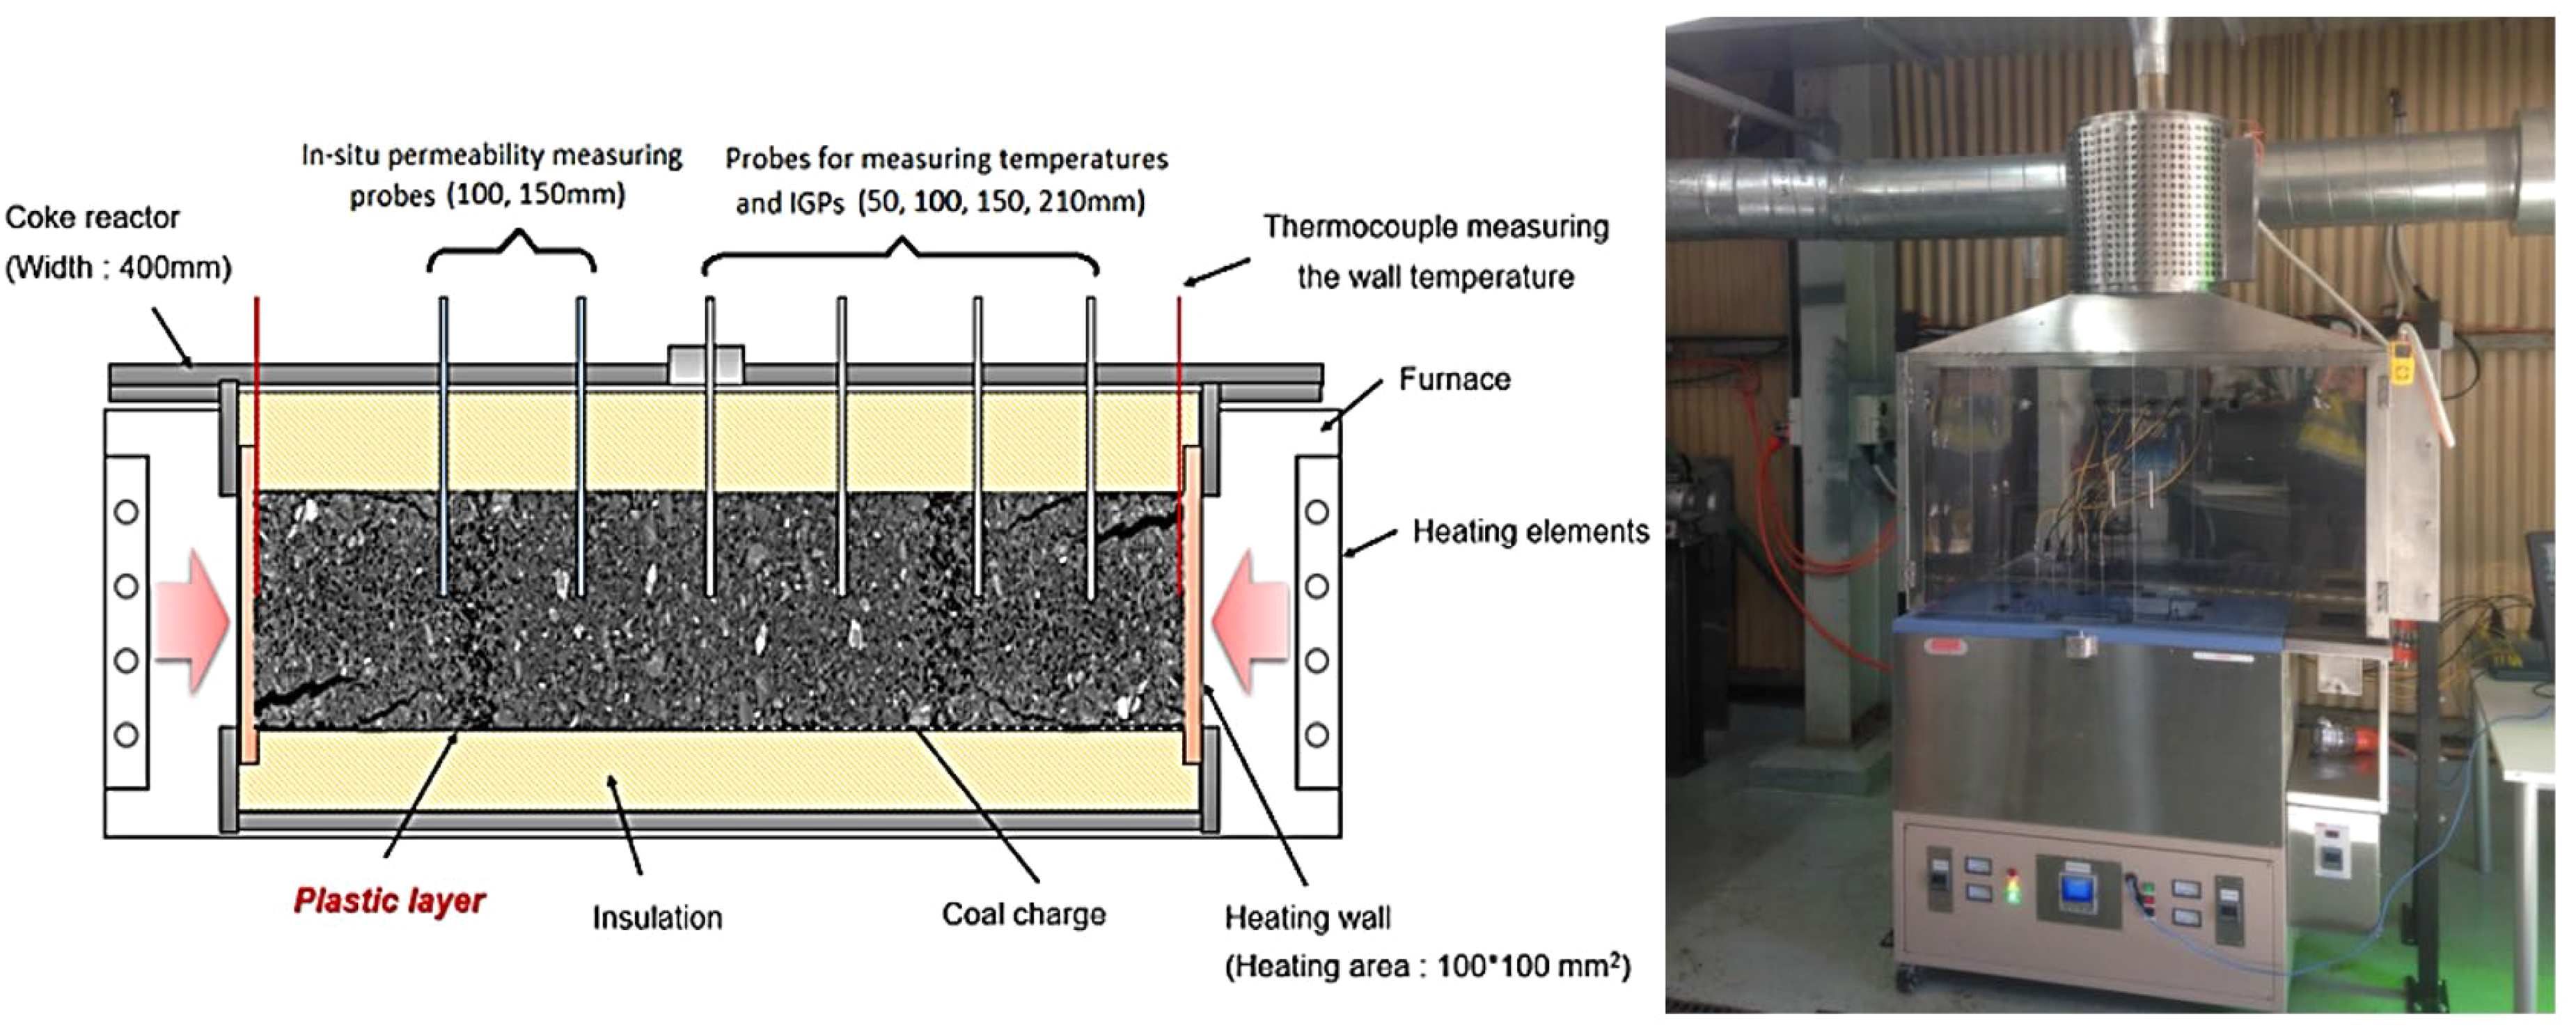
Schematic of the 4 kg dual-heated coke oven at the UoN fitted with IGP probes.
Results and discussion
Plastic layer permeability and dilatation behaviour
Figure 5 shows the permeability and dilatation results of the sample coals. Coals C and D demonstrate higher plastic layer permeability than coals A and B, the onset of which occurs at higher temperatures. Comparing coals B and D of similar ranks, the significantly higher vitrinite content in B facilitates the formation of a low permeable plastic layer, which is understood to improve the bonding between inert-maceral derived components (IMDC) and reactive-maceral derived components (RMDC) in coke.
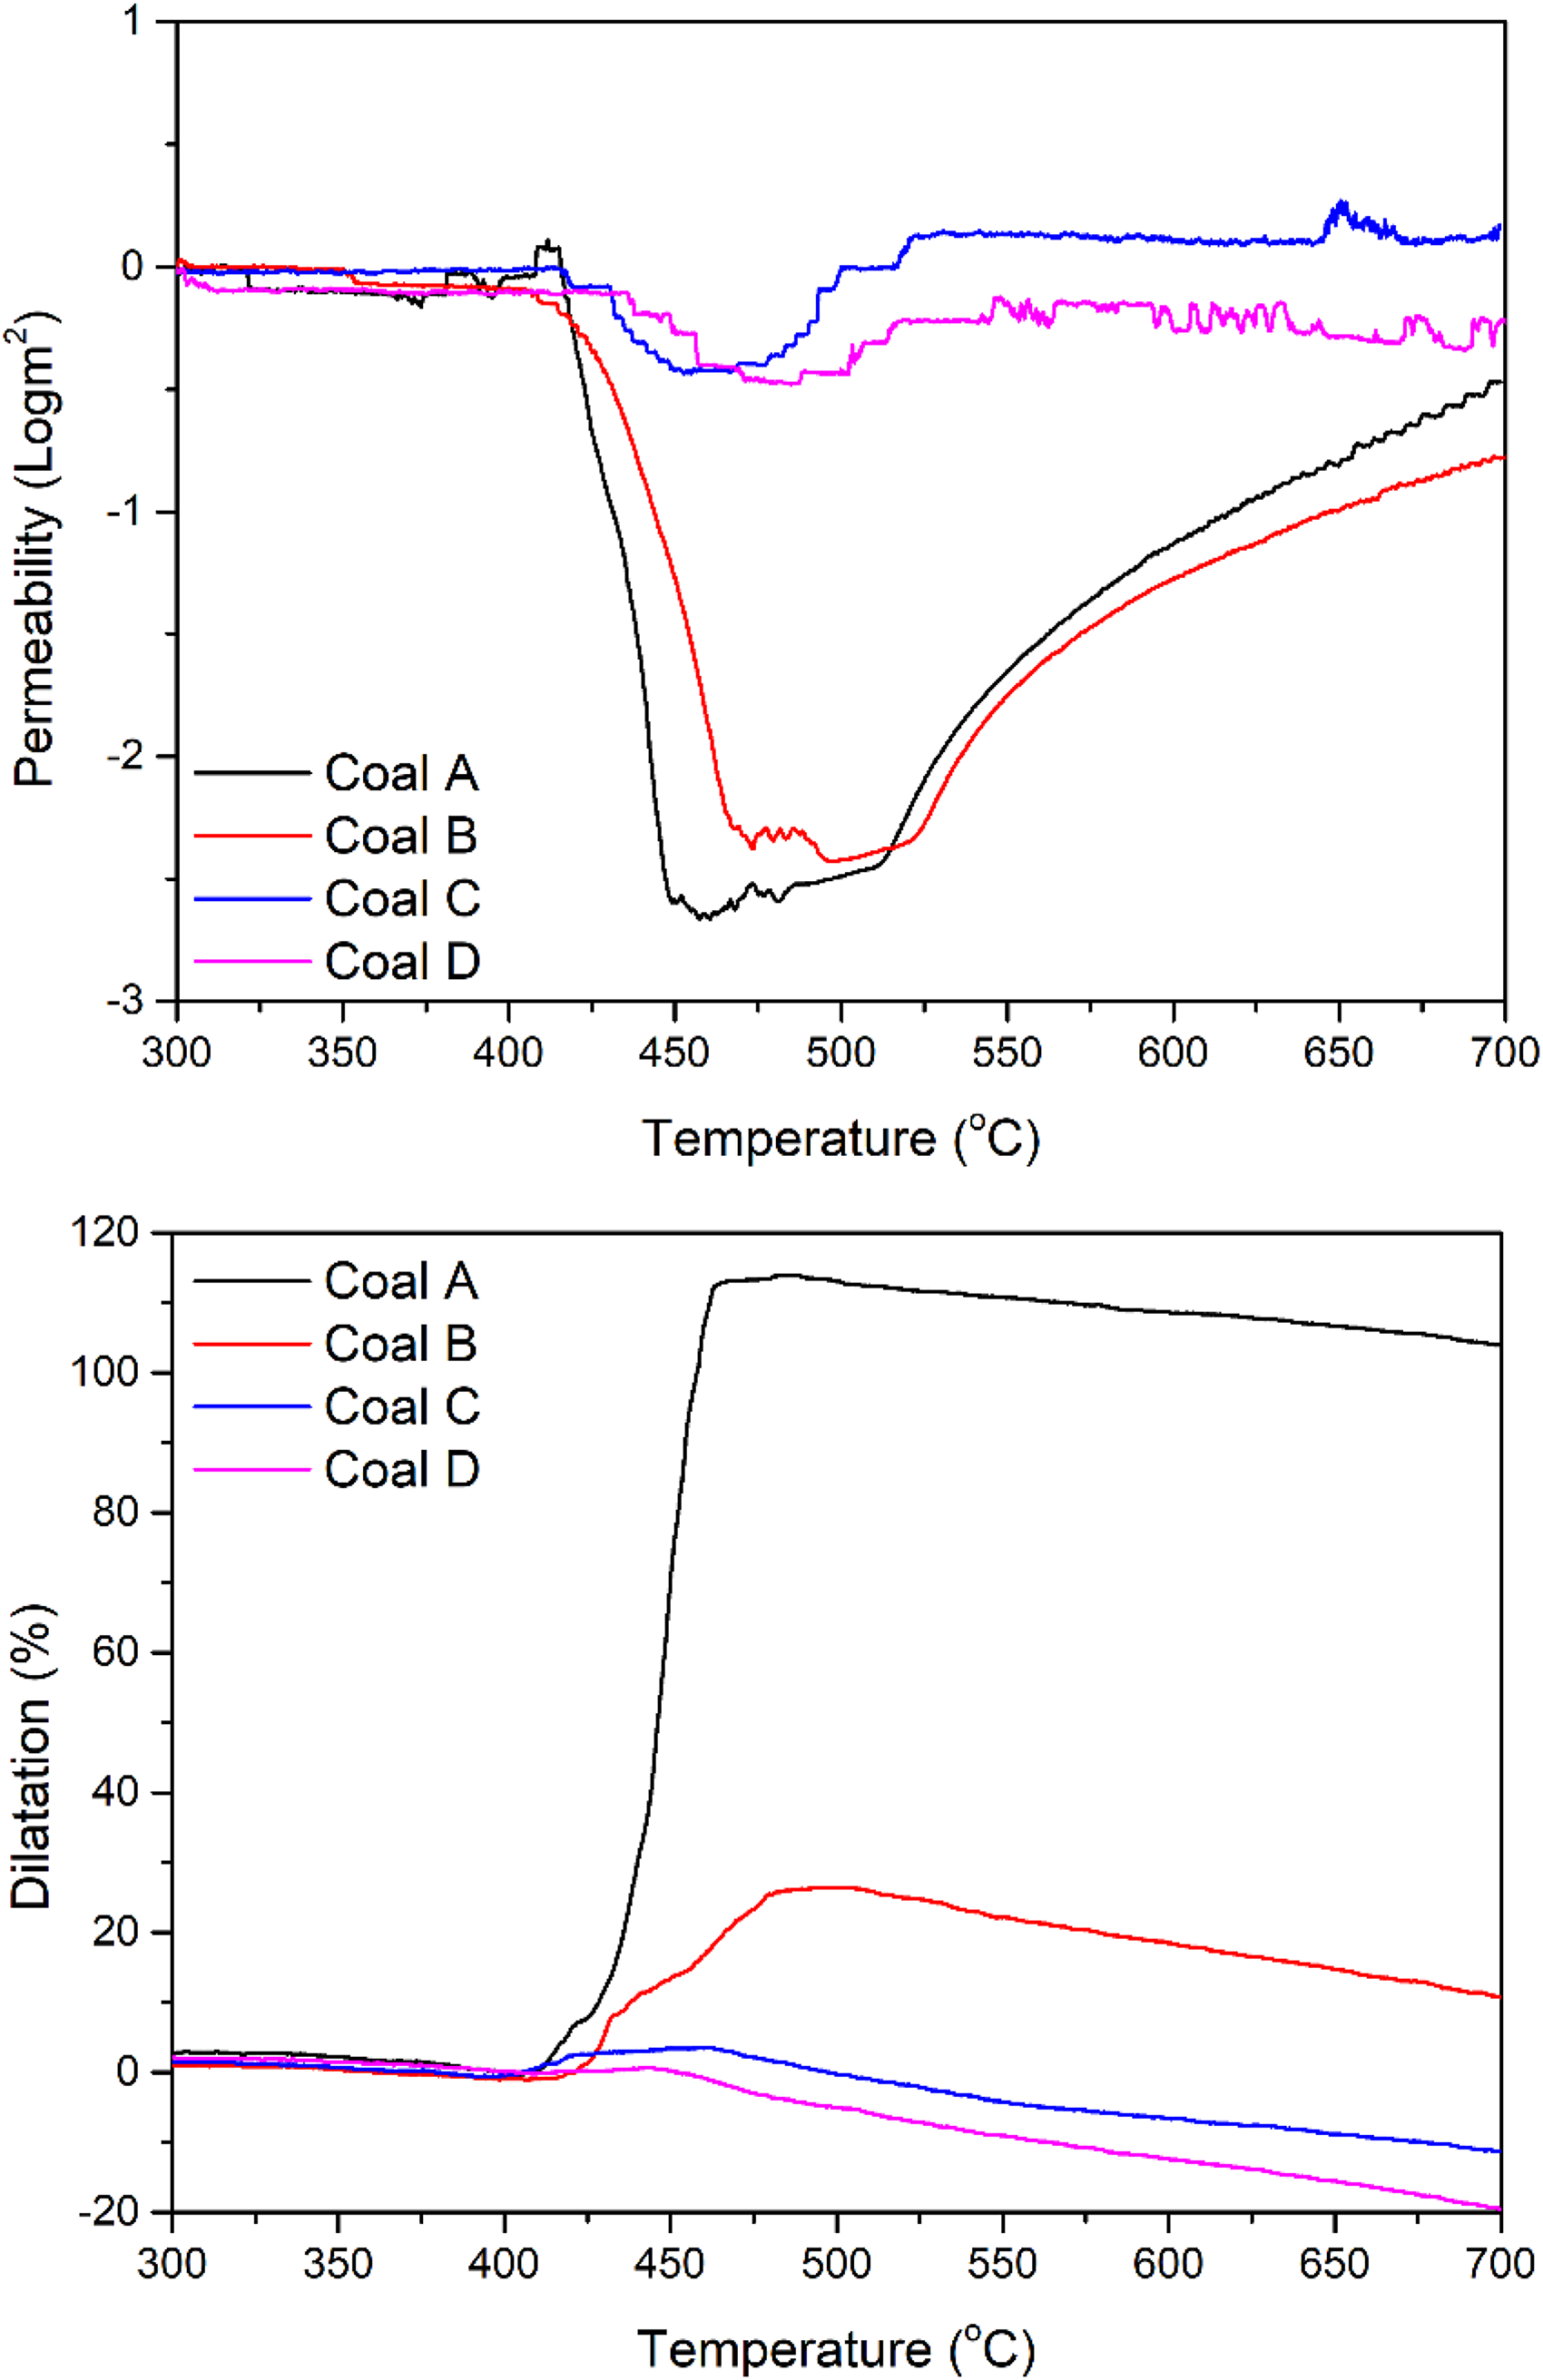
Changes in plastic layer permeability (top) and dilatation (bottom) of the coal samples as a function of temperature.
However, upon the comparison of coals A and C, of similar ranks but also very similar petrographic properties, dissimilar thermoplastic behaviours were again observed. Coal A exhibited significantly higher dilatation and lower permeability than reported for coal C. These observations suggest that conventional coal property and fluidity measures are insufficient in describing the performance of these coals.
Rheological behaviour of coal samples
Figure 6 shows the rheological analysis results of the coals at coke oven feed size (−3.35 mm) and pulverised testing size (100–300 µm). Three important observations were made: (1) All samples at coke oven feed size softened at a lower temperature; (2) Samples at coke oven feed size showed a wider temperature range of thermoplasticity; (3) The coke oven feed size samples reached a lower viscosity than did the crushed samples.
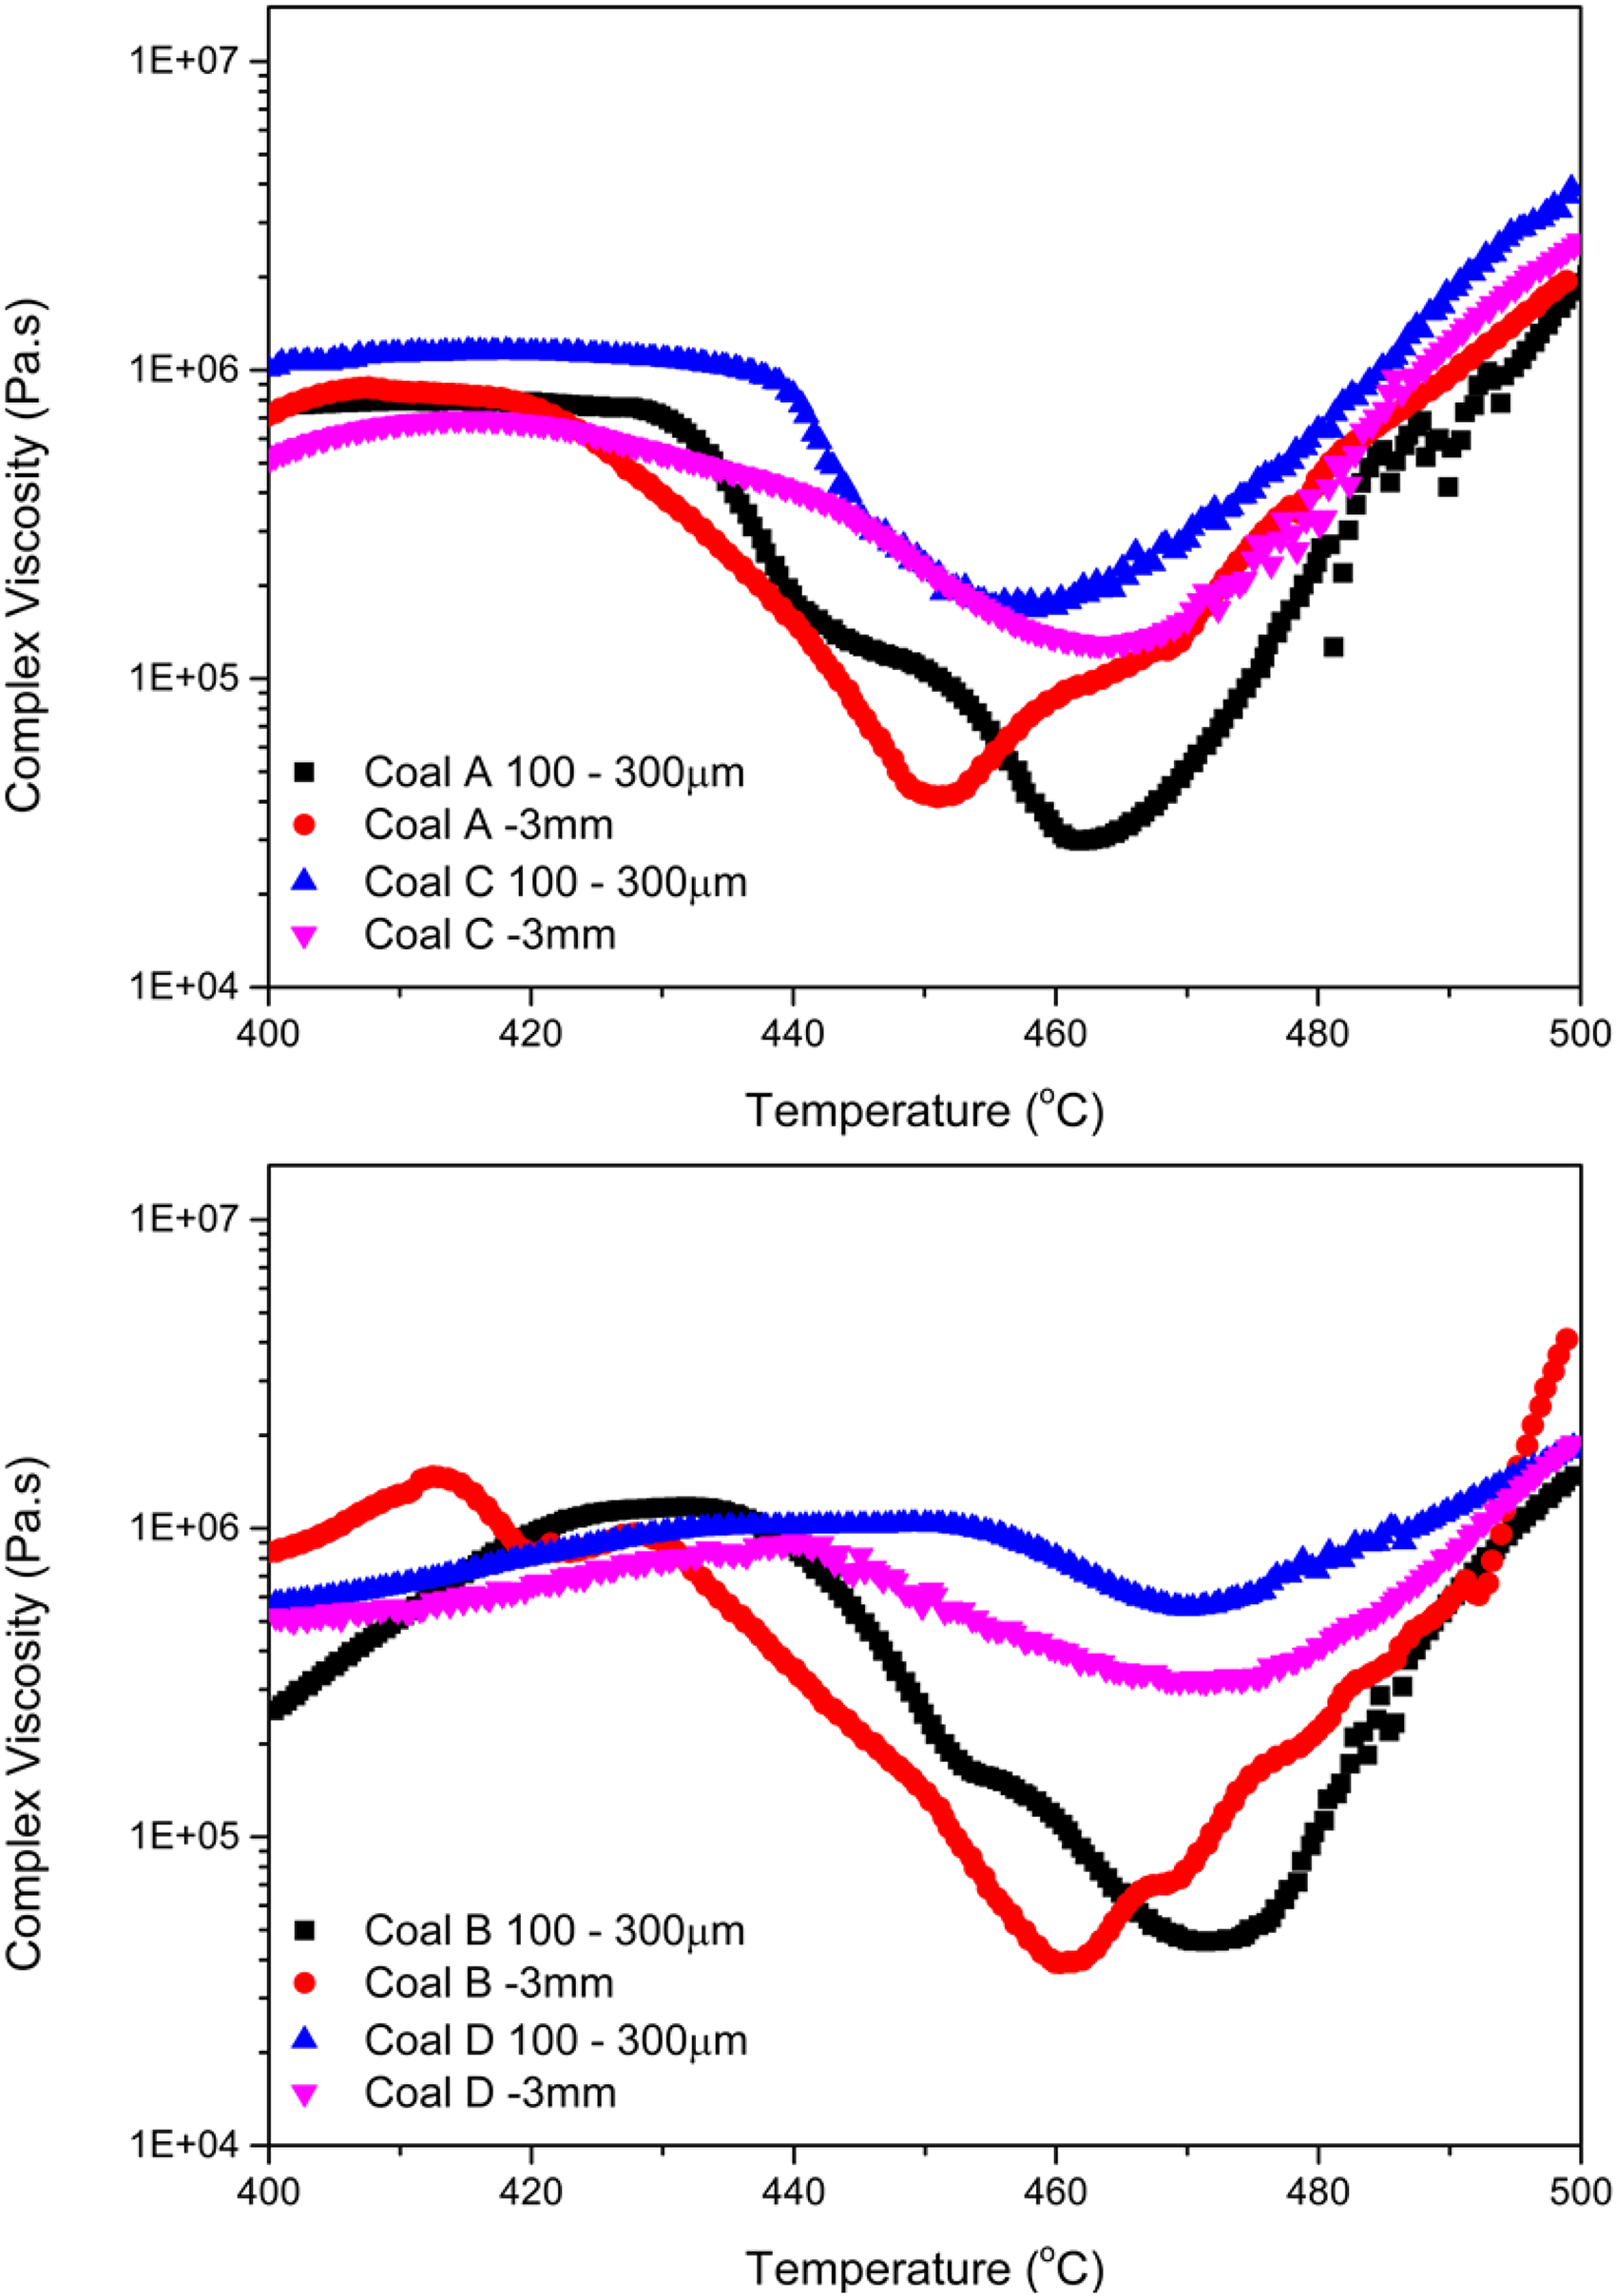
Complex viscosity as a function of temperature for coal sample pairs A & C (top) and B & D (bottom) in particle sizes of −3 mm and 100–300 µm.
These results further highlight the governing influence of particle size on coal thermoplasticity. This effect is explained by the model proposed by Jenkins and Mahoney. 10 For particle dilatation to occur, bubble formation within the particle, transfer of evolved volatiles to bubbles, and entrapment of bubbles within the particle are necessary. For larger (fusible) particles, the expulsion of volatiles is more inhibited. If volatiles cannot be released, liquids are unable to vaporise and begin to accumulate, causing decreases in both the softening temperature (ST) and the minimum viscosity achieved. On the other hand, in the presence of preferred escape paths (e.g., composite particles) volatiles can escape from the softening particle, restricting the amount of gas available for bubble expansion. 12
Coals A and B achieved a minimum viscosity between 104–105 Pa.s, indicating a strong coking potential. Coal D did not generate much liquid material, relative to the other samples considered, with a high minimum viscosity of 5 ×10⁵ Pa.s, suggesting a weak coking potential. The mechanism of liquid generation - as described above - suggests that for coals that do not generate considerable fluidity, the particle size should be kept large. For coal C, the minimum viscosity reached 1.7 ×10⁵ Pa.s. This coal would be expected to make a good coke; however, adhesion may be less than that for coal A which reached a lower viscosity.
Most standard tests on coal such as the Gieseler plastometer and dilatometer stipulate a required particle size range (−0.4 mm) to negate particle size effects and allow for better comparisons between different coals. However, the results presented here suggest that the typical particle size range utilized for Gieseler testing may not serve to capture an accurate representation of coal thermoplastic behaviour under practical coking conditions. This may partially explain the disparity between the measured coke quality indices and those expected based on the coal thermoplastic properties reported by the standard fluidity measures.
Microstructural analysis of plastic layer
Microstructural analysis of the thermoplastic region of coal samples allows for visual representation of the thermoplastic region and calculation of the size distribution of bubbles generated therein. Five segmentations were made in each sample corresponding to (a) particulate coal, (b) softening layer, (c) intermediate plastic layer, (d) early resolidification layer, and (e) later semi-coke layer, which were individually analysed for their porous structure using GeoDict.
It should be noted that porosity data for the particulate and initial softening segments largely represent voids between coal particles rather than formed pores. Figure 7 compares the cross-sectional CT images of coals A and C. As discussed previously, these coals are similar in rank, volatile content, and maceral compositions, but vary significantly in their thermoplastic properties. For coal A, the plastic range measured by Gieseler testing accords with the CT analysis results. However, in the case of coal C, while the softening temperatures (ST) from Gieseler and CT analysis were in agreement, the CT analysis showed that the resolidification temperature (RT) of coal C is 25 °C higher than that measured by Gieseler. Similar observations were also made for coal D.
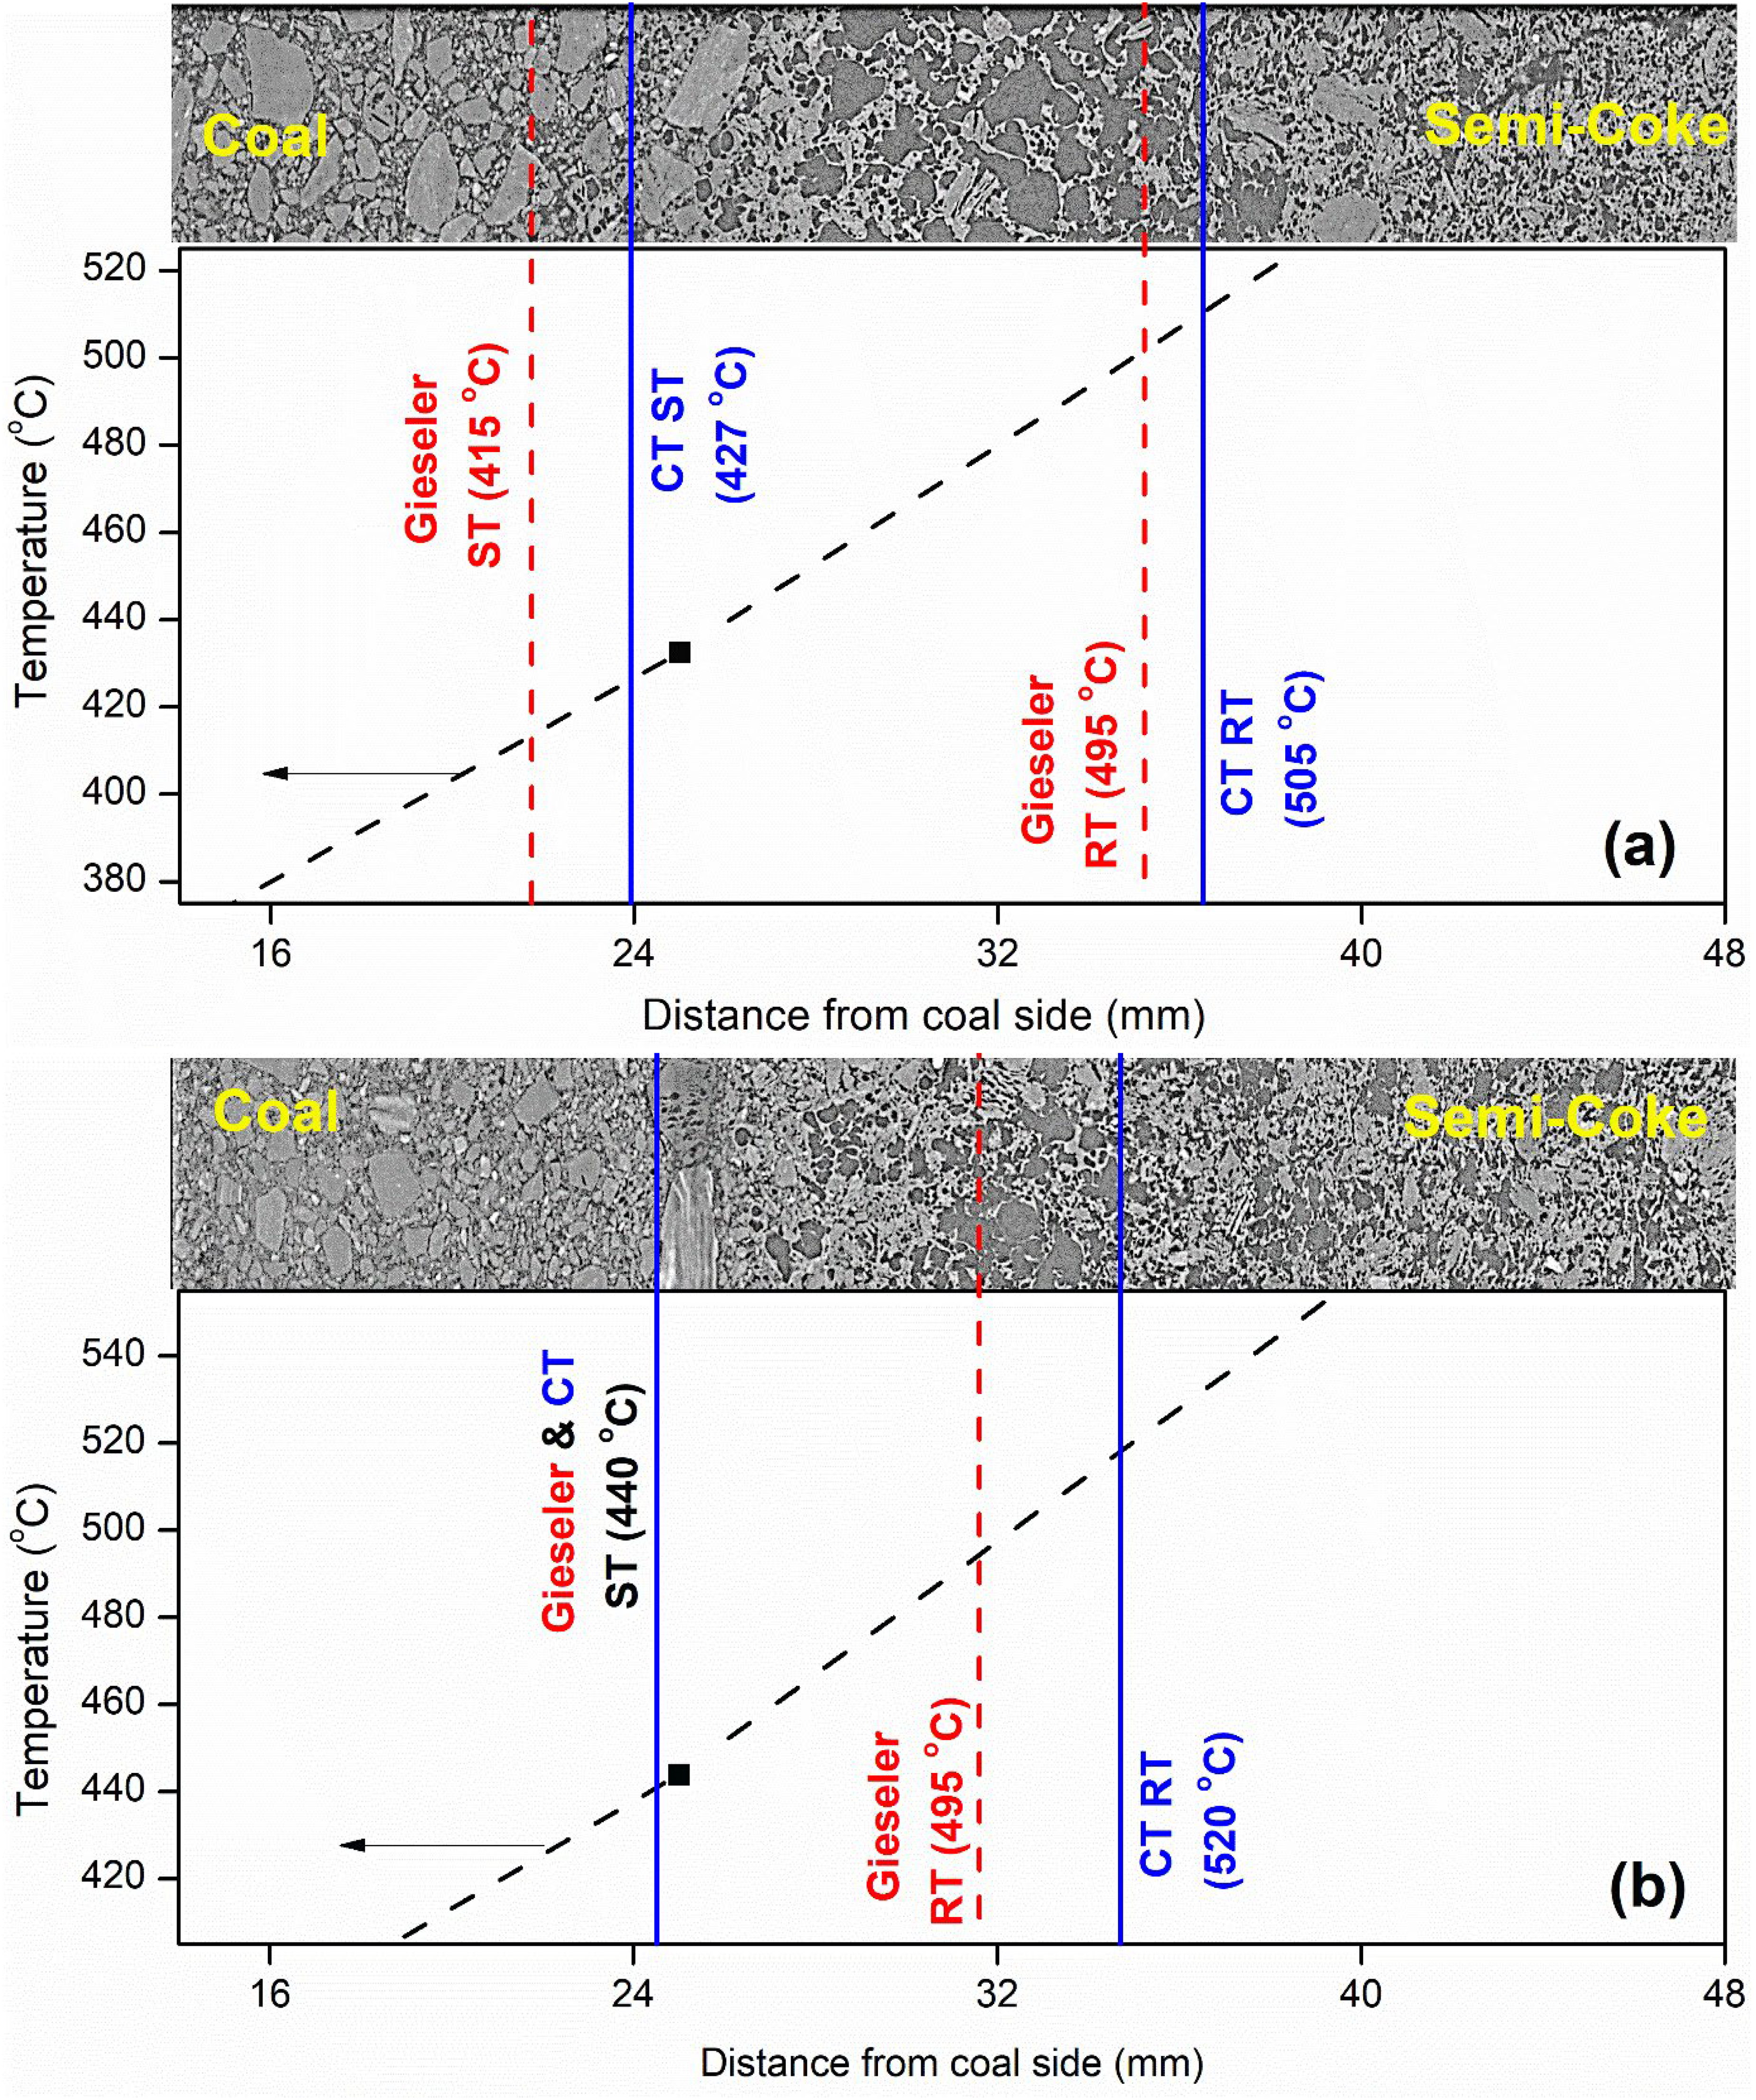
Cross-sectional micro-CT images of segmented plastic layers for (a) Coal A and (b) Coal C, correlated with their respective temperature profiles.
The temperature ranges of thermoplasticity, as determined by Gieseler and micro-CT images, as well as the inertinite content of each sample are summarised in Table 4. Visual inspection of coal D's micro-CT images was challenging due to the large amount of inertinite present in the samples. Coals C and D showed a significant difference in the thermoplastic ranges reported by Gieseler plastometer testing and deduced by micro-CT analysis (17–25 °C), indicating that the real plastic range for these coals was wider than that reported by Gieseler and that Gieseler plastometer tests failed to capture the “real fluidity” behaviour of coals C and D.
Difference between the plastic range measured by Gieseler plastometer testing and micro-CT analysis.
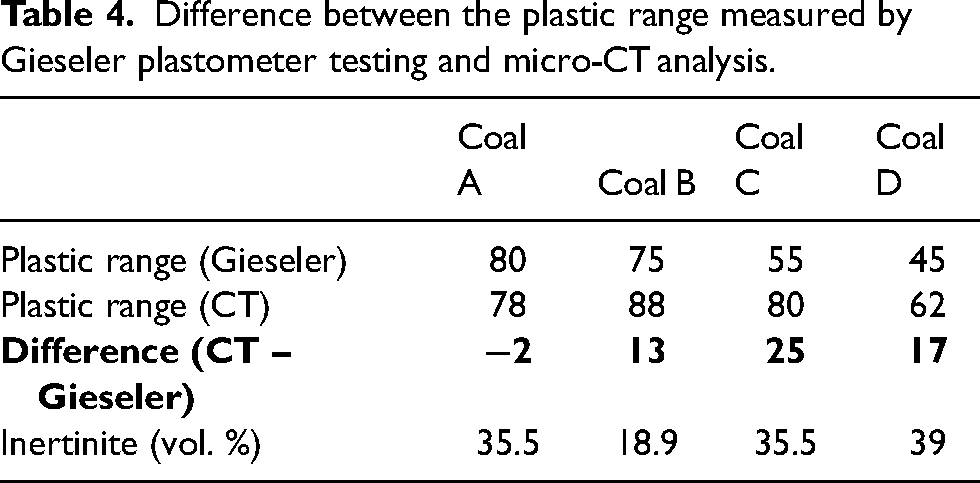
The thermoplastic stage of coal D was obscured by the dominating presence of inertinite, however, rough stages could still be determined through successive porosity analysis of individual micro-CT images and close visual inspection. Coal A had the highest overall porosity of all the samples in the intermediate plastic layer, indicating a relatively high fluidity as corroborated by the Gieseler maximum fluidity results. Coal D, on the other hand, had the lowest porosity in the intermediate plastic layer and as such would be expected to have a relatively low fluidity, as indicated by the Gieseler test results. Changes in overall porosity across the thermoplastic stages of coals C and D were minimal relative to those observed in coals A and B.
Figure 8 compares the size distributions of pores confined in each segment representing separate thermoplastic stages in coals A and C. More bubble coalescence and growth occurred in the intermediate plastic layer of coal A while bubble growth in the intermediate plastic layer of coal C appears to be limited. Similar results were obtained for coals B and D (not shown here).
Pore size distribution at different stages of coking for coals A and C.
Analysis of coal particle composition
Coal thermoswelling is the result of bubble formation and growth within particles which expand as gas evolves during carbonisation and is transferred into the bubbles. Particle expansion is only possible if bubbles are entrapped within the particle. 10 Smaller vitrinite particle size, high inertinite content, and a high degree of vitrinite and inert (inertinite and mineral matter) grain distribution within particles provide escape pathways for volatiles, restricting the amount of gas that can contribute to bubble expansion within the softened particle. The removal of gases from the system also increases the viscosity of the melt and can contribute to low Gieseler fluidity measurements.
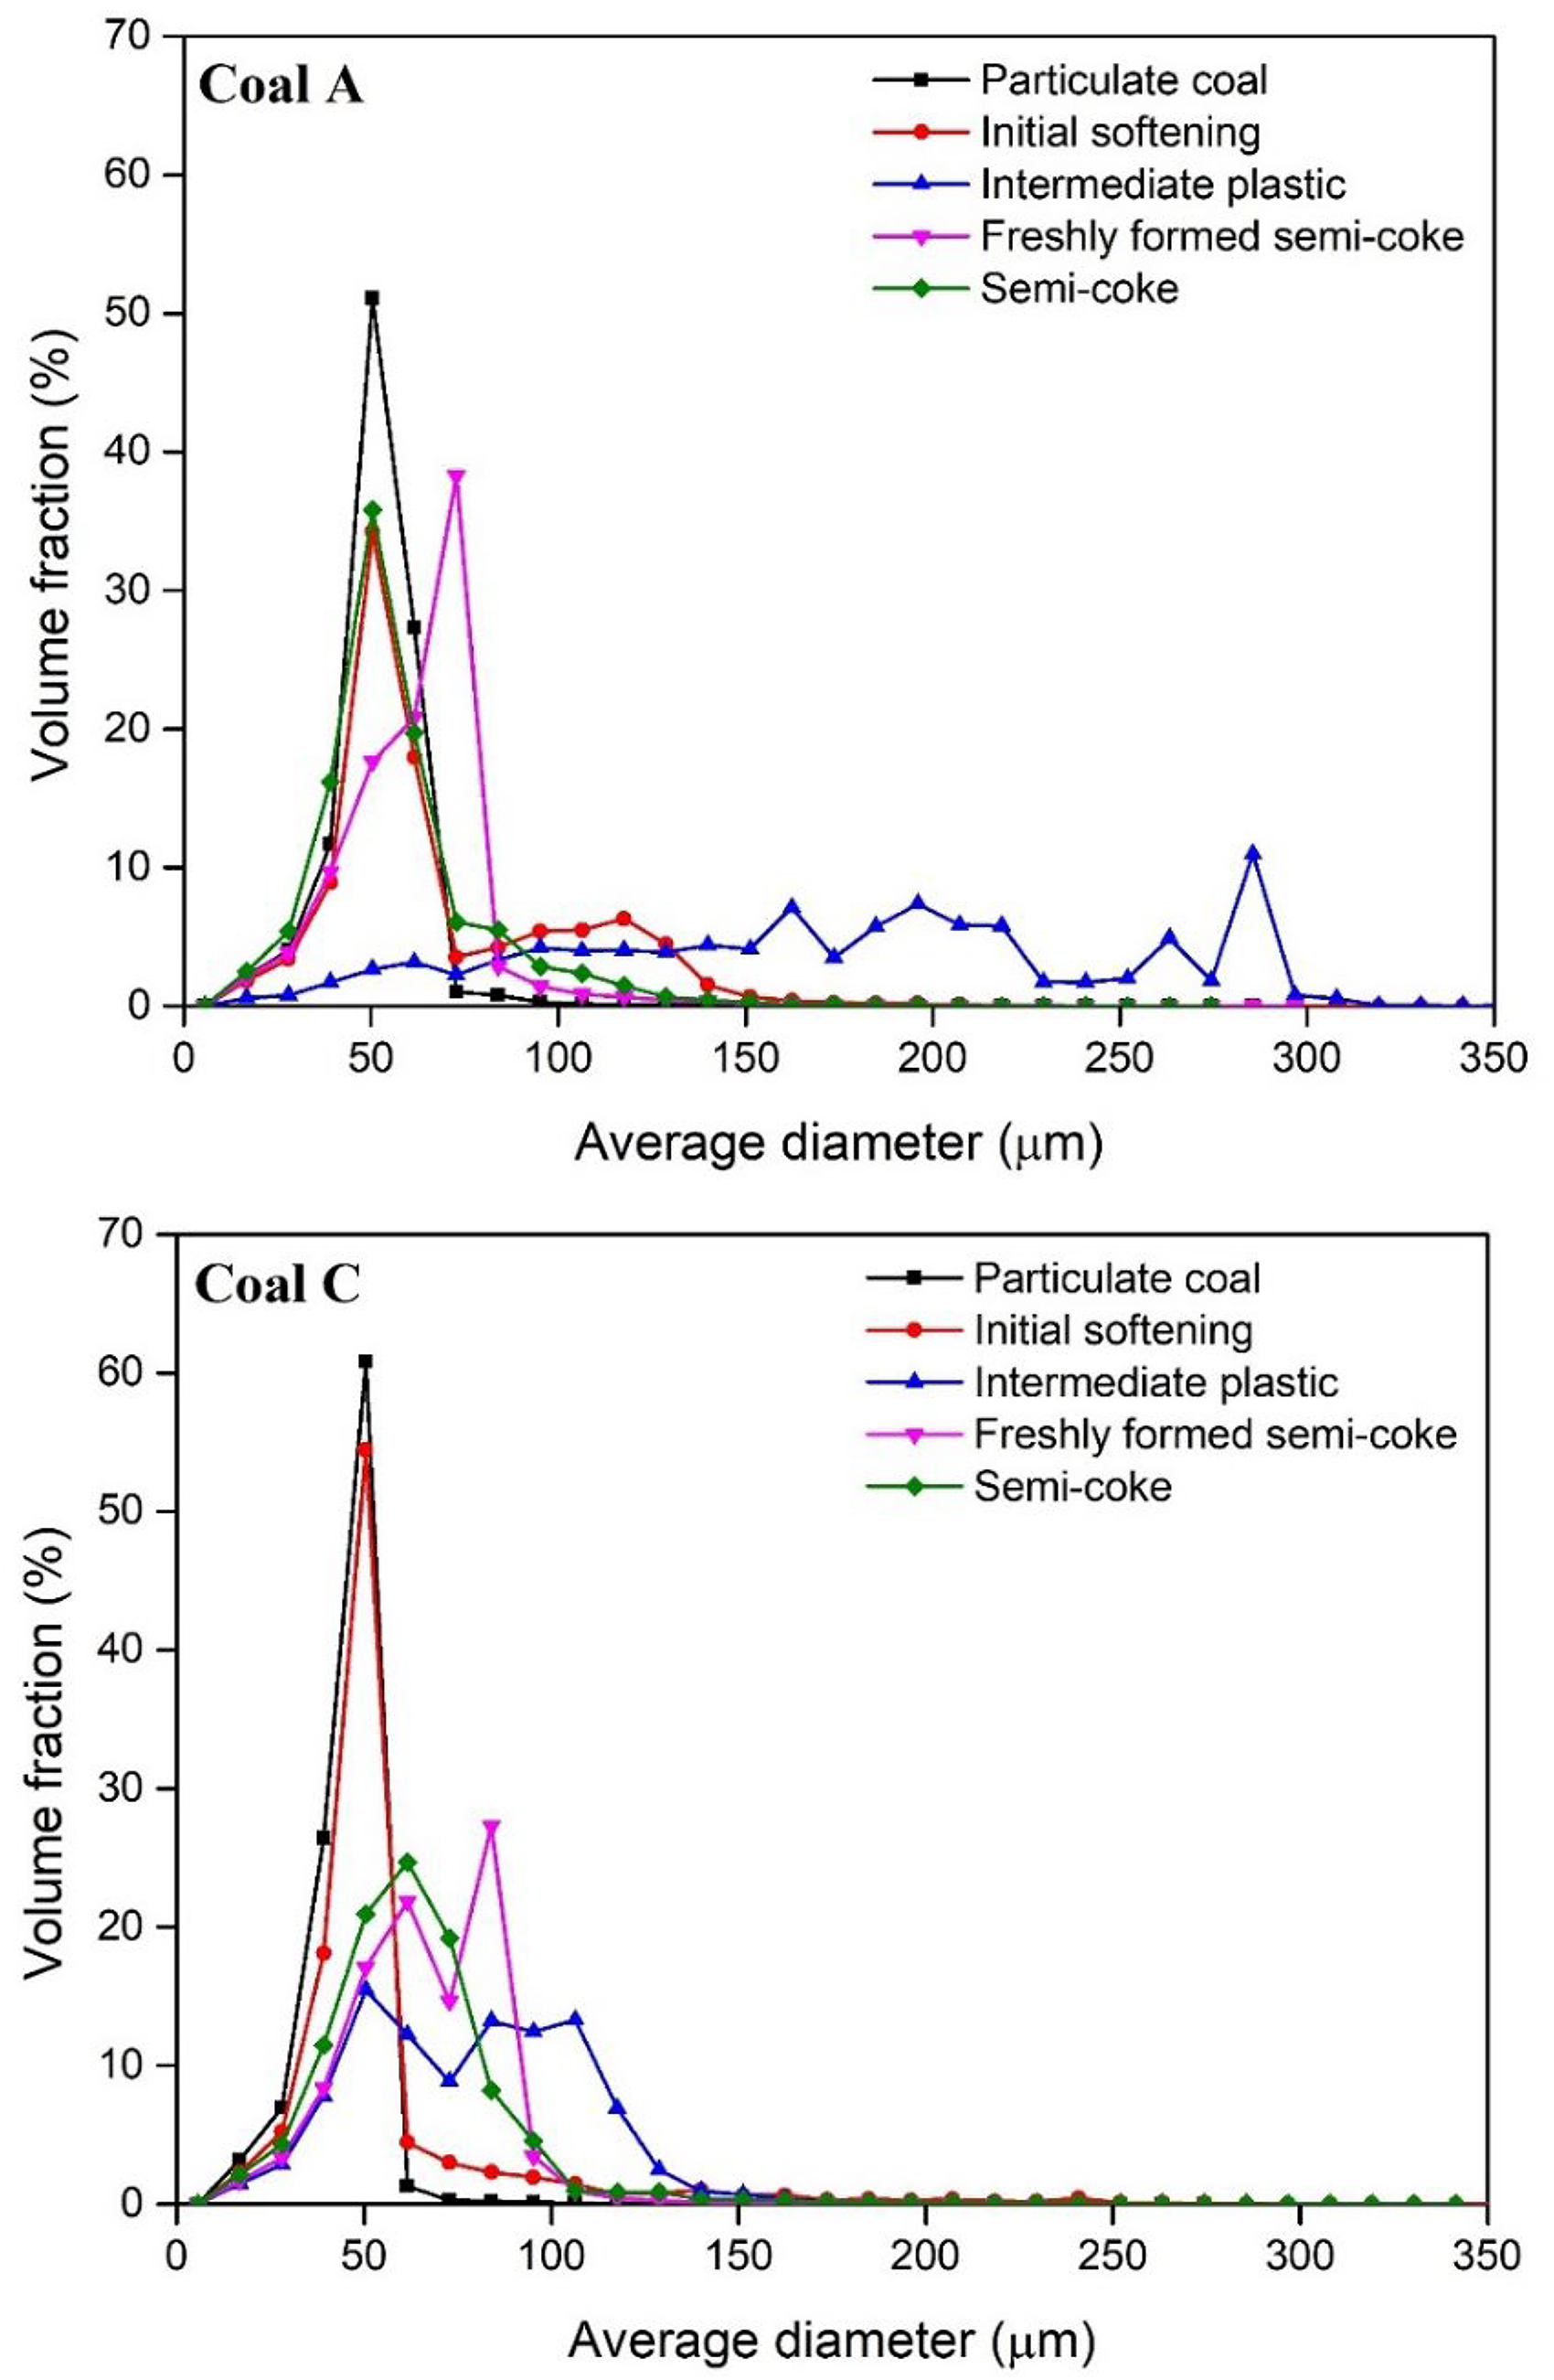
The size distributions of all coal particles as well as those solely for vitrinite particles are shown in Figure 9. The results show similar size distributions of vitrinite particles between similarly ranked coal pairs (A & C, B & D). As such, vitrinite particle size distribution is likely not a factor in explaining the comparative differences between these coal samples in coke oven particle size tests (−3.35 mm). However, coal D reports a relatively large fraction of particles in the −3 + 1 mm size range. This coupled with a high inertinite content provides a partial explanation for the poor thermoplastic performance of coal D, as inert particle abundance serves to provide preferential pathways for volatile escape in lieu of transference into growing bubbles.14,15
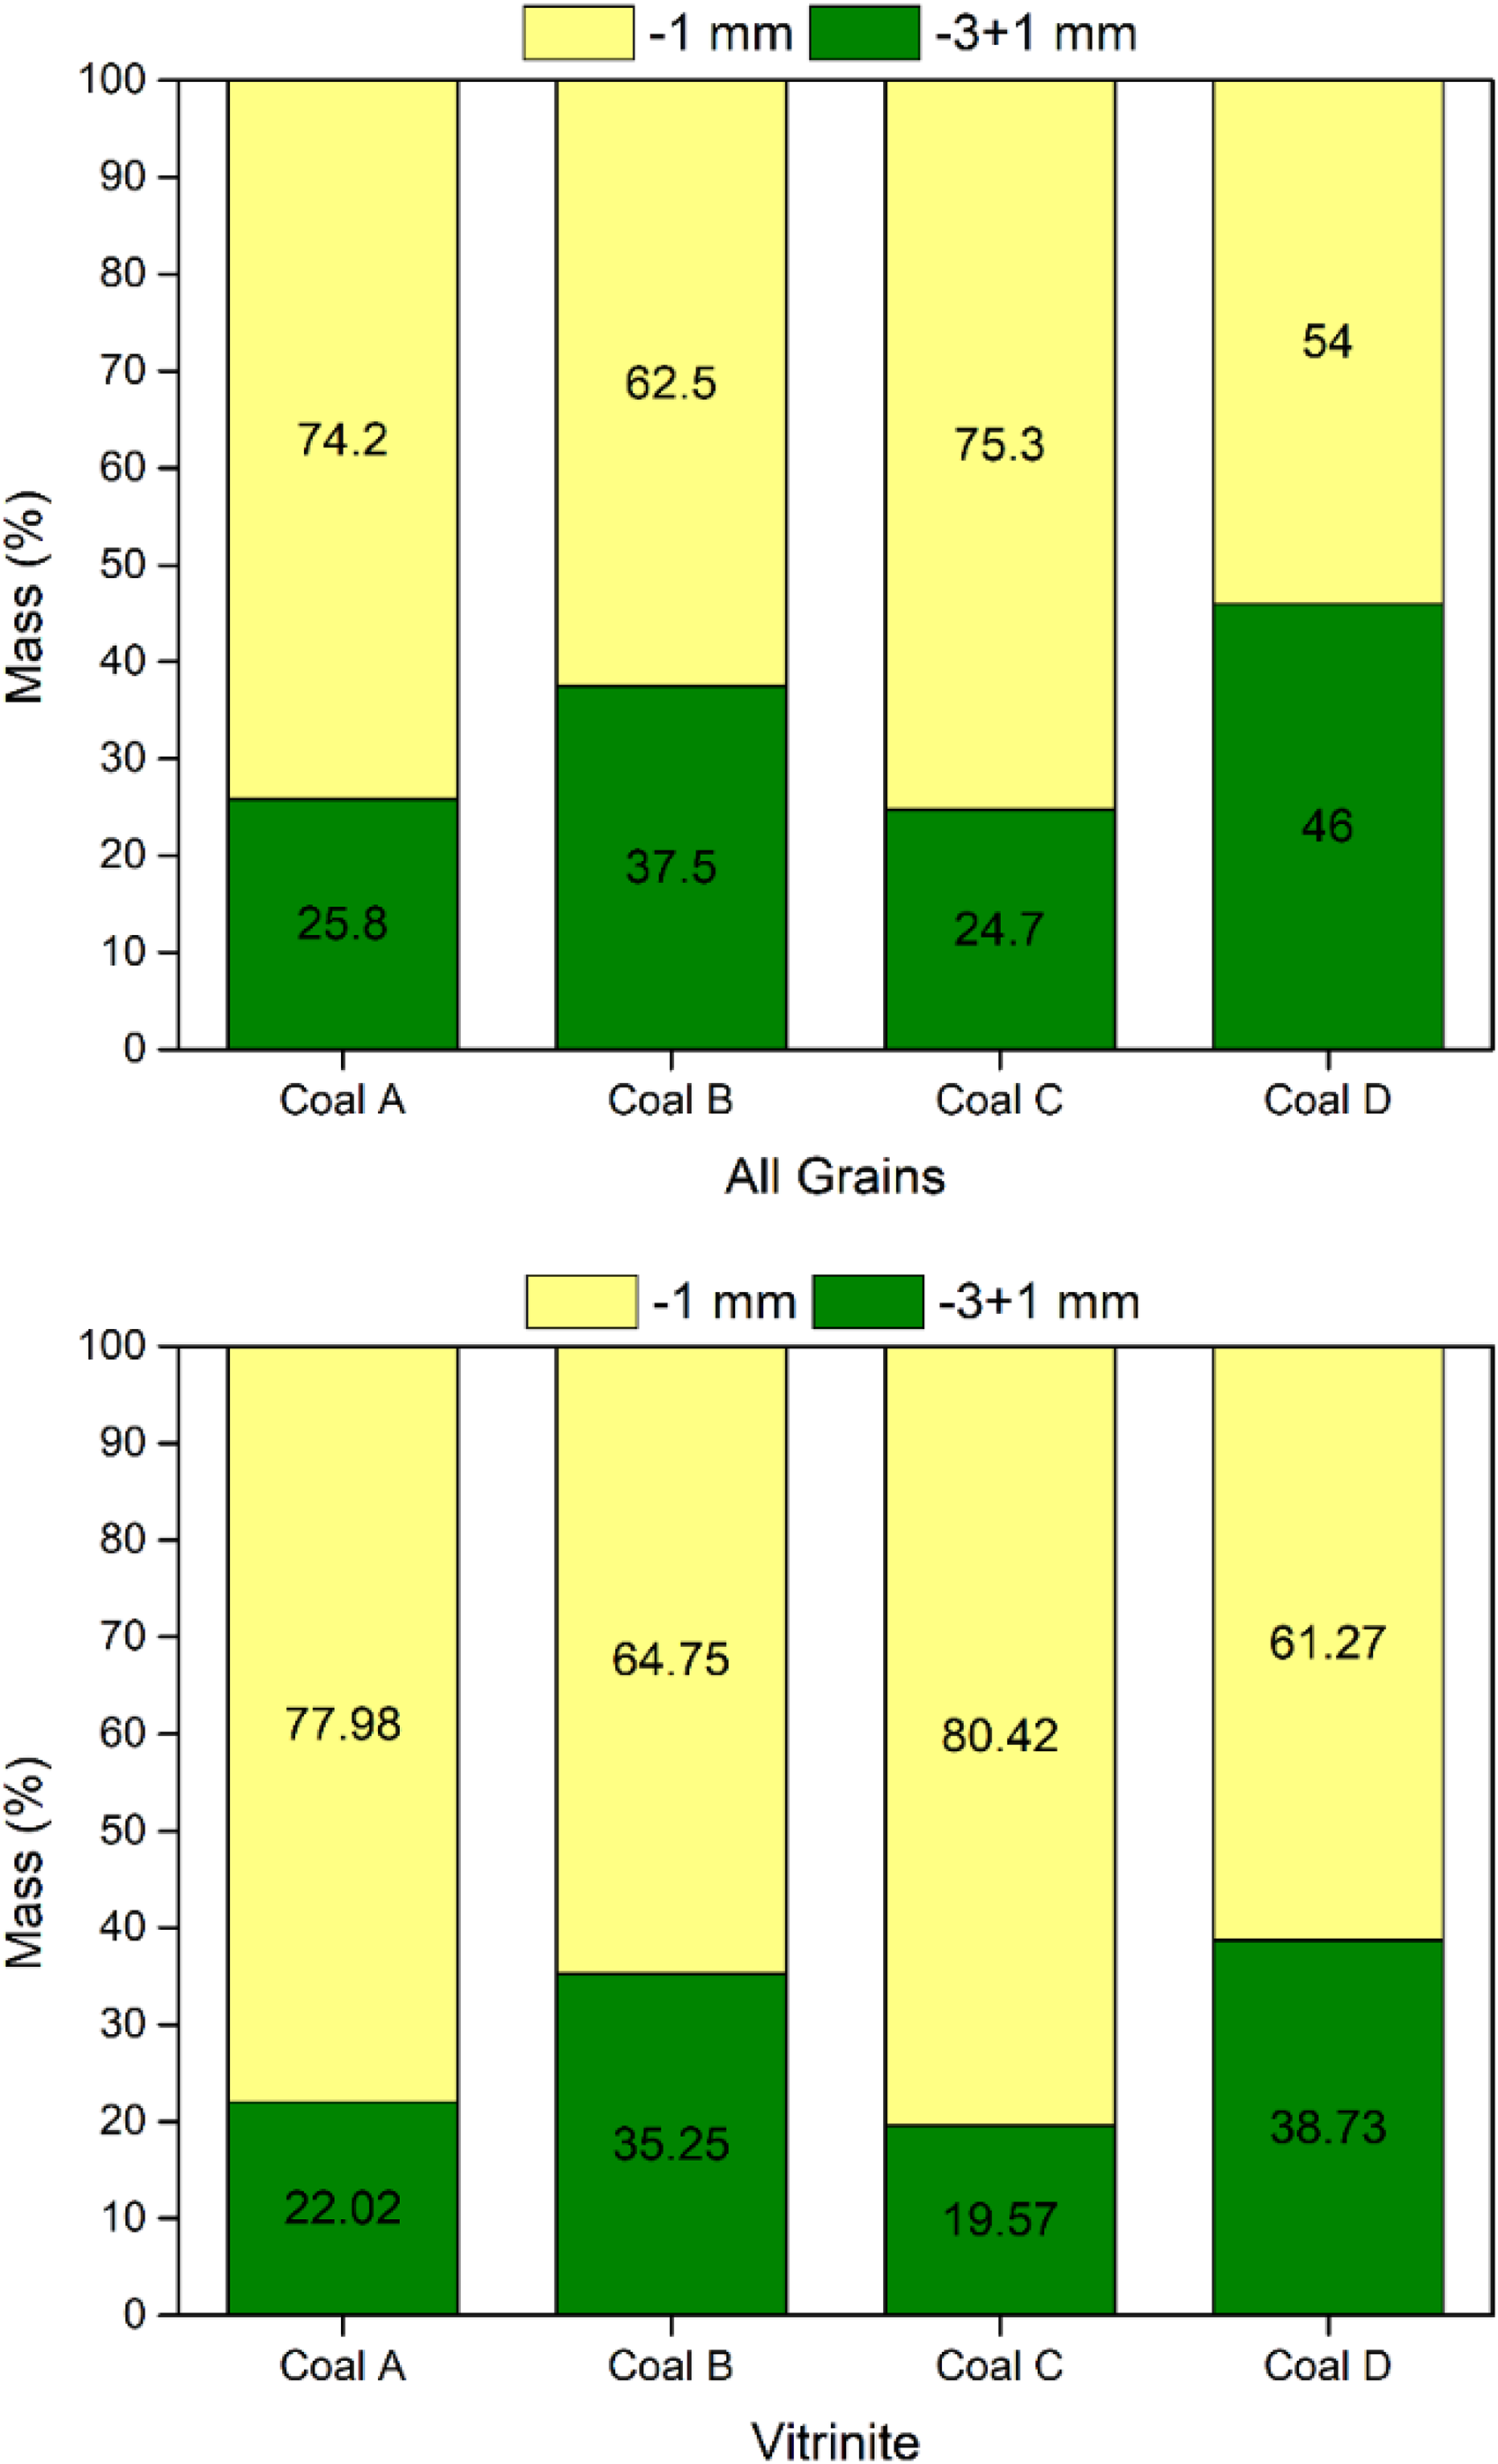
Coal particle size distribution for coal samples: (top) All particles; (bottom) Vitrinite.
Another contributing factor to the development of coal thermoplasticity is the degree of association between vitrinite and inert inclusions (inertinite and minerals). CGA classifies coal particles into different classes based on their maceral grain distributions. Higher proportions of pure vitrinite (> 95%), vitrinite dominant (65% - 95%) and vitrinite rich (vitrinite% > inertinite% + minerite% + liptinite%) particles are desirable for improved thermoplasticity. Figure 10 shows color-mapped visual representations of the maceral distributions for each coal sample in particle size fractions of −3 + 1 mm and −1 mm.
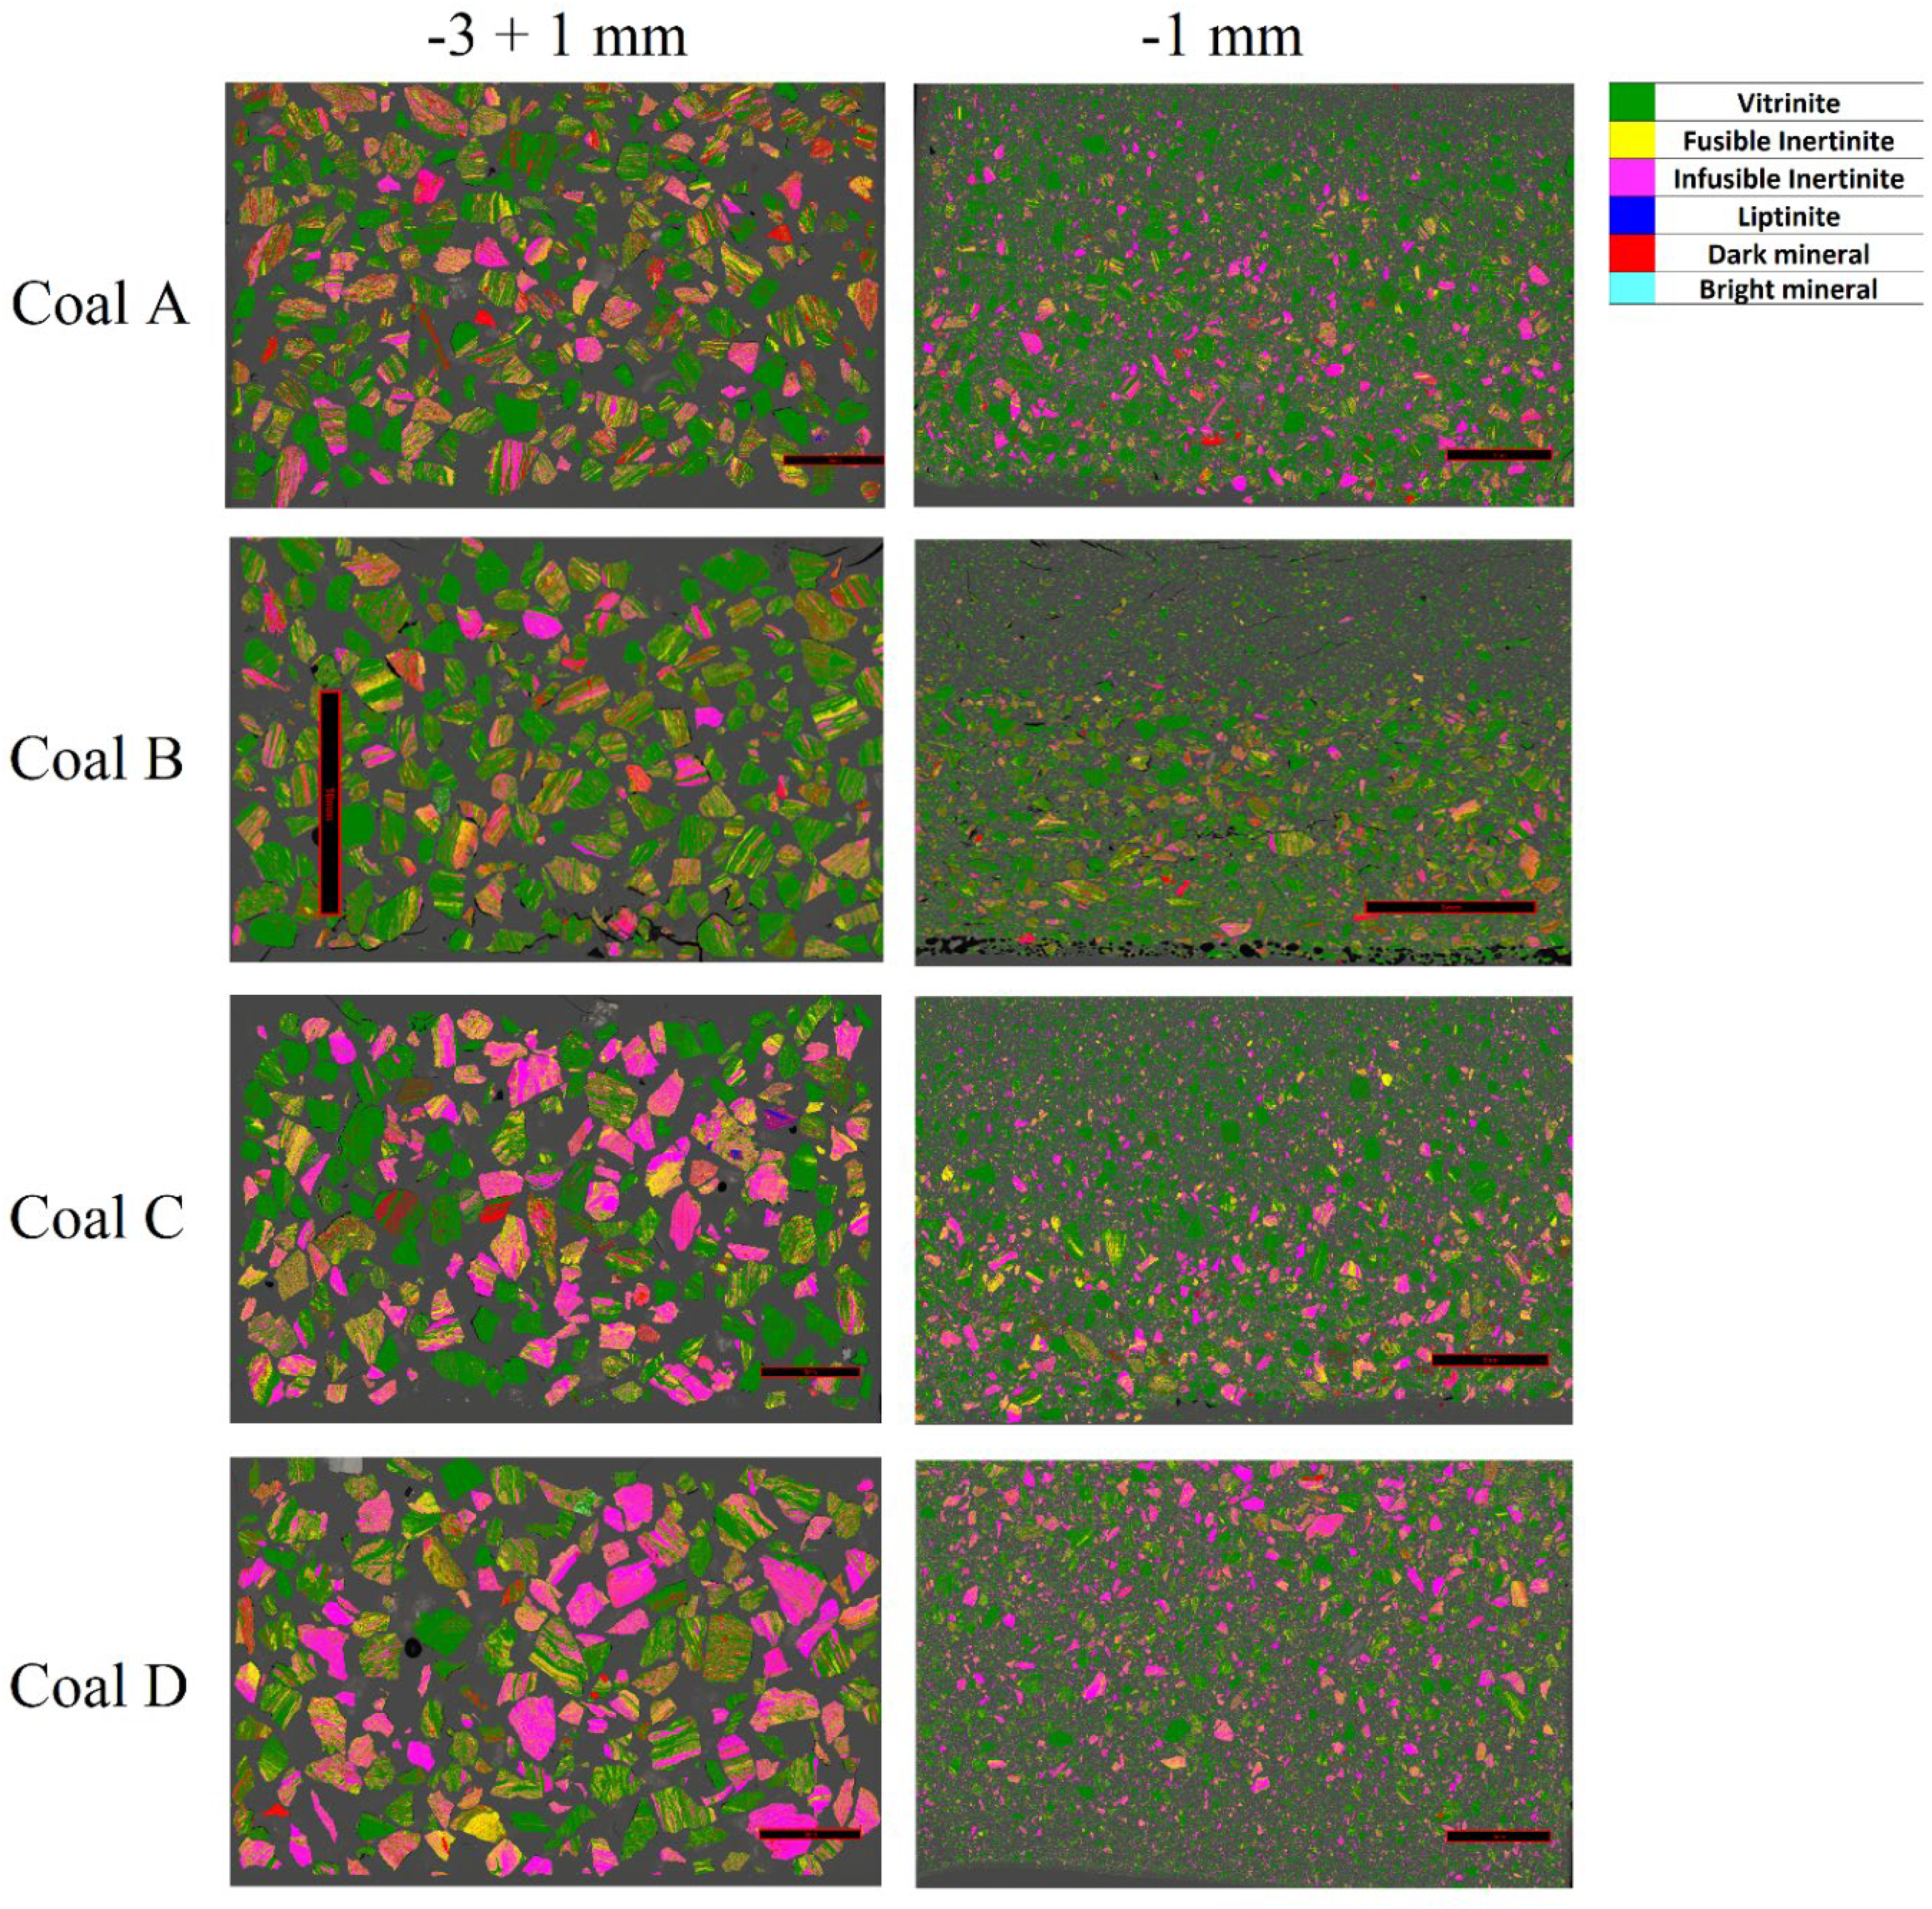
Color-mapped images of maceral distributions in each coal sample within particle size fractions of −3 + 1 mm and −1 mm
Figure 11 compares the coal particle compositions of each coal sample. Coals A and B are mainly composed of pure vitrinite, vitrinite dominant, and vitrinite-rich particles, showing a low degree of association between the vitrinite and inert grain fractions (Table 5). In contrast, coal C and D contain less pure vitrinite and a larger proportion of composite and inert particles (Table 5). These differences in coal particle composition provide an explanation for the dissimilar thermoplastic behaviour observed between the coal pairs. The close association between vitrinite and inert grains in the particles of coals C and D likely facilitates the escape of volatiles, leading to a lower bubble formation and growth potential in vitrinite particles through the thermoplastic phase. This in turn leads to the lower Gieseler fluidity and dilatation readings reported by the standard fluidity measures.
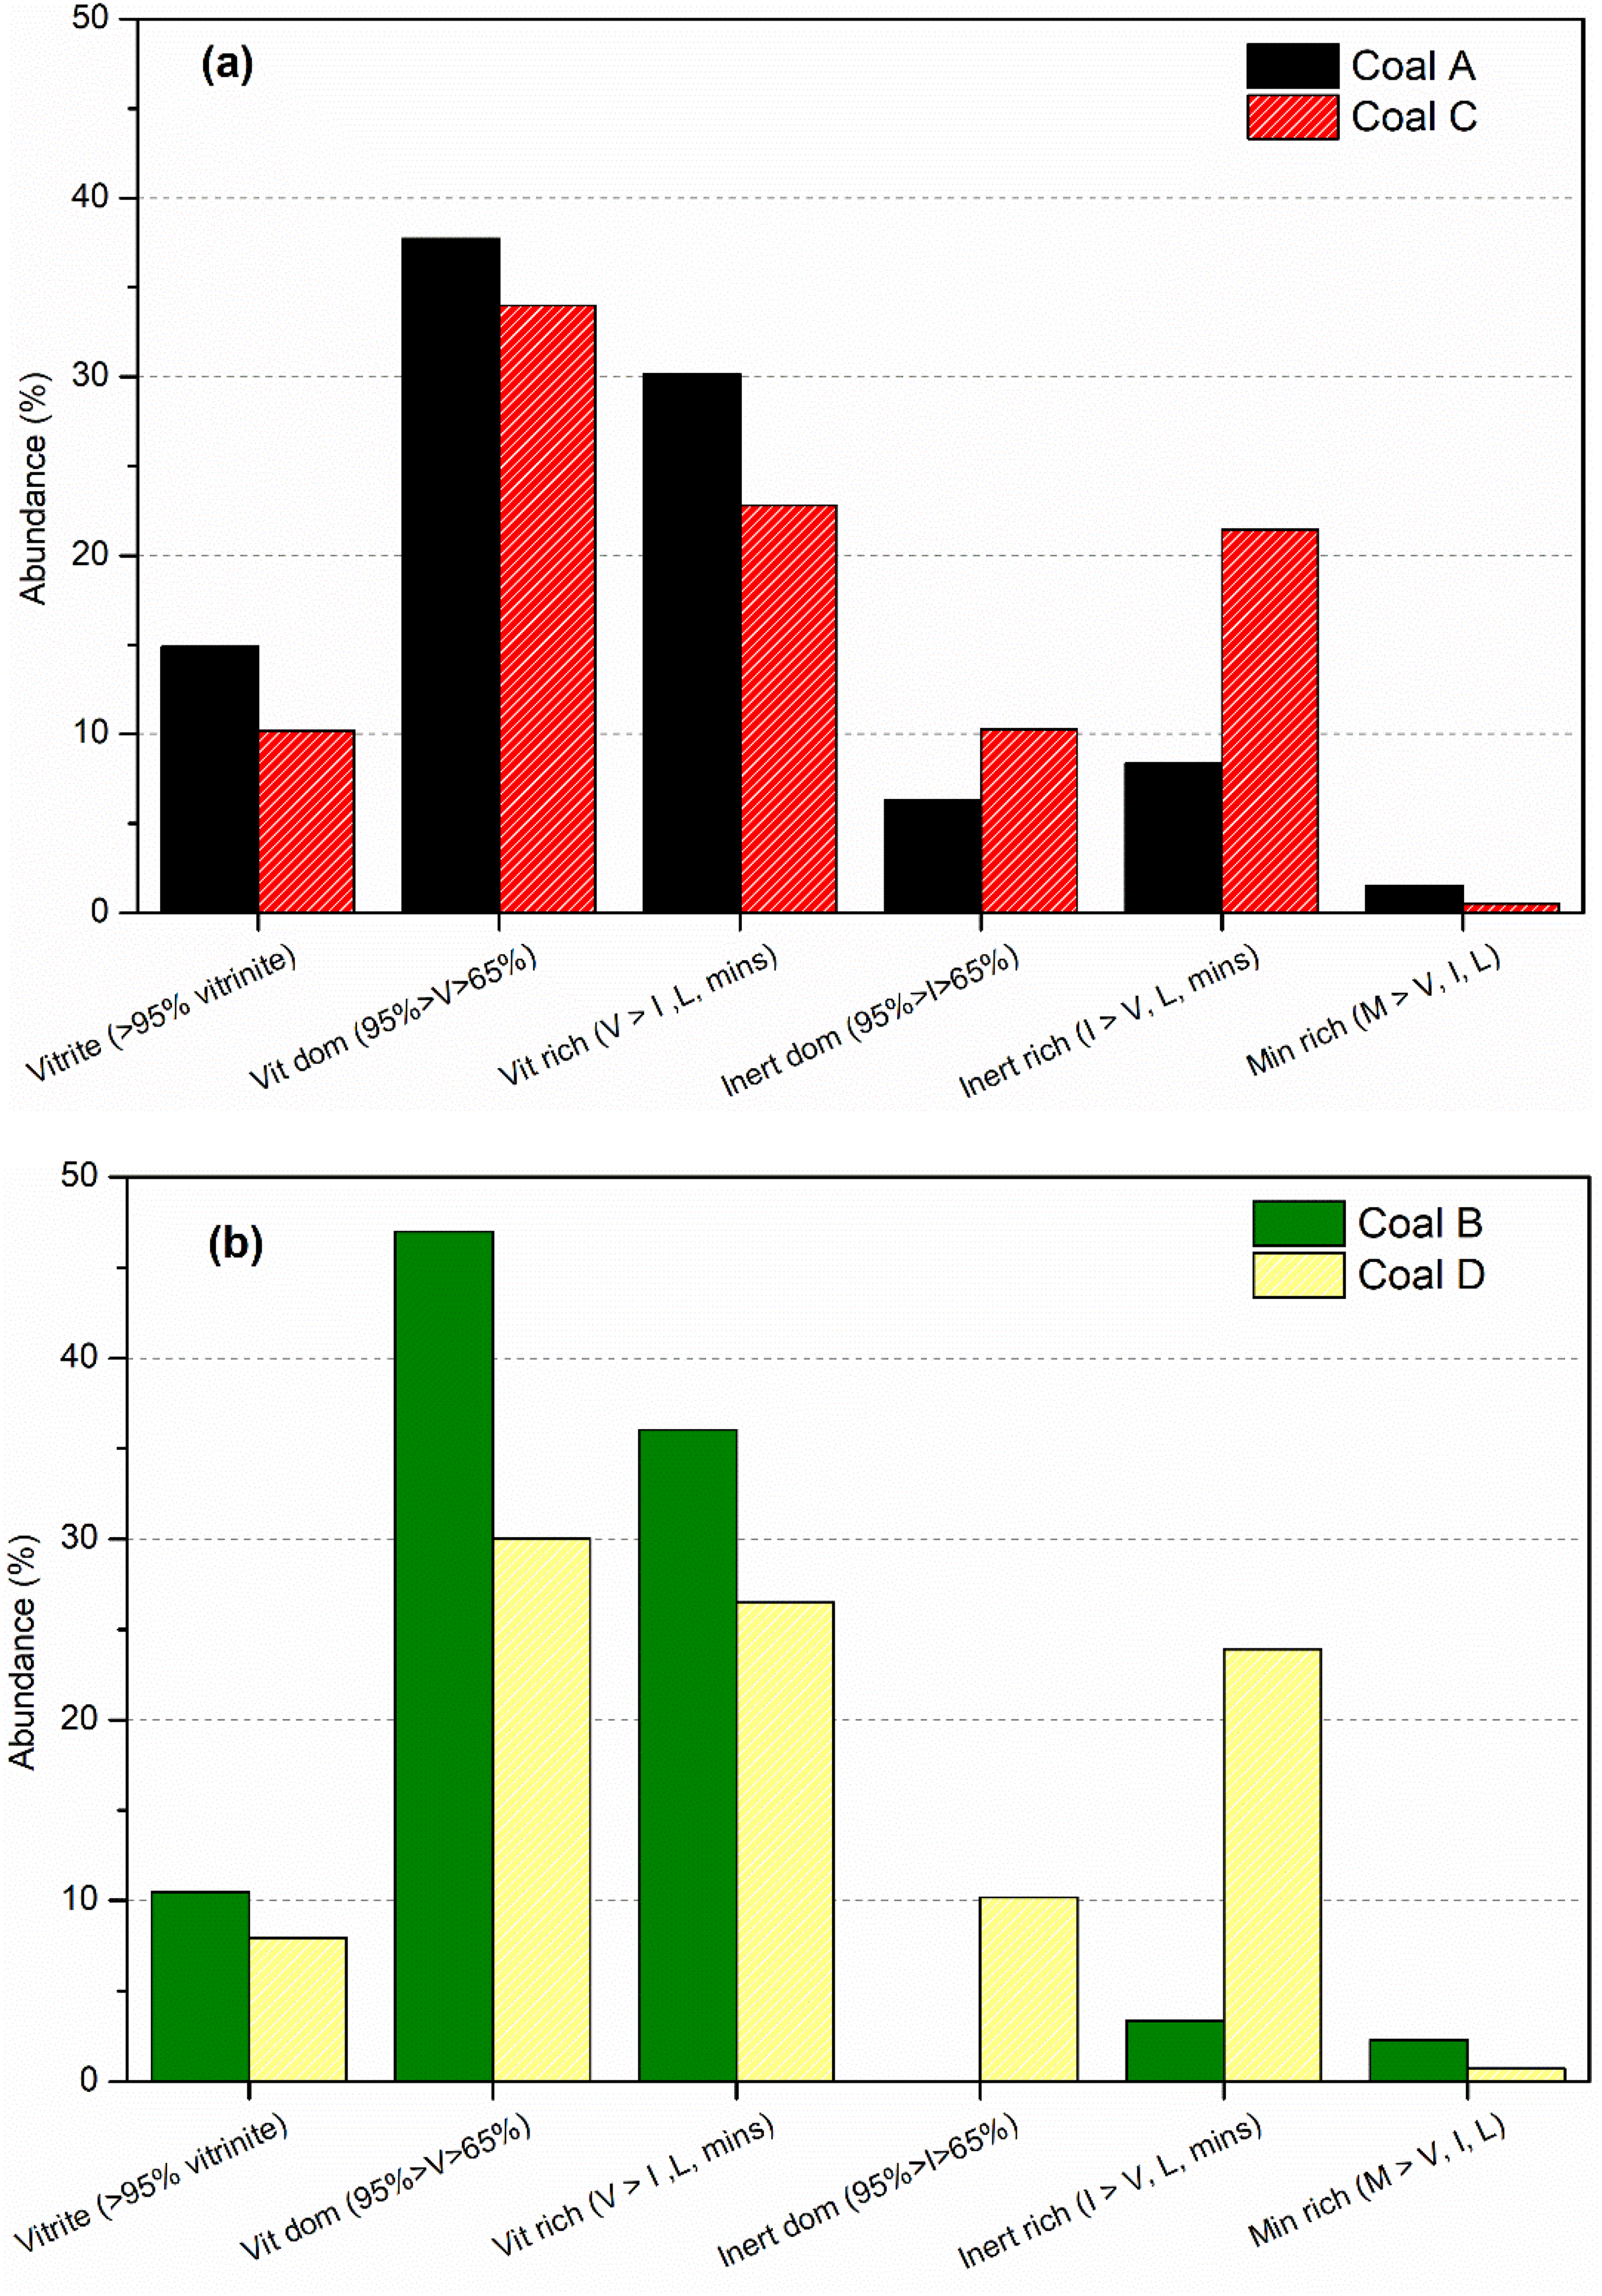
Coal particle compositions of (a) Coals A and C, and (b) Coals B and D samples (V = vitrinite, I = Inertinite, L = liptinite, and M = minerite)
Particle type abundance in each coal sample.
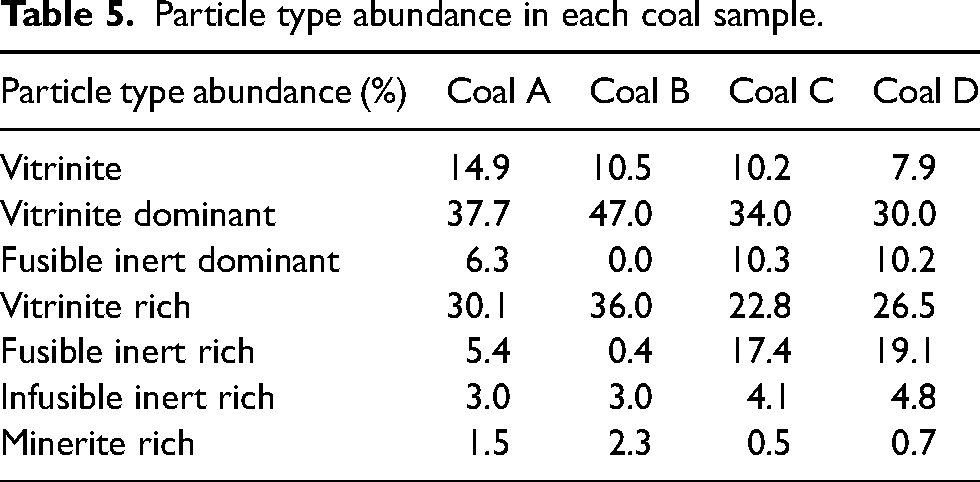
Figure 12 shows a schematic detailing the proposed mechanism by which volatile escape is facilitated and bubble formation is impeded in particles with closely associated macerals during pyrolysis. In contrast to the model of high-purity reactive maceral in Figure 1, a particle of closely associated reactive and inert maceral grains (Figure 12(a)) is pyrolyzed until reactive macerals begin to soften, leading to the formation of small gas pockets trapped within the viscous vitrinite melt as bubbles (Figure 12(b)). These gas bubbles progressively expand and coalesce (Figure 12(c)) until inert maceral boundaries contact the bubble interface. This contact triggers the bursting of bubbles, releasing entrapped volatiles along the inert interface (Figure 12(d) and 12(e)), thereby curbing particle swelling by impeding further bubble expansion. The now stagnant melt boundaries solidify into pore walls as resolidification initiates with the structures of inert macerals remaining largely unchanged, ultimately shaping the semi-coke matrix (Figure 12(f)).
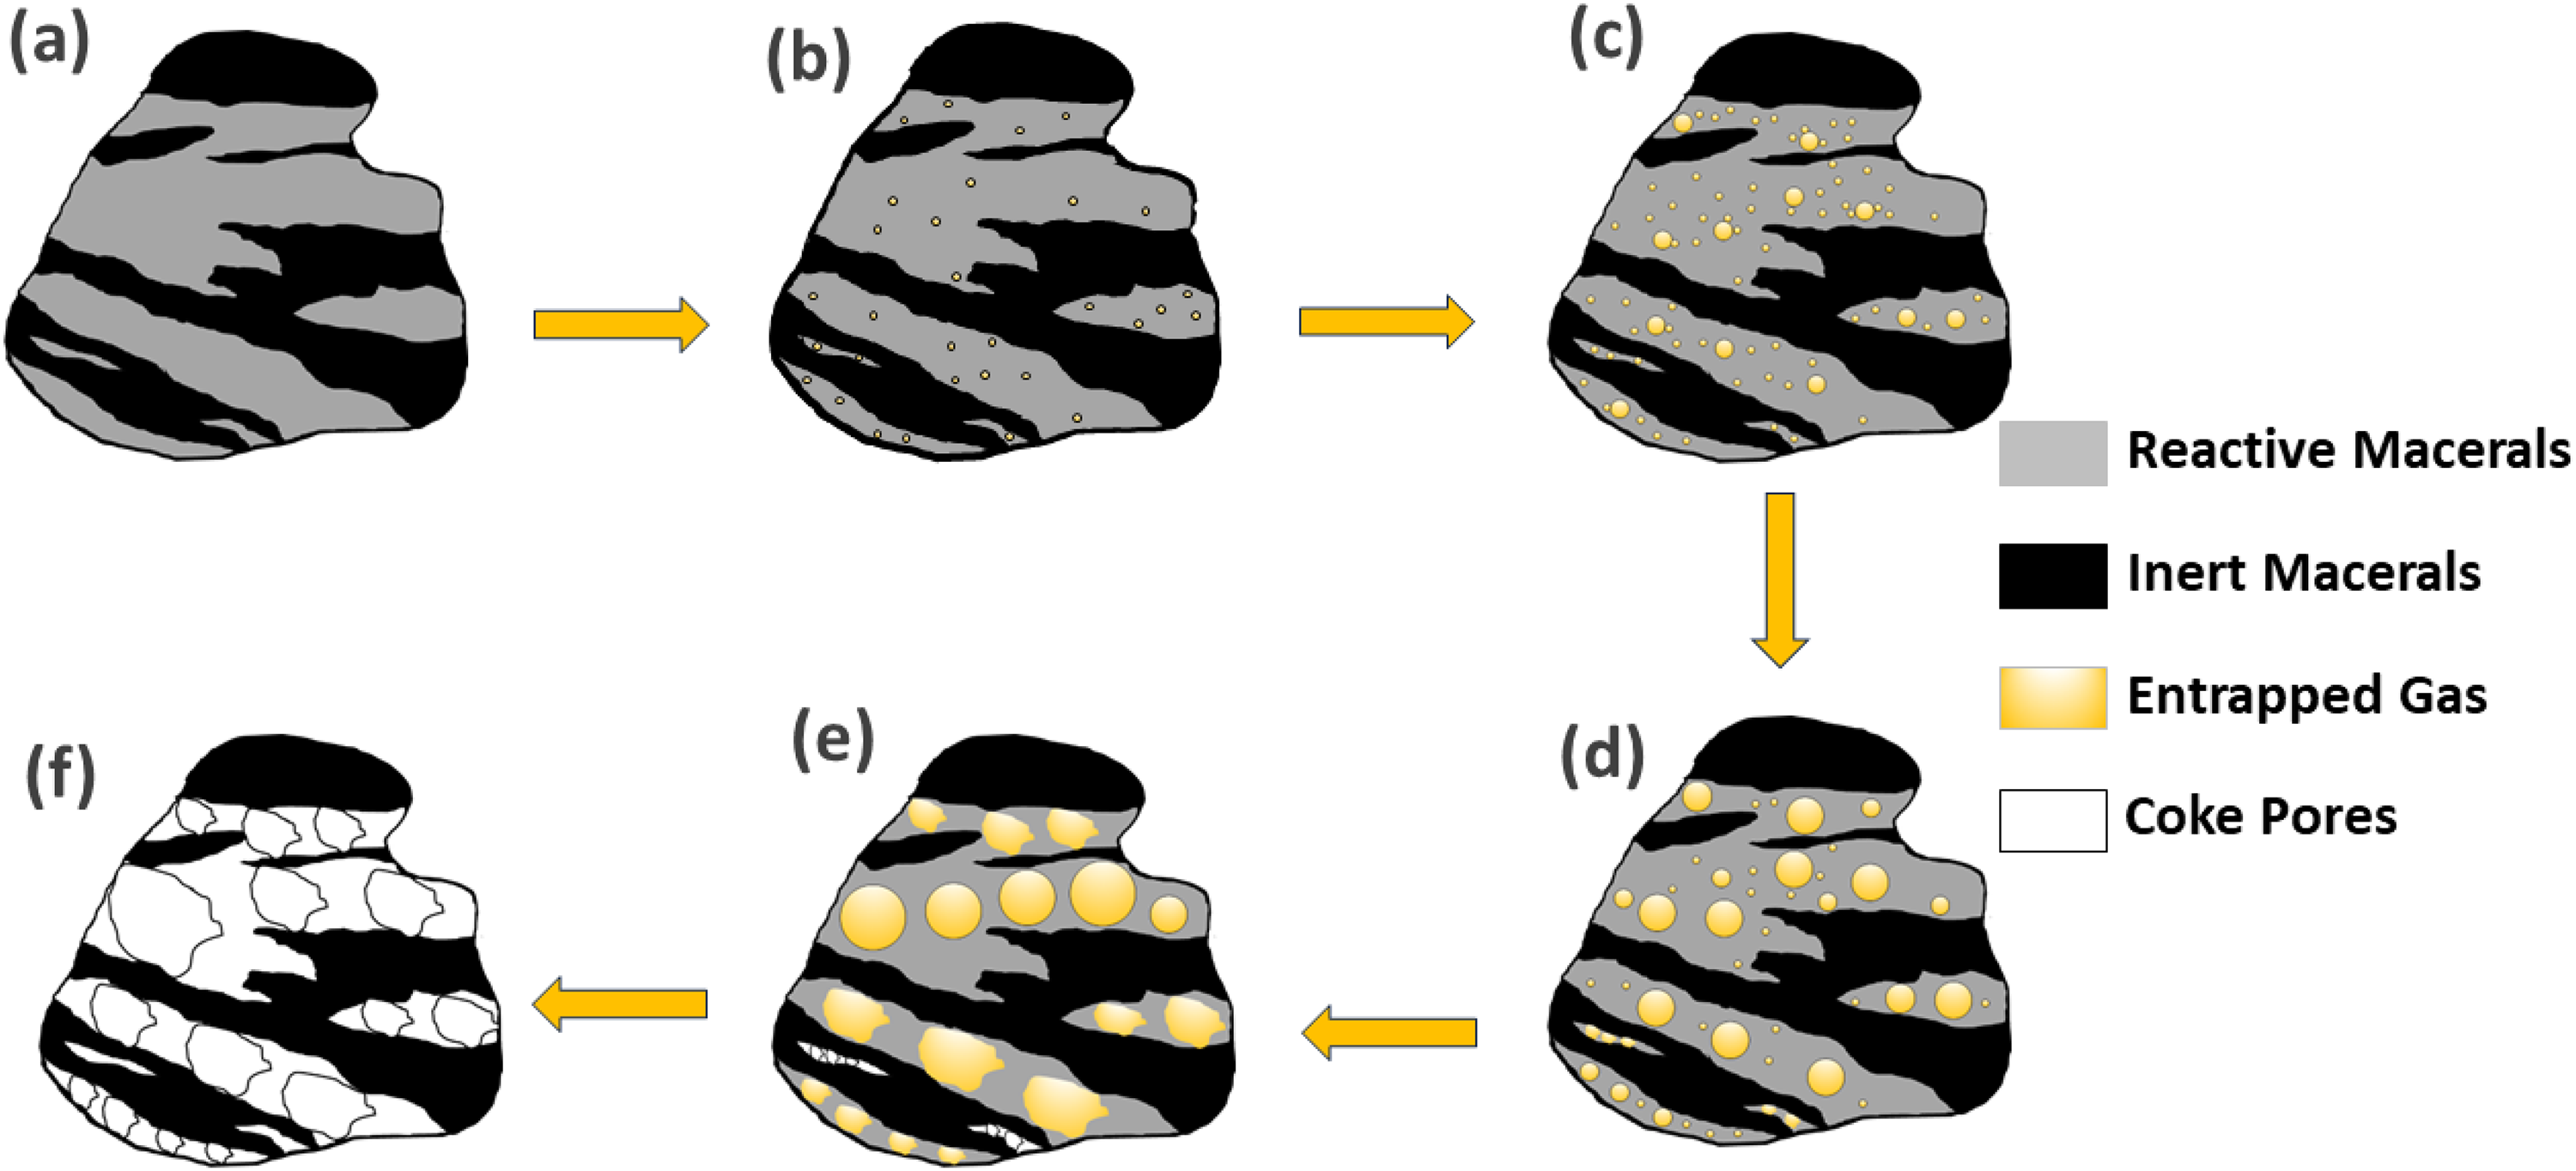
Schematic of volatile escape and bubble growth hindrance mechanisms in particles with closely associated maceral grains during pyrolysis.
Internal gas pressure measurements
The thermoplastic region, which forms and migrates through the coal bed in a coke oven, entraps evolved volatiles within its viscous melt which in turn generates IGP. The transmission of this IGP through the adjacent semi-coke/coke boundaries to the coke oven walls is the genesis of coke oven wall pressure, which is widely known to be one of the most important aspects of the cokemaking process to control. 14 Figure 13 shows the IGP peaks at 50, 100, 150, and 210 mm from the heating wall during the coking of the coal samples. The higher IGP peaks at the centre of the reactor (210 mm) owe to the merging of the plastic layers from the two sides of the coal charge accompanied by adjacent semi-coke boundaries. The significance of the semi-coke boundaries converging at the centre of the charge in this test lies in their limited permeability to volatile gas escape. They function as dynamic barriers, against which gas pressure continues to increase until the entirety of the charge has reached the resolidification stage, and the volatiles evolved from the thermoplastic transformation have evacuated.
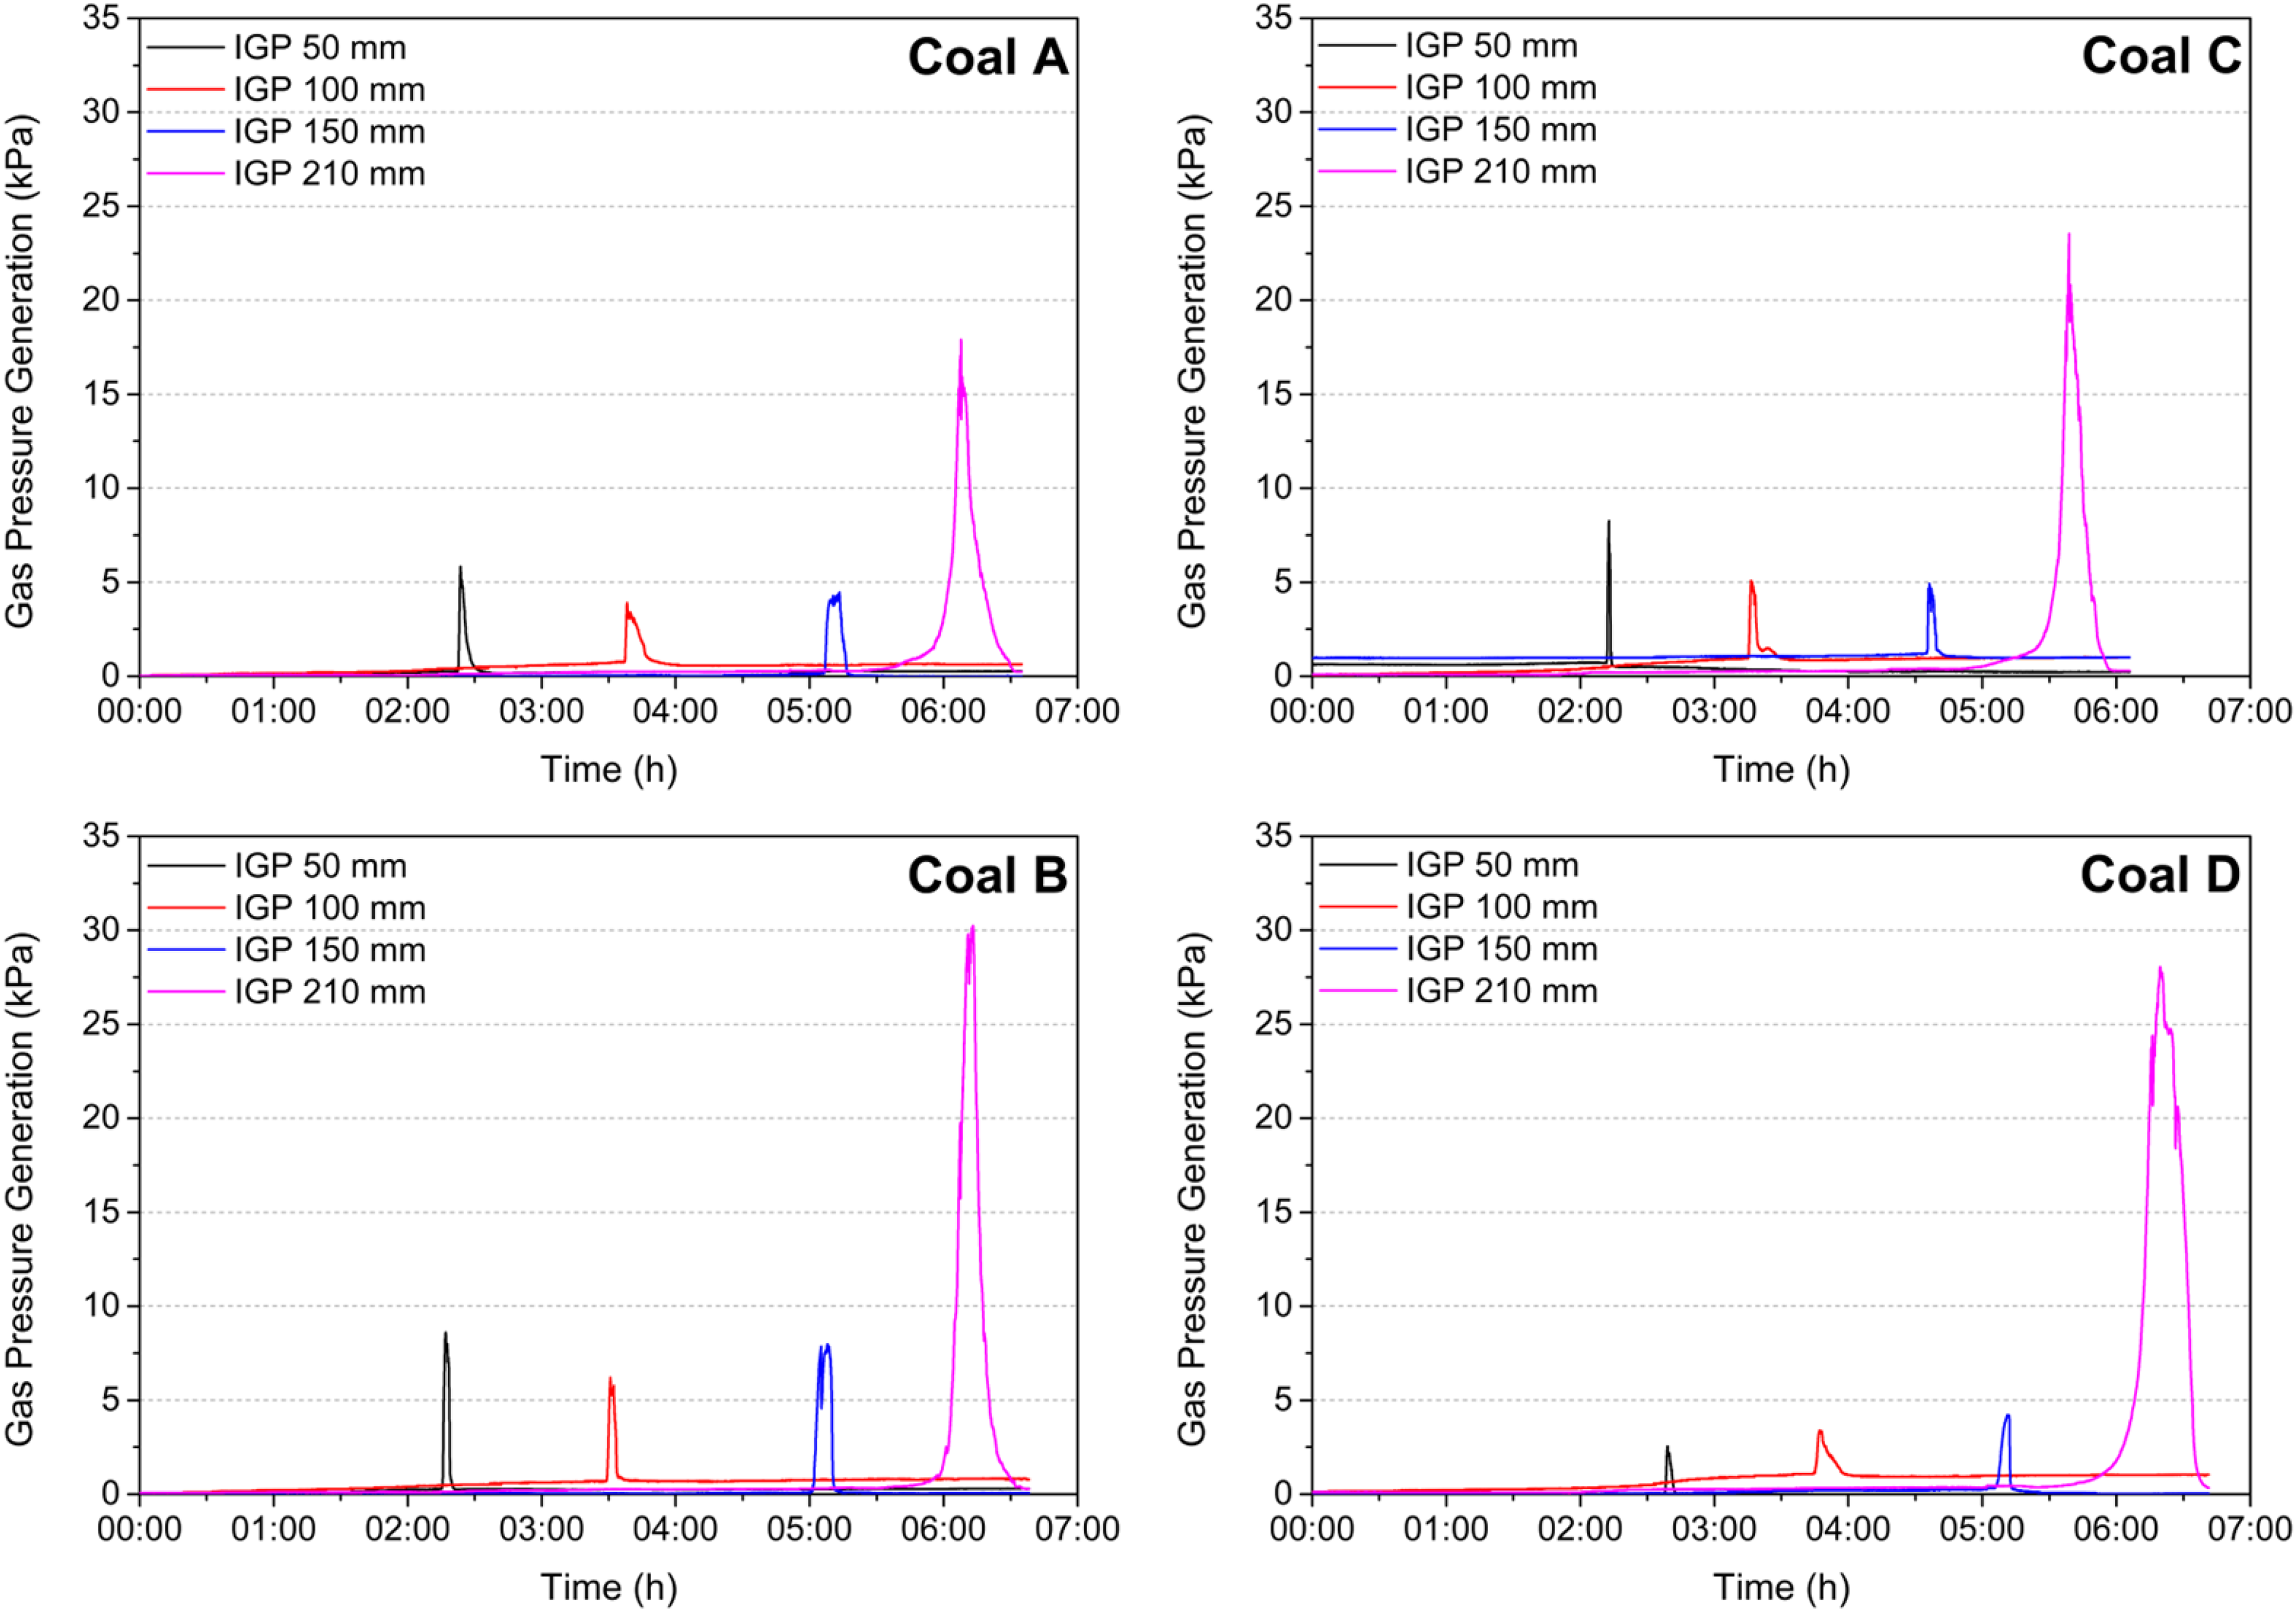
IGP measurements during the coking of the coal samples in the 4 kg coke oven as a function of the heating wall.
In contrast to the measures of coal fluidity presented here thus far, which involve testing of small sample masses, the larger scale 4 kg in-situ coking tests performed under a thermal gradient condition showed that the IGPs generated were ultimately comparable between the similarly ranked coal pairs. These findings show that although the standard fluidity measurements for coal C and D indicate poor coking quality, the liquid phase present in the thermoplastic melt provides sufficient binding material to form a strong coke. It should be noted that IGP is also dependent on the permeability of the adjacent semi-coke.11,16,17 High IGPs indicate the formation of a low permeable semi-coke on the hotter side of the plastic layer,11,17 which is known to benefit the bonding between IMDC and RMDC. 15
Conclusions
The findings of this study provide an explanation as to why some coals, which report conventionally undesirable thermoplastic properties as discerned by standard Gieseler fluidity and dilatation testing, can yield high-quality metallurgical cokes for use in the blast furnace. Key observations are:
The particle size range typically utilised for Gieseler fluidity testing (−0.42 mm) does not accurately represent the thermoplastic behaviour of coal at a coke oven charge particle size (−3.35 mm). The thermoplastic layers of coals C and D are highly permeable and show low dilatation. However, fluidity was enhanced when utilising coke oven feed size samples in permeability/dilatation tests. Rheometry testing showed a high viscosity of the plastic layers in coals C and D, potentially contributing to low Gieseler fluidity readings. Coal grain analysis results showed a high degree of maceral grain associations in coals C and D, potentially introducing preferential escape pathways for gases and limiting bubble growth, which in turn would hinder the development of dilatation and fluidity in these coals. The correlation between coal grain composition and measured thermoplasticity showed that a larger portion of pure vitrinite and vitrinite-dominant particles in coals promotes bubble growth and coalescence, increasing the fluidity and dilatation readings. The reported internal gas pressures generated at the centre of the coal charges were comparable between rank-paired coal samples, indicating that coals C and D coke well under thermal gradient conditions and generate sufficient fluid matter to generate pressure and bond inertinite components to form a strong coke matrix, despite their inauspicious Gieseler fluidity and dilatation measurements. Micro-CT image analysis of the plastic layer samples showed that the “real” plastic range for coal C and D was up to 25 °C wider than that reported by Gieseler.
Footnotes
Acknowledgements
We greatly acknowledge the financial support from BHP. The PhD scholarship from BHP and the University of Newcastle is also greatly appreciated.
Data availability
Data will be made available on request.
Declaration of conflicting interests
The authors declared no potential conflicts of interest with respect to the research, authorship, and/or publication of this article.
Funding
The authors disclosed receipt of the following financial support for the research, authorship, and/or publication of this article: This work was supported by the BHP,