
Abstract
Aim
The aim of this study is to examine the relationship between nasal index and vertical growth pattern. Thus, the physician can be provided with a prediction that may assist in evaluating treatment options.
Materials and Methods
In this retrospective study, 300 individuals were randomly selected. The nasal index, calculated as the ratio of nasal width to height, was derived from photographs. Cephalometric radiographs were used to measure the SN/GoGn angle. Data analysis utilized the Anonymous, 2011 program, employing Pearson correlation tests to assess parameter correlations.
Results
There was no statistically significant correlation between the nasal index and the SN/GoGn angle in subgroups categorized by vertical growth patterns. However, a negative linear correlation was observed between the nasal index and the SN/GoGn angle within the leptorrhine subgroup (P < .01). Additionally, when subgroups were not considered, a significant negative linear relationship between the nasal index and the SN/GoGn angle was found (P < .01).
Conclusion
There was a significant correlation between vertical growth pattern and nasal index in individuals with leptorrhine nose type. In clinical examination, measurement of the nasal index can provide a prediction of the vertical growth pattern of the individual without cephalometric analysis.
Introduction
Variations in facial shape make individuals distinct and give them a unique appearance. 1 The nose, positioned in the center of the face, is a major anthropometric marker of ethnic origin and gender. 2 Additionally, the nose has an emotional, social, and cultural role in the shaping of facial appearance. Orthodontic treatment can lead to skeletal and dental changes that impact soft tissue appearance. Therefore, when planning treatment, it is important to consider the soft tissue characteristics identified during the examination and diagnosis.
The nasal index, a ratio of the width to the length of the nose, expressed as a percentage, is a valuable tool for classifying populations. 3 Typically, Caucasians have a leptorrhine (long and narrow) nose with a nasal index value of less than 70. East Asians have a mesorrhine nose, with a nasal index value ranging from 70 to 84.9. Negroid individuals have a platyrrhine nose and a nasal index greater than 85. This variation is believed to result mainly from geographical factors.4, 5
Nasal index measurements can be obtained directly or indirectly. Indirect methods, such as photography, cephalograms, stereophotography, laser scanning, and computed tomography, are increasingly preferred due to the limitations of direct measurement, such as time spent in the clinic, patient cooperation, difficulty in repeating measurements, and archiving. In orthodontics, photogrammetry and lateral cephalometry are widely used diagnostic methods. Photogrammetry is especially favored because it minimizes the need for patient cooperation, is quick and cost-effective, and does not involve radiation exposure. 6
This study examines the correlation between nasal index and vertical growth pattern. The reason for selecting this topic is that, although both measurements have been processed from disparate anthropological perspectives, the two measurements have never been examined in conjunction with one another from an orthodontic perspective. A statistical and retrospective correlation study was therefore conducted in order to address the existing gap in the literature.
The study aims to evaluate the potential correlation between the nasal index and vertical growth pattern (SN/GoGn) in individuals. In addition, it aims to investigate how the measurement of the nasal index during the patient’s clinical examination correlates with the patient’s vertical growth pattern, to provide the clinician with a predictive measure and to consider treatment options.
Materials and Methods
Selection and Description of Participants
This retrospective study was conducted using patient records from the Department of Orthodontics at Ankara University Faculty of Dentistry. A priori power analysis was performed using Statistica V12 software (StatSoft, Inc., 2014) for a correlation test (H0: ρ = 0). Assuming a population correlation coefficient (ρ) of 0.35, a type I error rate (α) of 0.01, and a power (1 − β) of 0.90, the required sample size was calculated to be 114 individuals using the refined Fisher Z transformation. To increase the power and subgroup representation, a total of 300 individuals were included in the final study sample.
Inclusion criteria in the study:
Availability of extraoral photographs and cephalometric radiographs. Individuals over 18 years of age. Absence of any craniofacial syndrome. Not history of orthodontic treatment. No indication for orthognathic treatment. No history of rhinoplasty.
Study Design
Orthodontic radiographs were taken with a Sirona Orthophos X-ray unit (Sirona Orthophos XG5, Sirona Dental Company, Long Island City, NY, USA), and photographs were captured under standard conditions with a Nikon D90 camera and were used in this study.
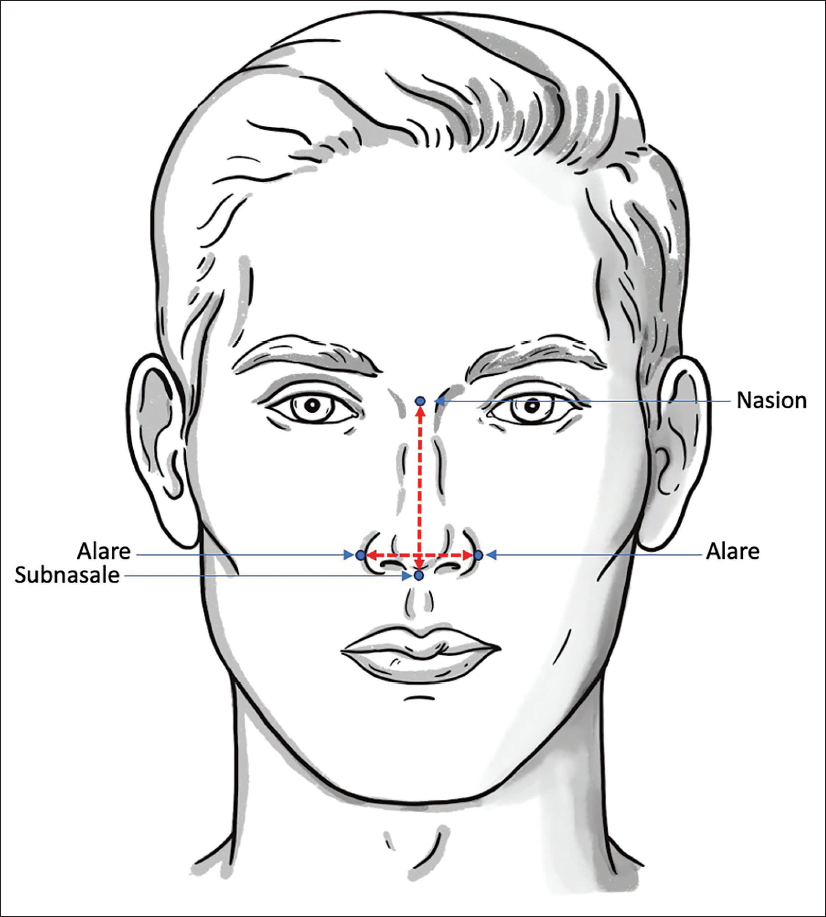
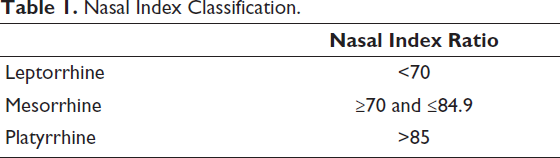
Nasal measurements, nasal width, and length were obtained using AutoCAD (AutoCAD 2023, Autodesk, San Francisco, CA). Nasal width was defined as the distance from right ala to left, and nasal length was defined as the distance from the nasion to subnasale (Figure 1). The nasal index was calculated as the percentage ratio of nasal width to nasal length. Based on nasal index values, three types of noses were categorized, as shown in Table 1. In the literature, there are several classifications for nasal types, including Martin and Saller’s 7 and Farkas’s. 4 For this study, we selected Farkas’s classification due to its suitability, as no hyperplatyrrhine samples were present in our data.
Nasal Index Classification.
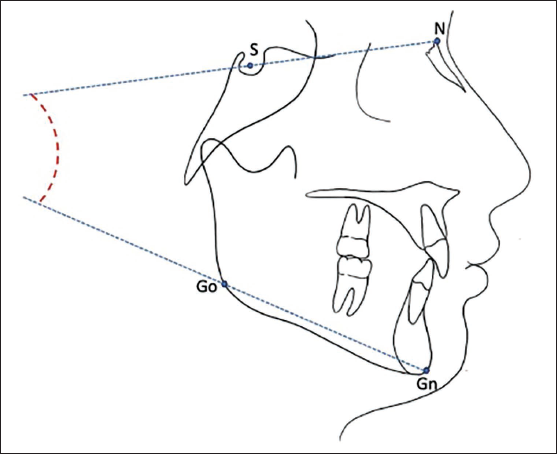
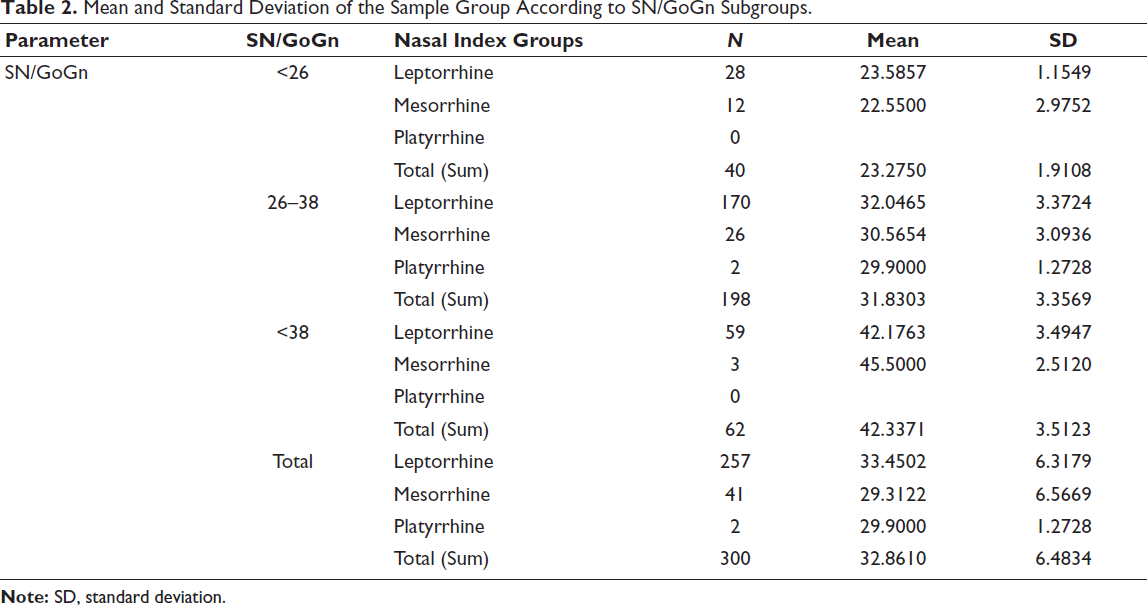
SN/GoGn angle was measured using the Dolphin Imaging (11.8, Dolphin Imaging & Management Solutions, Chatsworth, CA, USA) program from the pre-treatment cephalometric radiographs (Figure 2). Similarly, the SN/GoGn angle, which represents the vertical growth pattern, was divided into three groups based on the same criteria as the nasal index groups: less than 26°, 26-38°, and greater than 38°. Table 2 illustrates that three different nasal index groups were associated with three different SN/GoGn angle groups, resulting in a total of nine different combinations and groupings.
Mean and Standard Deviation of the Sample Group According to SN/GoGn Subgroups.
Statistical Analysis
Data analysis was conducted using the R Statistical Package (Anonymous, 2011), an open-source statistical software. Descriptive analyses were used to present results as mean, standard deviation, and frequency (n). The Pearson correlation test was applied to identify any correlations between variables, with a P value of less than .05 considered statistically significant.
Results
The study included 300 participants, 257 leptorrhines, 41 mesorrhines, and 2 platyrrhines. The analysis showed that 40 patients had an SN/GoGn angle of less than 26°, 198 patients had an SN/GoGn angle between 26° and 38°, and 62 patients had an SN/GoGn angle greater than 38° (Table 2).
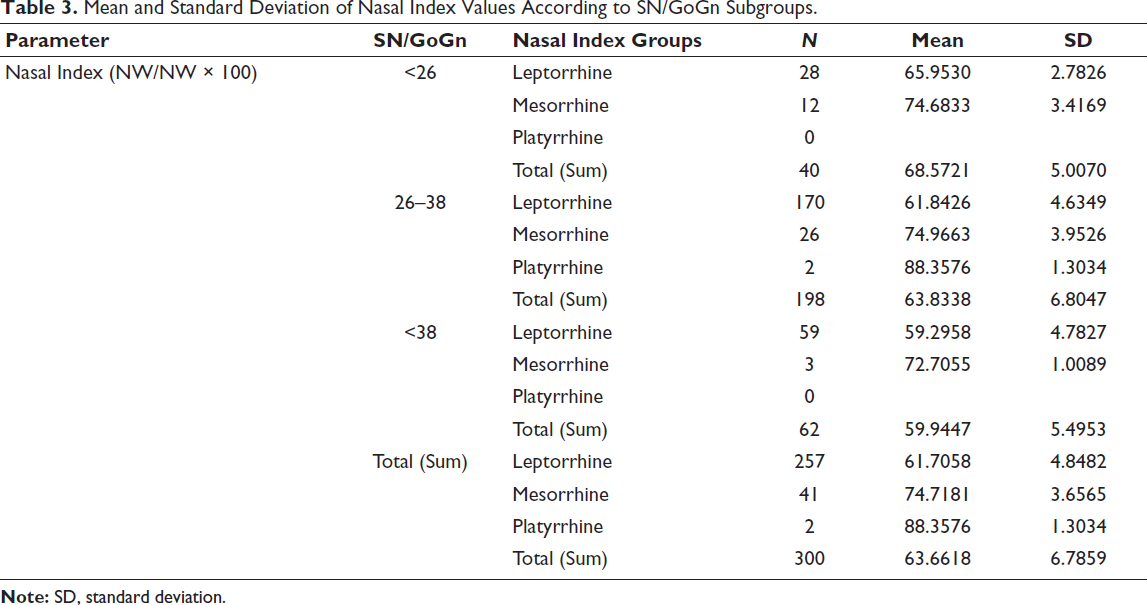
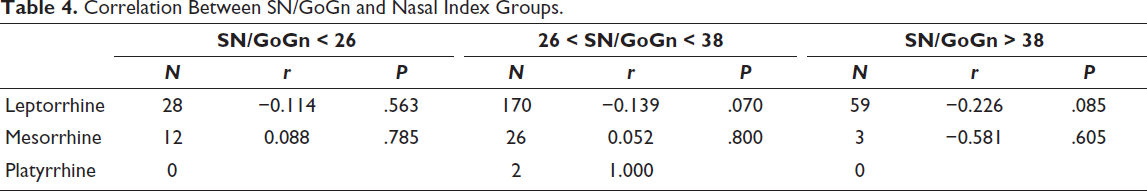
Table 3 presents the nasal index values for the sample group, classified by vertical growth pattern subgroups. There was no statistically significant correlation between the nasal index and vertical growth pattern, as classified by vertical growth pattern subgroups in Table 4 (P > .05).
Mean and Standard Deviation of Nasal Index Values According to SN/GoGn Subgroups.
Correlation Between SN/GoGn and Nasal Index Groups.
A negative linear correlation between nasal index and SN/GoGn angle was found in the leptorrhine group (<.01) when examining the vertical growth subgroup. However, no statistically significant correlation was observed in the mesorrhine group (>.05). The platyrrhine group was not included in the correlation coefficient due to the small sample size of only two individuals (Table 5).
Pearson Correlation in Nasal Index Groups **P < .001.
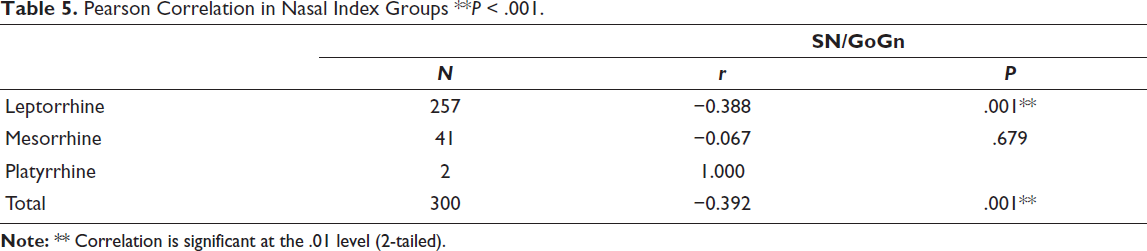
Table 5 shows a negative linear correlation between nasal index and SN/GoGn angle (<.01) when vertical development pattern and nasal index groupings were not considered.
Discussion
The study found that the leptorrhine nasal type was present in approximately 86% of individuals, while the mesorrhine nasal type was found in 13% and the platyrrhine nasal type was present in less than 1% of the sample. The leptorrhine nose type predominated, with nasal index values of 61.7 ± 4.8 in the leptorrhine group, 74.7 ± 3.6 in the mesorrhine group, and 88.3 ± 1.3 in the platyrrhine group.
The prevalence of the leptorrhine nose type in the sample group may be due to the long, narrow nasal structure that is common in the Turkish population, similar to Caucasians (Caucasian race), as well as the random selection process. In their study, Sparks and Jantz’s study demonstrated that the leptorrhine nose type, characterized by a narrow and long structure, is more common in Caucasian individuals. 8 The leptorrhine nasal type, with a nasal index of 69.9 or less is the most common nasal type in the European population. 9 Staka et al. found 67.33% and 86.40% for men and women, respectively, who exhibited the leptorrhine nose type, respectively. 10
A randomized study conducted on 50 students of Saveetha Dental College reported no occurrences of the platyrrhine nose type. The leptorrhine nose type was observed in 54% of the sample, while the mesorrhine type of nose was seen in 46% of the sample. These results are similar to our study. 11 However, in contrast to our study, Shrestha et al. found the mesorrhine type to be the most common in both genders in their study of 140 individuals. 2
Eliakim-Ikechukwu et al. reported that the platyrrhine nasal type was most common in their sample. 12 However, a sample of sufficient size is required to determine the incidence of the nasal index, although the small number of individuals with the platyrrhine nose type in our population is an expected finding. Our population had only a few individuals with this nose type, which was an expected result. Only two individuals in our sample group had a platyrrhine nose type, so it was not possible to use Pearson’s correlation test for this group.
Although the number of individuals in the mesorrhine and platyrrhine groups was limited (41 and 2, respectively), it is still possible to comment on their cephalometric features. In the mesorrhine group, the SN/GoGn angle ranged between 22.5°-45.5°, with an average of 29.3°, while the mean nasal index was approximately 74.7°. This nasal index falls within the typical mesorrhine range defined in the literature 70°-84.9°. For the platyrrhine group, despite a sample size of only two individuals, the nasal index reached 88.3 and the SN/GoGn angle was close to 29.9°, suggesting a potential association with a wider nasal base and moderate vertical growth. These values, although statistically limited, can serve as preliminary indicators for future studies focusing on these less-represented nasal types.
Bajracharya and Sharma found that nasal type was related to gender and ethnicity. 13 Farkas et al. reported that the nasal index varies with geography and climate. 4 Mohammed et al. found that males have a higher nasal index than females in their study on gender differences in the nasal index. 14 Singla et al. found a statistically significant relationship between nasal index and nasal length, as well as between nasal index and total facial height in the Jaunsari population. 15 Our study is the first to investigate the relationship between nasal structures and vertical growth patterns in individuals, regardless of race and gender.
The study found a negative linear relationship (P < .01) between the nasal index value and the SN/GoGn angle in the leptorrhine group, indicating that nasal width is directly correlated with the nasal index and reversed with nasal height.
The study showed that SN/GoGn is inversely proportional to nasal width and directly proportional to nasal height in individuals with leptorrhine nasal type. The correlation between the SN/GoGn angle and nasal index is similar to that observed in the leptorrhine group when the vertical development pattern and nasal index groupings were not considered (Table 4). The predominant part of our sample group consisted of individuals with a leptorrhine nasal type, which may have contributed to this outcome.
Due to the number of participants with mesorrhine and platyrrhine noses in this study, it is suggested that there is no correlation between nasal index and vertical development pattern in these groups. This may be considered a limitation of the study. Future studies should aim to increase the sample size and ensure a homogeneous distribution. Previous studies have reported a gender-dependent nasal index, but our study did not differentiate by gender. Future studies with a more balanced representation of mesorrhine and platyrrhine individuals may provide a more comprehensive understanding of craniofacial characteristics across different nasal index groups.
Conclusion
There is a meaningful relationship between the vertical growth pattern and nasal index in individuals with a leptorrhine nasal type. It is possible to evaluate nasal proportions during clinical examination before radiographs are taken. This evaluation can help physicians predict the patient’s vertical growth pattern and evaluate treatment options. However, it is important to note that this relationship may be limited in individuals with a leptorrhine nasal type.
Footnotes
Declaration of Conflicting Interests
The authors declared no potential conflicts of interest with respect to the research, authorship, and/or publication of this article.
Ethical Approval
The ethical clearance was granted by the Clinical Research Ethics Committee, Faculty of Dentistry, Ankara University for this study (Approval No: 36290600/22/2024).
Funding
The authors received no financial support for the research, authorship, and/or publication of this article.
Patient Consent
Verbal and written consent was obtained from 300 patients for the use of their records.