
Abstract
Objectives
This study aimed to determine the aesthetic preferences of profile silhouettes according to various soft tissue analyses commonly used in orthodontic practice.
Methods
For this observational study, lateral photographs were taken of two patients. Nasolabial and mentolabial angles were digitally altered in 20° increments, obtaining four photographic series, and a survey was carried out, recruiting 330 participants to evaluate their preferences according to these categories: very attractive, somewhat attractive, little attractive, and unattractive. The relationship between variables was evaluated using the chi-square test (χ2) and Cohen’s d (d) for effect size.
Results
Significant correlations were obtained between variables (p < .001; p < .05). Female participants, those 23-33 years old, graduates, and those from Health Sciences obtained a higher prevalence when choosing the most balanced facial profile. Differences in the nasolabial angle were more detected.
Conclusion
There was a tendency to prefer profiles with a more open nasolabial angle and a flatter mentolabial sulcus in women. The variables that proved to have the most influence were educational status and age.
Introduction
Modern society gives greater importance to physical appearance. 1 The main factor that contributes to a person’s attractiveness is the face. 2 Facial aesthetics can play an especially important role in interpersonal relationships, social inclusion, and self-esteem.3-5
Facial aesthetics can be defined as the appreciation of a person’s beauty and attractiveness. Perceptions of what is considered attractive are highly complex and differ among individuals, races, cultures, and geographic regions. 6
In a study conducted by Nobre et al. in Brazil, it was shown that maxillary biprotrusion is more accepted as it is considered a common racial characteristic in this population. 3 On the other hand, in Lima, Peru, the population considered a class I skeletal profile with a normal mandible and slight maxillary retrusion as the most attractive. 7
In a study carried out in China by Woo et al., profiles with bimaxillary retrusion were preferred in both men and women, rejecting protrusive profiles. 8 In Rome, most of the respondents preferred totally straight profiles. 9
Beauty has almost always been perceived as something subjective, sustained over the years by phrases such as Margaret Hungerford’s classic: “Beauty is in the eye of the beholder.” 6 On the other hand, some others like Feingold argue: “Contrary to the idea that beauty is in the eyes of whoever looks at it, there is generally a high agreement on who is attractive and who doesn’t.” 10
It has been shown that even before being exposed to cultural standards of facial attractiveness, children between 3 and 6 months of age show a preference for the same faces that adults consider attractive. Affirming with this that there is an innate biological component in humans when detecting beauty. 11
Comparing to ancient times, in modern culture, more convex profiles with fuller lips in women usually indicate youth and are more accepted. 12 This trend where labial protrusion is more accepted has a direct impact on the way of planning current treatments in orthodontics and orthognathic surgery.
Despite the subjectivity that usually surrounds the concept of beauty, there are certain rules of facial aesthetics that work as a general guide for treatment planning. The downside is that most of these standards were established in Caucasian populations, so they are not universally applicable to all races. Therein lies the importance of having studies of perception of aesthetics in the different regions.
Part of the objectives of an orthodontic treatment involves achieving the most harmonious profile possible, as well as reducing facial convexity, changes in the nasolabial angle, depth of the mental groove, and protrusion of the lips. 7
It is important that the orthodontist is aware of the preferences of the patient and of current society in order to take these points of view into account in their treatment plans, instead of basing everything only on their personal perspective or old concepts, which may differ from the patient’s.13, 14
Among the facial angles on which the orthodontist can make modifications are the nasolabial angle and the mentolabial angle. Special attention has been paid to the latter as part of facial harmony since ancient Greek sculptures. The sculptures of Doryphorus, Hercules, Hermes, and the Venus de Milo show more decreased mentolabial angles than what is dictated by the standards used in orthodontics. 15
The country where this study was carried out has a large amount of miscegenation and due to the large number of ethnic groups it has, the physical features of its inhabitants have many variations depending on the territorial area where they are. Specifically, in the northern zone, aesthetic perception has been scarcely studied.
This study seeks to determine which facial profile is the most attractive at the level of the nasolabial and mentolabial angles according to the perception of the people surveyed, also associating whether there is any relationship between the choice of a certain profile with age, sex, educational status, and area of studies.
Methods
This prospective study was conducted according to the principles of the Declaration of Helsinki. Two patients (male and female) were selected as models. Both patients were chosen based on the criteria that they had a normal nasolabial angle according to two authors: according to Legan and Burstone 16 (102° ± 8°), as well as Powell’s17, 18 (90–110°) and a mentolabial angle within the norm established by Nanda 19 (125.1° ± 12.9° in men and 127.1° ± 12.9° in women), as well as in Naini’s analysis 20 (115-145° in men and around 120-130° for women).
Two lateral photographs of both patients were taken with a distance of 2 m between the camera lens and the patient. Parameters used were f11, ISO 400, shutter speed (s) 1/125, and ring flash TTL. The patients were positioned in natural head position.
The images were modified using Adobe Photoshop (version 2022, Adobe Inc., San Jose, CA, USA). They were placed in black and white to eliminate the influence of skin color. They were cropped in front of the patients’ auricles to avoid bias due to the patients’ hairstyle or accessories. They were modified at 20° intervals so that changes could be sufficiently detectable to the participant’s eye.
Subsequently, a survey was carried out through Google Forms (Google LLC, Mountain View, CA, USA) in which the participants were asked to indicate their sex, age, educational status, and area of study. Four photographic series were shown with four photographs each (two series corresponding to the female patient and two series of the male patient). For each series, there was only one modified angle (nasolabial angle or mentolabial angle), in order not to create further confusion for the viewer. Likewise, the photographs were arranged indistinctly in each series to prevent the participant from detecting a logical pattern.
Below are the four photographic series arranged in the order in which they were shown to the survey participants (Figures 1–4).
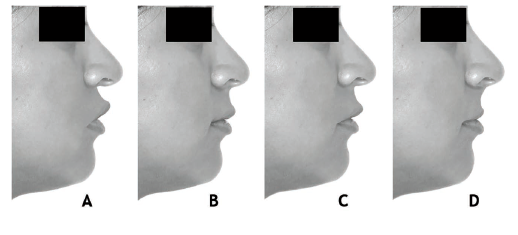
Photographic Series #1 showing the Changes at the Level of the Nasolabial Angle in the Female Model: A (55°), B (95°—Original Measurement of the Model), C (75°), and D (115°).
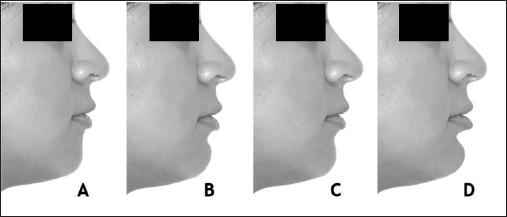
Photographic Series #2 showing the Modifications at the Level of the Mentolabial Angle in the Female Model: A (145°), B (105°), C (125°—Original Measurement of the Model), and D (85°).
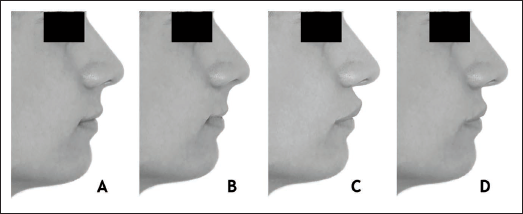
Photographic Series #3 showing the Changes at the Level of the Nasolabial Angle in the Male Model: A (105°—Original Measurement of the Model), B (125°), C (65°), and D (85°).
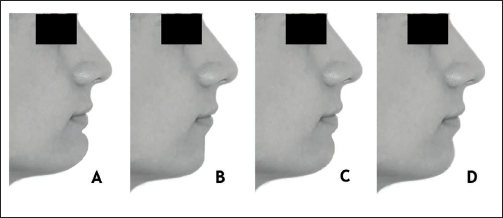
Photographic Series #4 showing the Modifications at the Level of the Mentolabial Angle in the Male Model: A (90°), B (150°), C (110°), and D (130°—Original Measurement of the Model).
A sample of 330 participants was obtained through non-probabilistic convenience sampling. The survey was applied to participants under the following inclusion criteria: (a) people who agreed to participate in the survey by giving their authorization; (b) people of both sexes; (c) students or graduates of the following study areas: Health Sciences; Education and Humanities; Art, Architecture and Design; Engineering and Technologies; Law and Social Sciences; Administration and Business; (d) between an age range of 16-75 years.
After the personal data section, the survey showed the section of the four photographic series, where each participant had to classify each photograph according to the following scale, without repeating any category: 1—very attractive, 2—somewhat attractive, 3—little attractive, and 4—unattractive. No time limit was applied.
Statistical Analysis
Data were analyzed using SPSS Statistics program (version 22.0, IBM Corp., Armonk, NY, USA). For the univariate analysis of the descriptive variables, measures of central tendency and dispersion were calculated for continuous variables, as well as percentages and frequencies for categorical variables. Regarding the bivariate analysis, the chi-square (χ2) test was used for the relationship of the categorical variables, calculating the data in two tails, in addition to measuring the effect size with Cohen’s d test (d). The p values of <.05 and <.01 were considered significant. A d value of >0.80 was used to indicate a large effect.
Results
The responses obtained from the surveys are distributed as follows: in the distribution by sex, 50.9% (n = 168) were women, and 49.1% (n = 162) were men. The ages corresponded to a range of 16-75 years old, divided into four categories: 16-22 (n = 119, 36.1%), 23-33 (n = 105, 31.8%), 34-50 (n = 51, 15.5%), and 51-75 (n = 55, 16.7%). Regarding the academic status of the participants, it was found that 44.8% (n = 148) were undergraduate students, and 55.2% (n = 182) were graduates. The following distribution was obtained from the study areas of the participants: administration and business 16.7% (n = 55), health sciences 16.7% (n = 55), education and humanities 16.7% (n = 55), art, architecture and design 16.7% (n = 55), law and social sciences 16.7% (n = 55), and engineering and technologies 16.7% (n = 55).
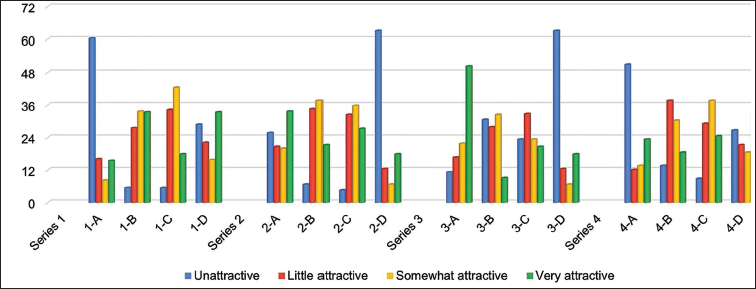
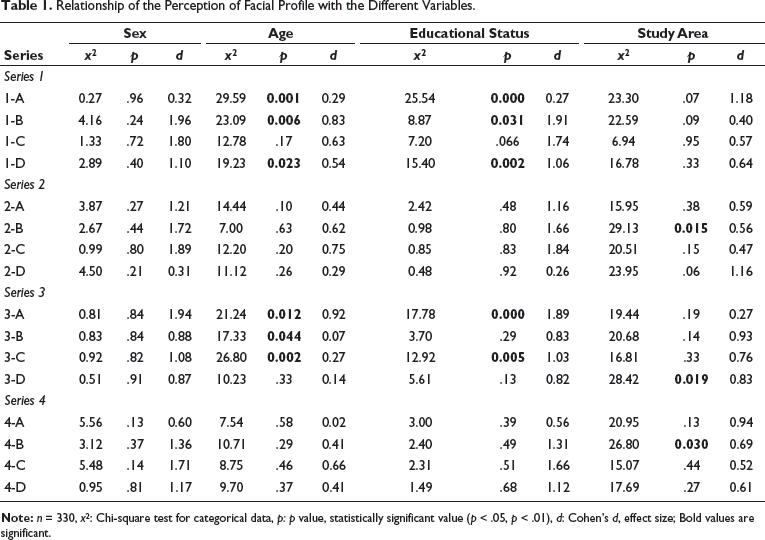
As general observations of the prevalence in the choice of facial profile (Figure 5), people detected differences in the nasolabial angle more easily in the profiles because, in three photographs of the two series where the nasolabial angle was modified, statistically significant differences were obtained (from series 1: 1-A, 1-B, 1-D, and from series 3: 3-A, 3-B, 3-C, and 3-D) (Table 1). On the other hand, the variables that proved to have the greatest influence on people’s decision to choose a certain profile were age and educational status according to the chi-square test, while the variables that showed the greatest effect according to Cohen’s d were sex and educational status. In six photographs, a statistically significant difference was obtained in the age variable, while in the educational status variable, significance was obtained in five photographs, also presented in Table 1.
Distribution of the Prevalence of the Choices of Each Facial Profile by the Participants According to the Photographic Series Number (Series 1-4).
Relationship of the Perception of Facial Profile with the Different Variables.
Taking into account the response of the 330 participants, in the female nasolabial angle (series 1) the majority chose the most harmonious profile (1B-95° nasolabial angle); however, it tied with the 1D option (115° nasolabial), which means that people do perceive a normal nasolabial angle as attractive according to orthodontic standards, but they could also be inclined to choose profiles with slightly more open nasolabial angles for women. In the female mentolabial angle (series 2), most of the participants chose profile 2A (145°), whereas the correct one according to the norm was 2C (125°). This suggests that people might prefer flatter mentolabial angles for the female population.
In the male nasolabial angle (series 3), the majority chose the standard profile: 3A of 105°, adhering to what the facial analysis standards dictate. In the male mentolabial angle (series 4), most of the participants chose the appropriate profile based on the norms (4D of 130°).
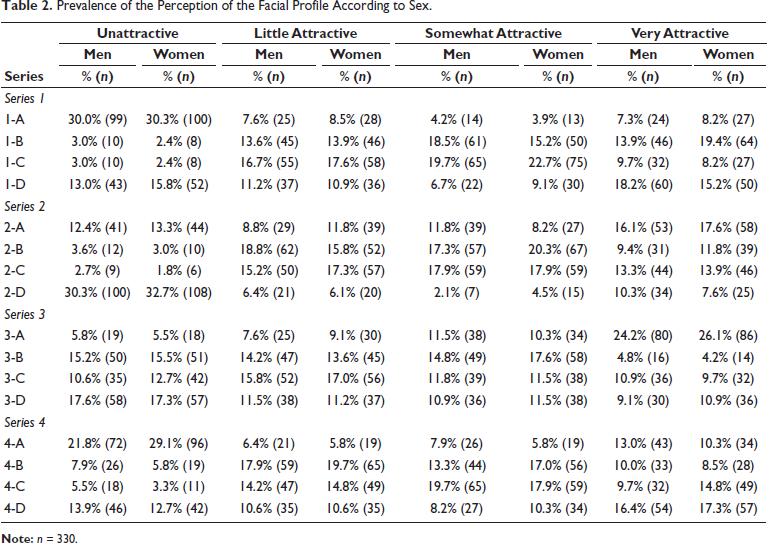
According to the study variables, the female gender had a higher prevalence when choosing the normal facial profile as very attractive in three of the four series (1-B, 3-A, and 4-D). However, there was no statistically significant association. In series 1, 19.4% of women versus 13.9% of men chose the appropriate profile (B) in the “very attractive” category. In series 3, 26.1% of women versus 24.2% of men perceived the standard profile (A) as “very attractive,” and in series 4, 17.3% of women were correct in selecting the appropriate profile (D), also marking it in the category “very attractive,” while men chose it in 16.4% (Table 2).
Prevalence of the Perception of the Facial Profile According to Sex.
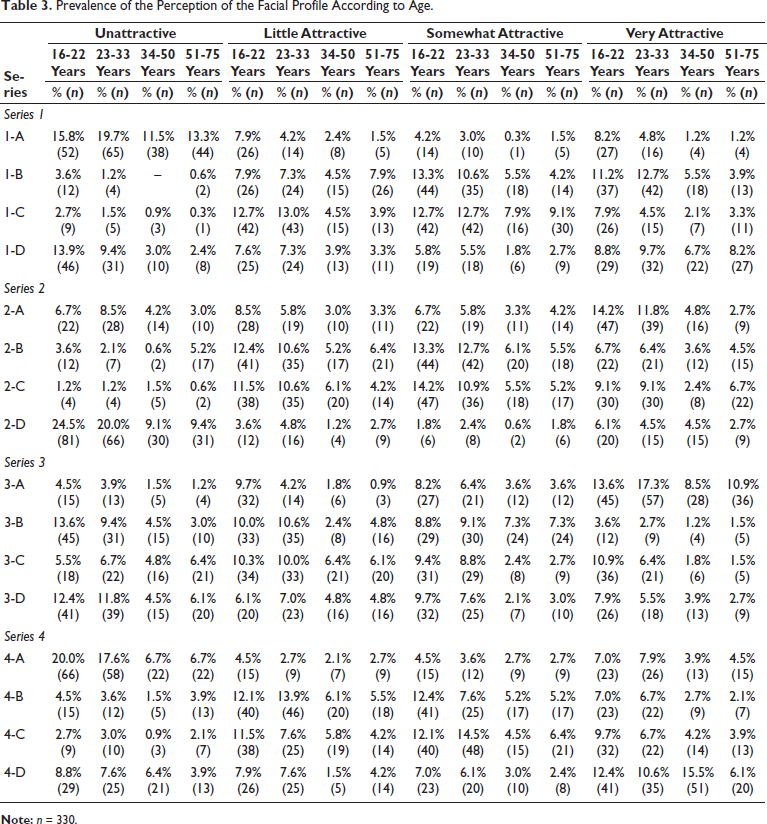
In the second variable analyzed, age, the age range of 23-33 years was correct in choosing the most balanced profile in two of the four series (1-B and 3-A). In series 1, the 23-33 group was correct in choosing the standard profile (1-B) in the “very attractive” category in a greater proportion (12.7%), obtaining a significant difference (p < .01). In series 2, respondents aged 51-75 selected the standard profile (2-C) in a higher proportion than the other age ranges, 6.7% in the “very attractive” category. Similarly, participants aged 23-33 obtained the highest prevalence (17.3%) by choosing the correct profile in series 3 (3-A) as the most attractive and obtaining a statistically significant association (p < .05). In series 4, the group of 34-50 years obtained the highest prevalence when choosing the 4-D profile as “very attractive” in 15.5% (Table 3).
Prevalence of the Perception of the Facial Profile According to Age.
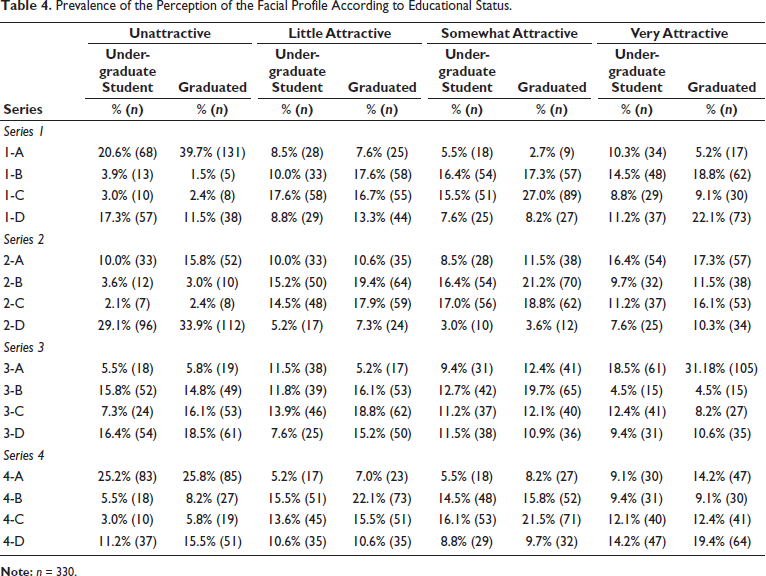
Regarding the third variable, educational status, the graduates obtained the highest prevalence when selecting standard facial profiles in three of the four photographic series (1-B, 3-A, and 4-D). It was found that in series 1, the group of students perceived profile 1-B (the adequate one according to the norm) as “very attractive” by 14.5%, obtaining a statistically significant difference (p < .05). On the other hand, the graduates obtained a higher prevalence: 18.8% when choosing this option (1-B) as “very attractive.” In series 2, neither the graduates nor the students selected the standard profile (2-C) as their favorite; it was instead the 2-A profile that was accepted as “very attractive,” that is, they preferred a flatter mentolabial angle (145°). In series 3, the graduates obtained the highest prevalence (31.18%), choosing option 3-C (the correct one) within the “very attractive” category, also obtaining a significant association (p < .01). In series 4, 19.4% of graduates indicated that the 4-D option (right according to norm) was the most attractive at 19.4% (highest prevalence) (Table 4).
Prevalence of the Perception of the Facial Profile According to Educational Status.
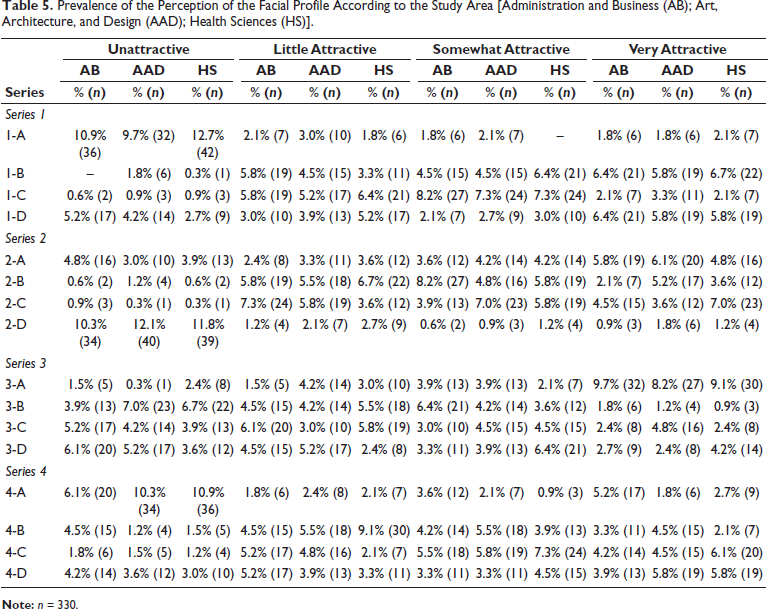
The fourth variable was the area of study (Tables 5 and 6). In series 1, of the six study areas, the area that selected profile 1-B (the correct one according to the norm) as “very attractive” in the highest prevalence (6.7%) was Health Sciences, being the only profile they selected within this category. It was possible to observe that in addition to the standard profile (1-B of 95°), the other profile that was well accepted was 1-D (115°), that is, people accept a slightly increased nasolabial angle more than those who are very diminished.
Prevalence of the Perception of the Facial Profile According to the Study Area [Administration and Business (AB); Art, Architecture, and Design (AAD); Health Sciences (HS)].
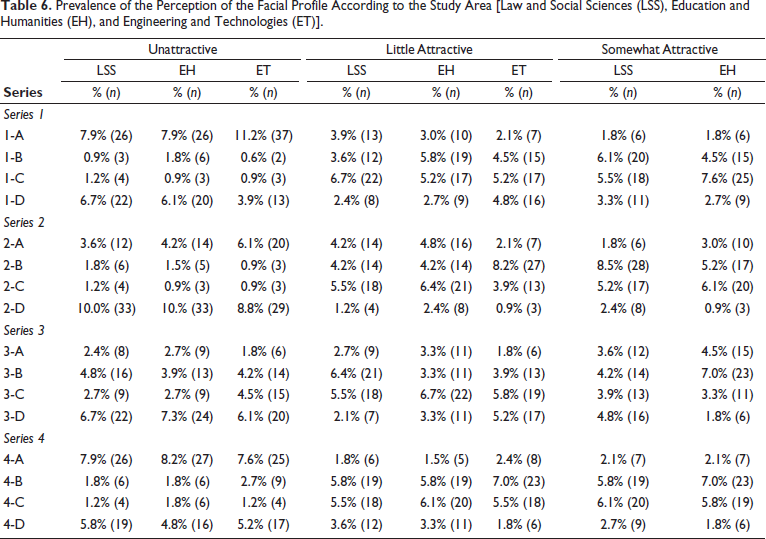
Prevalence of the Perception of the Facial Profile According to the Study Area [Law and Social Sciences (LSS), Education and Humanities (EH), and Engineering and Technologies (ET)].
In series 2, only Health Sciences selected the profile of the facial norm (2-C, mentolabial angle 125°) as “very attractive” in the highest prevalence (7.0%). But the profile most widely accepted by other areas was 2-A (mentolabial angle of 145°), that is, people could come to accept a flatter mentolabial angle as more aesthetic than those that are excessively closed.
In series 3, of the six areas, business and administration chose the most balanced profile in accordance with the standard (3-A) with a higher prevalence of 9.7%. The other areas also selected 3-A as “very attractive” but to a lesser extent than people from administrative careers.
In series 4, the engineering and technologies area, followed by education and humanities, were the ones that were most successful when choosing a balanced mentolabial angle in the male model according to norm (4-D). Getting the highest prevalence in the “very attractive” category: 7.0% and 6.7%, respectively.
Discussion
This study attempted to identify the influence of sex, age, educational status, and area of studies in the choice of a certain facial profile.
Based on the results, the fact that the female gender was able to distinguish, in most series, the profile that was found in norm could indicate that women have a greater degree of perfectionism regarding aesthetic standards. Our results could be compared with those obtained in a study by Yarosh, in which it is mentioned that women have more awareness when judging an attractive face than men. Evidencing a higher cognitive load when processing attractive faces. 21 Another study by Zaugg reveals that gender is a key factor in the perception of orofacial aesthetics, in which it was found that men, in general, were more satisfied with their appearance than women. 22
Regarding age, respondents between 23 and 33 years old chose the most harmonious profile according to orthodontic standards in two of the four series. In a study by Dudea, in which the demand of people to improve their appearance is evaluated, it was found that the most demanding group in improving their physical aspects was the one of 20-30 years old. As age increased, the interest decreased. 23
Parsa comments in his study of esthetic perception in women after undergoing rhinoplasty that observers between 25 and 34 years of age indicated an improvement in the physical characteristics of these women in a greater proportion, reaffirming how this group gives special importance to facial aesthetics. People older than 55 years did not report increased attractiveness, emphasizing that this age group is more assertive of issues of personality, rather than an aesthetic ideal. 24
The fact that graduates have had a better perception when distinguishing a balanced face may be due to the fact that being already immersed in a job with high demands makes people worry more about their appearance. As Kusuma mentions, after age and gender, people’s physical appearance is the third most important factor of discrimination in job advertisements (18.42%). 25
Papio and Mantelakis mention that it is usual among society to have the belief that those people considered by society as physically attractive are destined to achieve the best in life, referring precisely to the most prestigious jobs, to be more secure of themselves, marry at the ideal age with the best partners, and generally lead fuller and happier lives than those who are less attractive.26, 27
From the results obtained from the fourth variable, health sciences were correct in choosing the standard profile in the first two series, which can be associated to the fact that these professions have high deductive and critical reasoning and are used to the constant interpretation of findings in their diagnoses, in order to make decisions and establish principles of action for their practice. 28
Administration and Business professionals, as well as engineering and technology were also very successful when choosing the most balanced profile in the last two series. This could be explained because these people are used to making right decisions quickly, interpreting data, and being good analysts to issue conclusions.29, 30
The findings of this study cannot be applied to the entire population of the country since the application of the study was limited to a certain region.
Conclusion
There was a tendency to choose profiles with a slightly more open nasolabial angle in women, as well as a flatter mentolabial angle also in women.
In both series of the male model, most participants correctly chose the profiles that showed a normal nasolabial and mentolabial angle according to the norm as the most attractive.
The variables that proved to have the most influence when choosing the standard facial profile were educational status and age.
Footnotes
Acknowledgments
The authors thank the Department of Orthodontics of the Faculty of Dentistry of the Autonomous University of Coahuila, Torreon Unit, for facilitating the use of its facilities to carry out this study.
Declaration of Conflicting Interests
The authors declared no potential conflicts of interest regarding the research, authorship, and/or publication of this article.
Ethical Approval
Not required due to the fact that the study was not a clinical trial.
Funding
The authors received no financial support for the research, authorship, and/or publication of this article.
Informed Consent
Signed informed consent was obtained from both patients.