
Abstract
Objective
To correlate the sagittal hard tissue movement and soft tissue changes among patients with skeletal class III malocclusion following bimaxillary orthognathic surgery.
Material and Methods
Fifty-nine subjects with skeletal class III malocclusion treated consecutively with maxillary advancement and mandibular setback were assessed for skeletal and soft tissue linear changes using presurgical (T1) and post-treatment (T2) lateral cephalograms. Pearson’s correlation coefficient test was used to correlate hard and soft tissue parameters.
Results
The sagittal hard tissue movement and soft tissue changes for all the parameters assessed in maxilla and mandible showed statistically significant correlations. The ratios of changes for the maxillary protrusion [N-A (HP)] to horizontal subnasale (Sn), superior labial sulcus (Sls), and labrale superioris (Ls) were 0.574:1, 0.703:1, and 0.721:1 respectively. The ratio of horizontal labrale inferioris (Li), mentolabial fold (Mlf), and soft tissue (Pg′) to mandibular protrusion [N-B (HP)] were 0.992:1, 0.970:1, and 0.590:1 respectively and to chin protrusion [N-Pg (HP)] were 1.293:1, 1.252:1, and 1.001:1, respectively. The ratios were different for males and females in maxilla and mandible.
Conclusion
Sagittal hard tissue movement and soft tissue changes are significantly correlated. The soft tissue movement in the mandible were more proportionate compared to the maxilla. The sagittal hard tissue to soft tissues movement ratios were greater in maxilla and lesser at pogonion and mentolabial sulcus in females compared to males. The ratios obtained can be used for predicting postsurgical soft tissue changes.
Keywords
Introduction
India is a large country with diverse ethnicities. There are differences in the cephalometric norms not only compared to the Caucasian population but also among the north, central, east, and the South Indian population.1–3 The soft tissue paradigm places greater emphasis on facial soft tissue profile, which is important for the diagnosis and treatment planning of combined orthodontic-surgical procedures. 4 The ratios representing soft tissue profile changes relative to the surgical movement form the predicting data and assist in planning orthognathic surgery. 5 Two-dimensional analysis with conventional lateral cephalogram, optical laser surface scanner, 6 stereo photogrammetry with two or more cameras 7 and computer tomography-assisted imaging for three-dimensional analysis are among the various methods to quantitively evaluate the soft tissue profile.7, 8 The inherent problems of prediction based on these data are the large racial variability’s in soft tissue response, differences in age and gender and technical inaccuracies while generating data for the prediction. 9 Several studies10–13 have quantified the facial soft tissue changes and ratio of soft- to hard-tissue changes after orthognathic surgery in skeletal class II and skeletal class III patients; however, none have done so for the Indian population.
A smaller sample size has also been a limitation in previous European and American studies.11, 13, 14 Although few studies have evaluated the soft tissue profile changes in the Indian population,13, 15, 16 no study has evaluated ratios of soft tissue to hard tissue changes in skeletal class III subjects. Parappallil et al. 16 evaluated the correlations after bimaxillary surgeries in skeletal class III patients, but the ratios of the sagittal soft to hard tissue (S:H) changes were not calculated.
The cephalometric norms for different populations in literature show significant differences in soft tissue profile, facial convexity, and vertical cephalometric parameters among the Caucasian, South Indian, and North Indian population.17–19 The relative ratio of S:H changes after orthognathic surgery also may not be similar for different populations due to differences in ethnicity and should not be used interchangeably for predicting surgical outcome.17, 18 Thus, the purpose of the present study was to evaluate and correlate the sagittal hard and soft tissue changes and the ratios of the sagittal S:H changes following LeFort-1 advancement and bilateral sagittal split osteotomy (BSSO) mandibular setback in skeletal class III patients and also as a function of gender in the North Indian population.
Material and Methods
This observational study was undertaken after the ethical clearance from the institutional ethics committee (NK/3749/MDS/971) of the Postgraduate Institute of Medical Education and Research. The lateral cephalograms of consecutively treated 59 patients, who were natives of North Indian states (Delhi, Haryana, Himachal Pradesh, Punjab, and Uttar Pradesh) and completed their combined orthodontic and orthosurgical treatment during the period from 2016 to 2018, were enrolled based on the following inclusion criterion: Skeletal class III patients with pretreatment ANB < 0°, Wits < –1 mm, and FMA < 30°, and managed with maxillary LeFort-1 advancement and mandibular setback (BSSO) surgery after presurgical decompensation. The patients with cleft lip and/or palate, marked skeletal asymmetry, syndromic patients, postsurgical orthodontic treatment not completed, poor quality or incomplete records, and different ethnic backgrounds (from Jammu and Kashmir, Ladakh, and Kinnaur district of Himachal Pradesh) were excluded from the study. All the patients were operated for orthognathic surgeries by the same surgeon. No other surgical procedures, namely, genioplasty, rhinoplasty, or maxillary impactions, were undertaken in the included subjects. The intermediate and final splints for all the patients were fabricated after facebow transfer and simulating the surgical movement of jaws on a fully adjustable SAM III articulator. The third molars in all the patients were extracted 6 months before surgery, as per the protocol of the department. Decompensation of maxillary arch was achieved with the extraction of first premolars in all cases, except in one case where extraction of the maxillary left lateral incisor was undertaken, as maxillary right lateral incisor was already missing.
Cephalometric Analysis
The lateral cephalograms were evaluated at two observation periods: Presurgical (T1) and posttreatment (T2). The lateral cephalograms were taken by the same digital cephalometric machine (Carestream 8000C, Rochester, NY) and were traced manually on standard acetate paper. The linear and angular soft tissue measurements and hard tissue cephalometric analysis were based upon the study reported by Mobarak et al. 20 and are illustrated in Figure 1. Linear horizontal measurements were made from perpendicular to plane 7° to sella-nasion plane. The ratio of S:H was calculated as shown in Figure 1:
Various Soft- and Hard-tissue Cephalometric Parameters and Soft to Hard Tissue Movement Ratios.
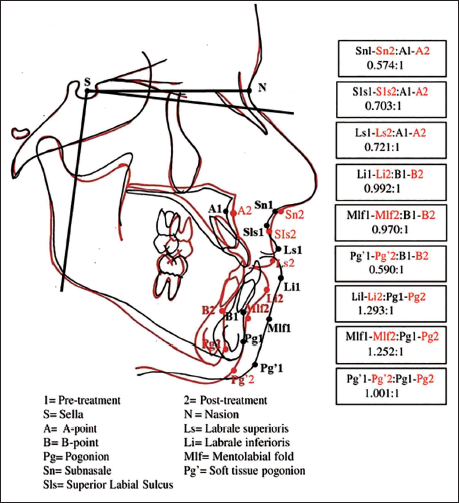
T1–T2 (presurgical to post-treatment mean changes) soft tissue changes.
T1–T2 (presurgical to post-treatment mean changes) hard tissue changes.
Blinding
The identifiable information on all lateral cephalograms was concealed, and these were marked with computer-generated codes to avoid bias. The measurements at different time intervals were decoded by the statistician for statistical analysis.
Measurement Error and Reliability
A single examiner was trained and calibrated for cephalometric analysis by comparison of measurements to an experienced orthodontist. He performed all the registrations, landmarks identification, and measurements. For interobserver reliability, 10% of randomly selected lateral cephalograms were retraced by the same examines after 3 weeks. The measurement errors were calculated for all the cephalometric parameters studied. The intraobserver reliability was assessed using the intraclass correlation coefficient and was found to be satisfactory with a value range from 0.728 to 1.000.
Statistical Analysis
Standard statistics were carried out using Statistical Package for Social Sciences (SPSS software, IBM, version 22.0, Chicago, IL). All the data were recorded on a specially prepared proforma, and descriptive data were for intragroup comparisons. The Kolmogorov–Smirnov test was used to assess the distribution of data, and paired t-test was used to compare the means at two time intervals.
Pearson’s correlation coefficient test was used to correlate hard and soft tissue parameters. The relationship of soft tissue to hard tissue changes (T1–T2) was analyzed by using regression analysis. The level of significance was set at α = 0.05.
Results
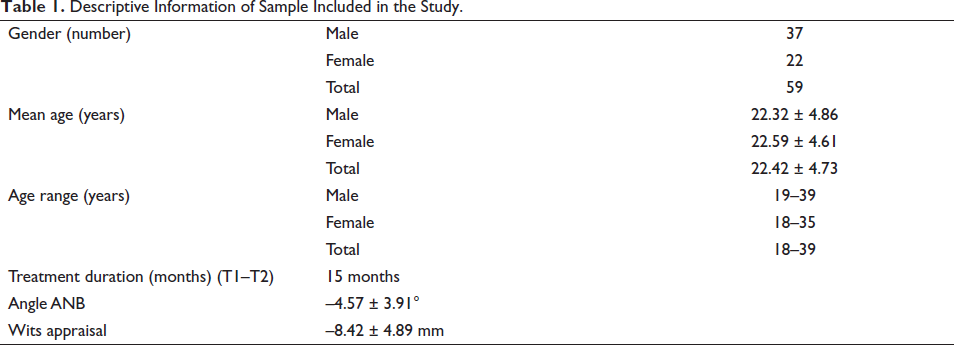
The total sample included 37 males and 22 females with an average age of 22.42 ± 4.73 (18–39 years). The mean duration of time interval at T1–T2, angle ANB and Wits appraisal are shown in Table 1. The mean sagittal hard and soft tissue changes, the correlations of hard tissue movement to soft tissue changes and the estimated ratios for the combined total sample are presented in Table 2. The mean horizontal linear changes in the hard tissue parameters point A, point B, and Pg and soft tissue parameters Sn, Sls, Ls, Li, Mlf, and Pg′ in reference to N perpendicular were statistically highly significant.
Descriptive Information of Sample Included in the Study.
Correlation Between Hard Tissue Movement and Soft Tissue Changes in Skeletal Class III (N = 59) Subjects from Presurgical to Posttreatment (T1–T2).
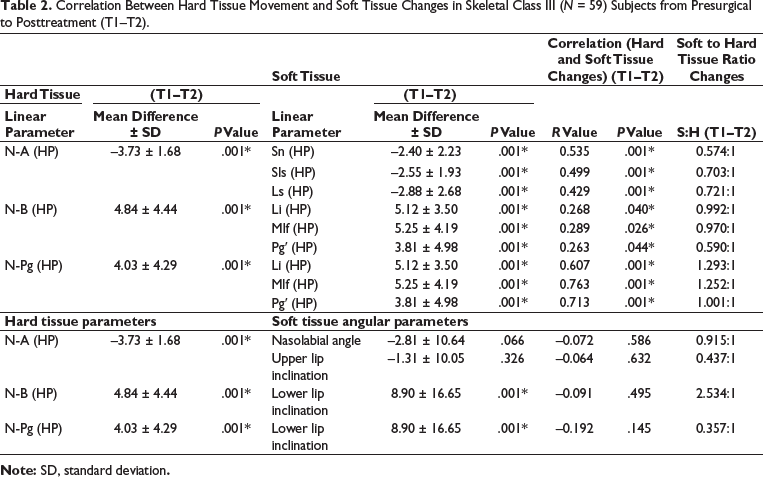
The correlation between mean changes at hard tissue points, point A to Sn, showed a strong association, which was statistically significant. Soft tissue points Sn, Sls, Ls, Li, Mlf, and Pg′ showed strong association with hard tissue changes at point B and Pg, which were statistically significant. The ratio of hard tissue movement to soft tissue changes for overall sample, horizontal Sn, Sls, and Ls to maxillary protrusion [N-A (HP)] were 0.574:1, 0.703:1, and 0.721:1 respectively. The ratio of mean changes in soft tissue measurements horizontal Li, Mlf, and Pg′ following hard tissue movement were 0.992:1, 0.970:1, and 0.590:1 respectively for mandibular protrusion and 1.293:1, 1.252:1, and 1.001:1 respectively for chin protrusion [N-Pg (HP)] as depicted in Figure 1. The mean changes in soft tissue angular parameters, nasolabial angle and upper lip inclination were statistically nonsignificant, and correlation to [N-A (HP)] was weak.
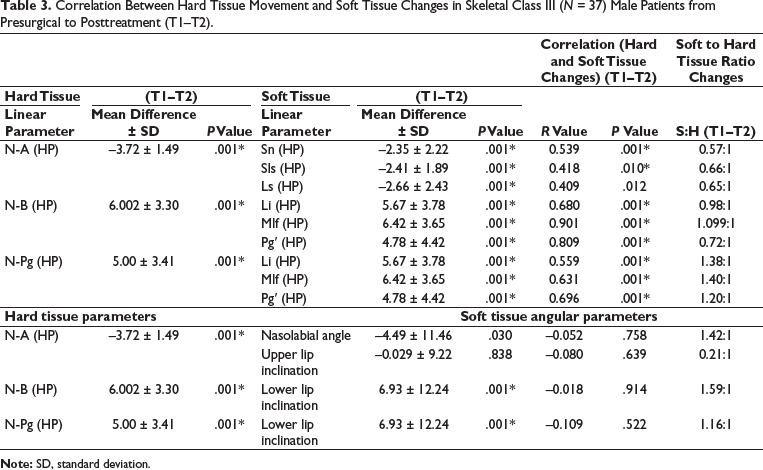
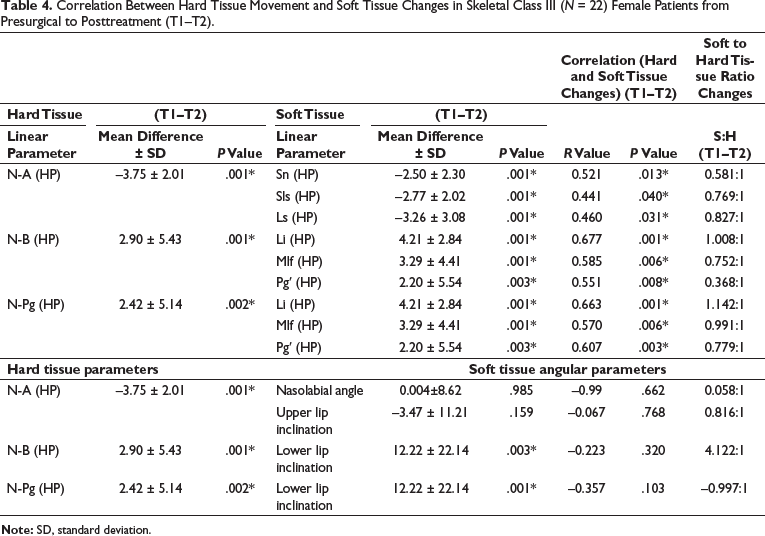
Tables 3 and 4 show the correlation between linear hard tissue movement and soft tissue changes in male and female patients, respectively. The mean horizontal linear changes in the hard tissue parameters point A, point B, and Pg and soft tissue parameters Sn, Sls, Ls, Li, Mlf, and Pg′ in reference to N perpendicular were statistically highly significant for both males and females. The mean changes in nasolabial angle and upper lip inclination were nonsignificant in both genders. The lower lip inclination showed statistically highly significant changes at time interval T1–T2, but the correlations to mandibular protrusion [N-B (HP)] and chin protrusion [N-Pg (HP)] were weak and nonsignificant in both male and female patients.
Correlation Between Hard Tissue Movement and Soft Tissue Changes in Skeletal Class III (N = 37) Male Patients from Presurgical to Posttreatment (T1–T2).
Correlation Between Hard Tissue Movement and Soft Tissue Changes in Skeletal Class III (N = 22) Female Patients from Presurgical to Posttreatment (T1–T2).
Discussion
The present study evaluated the S:H changes following bijaw orthognathic surgery among patients with skeletal class III malocclusion. The estimated prevalence of this dentofacial deformity among South Indian population was only 2% of the examined population and had shown more predilection in male (4%) than female (1.3%). 21 In another study by Singh et al., 22 a prevalence rate of 3.17% was found among North Indians seeking orthodontic treatment. However, the prevalence of class III malocclusions has been estimated to be approximately 1–5% in white populations.23, 24 The skeletal class III malocclusion can be a result of pure mandibular prognathism or maxillary hypoplasia and retrognathism, or a combination of the two. The probable etiology of skeletal class III malocclusion has been attributed to both familial or heredity, as well as environmental factors. The familial nature of mandibular prognathism as reported by Wolff et al. 25 in their analysis of the Hapsburg family. Environmental factors that influence the class III malocclusion include habits, enlarged tonsils, chronic mouth breathing leading to downward and backward growth of mandible, abnormal tongue and mandibular posture, endocrine disturbances posture, trauma, and nasal blockage. 26 An anterior crossbite and a mild skeletal class III malocclusion in the mixed dentition can be corrected with a variety of treatment approaches, including removable appliances, partial fixed appliances, orthopedic chincup, and facemask for a short duration. Correction of the anterior crossbite should be carried out as soon as it is detected to maximize the orthopedic effects. 27 The treatment modalities for a skeletal class III malocclusion are varied and depend on whether the growth has completed or not. The orthopedic jaw correction using facemask therapy, chincup and functional appliances (Reverse Twin Block, FR-3) is done during active growth period. The camouflage and surgical treatment are the mainstay of management among nongrowing class III patients. The complications associated with orthognathic surgeries in descending order are nerve injuries (50%), followed by temporomandibular disorders (14%), hemorrhage (9%), auditory concerns and infection (7%), and relapse (4%). 28
The soft tissue changes were evaluated after an average period of 15 months (range: 12–18 months) postsurgically on completion of orthodontic treatment; so, there was no effect of swelling or edema, and the results may be considered stable to an extent for clinical use. The correlation of S:H changes was calculated at time intervals T1–T2 to avoid the influence of soft tissue changes due to presurgical decompensation. The presurgical to postsurgical cephalometric changes showed a significant forward horizontal movement of upper lip soft tissue parameters: Subnasale, superior labial sulcus, and labrale superioris. These corresponded to the surgical hard tissue changes and are similar to changes observed in previous studies.29–32 Strong correlations were found between the soft tissue and hard tissue changes after orthognathic surgery (T1–T2). Similar correlation between S:H to changes after bimaxillary surgery for skeletal class III were also shown by Parappallil et al., 16 but the ratio of the S:H changes was not evaluated. No other study has estimated the correlations or the ratios of the S:H changes following maxillary advancement and mandibular setback surgery for Indian population.
The ratio of horizontal S:H changes in the maxilla measured at subnasale and labrale superioris to point A following bimaxillary surgery was 0.574:1 and 0.721:1 respectively, which are slightly higher compared to the previous studies on different populations.31–35 The ratio of horizontal hard tissue movement to soft tissue changes in skeletal class III following bimaxillary surgery, measured at subnasale to point A in a study by Al-Gunaid et al., 34 was 0.36:1, whereas subnasale and labrale superioris to point A by Altug-Atac et al. 30 were 0.40:1 and 0.61:1. The ratio of hard tissue movement to soft tissue changes in the mandible at mentolabial fold with hard tissue pogonion was 1:1 by different authors,31, 34–36 and S:H pogonion was 0.91:1 and 1.01:1 and was similar to the present study.35, 37
The proportion of soft tissue movement in maxilla is less, probably because of the stretching of the tissues and decrease in thickness of the tissue. Bays et al. 38 reported upper lip compression and thinning as a result of anterior repositioning of the maxilla. It has also been suggested that thin lips tend to follow the hard tissue more closely than thick lips.36, 39 The comparatively increased ratios in the present study may have been contributed by the presurgical decompensation accomplished by premolar extractions in all included cases. The ratios show a more proportionate movement of the mandibular soft tissue corresponding to surgical movements compared to the maxilla. Thus, the mandibular movement contributes more to the improvement in profile and should be considered in borderline cases. The ratios for males and females were calculated separately, and there are some differences which may be contributed by the differences in the soft tissue thickness between male and female patients. The ratios were calculated separately for males and females. The ratio of maxillary advancement to soft tissue movement shows increased ratios in females compared to males. The ratios of soft tissue movement in relation to mandibular setback movement are lesser in females; thus, the proportion of expected movement at soft tissue pogonion and mentolabial sulcus after mandibular setback is lesser in females compared to males.
The ratios presented are specific for male and female patients the North Indian population. They may be helpful in the prediction of soft tissue changes after planned skeletal movements and can improve the treatment planning of orthosurgical patients in the concerned population.
Conclusion
The sagittal hard tissue movement to soft tissue changes showed strong and statistically significant correlations for both the upper and lower lip. The ratios showed a more proportionate movement of the mandibular soft tissue corresponding to surgical movements compared to the maxilla. The ratio (H:S) was higher in maxilla and lower at pogonion and mentolabial sulcus in females compared to males after surgery. The (H:S) ratio obtained from the present study can be successfully used for predicting postsurgical soft tissue changes in patients planned for orthognathic surgery in the North Indian population.
Footnotes
Declaration of Conflicting Interests
The authors declared no potential conflicts of interest with respect to the research, authorship, and/or publication of this article.
Ethical Approval
The study was undertaken after the ethical clearance from the institutional ethics committee of the Postgraduate Institute of Medical Education and Research (NK/3749/MDS/971).
Funding
The authors received no financial support for the research, authorship, and/or publication of this article.
Informed Consent
An informed and written consent was taken from all the participants for inclusion in research.