
Abstract
Introduction
Exploring the relationship between arch dimensions and crowding has long been a topic of interest. Many studies have found significant relationship between the two, while others have suggested that crowding is a multifactorial condition and is not dependent on arch dimensions only.
Objective
To evaluate the relationship as well as sexual dimorphism between maxillary and mandibular skeletal base lengths with dental crowding in different skeletal malocclusions.
Materials and Methods
The sample comprised 100 orthodontic patients (49 males, 51 females), which were divided into three groups based on the anteroposterior relationship of maxilla with the mandible. Each group was subdivided based on the severity of mandibular and maxillary arch crowding into two subgroups, and each subgroup was further divided into male and female subjects. Measurements of maxillary and mandibular base lengths (Co-A and Co-Gn) and tooth size arch length discrepancies were obtained through lateral cephalograms and dental casts, respectively, and measurements obtained were analyzed statistically.
Results
Patients with class IB, IIB, and IIIB had significantly smaller maxillary and mandibular base lengths than subjects with class IA, IIA, and IIIA. A weak negative correlation was found between maxillary base length and maxillary crowding with r = –0.451 and p = .000, while a strong positive correlation was observed between maxillary and mandibular crowding with r = 0.742 and p = .000.
Conclusion
An inverse correlation exists between dental crowding and the lengths of maxillary and mandibular bases, regardless of skeletal malocclusion.
Introduction
The most frequent malocclusion that inspires patients to seek orthodontic treatment is crowding. Dental crowding is typically described as a misalignment between the size of the teeth and the size of the dental arch, leading to teeth being positioned incorrectly and/or rotated. 1 Nance described dental crowding as a space discrepancy between the space needed in the dental arch and space available in that arch. 2
Crowding can result from certain hereditary and environmental factors. It is often attributed to the belief that the jaws are too small to accommodate the teeth, despite its multifactorial nature. 3 Various factors are believed to influence the progression and intensity of crowding, including tooth size-arch length discrepancy, mandibular growth direction, inclination of incisors and molars, as well as musculature around the mouth and lips. 4 Dental crowding has been basically related to dental arch width and length, mesiodistal tooth diameter, aging of dentition, mesial drift, soft tissue pressures, and dental proportions. 5 Some authors have suggested incisor inclination in mixed dentition to be another contributing factor toward crowding, while others have found strong association with eruption of third molars. Many studies have examined factors related to dental arch crowding, including skeletal, dental, and soft tissue aspects. 6 An important factor to consider in the evaluation of dental crowding is not only tooth size and transverse arch dimensions but also effective apical base length of maxilla and mandible. Consequently, it is essential to consider the base length when planning treatment. Therefore, all the factors that contribute to crowding should be investigated thoroughly before devising an orthodontic treatment plan. 7
Selection of an appropriate treatment approach may depend upon which factors influence crowding. 8 Several studies have been conducted to analyze contributing factors and the relationship between them. According to Sakuda et al., late lower arch crowding results from a particular growth pattern and skeletal structure that is prone to crowding at the onset of adolescence. 9 Turkkahraman and Sayin studied patients in the early mixed dentition with class I facial pattern, comparing those with or without anterior crowding. They found that patients with incisor crowding had shorter maxillary and mandibular lengths. Dhopatkar et al., in their study, found that the maxillary length is increased in class II malocclusions and the mandibular length is greater in class III. 10
Investigators have shown interest in the relationship between arch dimensions and crowding, with some studies reporting a correlation while others finding no association. Limited research has focused on assessing the connection between crowding and maxillary and mandibular base lengths. Therefore, this study aimed to examine the relationship of maxillary and mandibular skeletal base lengths with dental crowding in different types of skeletal malocclusion.
Materials and Methods
The study was carried out on individuals who sought orthodontic treatment at the department. Approval for the study was acquired from the institutional research ethical committee under reference no. HDC/ethical/ortho/2018/13. Prior to the study, all patients were provided written informed consent. Sample size was determined using statistical analysis based on pilot study, leading to the selection of 100 patients who met the specified inclusion and exclusion criteria.
Inclusion Criteria
Skeletal class I, II, and III malocclusions.
Fully erupted permanent teeth up to first molars.
Absence of open bite or crossbite.
Absence of dental anomalies of number, size, form, and position.
Exclusion Criteria
Absence of proximal decay or restorations.
Any prior history of orthodontic treatment.
Any craniofacial anomalies or syndromes.
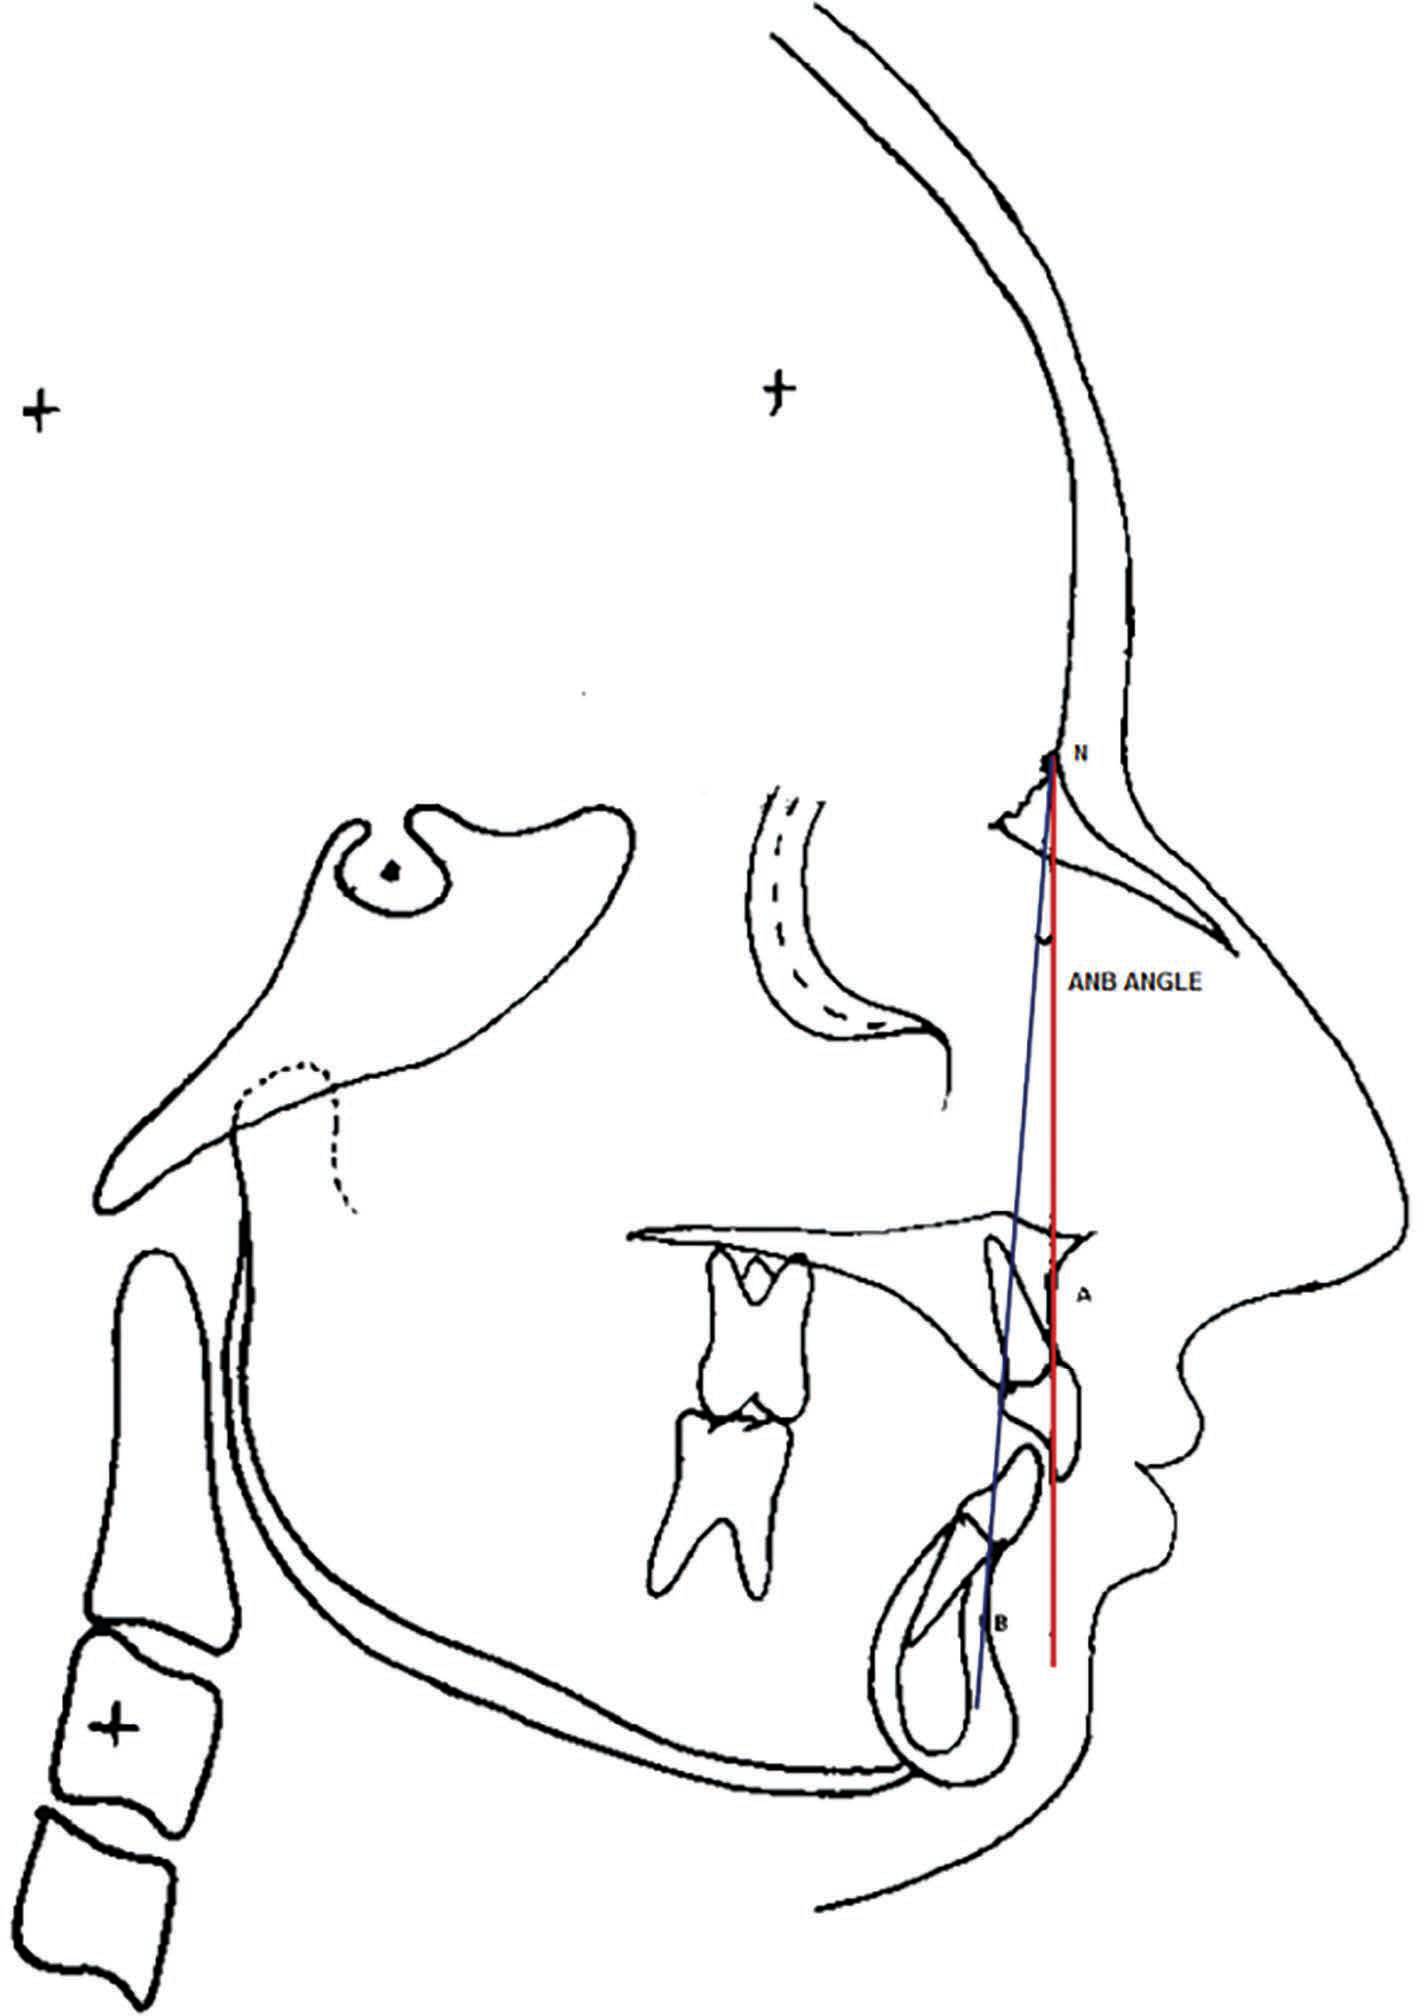
The sample was categorized into three groups (group I, group II, and group III) according to the anteroposterior relationship of maxilla with the mandible. The anteroposterior relationship was determined on the basis of ANB angle given by Steiner, which was set at 2–4°, >4°, and <2° for skeletal class I, II, and III malocclusions, respectively.
11
Each group was subdivided based on the (subgroup A and subgroup B) severity of mandibular and maxillary arch crowding into two subgroups.
12
Each subgroup was further divided into male and female subjects:
a) Group IA: Subjects with class I skeletal malocclusion having mandibular and maxillary arch crowding of <3 mm. b) Group IB: Subjects with class I skeletal malocclusion having mandibular and maxillary arch crowding of ≥3 mm. c) Group IIA: Subjects with class II skeletal malocclusion having mandibular and maxillary arch crowding of <3 mm. d) Group IIB: Subjects with class II skeletal malocclusion having mandibular and maxillary arch crowding of ≥3 mm. e) Group IIIA: Subjects with class III skeletal malocclusion having mandibular and maxillary arch crowding of <3 mm. f) Group IIIB: Subjects with class III skeletal malocclusion having mandibular and maxillary arch crowding of ≥3 mm.
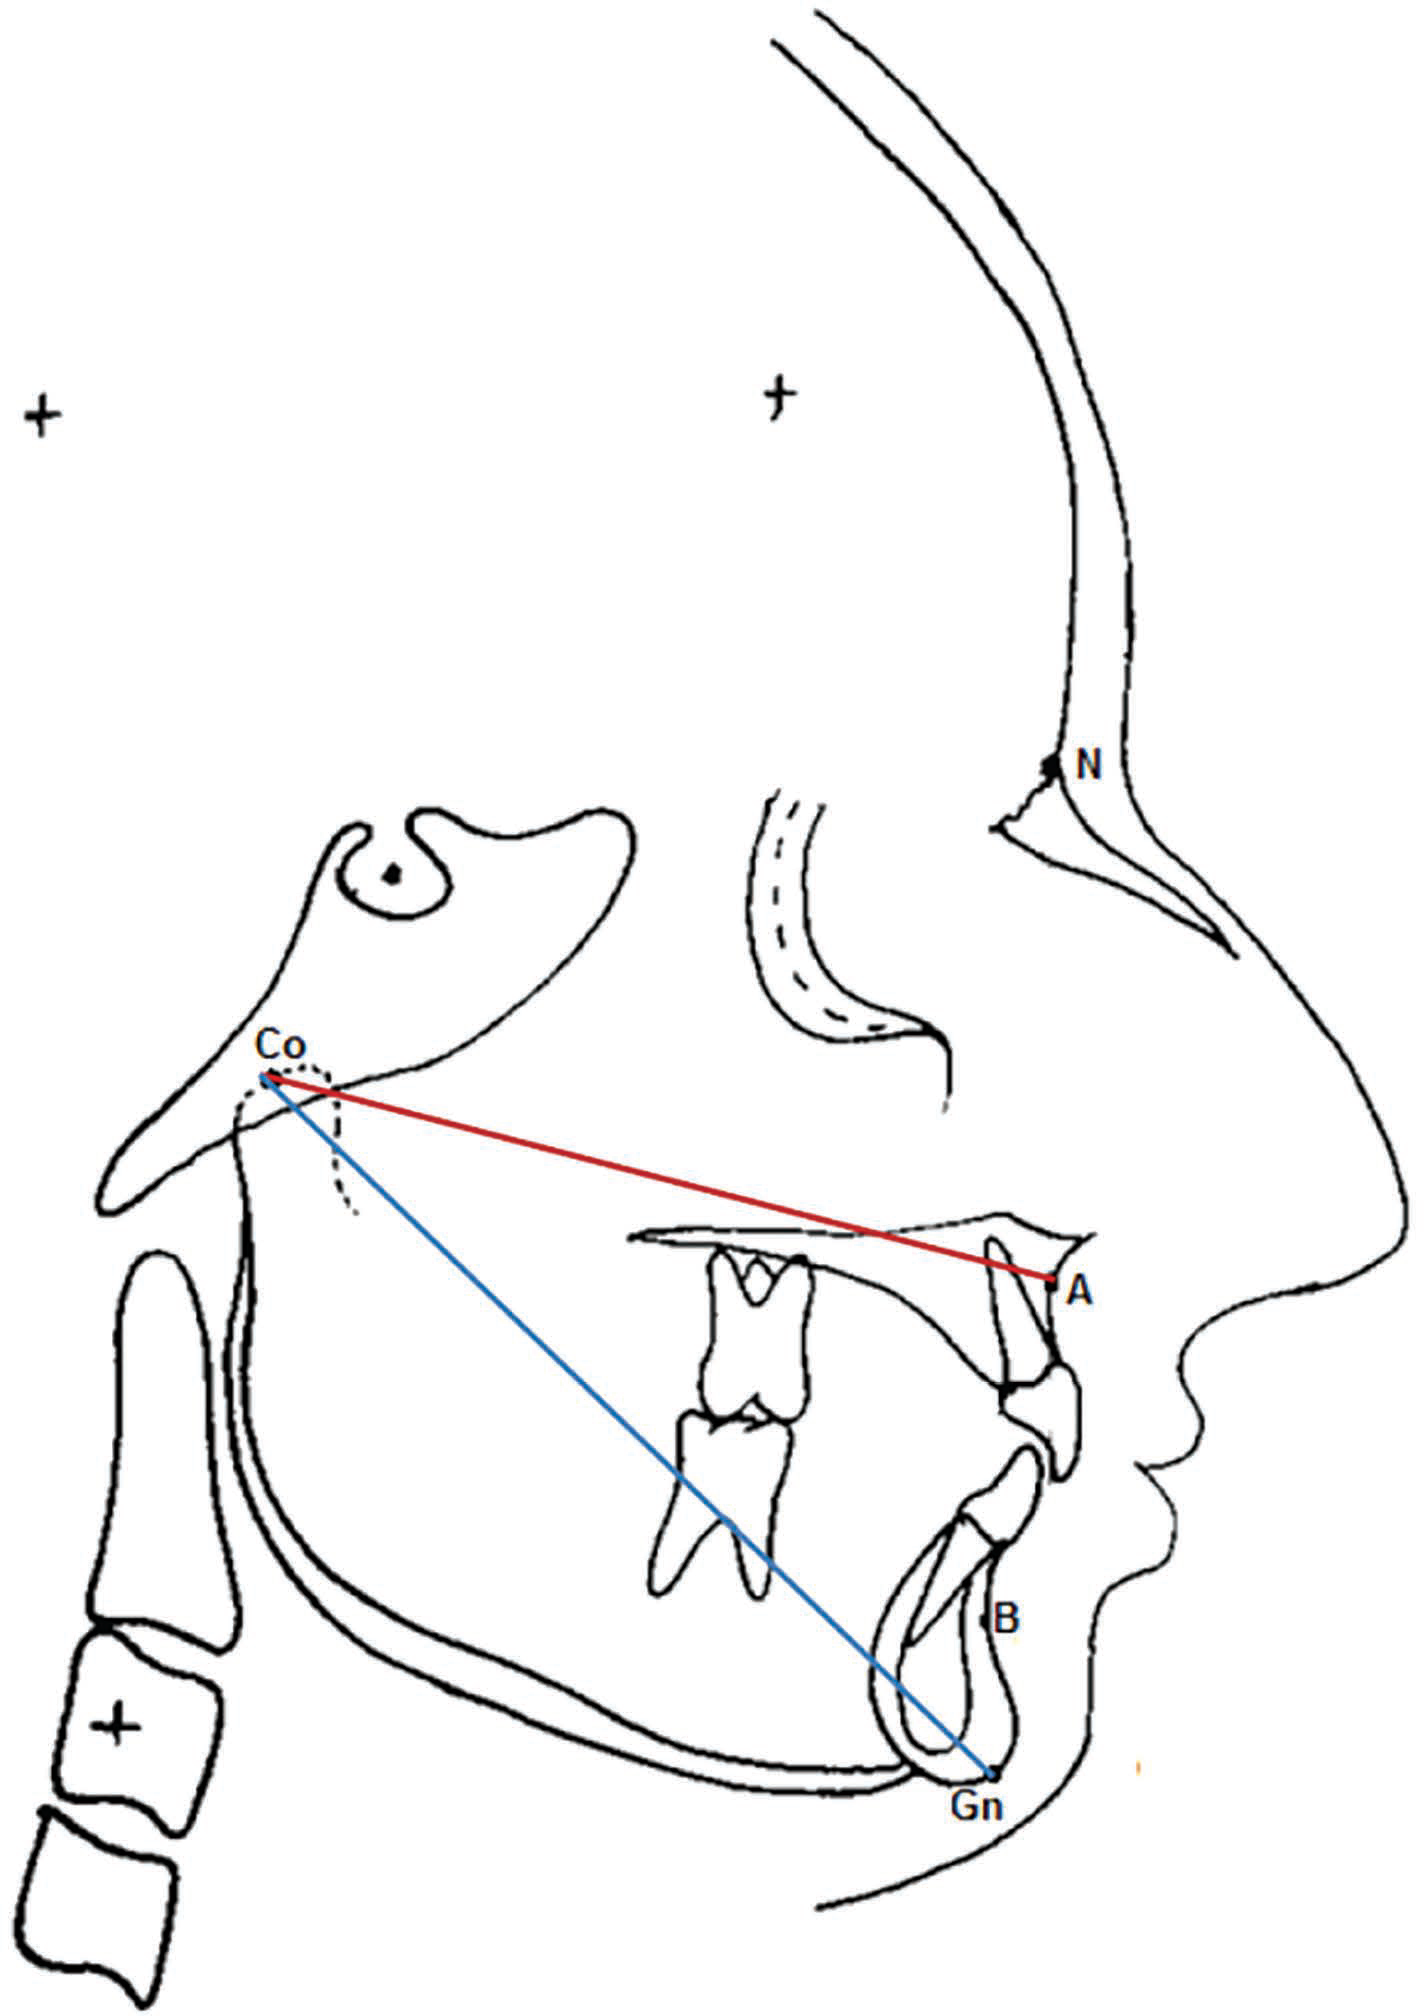
Measurements were conducted on pretreatment dental casts and lateral cephalograms. All the reference points on lateral cephalogram were identified, positioned, and marked accordingly. The ANB angle was calculated as the angle formed by point A, nasion (N), and point B, 13 as shown in Figure 1. According to McNamara analysis, the maxillary skeletal base lengths were measured from condylion to point A, and mandibular skeletal base lengths were measured from condylion to gnathion, respectively, 14 as shown in Figure 2.
Measurement of ANB Angle to Categorize Skeletal Malocclusions.
Measurement of Maxillary (Co-A) and Mandibular (Co-Gn) Base Lengths.
Study models were used to measure maxillary and mandibular dental crowding in each patient. Crowding was determined by calculating the difference between arch perimeter and sum of tooth widths from second premolar on one side to the second premolar on the other side.
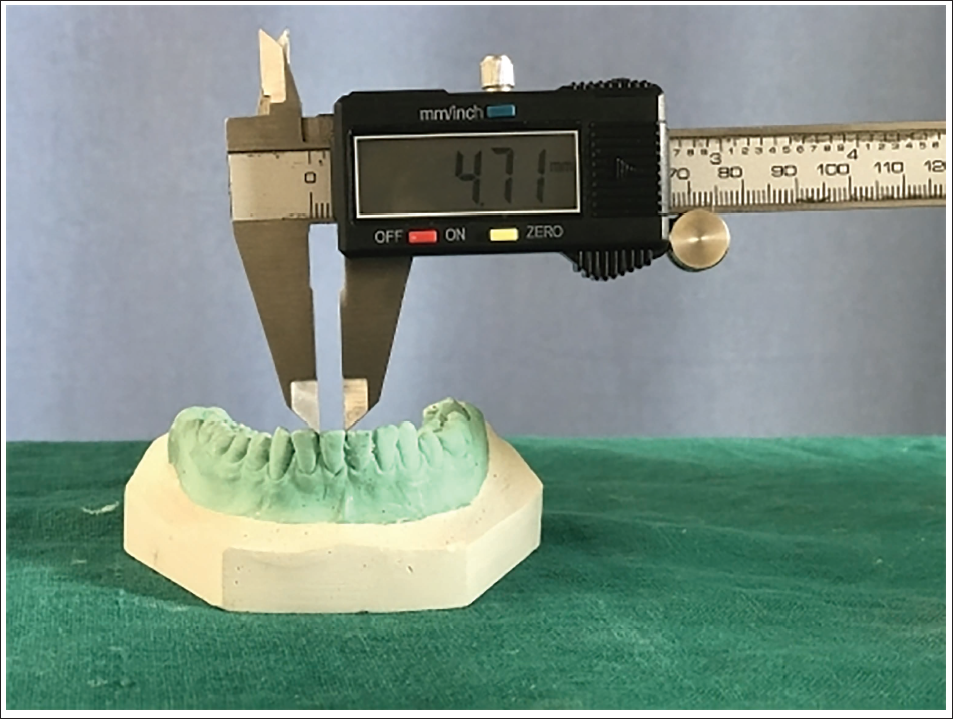
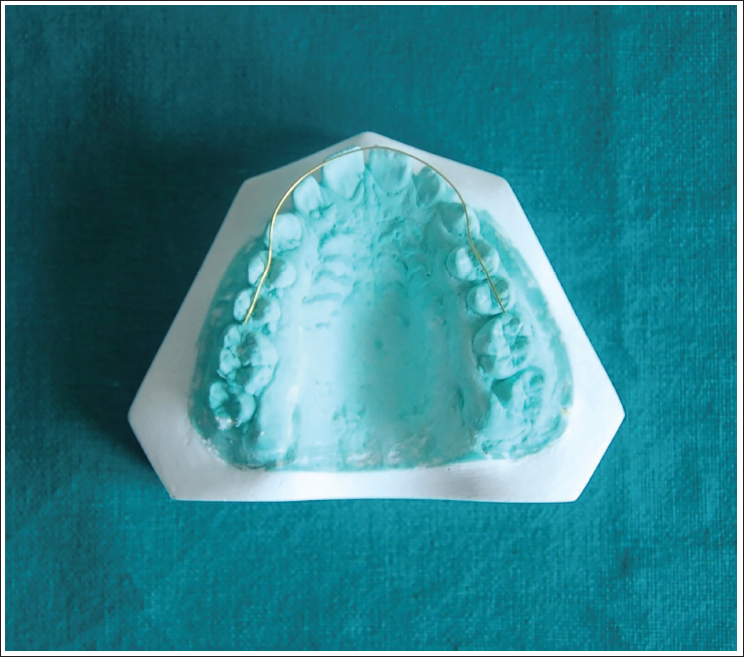
Mesiodistal tooth width of each tooth was measured by vernier caliper of accuracy ±0.01 mm (Figure 3). Arch perimeter for both arches was measured with the help of brass wire contoured to dental arch from the mesial surface of first permanent molar, passing over buccal cusp of premolar, and following the incisal edges of anterior teeth up to mesial surface of first permanent molar of opposite side, 15 as shown in Figure 4.
Measurement of Tooth Size Using the Digital Vernier Calliper.
Measurement of Arch Perimeter using the Brass Wire.
Method Error
All the measurements on the lateral cephalograms and study models were made twice to minimize the error of measurements. Assessment of intra-examiner reliability was performed using Dahlberg’s formula (Se 2 =∑d2/2n), where Se 2 is the error variance and d is difference between two determinations of same variable. The intraexaminer reliability was found to be 0.80–0.99, showing no statistically significant systemic errors.
Statistical Analysis
The results were statistically analyzed using SPSS (Statistical Package for Social Sciences) software version 21. Results obtained were compared using Student t-test and were analyzed for significance using analysis of variance (ANOVA) and Tukey’s post hoc test. Pearson correlation coefficients were calculated to evaluate the association between variables. Statistical significance was set at p value <.05 and considered highly significant at p value ≤.001.
Results
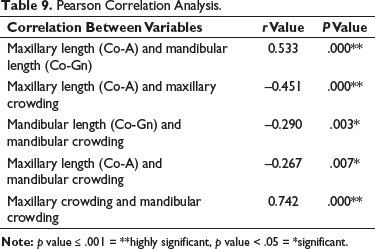
Student t-test was used to compare the measurements, as shown in Tables 1, 2, 7, and 8. Results were analyzed for significance using ANOVA (Tables 3 and 5) and Tukey’s post hoc test (Tables 4 and 6). Pearson correlation coefficients were calculated to evaluate the association between variables (Table 9). Maxillary and mandibular base lengths in all the skeletal malocclusions were smaller in groups with crowding ≥3 mm when compared with groups having crowding <3 mm, as shown in Tables 1 and 2. Inverse correlations were found between maxillary base length and maxillary crowding with r = –0.451 at p = .000, between mandibular base length and mandibular crowding with r = –0.290 at p = .003, and between maxillary base length and mandibular crowding with r = –0.267 at p = .007. Positive correlation was found between maxillary crowding and mandibular crowding with r = 0.742 at p = .000, as shown in Table 9.
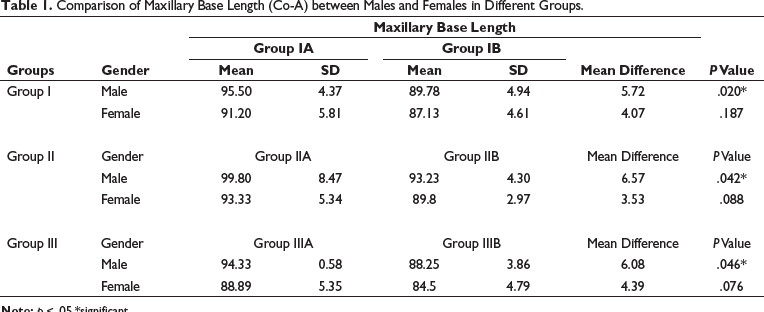
Comparison of Maxillary Base Length (Co-A) between Males and Females in Different Groups.
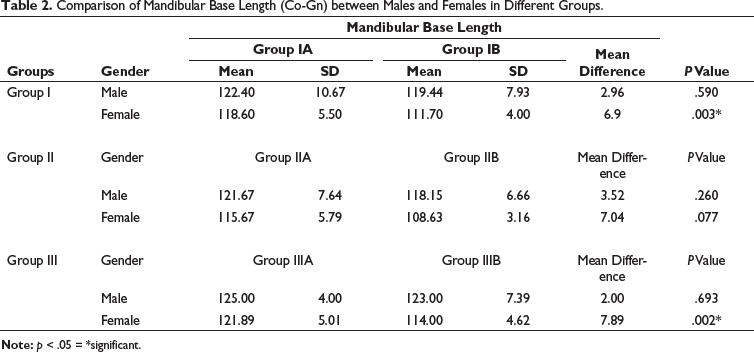
Comparison of Mandibular Base Length (Co-Gn) between Males and Females in Different Groups.
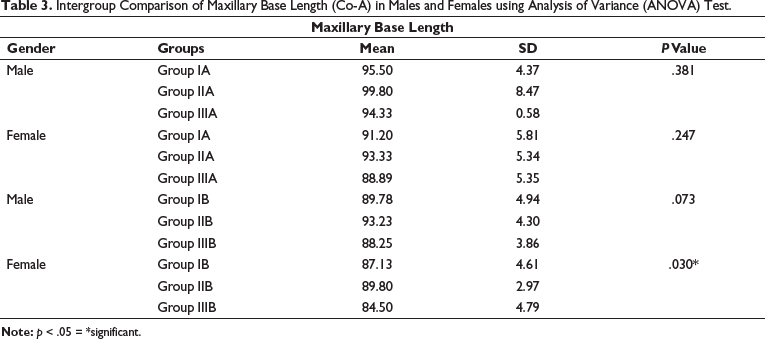
Intergroup Comparison of Maxillary Base Length (Co-A) in Males and Females using Analysis of Variance (ANOVA) Test.
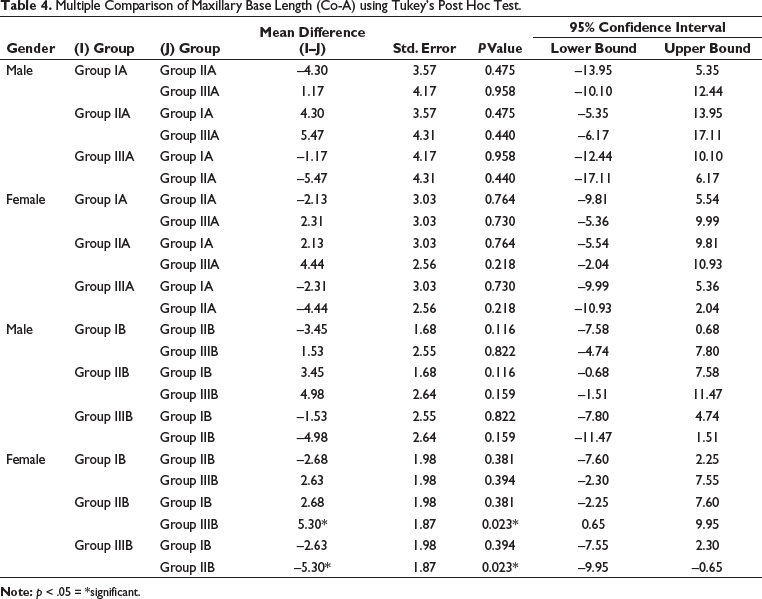
Multiple Comparison of Maxillary Base Length (Co-A) using Tukey’s Post Hoc Test.
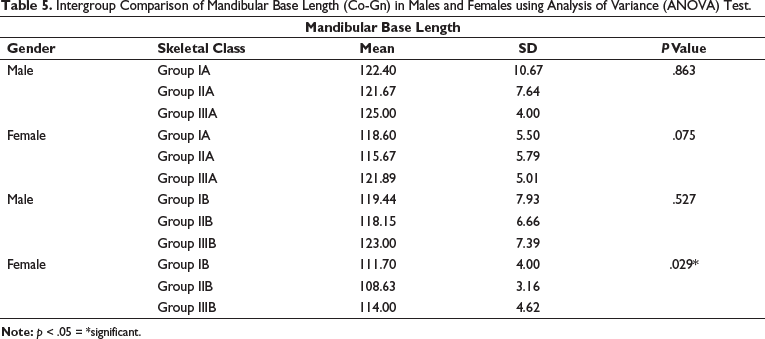
Intergroup Comparison of Mandibular Base Length (Co-Gn) in Males and Females using Analysis of Variance (ANOVA) Test.
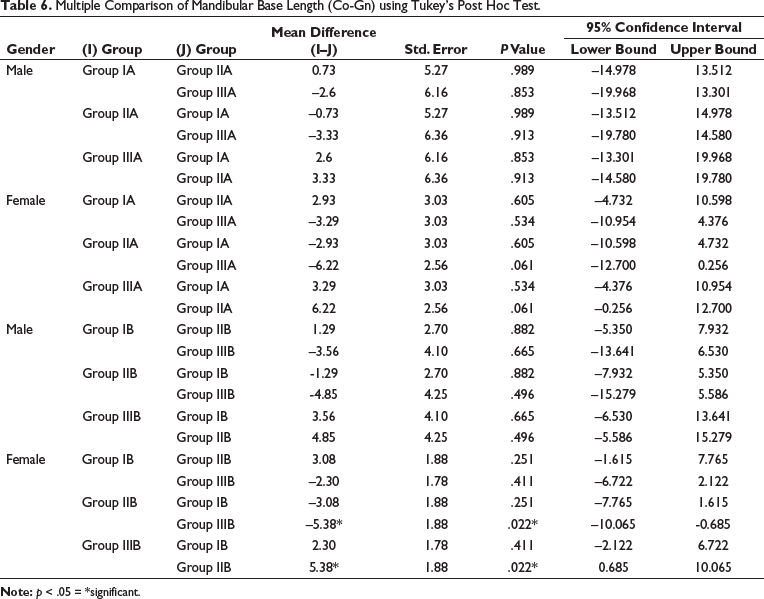
Multiple Comparison of Mandibular Base Length (Co-Gn) using Tukey’s Post Hoc Test.
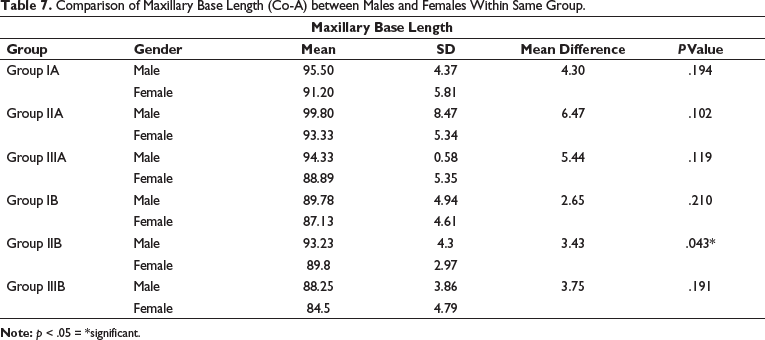
Comparison of Maxillary Base Length (Co-A) between Males and Females Within Same Group.
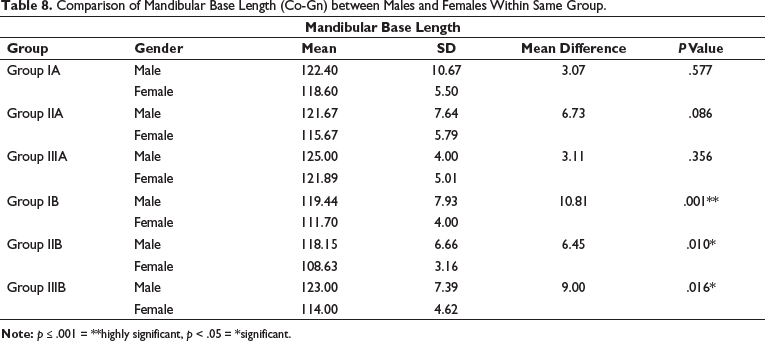
Comparison of Mandibular Base Length (Co-Gn) between Males and Females Within Same Group.
Pearson Correlation Analysis.
Discussion
Dental crowding is influenced not just by tooth size and transverse arch dimensions but also by the effective apical base length of the maxilla and mandible. Hence, consideration of base length is imperative in treatment planning. So, the aim of our study was to evaluate the relationship of maxillary and mandibular skeletal base length with dental crowding in different types of skeletal malocclusion.
In the present study, the effective apical base lengths were calculated with the help of lateral cephalogram, and its relationship with dental crowding was observed. The mean value of maxillary base length in males was found to be 95.5 ± 4.37 mm in group IA and 89.78 ± 4.94 mm in group IB. Similarly, the mean values of maxillary base length in females were found to be 91.20 ± 5.81 mm in group IA and 87.13 ± 4.61 mm in group IB (Table 1). The mean value of mandibular base length in males was found to be 122.40 ± 10.67 mm in group IA and 119.44 ± 7.93 mm in group IB. Similarly, the mean value of mandibular base length in females was found to be 118.60 ± 5.50 mm in group IA and 111.70 ± 4.0 mm in group IB (Table 2). The maxillary and mandibular base lengths in females were found to be less than in males. The possible reason for the decrease in the base lengths in females might be because of short and early pubertal growth spurt compared to males.
When the intercomparison of maxillary base length was done in males between group IA and group IB, it was found to be statistically significant with p value <.05 (Table 1), and the intercomparison of mandibular base length was done in females between group IA and group IB, it was found to be statistically significant with p value <.05 (Table 2). The possible reason for the decrease in maxillary and mandibular base lengths in group IB may be because of decrease in the circumference of the arch, which leads to the decrease in perimeter of the arch. The results of our study were in accordance with the study conducted by Turkkahraman and Sayin, 4 they found significant inverse correlation between dental crowding and SNB, lower incisor to NB angle, maxillary, and mandibular base length.
The mean value of maxillary base length in males was found to be 99.80 ± 8.47 mm in group IIA and 93.23 ± 4.30 mm in group IIB. Similarly, the mean values of maxillary base length in females were found to be 93.33 ± 5.34 mm in group IIA and 89.80 ± 2.97 mm in group IIB (Table 1). The mean value of mandibular base length in males was found to be 121.67 ± 7.64 mm in group IIA and 118.15 ± 6.66 mm in group IIB. Similarly, the mean value of mandibular base length in females was found to be 115.67 ± 5.79 mm in group IIA and 108.63 ± 3.16 mm in group IIB (Table 2). The maxillary and mandibular base lengths in females were found to be less than those in males. When the intercomparison of maxillary base length was done in males between group IIA and group IIB, it was found to be statistically significant with p value <0.05 (Table 2). The decrease in maxillary and mandibular base length in group IIB was in accordance with the study conducted by Janson et al. 1 They concluded that individuals with complete class II malocclusion and moderate to severe mandibular crowding exhibit noticeably smaller effective apical base lengths compared to individuals with the same malocclusion and slight mandibular crowding. It was also in accordance with the study conducted by Khoja et al., 7 they stated that increase in crowding is inversely correlated with maxillary and mandibular corpus length.
The mean value of maxillary base length in males was found to be 94.33 ± 0.58 mm in group IIIA and 88.25 ± 3.86 mm in group IIIB. Similarly, the mean values of maxillary base length in females were found to be 88.89 ± 5.35 mm in group IIIA and 84.50 ± 4.79 mm in group IIIB (Table 1). The mean value of mandibular base length in males was found to be 125.00 ± 4.00 mm in group IIIA and 123.0±7.39 mm in group IIIB. Similarly, the mean value of mandibular base length in females was found to be 121.89 ± 5.01 mm in group IIIA and 114.0 ± 4.62 mm in group IIIB (Table 2). The maxillary and mandibular base lengths in females were found to be less than those in males. When the intercomparison of maxillary base length was done in males between group IIIA and group IIIB, it was found to be statistically significant with p value <0.05 (Table 1). When the intercomparison of mandibular length was done in females between group IIIA and group IIIB, it was found to be statistically significant with p value <.05 (Table 2). The decrease in maxillary and mandibular base length obtained in our study in group IIIB was in accordance with the study conducted by Khoja et al., 7 and they concluded that dental crowding is inversely correlated with maxillary and mandibular corpus lengths. It was also in accordance with the study conducted by Leighton and Hunter, 16 and they found that severely crowded and moderately crowded subjects had shorter mandibular corpus.
The mean maxillary base length obtained in males in group IA is 95.50 ± 4.37 mm, in group IIA is 99.80 ± 8.47 mm, and in group IIIA is 94.33 ± 0.58 mm, respectively. Similarly, the mean maxillary base length obtained in females in group IA is 91.20 ± 5.81 mm, in group IIA is 93.33 ± 5.34 mm, and in group IIIA is 88.89 ± 5.35 mm, respectively. The mean maxillary base length obtained in males in group IB is 89.78 ± 4.94 mm, in group IIB is 93.23 ± 4.30 mm, and in group IIIB is 88.25 ± 3.86 mm, respectively. Similarly, the mean maxillary base length obtained in females in group IB is 87.13 ± 4.61 mm, in group IIB is 89.80 ± 2.97 mm, and in group IIIB is 84.50 ± 4.79 mm, respectively. When the multiple intergroup comparisons of maxillary base length were done between different types of skeletal malocclusion in males and females (groups I, II, and III), no statistical significant difference was found except for females in group IB, group IIB, and group IIIB with p value <.05 (Table 3). Further multiple comparisons of maxillary base length were analyzed using Tukey’s post hoc test. It was found to be statistically significant in females between group IIB and group IIIB with p value <.05 (Table 4). The possible reason for the increase in mean maxillary base length in females in group IIB compared to group IIIB is due to the convex profile in skeletal class II, which can be attributed to longer maxillary base length.
The mean mandibular base length obtained in males in group IA is 122.40 ± 10.67 mm, in group IIA is 121.67 ± 7.64 mm, and in group IIIA is 125.00 ± 4 mm, respectively. Similarly, the mean mandibular base length obtained in females in group IA is 118.60 ± 5.50 mm, in group IIA is 115.67 ± 5.79 mm, and in group IIIA is 121.89 ± 5.01 mm, respectively. The mean mandibular base length obtained in males in group IB is 119.44 ± 7.93 mm, in group IIB is 118.15 ± 6.66 mm, and in group IIIB is 123.00 ± 7.39 mm, respectively. Similarly, the mean mandibular base length obtained in females in group IB is 111.70 ± 4.0 mm, in group IIB is 108.63 ± 3.16 mm, and in group IIIB is 114.00 ± 4.62 mm, respectively. When the multiple intergroup comparisons of mandibular base length were done between different types of skeletal malocclusion in males and females (groups I, II, and III), no statistical significant difference was found except for females in group IB, group IIB, and group IIIB with p value <.05 (Table 5). Further multiple comparisons of mandibular length were analyzed using Tukey’s post hoc test it was found to be statistically significant in females between group IIB and group IIIB with p value <.05 (Table 6). The possible reason for the increase in mean mandibular length in females in group IIIB compared to group IIB is due to the concave profile seen in skeletal class III, which can be attributed to longer mandibular base length. This was in accordance with the study conducted by Dhopatkar et al., 10 who concluded that maxillary length is increased in class II malocclusions, and the mandibular length is greater in class III.
When mean maxillary base length between males and females was compared within the group, it was found to be statistically significant in group IIB with p value <.05 (Table 7). Similarly, when mean mandibular base length between males and females was compared within the group, it was found to be statistically significant in group IB, group IIB, and group IIIB with p value <.05 (Table 8). The increase in maxillary and mandibular base length in males compared to females is due to late and large pubertal growth spurt in males. The results of our study were in accordance with the study conducted by Baccetti et al., 17 and they concluded that the class III malocclusion shows a notable difference in craniofacial features between males and females, particularly after age 13. Females with class III malocclusion typically have smaller linear dimensions in the maxilla, mandible, and anterior facial heights compared to male subjects. The results of our study were also in accordance with the study conducted by Ursi et al., 18 who concluded that the effective length of maxilla and mandible were similar in both sexes up to 14 years of age. Thereafter, in males, the length increased, while it remained constant in females.
In the present study, Table 9 shows the following findings. When the correlation was done between maxillary and mandibular base length irrespective of skeletal malocclusion, weak positive correlation was found between them (r = 0.533 and p = .000), thus showing that increase in maxillary base length is correlated with increased mandibular base length. Inverse weak correlation was found between maxillary base length and maxillary crowding (r = –0.451 and p = .000). The decrease in maxillary base length is associated with increase in maxillary crowding. Similarly, weak inverse correlation was found between mandibular base length and mandibular crowding (r = –0.290 and p = .003), concluding that decrease in mandibular base length will be associated with increase in mandibular crowding. Weak inverse correlation was found between maxillary base length and mandibular crowding (r = –0.267 and p = .007). The reason for decrease in maxillary base length with increase in mandibular crowding can be attributed to positive correlation between maxillary and mandibular base lengths. An evident strong positive correlation was observed between maxillary and mandibular crowding (r = 0.742 and p = .000). This can be explained by the significant correlation between maxillary and mandibular base length and crowding. Our study results align with the findings of the research conducted by Janson et al., 1 who concluded that there exists a notable yet weak negative correlation between effective apical base lengths and the severity of dental crowding.
The effective apical base length is crucial in determining the degree of dental crowding. If mild to moderate dental crowding is due to tooth size and arch width, it is recommended to consider treatment protocols such as interproximal stripping and arch expansion. In cases of moderate to severe crowding not caused by tooth size or transverse arch dimensions, the likely cause is inadequate effective apical base lengths. Hence, extractions may be the best treatment option in such cases. Therefore, it is essential to carefully consider the appropriate treatment plan for patients with severe crowding during the selection process.
Conclusion
The following conclusions were drawn from the study:
Maxillary and mandibular base lengths in all the skeletal malocclusions were smaller in groups with crowding ≥3 mm when compared with groups having crowding <3 mm.
Maxillary base length was largest in skeletal class II malocclusion, while mandibular base length was largest in skeletal class III malocclusion, irrespective of crowding.
Greater maxillary and mandibular base length were observed in males compared to females, regardless of skeletal malocclusions and severity of crowding.
An insignificant correlation was observed between the lengths of maxillary and mandibular bases.
Author’s Contributions
All the authors have significantly helped in the commencement of the study as well as in making this manuscript. The authors were involved in conceptualizing the study, designing the research methodology, defining the intellectual content, conducting literature searches, participating in clinical and experimental studies, acquiring and analyzing data, performing statistical analysis, preparing, editing, and reviewing the manuscript, and fulfilling the role of guarantor.
Availability of Supporting Data
Various studies have been quoted and mentioned in the references.
Footnotes
Declaration of Conflicting Interest
The authors declared no potential conflicts of interest with respect to the research, authorship, and/or publication of this article.
Ethical Approval
Ethical approval was taken from the ethical committee of Himachal Dental College, Sundernagar, prior to commencing the study.
Funding
The authors received no financial support for the research, authorship, and/or publication of this article.
Informed Consent
Consent for the publication of this article has been taken from all contributing authors.