
Abstract
Introduction
AI-based automated cephalometric landmark detection streamlines orthodontic diagnosis and treatment planning, providing accurate, efficient, and reliable results. Benefits include saving time, minimizing subjectivity, improving precision, and facilitating continuous improvement. However, they should complement clinician expertise, ensuring qualified orthodontists make the final diagnosis and treatment plan.
Aim
To propose a method that automatically detects cephalometric landmarks on the X-ray images and compare these values with the manual annotation method.
Methodology
A dataset of 600 X-ray images, each containing 19 landmarks, was collected. Two orthodontists manually marked the 19 landmarks in 300 cephalograms and their coordinates were automatically extracted. The dataset was cleaned for errors, and a pre-trained CNN model with an EfficientNetB7 backbone was used for landmark detection. The model was trained on 80% of the dataset and tested on the remaining 20%. The two-step method included ROI extraction and landmark detection. The RMSE score was used to evaluate inter-examiner reliability and the R2 score was used to compare manual and automated models.
Result
Model landmark locations were compared to the manual method. The mean deviation of the predicted landmarks from the actual landmarks was calculated using RMSE, and the model showed acceptable accuracy compared to manual annotation. EfficientNetB7 was found to have detection accuracies similar to the manual annotation method. For landmarks like Porion, articulare, and soft tissue pogonion, the model outperformed the human annotation method and provides a consistent better result, and for points like Point A, pogonion, gnathion, and menton, the manual methods show more accurate results.
Conclusion
The study introduced an automated approach using deep learning to predict landmark locations, and the results demonstrate its accuracy in comparison with the manual annotation method. This approach effectively detects cephalometric landmarks, suggesting its potential for clinical use with orthodontist’s supervision.
Introduction
Orthodontics aims to correct craniofacial discrepancies and meet functional and aesthetic demands. Cephalometric measurement has become a popular diagnostic tool to evaluate deviated skeletal parameters in orthodontics since it was introduced in the 1930s. Cephalometric radiographs are used to assess and predict craniofacial growth, and plan and evaluate treatment effects. 1 However, the manual landmarking method used by orthodontists to extract landmarks from X-ray images is time-consuming and prone to errors due to clinician fatigue and high intra and interpersonal variations. 3 Therefore, there is a need for a stable and consistent automated method for precise cephalometric evaluation. Challenges in the computer-assisted cephalometric analysis include manual calibration, identification of landmarks, and the complexity of auto-identifying anatomical landmarks due to variations in skeletal structures, image blurs, and overlapping structures. Although deep learning methods are being researched to improve the accuracy of digital cephalometric analysis, limited datasets remain a challenge.
There have been various studies for lateral cephalometric analysis. In particular, the International Symposium on Biomedical Imaging (ISBI) held in 2014 and 2015 challenged this problem and several approaches were published.4, 5 They used highly randomized trees as pixel classifiers. Despite the wide variety of studies, no accurate model has yet been developed for use in clinics with less than 2 mm error range. 4
Automated cephalometric landmark detection software, using AI technology (deep learning), enables accurate and fast calculations. The software simplifies landmark identification and improves with each analysis, thanks to its deep brain algorithm. Deep learning has outperformed existing algorithms in various areas in recent years. Especially since the AlexNet in ILSVRC in 2012, 9 convolutional neural network (CNN) has been developed rapidly in image processing. CNN is a multi-layered perceptron model inspired by animal visual systems. 10 Therefore, CNN enables us to get specific information efficiently from images. CNN has been widely applied to medical imaging, 11 image segmentation,12, 13 object/lesion detection,14, 15 image/exam classification, 16 and registration.
This study builds and evaluates the accuracy of an artificial intelligence (AI)—based landmark detection CNN model. The proposed model’s performance is tested and compared with the manual landmark annotation method.
Materials and Methods
Materials
In this study, we utilized two datasets for analysis. The first dataset, which we refer to as Dataset 1, was obtained from the 2015 ISBI Grand Challenge conducted by IEEE. This dataset consists of 300 lateral cephalograms. The second dataset, referred to as Dataset 2, was collected from a Dental College and also contains 300 lateral cephalograms. All cephalograms were captured using a Digital Cephalometric X-ray Machine, Orthophos XG 3D, and were processed using Dentsply Sirona Sidexis ver.4.0 software. We used a marked dataset of 600 files that included 19 landmark annotations and an unmarked dataset containing 600 files for training and testing our models. For building our CNN, we utilized the PyTorch framework along with Torch Vision and OpenCV using the Python language. Our models were trained on an Asus Rog laptop with 32GB RAM, an 8GB RTX 2070 Super Max-Q, and an Intel 10th Gen CPU.
Description of Datasets
The CNN model needs a considerable amount of data to work efficiently; otherwise, there will be an over-fitting issue. The data used in this study were provided in the 2015 ISBI Grand Challenges in Dental X-ray Image Analysis of IEEE International Symposium on Biomedical Imaging 2015 (website:
The custom-created dataset containing 300 patient images between the ages of 6 and 60 years was collected with Orthophos XG 3D Digital X-ray machine and Dentsply Sirona Sidexis (version 4.0) software from a dental college. Two orthodontists manually annotated the collected images, and the coordinates were listed for every 19 landmarks in the same way as the Grand challenge dataset. Thus, a total of 600 images were taken for this study after exclusion criteria.
Inclusion Criteria
Digital lateral cephalograms of patients having Angle’s Class I, II, III skeletal pattern.
Exclusion Criteria
Digital lateral cephalograms of patients with a history of facial trauma
Digital lateral cephalograms of patients with syndromes and or other craniofacial anomalies
Digital lateral cephalograms of patients with gross asymmetry
Digital lateral cephalograms of patients undergone surgical corrections
Digital lateral cephalograms of poor quality that do not allow manual tracing.
Proposed Method
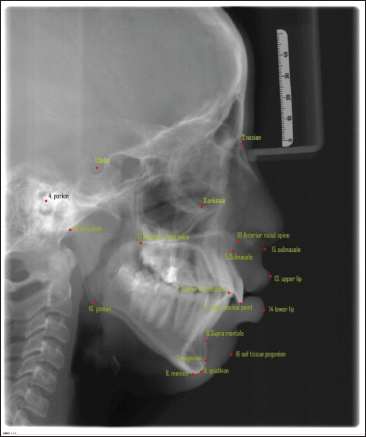
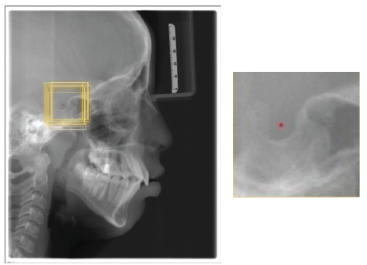
As described above, the dataset collected contained 600 X-ray images, and each image contained 19 landmarks. Since the study was performed by involving human subjects, it was approved by the institutional review board. The dataset collected from the Grand challenge contained 300 X-rays, which two experienced doctors had manually annotated and, the coordinates are listed in tables for 19 landmarks. Two orthodontists with a clinical and academic experience of more than 10 years were selected to augment the database of the present study. They analyzed the 300 cephalograms collected from a Dental College, and manually marked the 19 Cephalometric landmarks listed in Figure 1. After obtaining the marked x-rays, the landmarks’ x,y coordinates were automatically extracted by the computer. Once the dataset was created, the cleaning of the dataset was done, that is, the entire dataset was analyzed for errors of different types and were removed. The mean error between the two Orthodontists was calculated by the RMSE score listed in Table 1 to analyze the inter-examiner reliability, and find the ground truth data for each landmark. After making sure that the dataset is clear without any error, the training of the model was done. Eighty per cent of the dataset were used for training purposes and the remaining dataset was used for testing the model. During the training time, the images were studied by the model. After adequate training, the testing dataset is given to the model for identifying the landmarks (Figure 2). This method is a two-step method: (a) ROI extraction, and (2) Landmark detection. The cropped patches were by registering the test image to training images for ROI extraction, with annotated landmarks (Figure 3a). Later, the pre-trained CNN models with the backbone of EfficientNetB7, a state-of-the-art CNN, were used to detect the landmarks in the extracted ROI patches (Figure 3b). Once the model detected the landmarks, the RMSE score for each landmark was evaluated to obtain the amount of variation in detecting the landmark from the ground truth data, listed in Table 2. Finally, the manual and automated models were compared using the R2 score.
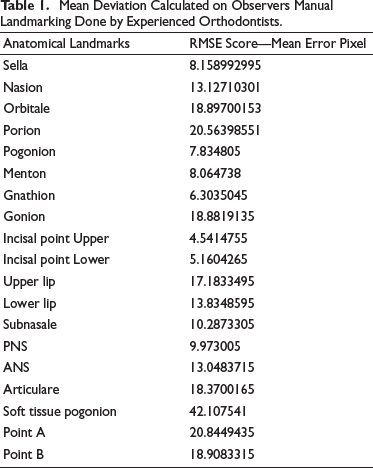
Mean Deviation Calculated on Observers Manual Landmarking Done by Experienced Orthodontists.
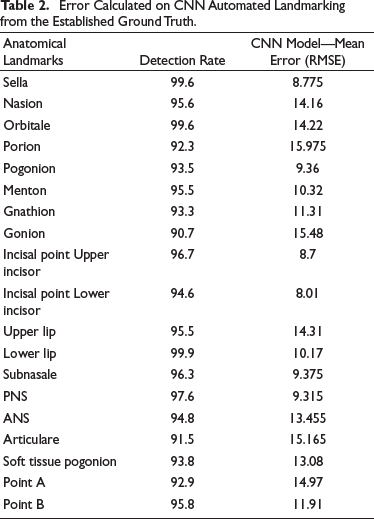
Error Calculated on CNN Automated Landmarking from the Established Ground Truth.
Landmarks Selected for Detection.
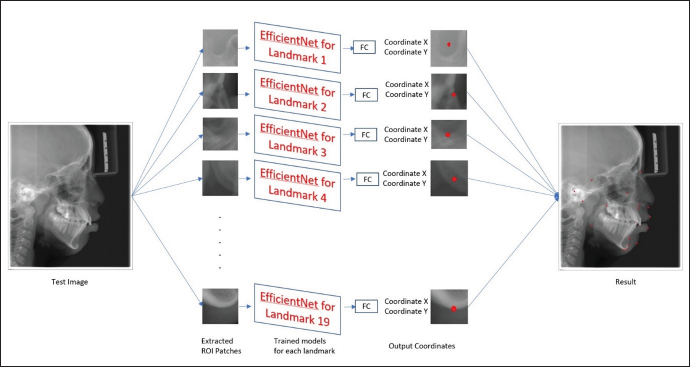
Trained 19 Models with the Same Architecture but Different Weights.
3(a). Example of the Training Image. Yellow Boxes are Cropped Training Images. 3(b) The Cropped 512x512 Patches. Note that the Cropped ROI Patches for Each Landmark: Rot Dot is the Target Landmark, The Yellow Boxes are 512x512 ROI Patches.
CNN Model
The Pytorch framework with Torch Vision and OpenCV in Python was used to build the CNN program in this study. CNNs have more layers for deeper networks and better accuracy, and in this study, the EfficientNetB7 architecture is used as the backbone, which Google developed, and these models are used for computer vision applications. They can be effectively used to find features in ROI patches. The EfficientNetB7 architecture uses mobile inverted bottleneck convolution (MBConv) as a baseline network. This CNN can find valuable features automatically for different computer vision tasks. This model can perform scaling on depth, width, and resolution.
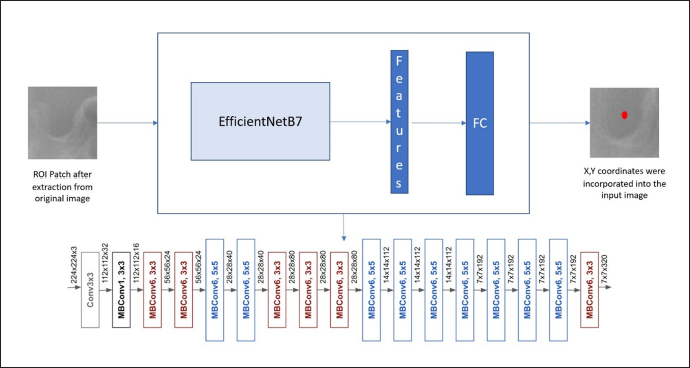
First, a baseline neural network called Efficientnet-B0 is formed using Neural Architectural Search (NAS) using the machine learning technique. Once baseline network is created, further scaling of the network is done in terms of depth, width, and resolution to generate a more significant model B7 to provide better accuracy. In particular, the EfficientNet-B7 achieves state-of-the-art 84.3% top-1 accuracy on ImageNet. A fully connected layer was used to estimate landmark location as a regression problem, flattening all features and outputting the coordinate of the landmark in the patch (Figure 4).
The Architecture of the EfficientNetB7 Shows the Conventional Layers Present in the Network.
Evaluation of the Result
The output data are analyzed using RMSE and R2 Score to detect the model’s accuracy and compare it with the manual annotation method respectively. The Root Mean Squared Error (RMSE) is a common metric for assessing the performance of machine learning models. It is often used to provide a metric that is related to the unit being measured. The study uses the RMSE score for comparing the results obtained in the manual annotation method and automated method. The results would give the error between the actual point and marked landmark. This way, rather than a percentage, helps the readers to understand the error better.
Calculation of RMSE Score
For each landmark prediction, the difference between respected landmarks and the actual ground truth data is to be found and they have to square these values. After that, the mean of these squared values is found and the square root of this mean gives the RMSE score. The output is a non-negative value, and it would be better if it is brought near zero.
“Ʃ” represents sum, “yi,” the predicted value for the ith observation, “ẏ” the observed value for the ith observation, and “N” is the sample size. The score will give us an idea of the average distance between the ground truth data values and the predicted data values. The RMSE results are shown in pixel difference, which will give a clear idea about how much deviation is present from the actual landmark point to the predicted landmark point. As the pixels difference decreases, the accuracy of the predicted landmark increases, which can come up to zero value.
Calculation of R 2 Score
R-squared (R2) is a statistical measure representing the proportion of the difference or variance for a dependent variable that an independent variable or variables can explain. It shows how well the dataset will fit the model. For the calculation of R squared, the correlation coefficient is obtained, and the square is the result.
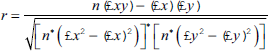
where “r” represents the Correlation coefficient, n is the number in a given dataset, “x” the first variable, and “y” the second variable. The square root of the result gives an R2 score.
R2 Score shows how much information can be gathered from the images to accurately predict the landmark. The score can be ranged from values –1 to 1. As the values are closer to 1, we can say the dataset is best fitted for the model for predicting the landmarks and vice versa.
Results
The detection accuracy to evaluate the performance, EfficientNetB7 was used. If the distance between a detected landmark and its ground truth becomes less, this landmark can be classified as accurate. In Table 1, points like Orbitale, porion, gonion, articulare, Point A, and point B values show that there is a moderate difference between the two orthodontists and in some points show a high degree of acceptance between the two. It is noted that the landmark, soft tissue pogonion, shows a significant difference between the two orthodontists.
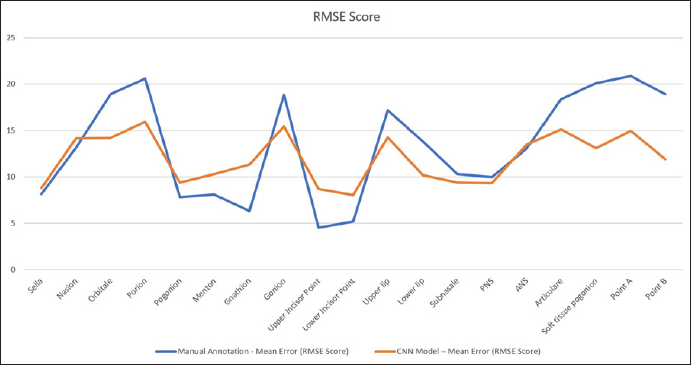
The mean deviation calculated on CNN automated landmarking model is obtained from the established ground truth data listed in Table 2. The results were obtained using RMSE score. It will provide information about deviation of the actual landmarks from the predicted landmark in pixels. The table shows that the points marked by the model have acceptable accuracy with the manual annotation method. For points like pogonion, gnathion, menton, upper incisor point, and lower incisor point, the manual method was found to have better predictability as shown in Figure 5.
RMSE Score for 19 Landmarks. The Blue Line Shows the Mean Error that Occurred During the Manual Annotation Method; the Red Line Shows the Mean Error that Occurred During Automated Detection of Landmarks.
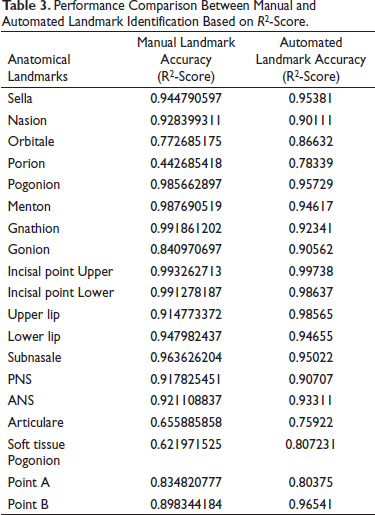
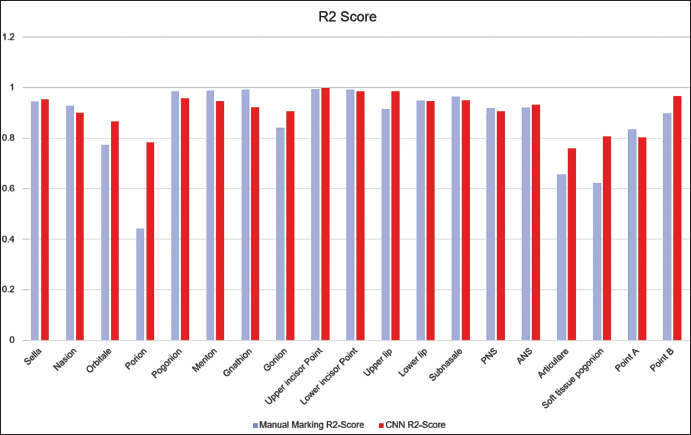
For detecting the accuracy of the test data, EfficientNetB7 was compared with the manual annotation method. To prove the model’s effectiveness, the results in Test data are shown in Table 3. As noted, EfficientNetB7 obtains detection accuracies similar to the manual annotation method in the R score (Figure 6). For landmarks like, Porion, articulare, and soft tissue pogonion, the model outperformed the human annotation method and provides a consistent better result, and for points like Point A, pogonion, gnathion, and menton, the manual methods show more accurate results.
Performance Comparison Between Manual and Automated Landmark Identification Based on R2-Score.
R2 Score for Manual and Automated Landmark Annotation Method. The Blue Bar Shows the Performance of Manual Annotation, Red Bar Shows the Performance of the Automated Model.
Discussion
Cephalograms enable both qualitative and quantitative diagnosis unlike other dental radiographs. Despite the limitations highlighted by Graber in 1956, the utility of cephalometrics in orthodontic diagnostic treatment planning is widely accepted.
The detection of landmarks is a critical aspect of Cephalometrics, but it is also the most vulnerable area. The definition of some landmarks, such as Orbitale, has been criticized for being unreliable and unclear. Each landmark has its characteristic distribution of errors, and even when assessing the same head film, identification errors occur and cannot be ignored. The use of these landmarks to construct planes and angles can lead to problems, as the accurate identification of certain points, such as the apex of the lower central incisor and Point A, is challenging.
Despite technological advancements in imaging systems and software, diagnostic and treatment planning tools have not kept pace. Orthodontic clinicians still primarily rely on cephalometrics, despite its tediousness and time-consuming nature. Research indicates that lateral cephalograms are not essential for orthodontic treatment planning and are mainly used for medico-legal purposes, academic studies, or due to practitioner inexperience.
Over the past decade, a challenge has arisen in the orthodontic and craniofacial fields regarding the use of digital data and digital imaging. This challenge has resulted in some users feeling demotivated to properly utilize this technology due to the time it takes to obtain accurate measurements and cephalograms. As a result, users may fail to compare superimpositions at different treatment stages, leading to imprecise diagnostics and suboptimal treatment plans. To manually place landmarks on cephalometric images using software such as Dolphin Imaging or QuickCeph, an experienced clinician typically spends 10–15 minutes per image. This process can be time-consuming and prone to errors. 5
The rapid development of AI in recent years has penetrated many aspects of daily life, including the analysis of extensively available datasets. The accumulation of data in many formats by search engines such as Google and social media (Twitter, Facebook, and Instagram) has great potential for enhancement and improvement of all aspects of our lives. With orthodontic diagnostic and treatment planning, this AI technology could deliver not only an easy, practical, and precise tool for the practising clinician, but also significantly improves the amount of available labelled data. Despite the readily available studies demonstrating the different processes to auto-detect craniofacial landmarks, most clinicians use approaches based on image-processing techniques where the image of cephalometric radiographs require intense human preparation, such as re-scaling, calibration, and labeling. Calibration and other image preparations are time-consuming and, if not done properly, often generate landmark outliners, 23 as they strongly rely on the quantity and size of the cephalometric images. Many other studies propose different novel frameworks for landmark detection in cephalometric radiographs and demonstrate results with an accuracy of 72%, but again, these are not fully automated procedures 6 . A study by Yue et al. in 2006 based on image processing technology combined with statistical model got an accuracy of 71% 27 and the study by Ningru et al. got an accuracy of 59.7%. In the older days for landmark detection, we use knowledge-based techniques like edge and pattern detection and genetic programming models. AI-based machine learning techniques are used. Current advances in this technology have, in turn, provided hardware and software development that is sufficiently robust to support the large computational requirements of complex AI algorithms and their application to deep learning. Applications of a variety of deep learning architectures, such as convolutional deep neural networks, deep belief networks, and recurrent neural networks, to the creation of algorithms in important fields such as natural language processing, computer vision, speech recognition, and bioinformatics have resulted in efficient and accurate automation of many pragmatic tasks. However, the developed methods are unable to compete with manual landmark identification. In recent years, the Institute of Electrical and Electronics Engineers (IEEE) and the International Symposium on Biomedical Imaging (ISBI) have organized Grand Challenges on this topic to encourage the development of better algorithms. The results were described as providing a benchmark for any future development. 4
The study was formulated to investigate whether AI might be a viable option for the repetitive and arduous task of identifying multiple cephalometric landmarks for use in clinical orthodontic practice. The null hypothesis is that there will be difference between the manual and automated methods. The mean error between the automated and manual did not exceed 0.9 mm. In all landmarks, the model demonstrated accurate identification of landmarks. All those mean differences showing less than 2 mm would not seem to be a clinically significant error. However, since the computers always detected identical positions, the reproducibility by the model upon repeated detection tasks was better than that associated with the human counterparts.
Computer vision, a field of AI that allows machines to analyze and classify images, has made significant progress due to CNNs. CNNs are highly effective in automatically identifying anatomical landmarks in diagnostic images. Two-dimensional cephalometric analysis remains an important tool in orthodontic diagnosis and treatment planning. Computer-assisted cephalometric analysis has already eliminated mechanical errors introduced by human operators, and attempts to fully automate this analysis have been ongoing to save time and improve landmark identification accuracy by reducing the subjective errors of clinicians. The current studies detected less than 20 landmarks and the accuracy of the results were not satisfactory for use in clinical orthodontic practice. For example, in 2009, 10 landmarks on 41 digital images were identified. In 2013, 16 landmarks were identified on 40 cephalometric radiographs, and the mean error from automatically identified landmarks was 2.59 mm. The accuracy of those automated methods was not as good as those associated with manual identification. In addition, cephalometric landmarks need not be limited to simply obtaining patients skeletal characteristics but could also be applied to plan treatment and to predict treatment outcomes, including soft tissue changes. For those purposes, hundreds of variables of anatomical landmarks are needed.
In the present study, the manual and automated models were compared to find whether the automated model is able to attain a landmark detection accuracy similar to the humans. For that, the study was conducted using 600 raw X-ray images, which were randomly collected from an age group of 6–60 years. The 300 images were collected from Open-sourced dataset from the internet and the remaining images were collected and the dataset was made indigenously and made publicly available for further studies. These 300 lateral cephalogram images that are custom created were manually annotated by two orthodontists who had a clinical and academic experience of over 10 years. These 600 images were randomly mixed for increasing the complexity of the detection of landmarks and were categorized into two sections: (a) Training (520 X-rays), and (b) Testing image (80 images) datasets. The training images were used to build an architectural model from a base model called EfficientNetB7 for detecting the landmarks. The EfficientNetB7 architecture was found by Google, which was far more superior than other currently available architectures for computer vision applications. It has the advantage of faster processing with less amount of data over the other currently available superior models. So, these EfficientNetB7 models are a suitable opponent for the other methods. 26 Nonetheless, the models applied for landmark identification in orthodontics are not comparable due to several reasons. The older models were built based on their own dataset and not available for public use. Since the datasets used for building each model are not similar, the comparison can lead to false results. The amount of data used for building each model varied, and the efficiency of those models was based on those datasets. Once the model is made, the efficiency of this model was analyzed by testing the remaining dataset. The result was obtained in pixels. The mean detection score for each of the 19 landmarks was formed for the manual annotation method and automated model using RMSE score. By comparing the testing dataset result with the manually annotated landmarks, the accuracy of detecting the landmarks was evaluated and compared. For comparing the result, the R2 score is calculated, which shows how much variation is present for detecting a landmark by the model. In this way, the accuracy of the model can be assessed better.
The learning and testing data included images from various malocclusion patients in the present study. From the first formulation of the current study, the selection of these mixed images was intended to test the model’s performance in a more complex condition, rather than identifying landmarks on images from good-looking subjects.
For registration, since people’s heads vary in shape, even though the closet image to the training data was selected as the reference image for each test image, there were still missed situations. This means that after the registration, the patch we created for the test does not include the ground-truth landmark. For the ISBI dataset, there is only one missed patch, and the rate is about 0.0002. Overall, it has little impact on the results. For Testset2 of the ISBI Grand Challenge, it is seen that Landmark 3, Landmark 6, Landmark 13, and Landmark 16 have relatively low accuracy. However, the process works fine on Test1. After visualizing the testing result, it was clear that the anatomy of those failed cases is very different from the successfully detected ones.
In general, the pattern of differences between AI and orthodontists demonstrated that AI acts like an orthodontist. For example, when doctors had difficulty in identifying landmarks on poor quality images, so did AI. This might be the reason why image factors did not meaningfully affect the accuracy of AI in finding landmarks. In those subjects with fixed orthodontic appliances, massive prostheses, and surgical bone plates, it was initially anticipated that there would be difficulties in identifying the landmarks because of the multiple metallic artefacts. However, metal artefacts did not appear to have a clinically significant impact on identifying landmarks either.
As a limitation of the present study, the way AI learned during the training session and identified landmarks later in the test step are not explainable without describing computer science jargon. Although some technical details were necessary, this present study intended to focus on showcasing the results from AI. Upon repeated trials, AI always found identical positions. How much learning data might be sufficient enough to teach AI is currently unknown. Furthermore, it could be conjectured that the number of target landmarks might also be a contributing factor in deciding a sufficient number of learning data. A study to elucidate the sufficient quantity of data for deep learning of AI might be necessary for the future.
From the clinical perspective, however, AI would never replace trained specialists in orthodontics, nor might AI intend to replace a comprehensive orthodontic training program. Rather it could supplement, augment, and amplify diagnostic performance by objectively evaluating each patient seeking orthodontic treatment. The AI proposed in the present study can be compatible with the current clinical environment and would retain its validity under the constant supervision of experts in orthodontics.
For future research, the current study can be utilized to develop a graphical user interface (GUI) that offers either automatic or semi-automatic landmark detection for clinicians. In automatic mode, the system can extract a region of interest (ROI) and select the proper model for each landmark detection based on registration. Alternatively, in the semi-automatic mode, the clinician can manually extract the ROI using a bounding box and select the corresponding model for each landmark detection, which can reduce computational time. Additionally, the dataset created by the study is available as open source for future studies to utilize. However, the current model only detected landmarks in patch images without considering global-context information, which is the relationship among all landmarks. Therefore, utilizing global-context information in future research could improve the model’s performance.
Limitations of the Research
Deep learning models in CNN have limitations such as memory leakage and overfitting, requiring a large dataset to improve accuracy. Memory leakage can cause poor landmark prediction, and overfitting can occur when the model is too complex. The vanishing gradient problem can also arise from overfilling data beyond the model’s threshold. It is not feasible to continuously increase the dataset, and variations in lateral cephalometric images can lead to poor landmark accuracy. Therefore, a clear, distortion-free lateral cephalogram is necessary to build a better model.
Conclusion
The study proposed an approach to automatically predict landmark location and used a deep learning method in AI. The results shows that the model is accurate enough to detect the landmarks correctly as manual annotation method, which proves that the proposed method is effective for cephalometric landmark detection. The proposed method could be used for landmark detection in clinical practice under the supervision of orthodontists.
Footnotes
Declaration of Conflicting Interests
The author declared no potential conflicts of interest with respect to the research, authorship, and/or publication of this article.
Ethical Approval
An approval was obtained from the Institutional ethics committee (IEC) of College before starting the study, Reference no: SGDC/152/2019/3729.
Funding
The authors received no financial support for the research, authorship, and/or publication of this article.
Informed Consent
Not applicable