
Abstract
Aim
The aim of this study was to assess the accuracy of Dolphin VTO prediction in patients requiring extraction treatment by comparing the VTO-predicted values and post-treatment values.
Method
Digital pre and post-treatment lateral cephalograms of 52 patients having Class I bimaxillary protrusion were taken and transferred in Dolphin Imaging software for analysis and VTO prediction. A composite analysis was made containing 17 dental and soft tissue parameters (Holdaway, Mc Namara, Rakosi, Steiners, and Tweed analysis).
Results
A comparison between post-treatment and VTO-predicted values showed that software was able to predict soft tissue changes accurately in regions such as nose, inferior sulcus depth, and chin region (p > .05). In dental changes, software was able to predict the inclination of upper incisors to Sn and palatal plane correctly (p > .05). Parameters for other areas such as upper and lower lip, position of upper and lower incisor show significant difference in their VTO and post-treatment values (p < .05) showing inaccuracy of the software.
Conclusion
The VTO prediction of dental and soft tissue changes was significantly different from the post-treatment values for parameters such as superior sulcus depth, lower lip to h line, subnasal to h line, upper lip thickness, lip strain, nasolabial angle, interincisal angle, Ui-NA, Li-NB, and IMPA. For nasal prominence, inferior sulcus depth, chin thickness, UI-SN, and UI-PP, there was no significant difference seen. Since, for most of the parameters, a significant difference was found between the post-treatment and the predicted values, so it was inferred that the software-based VTO prediction could not be fully relied for any treatment planning.
Keywords
Introduction
Since for patients seeking orthodontic treatment, improvement in facial aesthetics is the most common motivation, and it is important before the start of the treatment for the patient to have an idea of its post-treatment results in order to build a trust with the doctor. 1 Dental VTO (virtual treatment planning) is one such tool that aids in obtaining this visual picture and assessing the progress of the treatment and alteration of the plan. These predictions, which were previously done manually, are now a days done with the help of digital cephalograms and computer software. 2
Many studies have been carried out to check the reliability of these software in predicting the changes after orthognathic treatment, but the accuracy of computer-aided VTO prediction in both soft tissue and dental changes after orthodontic treatment is still under debate. 1 Some studies showed high correlation between the predicted and the actual post-treatment values, while others showed a clinically significant difference in all measurements. 3 The prediction of dental and soft tissue changes after extraction treatment is yet not reliable. Hence, this study was done with an aim to assess the reliability of a software in predicting post-treatment dental and soft tissue changes after orthodontic treatment following extraction.
Materials and Methods
Sample Size
A sample size was established by G*power, version 3.0.1 (Franz Faul Universitat, Kiel, Germany). A sample size of 52 patients would yield 80% power to detect significant differences, with an effect size of 0.46431 (derived from the article of Xu Zhang et al.) and significance level at 0.05.
Records of 58 patients were selected at the start of the study. Adult patients with a mean age of 20.85 ± 1.392 years with Skeletal Class I malocclusion and Angle class I bimaxillary dental protrusion having crowding/spacing less than 4 mm in each arch with average growth pattern were selected. Patients with a history of any craniofacial trauma, syndrome, or deformities (e.g., cleft lip and palate), maxillofacial or orthognathic surgery, temporo-mandibular disorders, or history of previous orthodontic treatment were excluded from the study.
Out of 58 patients, there were six dropouts from the study during the course, as correct digital radiographs for these patients could not be obtained due to poor image quality. So, digital pre and post-treatment lateral cephalograms of the remaining 52 patients (34 female and 18 male) were taken. All patients were diagnosed and treated with 0.028 inch slot preadjusted edgewise appliance (MBT) and sliding mechanics. Transpalatal arch was used for maximum anchorage in the maxillary arch.
These records were then transferred in the Dolphin Imaging 11.95 premium software for cephalometric tracing, analysis, superimposition, and treatment simulation. After transferring the cephalograms in the software, a composite analysis was formed using nine soft tissue and ight dental parameters (derived from Holdaway’s, McNamara’s, Rakosi, Steiner’s, and Tweed analysis). The parameters were chosen on the basis of magnitude of change they showed after retraction. Eight soft tissue parameters were chosen from Holdaway analysis in order to know and predict the changes in nose, lip, and chin area, whereas nasolabial angle was selected from McNamara analysis, as significant changes occur in the nasolabial angle post retraction. The dental parameters were based mainly on the change of incisor position and inclination in relation to different planes.1, 3 The composite analysis was formed to address maximum areas of interest of change with a minimum number of parameters. The lateral cephalograms were then calibrated and standardized for eliminating any magnification error (Figure 1).
Caliberation of the Radiograph before Cephalometric Analysis.
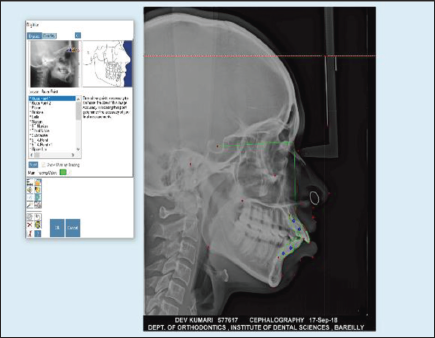
Pre and post-treatment cephalograms were digitized and all the required landmarks for composite analysis were identified and marked using the software to obtain cephalometric values.
The treatment simulation module was then used in order to generate a VTO-predicted treatment outcome from the digitized pretreatment cephalograms by using first premolar extraction treatment plan (Figure 2).
Dolphin Treatment Simulatiom Module.
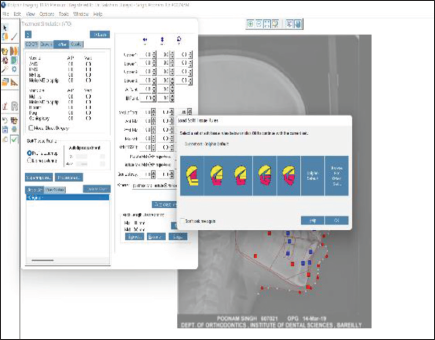
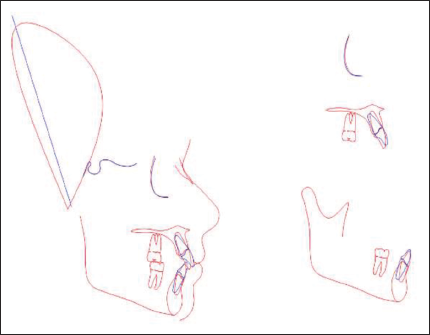
The values for planned incisor and molar positions were entered into the simulation module. Predicted profile and their cephalometric values were obtained after achieving the set goals for prediction. The mean difference for each parameter was calculated by subtracting VTO-predicted values from post-treatment values. Also, the cephalometric tracing of the VTO-predicted profile was superimposed with the post-treatment cephalometric tracing using FH reference plane to generate the cephalometric superimposition showing the difference between the post-treatment cephalometric values and the values obtained after VTO prediction (Figure 3).
Cephalometric Superimposition of Predicted and Post-treatment Tracing with Blue Line Showing Post-treatment Tracing and Red Line Showing VTO Prediction.
Intraoperator reliability was tested using intraclass correlation coefficients for which 15 cephalograms were randomly selected and retraced after an interval of 4 weeks (T1 and T2). The intraoperator reliability was found to be excellent (ICC = 0.96). The difference between the post-treatment and the VTO-predicted values of the soft tissue and dental changes was calculated. The positive and the negative sign of the value determined the underestimation or overestimation of the VTO prediction.
Statistical Analysis
Data obtained was entered using MS Excel version 2016. Data was analyzed using IBM SPSS Statistics for windows (Version 25). Test of homogeneity was performed and parametric tests of significance were conducted. Descriptive statistics were calculated for the continuous variables and the difference between follow ups were calculated using paired t-test. Graphically, the values were represented. The p value less than .05 was considered to be significant.
Results
On comparing the post-treatment values with the predicted values for soft tissue changes, it was seen that a highly significant difference with a p value <.0001 was obtained in parameters such as superior sulcus depth, lower lip to H line, subnasal to H line, upper lip thickness, and nasolabial angle showing that the prediction in these areas was inaccurate. No significant difference was found in soft tissue parameters such as lip strain, nasal prominence, inferior sulcus depth, and chin thickness, showing that the prediction in chin and nose areas was accurate.
On comparing predicted and post-treatment values for dental changes, a highly significant difference with a p value < .0001 was seen in parameters such as interincisal angle, U1-NA (mm), L1-NB (mm), L1-NB (deg), and IMPA, and a significant difference with a p value < .05 was seen in parameters such as U1-NA (deg), showing that prediction in these areas was inaccurate. Whereas parameters such as U1- SN and U1-PP did not show any significant difference and prediction was accurate in these areas (Table 1)
Statistical Comparison of the Post-Treatment and VTO-Predicted Values.
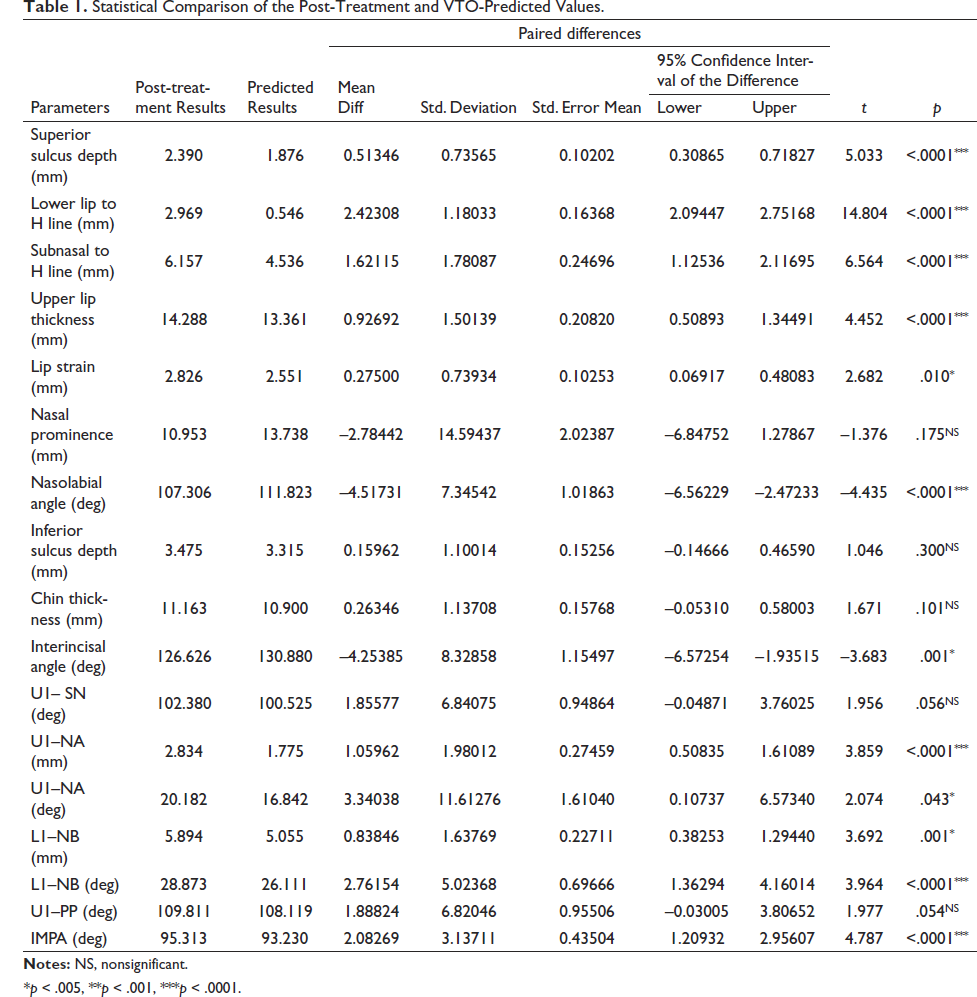
*p < .005, **p < .001, ***p < .0001.
Discussion
Patients with severe skeletal or dentoalveolar abnormalities, such as cases of bimaxillary protrusion, often face problems such as unpleasant convex profile, protrusive lips and teeth, excessive lip procumbency and incompetency, mentalis strain, extreme gingival display, and many more. These features are aesthetically unacceptable to some patients, and they report to the orthodontist not only for dental correction but also seeking for achievement of pleasing soft tissue profile. Hence, patient’s major issues should always be kept in mind, and it is beneficial to give him an idea of his post-treatment results in order to eliminate any unrealistic expectation. 1 For this, a proper visual planning is required, which not only helps in guiding the patient but also directs the doctor in setting proper treatment goals for achieving required profile. 4
The term VTO was coined by Holdaway 5 in 1971 but has been closely associated with Ricketts 6 and Rocky Mountain Data System (RMDS). The introduction of VTO prediction has been a great achievement in the field of orthodontics. Earlier these predictions were done manually according to the methods suggested by Jacobson and Sadowasky 7 and Holdaway 5 using acetate papers and superimposition templates of growth forecast, constructing a soft tissue profile to reflect desired changes during the treatment. With the advent of computers and different digital cephalometric software, the method of prediction has become much easier and accurate, causing less stress to doctor and even the patient. Historically, lateral cephalograms form the basis for these treatment predictions. 8
Previous studies on the accuracy and reliability of the Dolphin VTO in predicting treatment results were mainly performed on the soft and hard tissue responses to orthognathic treatment (with or without orthodontic treatment).5, 9–14 It has been found that the Dolphin VTO was acceptably accurate in predicting the changes of hard tissue landmarks of SNA, SNB, and facial angle. In soft tissue changes, most studies have found that the tip of the nose was the most precisely predicted landmark, whereas the subnasal and lips were the least accurately predicted landmarks after orthognathic treatment.12–14 However, the accuracy of Dolphin VTO in the prediction of soft tissue changes after orthodontic treatment is still unclear.
In the present study, a composite analysis consisting of 17 dental and soft tissue parameters was constructed so that both dental and soft tissue changes could be well appreciated with the help of a single analysis and VTO values and the post-treatment values were compared.
In the upper lip area, while comparing the post-treatment value of superior sulcus depth, upper lip thickness, and subnasal to H line with VTO-predicted value, a significant difference was found for all three parameters. So, the software was found to be inaccurate for upper lip region. For lip strain, statistically nonsignificant difference was found between the post-treatment and VTO-predicted values. The lip strain tends to decrease after treatment, as when the teeth are proclined, the lips are stretched leading to excessive tapering and thinning of the vermilion border. When the teeth are retracted after extraction, the lips relax and the strain is removed. 15
Hence, the software was found to be inaccurate for upper lip region, which was similar to observations made by Zhang 1 and Thuan 16 in their respective studies.
In the nose region, when post-treatment values of nasolabial angle were compared with the predicted values, it was noticed that there was a significant difference between them. The nasolabial angle decreases after anterior retraction due to backward positioning of the vermilion border of upper lip after retraction leading to an increase in the angle between the upper lip and the nose. 17
For nasal prominence, a statistically nonsignificant difference was found between the two, suggesting that the prediction around nose area was accurate. Similar result was seen by Lew 18 in his study indicating the reliability of the software for this region.
In the lower lip region, on comparing the post-treatment and predicted values of lower lip to H line, a significant difference was found between the two, showing that the software was inaccurate for predicting changes in this parameter. In support of this are the studies done by Zhang 1 and Thuan 16 who concluded that the software was not accurate in predicting changes in the lower lip area.
Normally, when the anteriors are proclined, it leads to protrusion of the lower lip increasing the distance, which ideally should be 0.5 mm lingual or buccal to H line. After retraction, the teeth move lingually decreasing the protrusion of the lips and also decreasing the distance between the lower lip and H line. 19
For parameter like Inferior sulcus depth, it was seen that the post treatment and VTO predicted values did not show any statistically significant difference between them, suggesting that the software was accurate in predicting the changes in this parameter. It was similar to results of a study done by Lew 18 and Zhang. 1
The value of inferior sulcus depth increases after treatment because post extraction, soft tissue point B moves posteriorly following retraction. This increases the distance between the mentolabial sulcus and H line. 20
Since the position of upper and lower lip as well as the nasolabial angle totally depends on the position of upper and lower incisor placement which might be subjected to clinician’s error, the variation may happen between the predicted and actual values depending upon the operator.
In the chin region, soft tissue chin thickness was analyzed. On comparing the post-treatment values with the predicted values of soft tissue chin thickness, no significant difference between them was found, suggesting that the software was accurate in predicting changes in the chin area, which was in accordance with the study done by Lew 18 and Zhang. 1 It was because the retraction of teeth does not make much difference in the chin area. The change is only seen when the patient is growing and some of the hard and soft tissue growth is remaining. 21
For evaluation of dental changes, inclination of upper and lower incisors was assessed. When predicted and actual post-treatment values of interincisal angle, U1-SN, U1-NA (mm), U1-NA (deg), LI-NB (mm), LI-NB (deg), U1-PP (deg), and IMPA were compared, it was found that significant difference was found for all the parameters except UI-SN and UI-PP showing that the software prediction was accurate for changes occurring in only these two parameters. Similar results were found in the study done by Izabella, 22 Thomas, 23 and Lew. 18
The inaccuracy in prediction of incisor inclination might be attributed to the difficulty faced during placement of the tooth while using treatment simulation module in the software or due to failure of the clinician to attain the desired objective. The difference in the predicted and actual post-treatment values of soft tissues could involve variations in individual response to treatment and also to the growth variation that exists.
Hence, the parameters which were accurate in prediction were nasal prominence, inferior sulcus depth, chin thickness, UI-PP, and UI-SN, while others were unreliable. It was also found that the software was more reliable in predicting soft tissue changes than dental changes.
The software prediction of dental and soft tissue changes is based on a fixed ratio to stimulate the changes after treatment, but the validity of this ratio is still unknown. According to Holdaway, 5 the ratio of movement of upper lip to upper incisors was 1:1, whereas Ricketts 6 believed this value to be 2:3. This ratio of the movement of soft tissue and hard tissue lies in a vast range of 1:1.1 to 1:2.6. 1 This variation is because the changes in soft tissue do not only depend on hard tissue but also on several other factors such as soft tissue thickness, tension, age, sex, ethnicity, dentofacial abnormality, and the technology used for the study. The main disadvantage of software prediction is that it does not take these factors into account. Hence, the use of such software prediction in clinical use should be done with maximum caution to eliminate any unrealistic patient’s expectation. 24
Conclusion
The VTO prediction of dental and soft tissue changes was significantly different from the post-treatment values except for nasal prominence, inferior sulcus depth, chin thickness, UI-SN, and UI-PP.
So, it should be kept in mind while planning a treatment outcome that the software-predicted VTO in dental and soft tissue regions such as upper and lower lip cannot be fully relied, and the clinician should not plan his treatment or guide the patient solely on the basis of these simulations.
Footnotes
Declaration of Conflicting Interests
The authors declared no potential conflicts of interest with respect to the research, authorship, and/or publication of this article.
Ethical Approval
Ethical approval was obtained by Communication of Decision of the Institutional Ethics Committee (IEC) of Institute of Dental Sciences, Bareilly (ref no. IEC/105/2021), the form for which has been attached below.
Informed Consent
A general patient consent was taken at the start of his treatment mentioning that the photos and records of the patient can be used for future clinical research and study. No specific consent for this study was taken, as it was a record-based retrospective study.
Funding
The authors received no financial support for the research, authorship, and/or publication of this article.