
Abstract
Aim and Objectives:
This cross-sectional study examined the Bolton index of 6 maxillary anterior teeth and the facial esthetic ratios in the Turkish population with healthy facial appearance.
Materials and Methods:
Face photographs of the subjects, taken using a DSLR camera, were fixed in the Frankfort horizontal plane. The measurements were made on the images using ImageJ 1.52a software and certain ratios of face and teeth were calculated such as Bolton index (BI). Differences between genders were evaluated and comparisons with golden ratio of 1.618 were conducted on SPSS.
Results:
Males had significantly higher upper, middle, lower, and total facial height compared to females (P < .001, P = 0.0257, P = .0243, P < .001, respectively). Right to left distance of labial commissure (LC)/distance from the distal edge of right canine to the distal edge of left canine ratio had golden proportion. Ratio of naso-menton length to facial width showed golden ratio only in males. The ratio of the width of upper middle incisor to the width of canine tooth also showed golden ratio in both genders.
Conclusions:
The present study presents noteworthy data about facial and teeth ratios of the young adult Turkish population that will guide plastic surgeons and orthodontists in clinical practice.
Introduction
Kant defined esthetic judgment as feelings of pleasure or displeasure. 1 The facial region mediates the esthetic perception of a person, creating a pleasant perception in both himself/herself and others. Therefore, it has continued to be at the center of esthetic perception for centuries. 2 There is evidence to support the idea that faces are perceived as beautiful among different cultures and ethnic groups, based on certain universal parameters, like the neoclassical law and the golden ratio, where objective assessment of facial beauty and symmetry is indeed possible. 2 It has long been approved that the eyes and mouth are the basic elements of the face in face composition. 3 One of the important elements of facial attractiveness is the general sense of symmetry, which is considered very important by many. 3 For centuries, the golden ratio or golden proportion has been considered as the perfect or ideal ratio for beauty. 2 The golden ratio was described by Pythagoras in 6th century BC and shortly afterwards by the German geometric, Euclid. 4 It was discovered by Filius Bonacci that the golden ratio has a numerical value between 1 and 1.61803399 and is symbolized as Phi”. 2 Many studies have also shown that beautiful faces have face measurements close to the golden ratio.2,5 Due to the need to maximize such esthetic perceptions, prosthetic and restorative treatment applications have recently increased, especially in the anterior teeth. 6 Maxillary anterior teeth are considered as the key element of esthetic perception called dentofacial beauty. 7 Various methods are used to restore and replace the maxillary anterior teeth and to adapt the anterior teeth to the face types, the golden ratio and the gold standard of the teeth. These methods include measuring the proportion of face such as bizygomatic width, distance between pupils, distance between canthus, mouth width and nose width. 6 ,8 In 1958, Bolton developed two ratios (formulas), which are known by his name today, for detecting the relationship between all teeth, including lower and upper 6 teeth, as well as lower and upper incisors. 9 The rates and analysis reported by Bolton are widely used in orthodontic treatment planning today. 9 In this analysis, the mesiodistal dimensions of permanent teeth are measured. 10 The sum of the sizes of the lower and upper anterior teeth and the sum of the sizes of 12 or 6 teeth in the lower and upper jaw except for the second and third molars are compared separately, except for the second and third molars. 10 Values are named as Bolton index (BI), 11 which helps in the diagnosis and treatment planning of orthodontic cases in dental clinics and determines the functional and esthetic outcomes. 10 According to Bolton, there should be a normal overjet and overbite amount (a certain ratio between the sum of mesiodistal dimensions of the lower teeth and the sum of mesiodistal dimensions of the upper teeth) for a complete fossa-tubercle relationship (for an ideal occlusion). 10 This rate was reported to be 77.2% for 6 anterior teeth and 91.3% for 12 teeth. 11 The process of measuring tooth size is important in orthodontics as well as genetic and anthropological studies. 12 When viewed from the front, the ratio of the width of the front central incisor to the lateral incisor and the lateral incisor to the canine is found to be 1.618. 6 Racial and gender differences in the mean size of the maxillary anterior teeth and the symmetry and esthetic proportions of the facial proportions have been reported in many studies, but the results are valid only for certain isolated populations. For this reason, in this study, the golden ratio of teeth and esthetic ratios of certain anthropometric measurements of the face and BI of 6 maxillary anterior teeth were examined in volunteers with healthy facial appearance representing the Turkish population. In this way, this study aims to provide clinicians an important perspective because it is important to know both the normal values and proportions of the society for esthetic purposes and reconstructive surgery, as esthetic perception varies according to cultures. Thus, doctors can provide more satisfaction in dental construction, repair, jaw repair, and many other dental and facial surgeries. The findings of this study are meant to be beneficial for surgeons, especially for approaching Turkish patients, but it is also among the aims of the study to compare the findings obtained with different populations, which contributes to anthropologists and forensic doctors in examining the identity.
Materials and Methods
All authors declare that the study was conducted in accordance with the World Medical Association Declaration of Helsinki “Ethical Principles for Medical Research on Human Subjects”.
This cross-sectional study was conducted with the participation of 66 volunteer students (30 female, 36 male) aged 18 to 22, after obtaining ethical approval. A power analysis with 90% confidence level was used to determine sample size. It was aimed to include healthy adults in the study. Volunteers having no craniofacial anomaly and cleft lip palate, no orthodontic treatment, no different ethnic or racial characteristics, no head or face trauma, no history of surgical operations in the facial area, and no neurological or mental problems were included in the study. The heads of the subjects included in the study were ideally placed under constant light and at a distance of 1 m in an orthonormal coordinate system with 3 symmetry planes: the orbital plane, mid-sagittal plane, and Frankfort horizontal plane. DSLR camera (Canon EOS 80D) settings were fixed at ISO 100 f/4.5 exposure 1/25 and photos were taken. Scaling paper of known size was used as a scale for each shot. After the images were transferred to the computer environment, reference points were marked. The landmarks used in this study are based on Farkas’s definitions. 13 These landmarks were trichion (Tr)—the front line of the hair in the midline; glabella (Gb)—the most prominent point of the forehead in the anterior profile; spina nasalis (Sn)—the combination of the lower part of nasal septum and the upper lip; menton (Me)—the lowest soft tissue point of the mandible; zygion (Zy)—the most lateral point of the zygomatic bone on the arcus zygomaticus; right labial commissure (LCr); left labial commissure (LCl); distal edge of the right canine (DCr); and distal edge of the left canine (DCl). After marking, measurements were made using Image J 1.52a program with a precision of 1/100mm. These measurements are presented as follows (Figure 1):
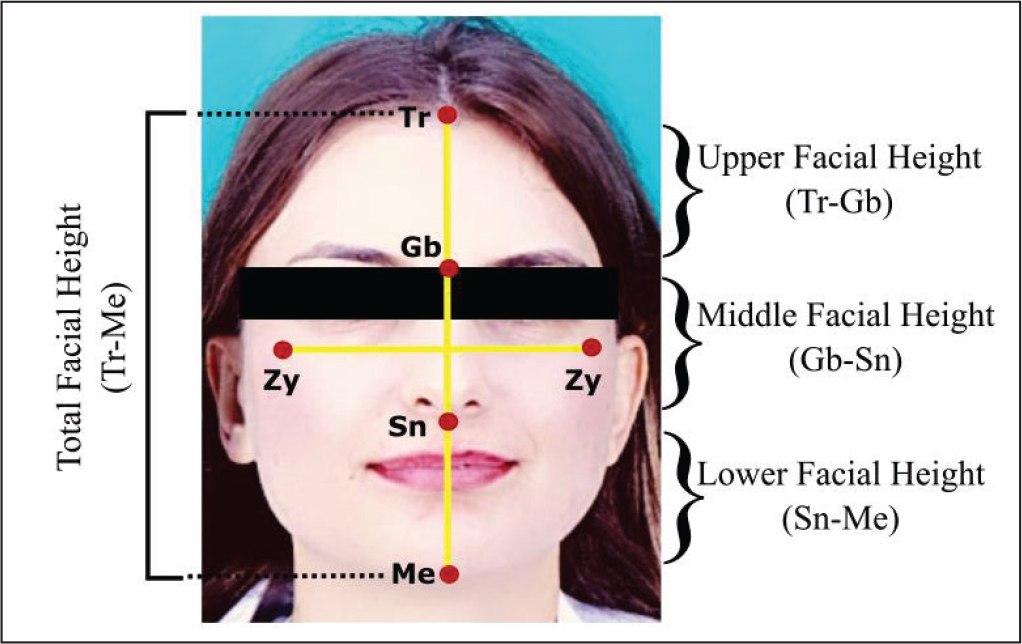
Upper facial height (Tr-Gb): distance between the front line of the hair and the glabella
Middle facial height (Gb-Sn): distance between glabella and spina nasalis
Lower facial height (Sn-Me): distance between spina nasalis and menton
Total facial height (Tr-Me): naso-menton length
Facial width (Zy-Zy): byzyomatic width
LCr-LCl: distance from the right labial commissure to the left labial commissure
DCr-DCl: distance from the distal edge of the right canine to the distal edge of the left canine
A: the width of the upper middle incisor
B: the width of the upper lateral incisor
C: the width of the upper canine tooth
D: the width of the lower middle incisor
E: the width of the lower lateral incisor
F: the width of the lower canine tooth.
After measurements were made, they were used in the following calculations of specific ratios:
Facial index (FI): naso-menton length/bizygomatic width, anterior Bolton index (BI): (sum of mesiodistal width of mandibular 6/sum of mesiodistal width of maxillary 6)x100, LCr-LCl/DCr-DCl, Tr-Me/Gb-SN, Tr-Me/SN-Me, Tr-Me/Tr-Gb, Tr-Me/Zy-Zy, Zy-Zy/LCr-LCl, left and right A/B, B/C, A/C, D/E, E/F, D/F. Finally, Tr-Gb, Gb-Sn, Sn-Me, Tr-Me, Zy-Zy, FI, and BI are compared between males and females. LCr-LCl/DCr-DCl, Tr-Me/Gb-SN, Tr-Me/SN-Me, Tr-Me/Tr-Gb, Tr-Me/Zy-Zy, Zy-Zy/LCr-LCl, left and right A/B, B/C, A/C, D/E, E/F, D/F are compared with the golden ratio of 1.618.
Statistical Analysis
Statistical analyses were performed using the SPSS software (IBM SPSS Statistics for Windows, Version 21.0, Armonk, NY). Student t-test was used for comparisons. P < .05 was considered statistically significant.
Results
The average age of the volunteers between the ages 18 and 22 was 19.9 ± 1.5. The reference points were marked on a total of 66 photographs of faces; the distances between the marks were measured; and comparisons were made by calculating the ratios mentioned above.
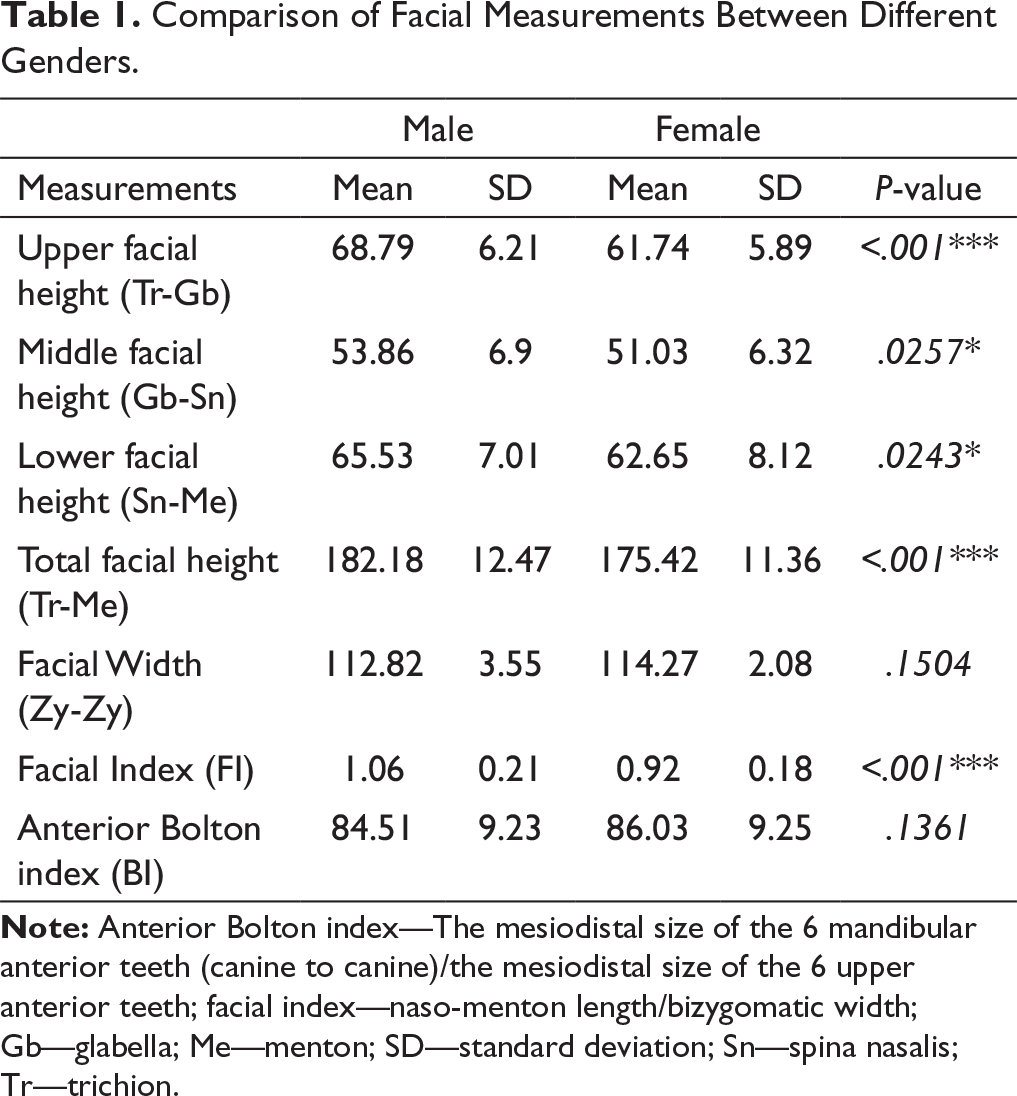
According to the results, there were some differences between the genders. Males had statistically significant higher upper, middle, lower, and total facial height (Tr-Gb, Gb-Sn, Sn-Ma, and Tr-Me, respectively) compared to females (P < .001, P = .0257, P = .0243, P < .001, respectively). However, no difference was found between genders in terms of facial width. Thus, FI was higher in males compared to females (P < .001). Anterior BI was found to be 84.51 ± 9.23% in males and 86.03 ± 9.25% in females and there was no statistically significant difference between the genders (P = 0.1361; Table 1).
Comparison of Facial Measurements Between Different Genders.
Comparisons with the golden ratio revealed that some proportions in the face and teeth show a golden ratio. LCr-LCl/DCr-DCl (distance from the right labial commissure to the left labial commissure/distance from the distal edge of the right canine to the distal edge of the left canine), left and right A/C (the ratio of the width of the upper middle incisor to the width of the canine tooth) showed the golden ratio in both genders as these values were not statistically significantly different from the golden ratio of 1.618 (P > .05). Tr-Me/Zy-Zy showed golden ratio only in males as it was not statistically significantly different from the golden ratio of 1.618 (P = .2401). Other ratios of face (Tr-Me/Gb-Sn, Tr-Me/Sn-Me, Tr-Me/Tr-Gb, facial width/LCr-LCl) did not have golden ratio as these values were statistically significantly different from the golden ratio of 1.618 (P < .001). Other parameters of teeth (left and right A/B, B/C, D/E, E/F, D/F) also did not have golden ratio as these values were statistically significantly different from the golden ratio of 1.618 (P < .001; Table 2).
Mean Ratios and Comparison With Golden Ratio (1.618) by t Test.
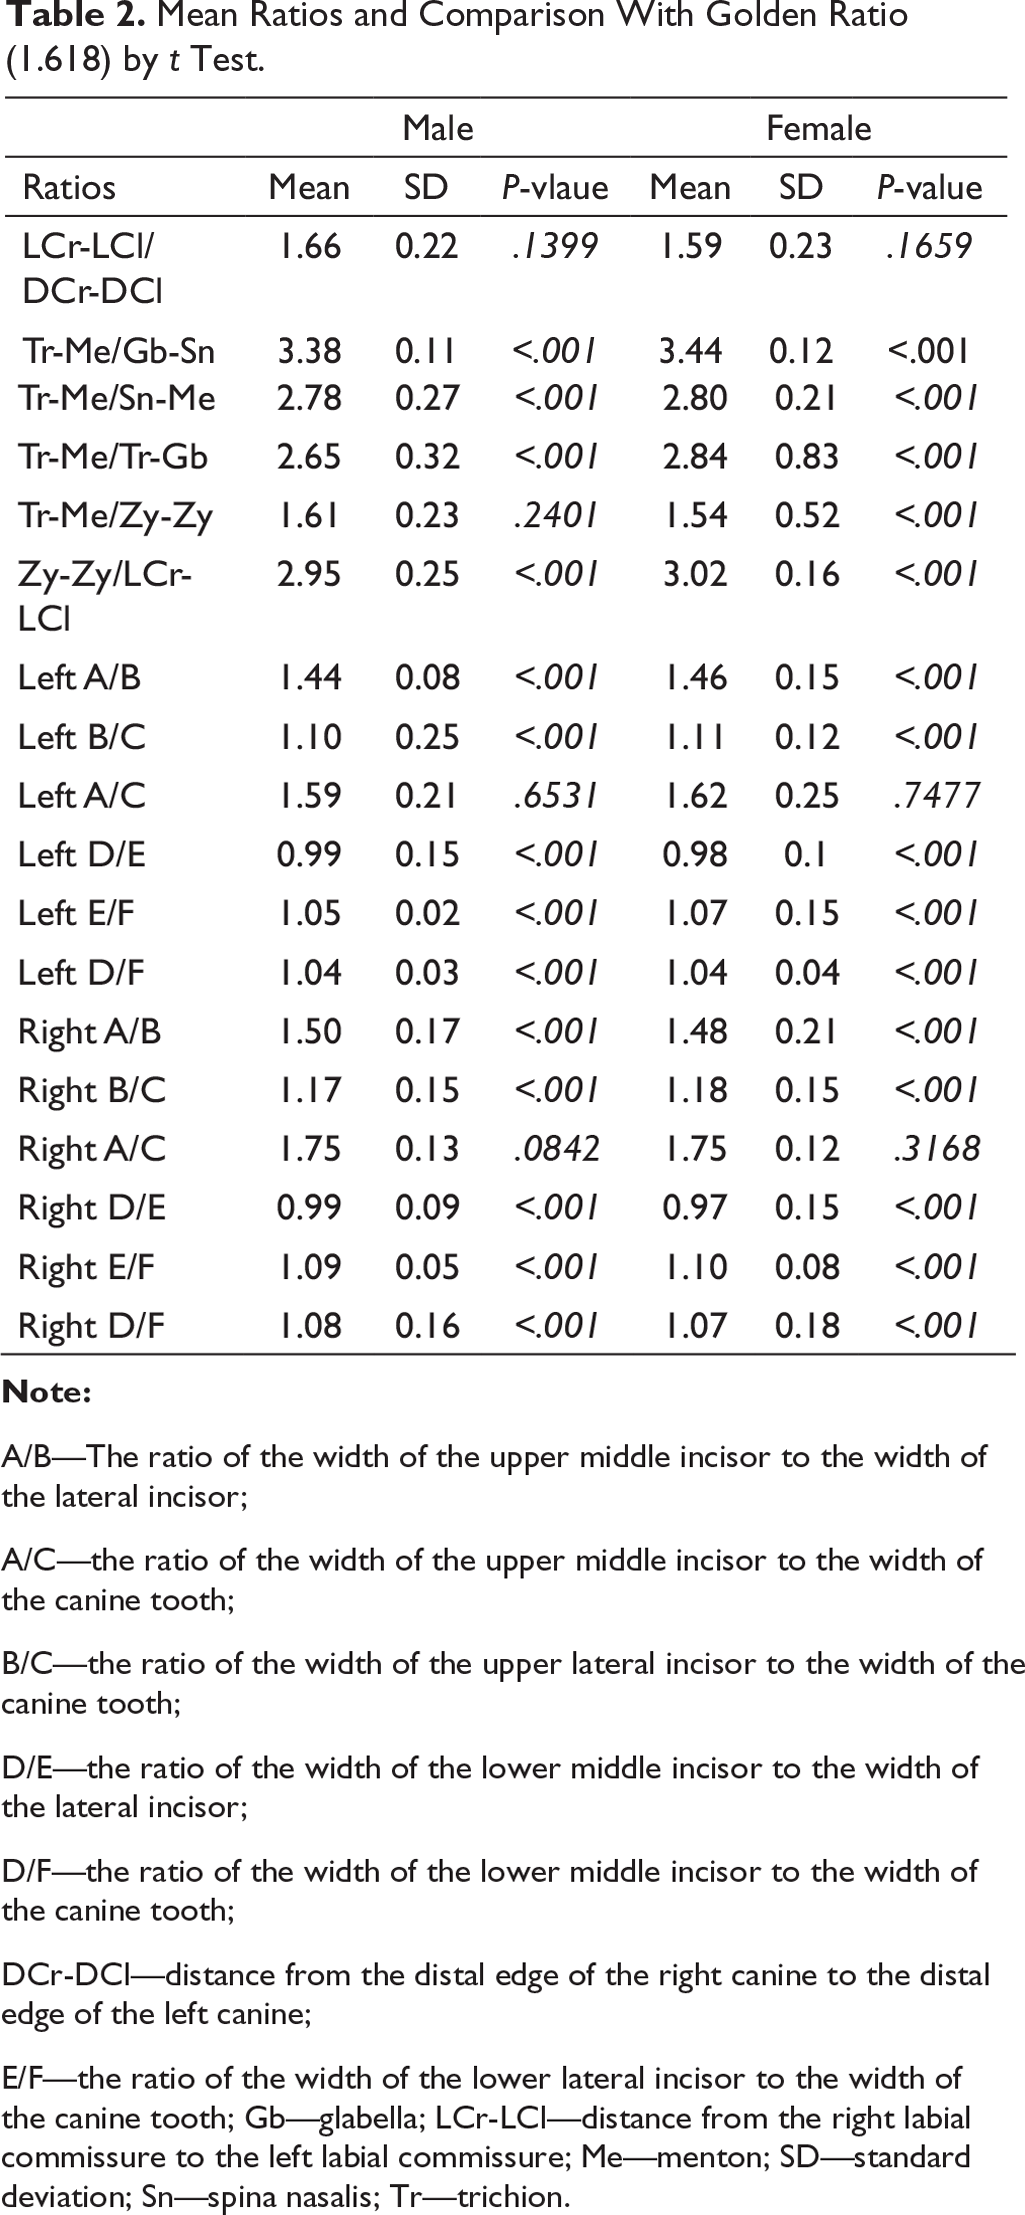
A/B—The ratio of the width of the upper middle incisor to the width of the lateral incisor;
A/C—the ratio of the width of the upper middle incisor to the width of the canine tooth;
B/C—the ratio of the width of the upper lateral incisor to the width of the canine tooth;
D/E—the ratio of the width of the lower middle incisor to the width of the lateral incisor;
D/F—the ratio of the width of the lower middle incisor to the width of the canine tooth;
DCr-DCl—distance from the distal edge of the right canine to the distal edge of the left canine;
E/F—the ratio of the width of the lower lateral incisor to the width of the canine tooth; Gb—glabella; LCr-LCl—distance from the right labial commissure to the left labial commissure; Me—menton; SD—standard deviation; Sn—spina nasalis; Tr—trichion.
Discussion
In this study, the relationship between various anatomic landmarks used to show facial esthetic proportions in young people representing the Turkish population and the Bolton ratios of 6 maxillary anterior teeth was evaluated. Laino et al reported that the relationship between the sizes of the upper and lower teeth depends on ethnic origin and gender. 14 Bolton ratios allow an orthodontist to understand the functional and esthetic results of a particular case without using a diagnostic device. 10 Clinically, Bolton ratios have been used to determine whether there is a need to reduce tooth size through interproximal stripping or to add tooth size by prosthetic restoration. 10 For this reason, Bolton rates provide effective guidance for orthodontic treatment planning. 10 Ideally, the Bolton ratio in the anterior teeth (anterior BI) is expressed as 77.2% when the 6 front teeth are measured, while the total ratio from right first molar to left first molar is 91.3%. 10 In the Chinese population, the normal anterior BI value was found to be 78.7% [10]. Ebadifar and Taliee reported anterior BI as 77.35% ± 2.14% in their study in patients who had orthodontic treatment. 10 In their study on ethnic differences with populations classified as Black, White, and Spanish, Smith et al reported anterior BI as 79.6%, 79.3%, and 80.5%, respectively. 15 In this study, the same parameter was found to be 86.03 ± 9.25% in females and 84.51 ± 9.23% in males, respectively. The ideal rate for anterior BI is approximately 77.2 ± 1.65%. 10 Anterior BI in our sample group was higher than the anterior BI values reported in literature. BI did not differ between genders; this has already been demonstrated earlier in individuals of the White, Black, and yellow races. 16
Facial aesthetic calculations have gradually improved from 2-dimensional proportions to 3-dimensional photographs. 17 Ceinos et al reported that 3D images would be beneficial to examine soft tissues, in addition to hard tissues, as cephalometric. 18 However, Mack reported that using the vertical dimension as the golden ratio indicator may be more useful in precisely measuring both hard and soft tissues. 19 In their study examining the role of golden ratios in the evaluation of facial esthetics, Rossetti et al concluded that the ratios between 3D face distances are not related to attractiveness. 20 Therefore, in the present study, 2D images were taken vertically.
In this study, a golden ratio was determined between LCr-LCl (Distance from the right labial commissure to the left labial commissure) and DCr-DCl (Distance from the distal edge of the right canine to the distal edge of the left canine). Ceinos et al obtained the ratio of 1.60260.136 “right labial commissure—left labial commissure/distal edge of the right canine—distal edge of the left canine” in their study of dentofacial ratio analysis. 18 In this study, this ratio was found to be 1.66 in males and 1.59 in females, respectively. This ratio can be especially important because the teeth and lips are important components of a smile. This close relationship with the golden ratio suggests that the contribution of lip width/tooth width to effective smile can be evaluated.
In order to look attractive, the upper anterior teeth must be proportional to the facial morphology. 21 In this study, the presence of golden ratios in both the left and right A/C (The ratio of the width of the upper middle incisor to the width of the canine incisive) were observed in both genders. No other repetitive ratio was found for other front teeth. In this study, left A/C was obtained as 1.59 in males and 1.62 in females , respectively, and right A/C was obtained as 1.75 in both males and females. In a study by Ceinos et al, this ratio was found to be 1.67060.355. 18 Hasanreisoglu et al obtained an average A/C ratio of 1.618 for both genders in groups representing the Turkish population. 8 Nikgoo et al reported that the golden ratio can be used to restore the maxillary central and lateral teeth anesthetically. 22 On the other hand, Alam et al reported that there was no such golden ratio observed in their studies examining the relationship between face ratios in different ethnic groups. 2 In this study, it can be thought that the golden ratio exists between maxillary medial and canine incisives due to the ethnic characteristics of the Turkish population.
Dentofacial parameters obtained from our anthropometric golden ratio and Bolton ratio studies on the Turkish population can be used to provide important data for anatomical and anthropological research as well as forensic research. In clinical practice, these data can serve as important guides and references among reconstructive and plastic surgeons, maxillofacial surgeons, orthodontists, and prosthodontists, particularly in analyzing treatment outcomes. Of course, esthetics does not always manifest itself with the golden ratio. The composition of the anterior 6 teeth is an important determinant for the holistic proportional relationship of the face. The picture that is desired to create a pleasant perception can only be captured by applying certain rules. However, the numbers 0.8 and 0.577 are also considered to be important numbers for aesthetic perception.
Limitations of the Study
The limitations of present study are that it was not reinforced by the evaluation of the face satisfaction score, which shows the relationship between the golden ratio and the perception of the volunteers’ own facial appearance.
Further Scope
The present study will contribute to the establishment of anthropometric measurement standards for the Turkish population in order to evaluate variations in craniofacial morphology and also to detect potential pathological abnormalities. In similar studies to be conducted in the future, it is recommended to work in larger groups and to be reinforced by evaluating the face satisfaction score.
Conclusions
This study revealed differences in Turkish men and women in terms of upper, middle, lower, and total face length but not BI of the 6 anterior maxillary teeth. One of the important findings of the study is that the distance from LCr-LCl/DCr-DCl and the ratio between width of the upper middle incisor and the width of the upper canine tooth on both the right and left sides showed the golden ratio. These differences and all the average anthropometric values obtained in the study are the values that clinicians can use to improve esthetic and reconstructive surgical applications to the optimum benefit point as the volunteers have healthy facial appearance and values that society perceives as normal. Thus, tooth construction and repair and jaw and face repair can be done more properly; especially, the differences in values due to age and race from other studies will be important in anthropological and forensic research in terms of identity determination.
Statement of Informed Consent and Ethical Approval
Necessary ethical clearances and informed consent was received and obtained respectively before initiating the study from all participants.
Footnotes
Declaration of Conflicting Interests
Funding
The authors disclosed receipt of the following financial support for the research, authorship, and/or publication of this article: The authors declared that there is no financial support or grant for this study.