
Abstract
Aims & Objectives:
The aim of the study was to evaluate and compare dimensional accuracy, surface characteristics and load deflection attributes of SS wires sourced from six different commercial houses.
Materials & Methods:
0.019” x 0.025” SS wire samples were divided into 6 groups and evaluated and compared for the aforementioned properties. Dimensional accuracy, surface roughness, frictional resistance, load deflection rate and ultimate tensile strength were evaluated and compared.
Results:
Dimensional accuracy did not vary significantly. Surface Profilometry proved 3M Unitek (Group 1) to be the wire with least irregularities. According to SEM, Modern Orthodontics (Group 6) and 3M Unitek (Group 1) in terms of ‘Sa’ and ‘Sq’ respectively had the smoothest surface finish. SS wires sourced from G&H Orthodontics (Group 2) exhibited least frictional resistance. Load deflection rates varied for all the groups for all three parameters under the study. UTS was best for SS wires sourced from Rabbit Force Orthodontics (Group 5).
Conclusion:
No wire from a single commercial house excels in all the parameters that were evaluated, each one having its aces and minuses.
Keywords
Introduction
Archwires form the backbone of the fixed orthodontic appliances. The forces acting on teeth are either generated by flexions in the archwires or the archwires guide the path of movement which is occurring in response to the forces generated by force delivery modules.
Since its inception, stainless steel (SS) in a very short span was a material of choice for making orthodontic appliances. SS is the strongest archwire alloy with high ultimate tensile strength (UTS), modulus of elasticity, less friction at the archwire–bracket interface. 1 It exhibits a smooth surface finish, solderability, weldability, and resistance to corrosion among others which made it an ideal material for orthodontic wires. 2 It has continued to be the mainstay archwire alloy since its introduction, and has stood the test of time.
SS wires marketed and available in the current Indian scenario are sourced from different overseas as well as indigenous commercial houses. They have a wide range of diversity taking their cost into consideration; thus making it a difficult task for the orthodontist to choose which wire is best considering the effectiveness as well as the cost of the archwires into consideration.
The present study was targeted to evaluate and compare the dimensional accuracy, surface characteristics, and load deflection attributes of SS wires sourced from 3 overseas (groups 1–3) and 3 indigenous (groups 4–6) commercial houses having a varied cost range.
Aims and Objectives
The aim of the study was to evaluate and compare dimensional accuracy, surface characteristics, and load deflection attributes of SS wires sourced from 6 different commercial houses namely 3M Unitek, G&H Orthodontics, American Orthodontics, JJ Orthodontics, Rabbit Force, and Modern Orthodontics.
Materials and Methods
This in-vitro study was carried out in the Department of Orthodontics and Dentofacial Orthopaedics at our institute in association with 3 neighboring engineering institutions that offered the necessary technical support for laboratory testing needed as an essential part of this study.
For evaluating dimensional accuracy, surface characteristics, and load deflection attributes, 0.019″ × 0.025″ SS wires were divided into 6 groups, each group comprising of 10 wires from the following commercial houses:
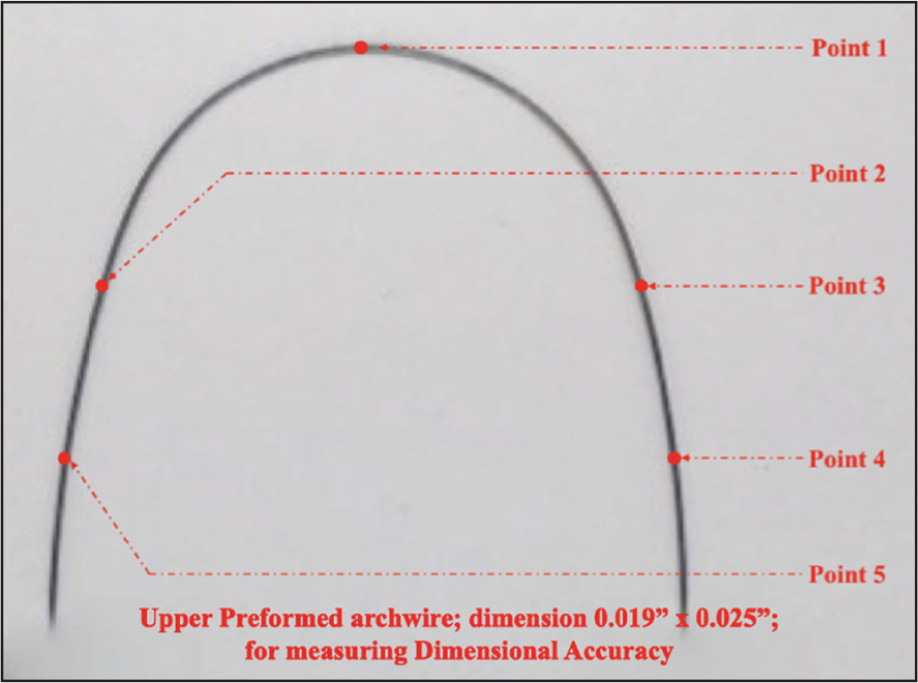
Digital Micrometer (Mituyoyo, Japan [0.001 mm accuracy]) was used to measure dimensional accuracy. Cross-sectional height and width of each wire was measured at 5 specific points (Figure 1): at midline of the archwire, 12 mm from the distal end of the archwire (right and left side), and 6 mm from the distal end of the archwire (right and left side).
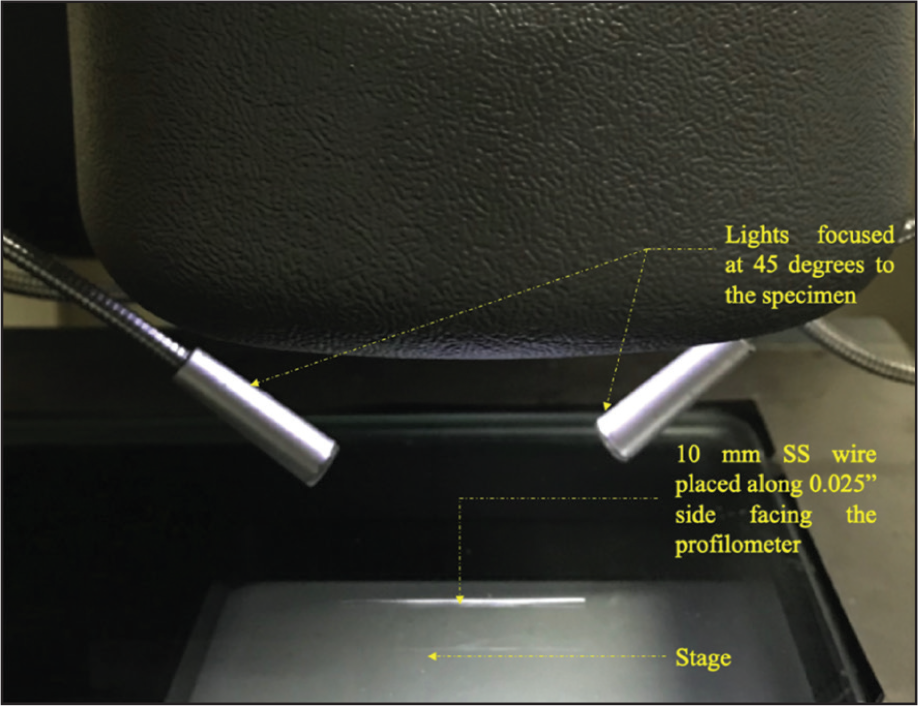
Surface profilometry and scanning electron microscopy (SEM) were used for surface evaluation. Surface profilometry was done with help of a non-contact profilometer (Rapid-I Precision System). This was done along the length of 0.025″ side of SS wire at the speed of 0.5 mm/sec over a distance of 10 mm. Sample was focused (Figure 2) at 67× zoom and surface profile of the wire was analyzed.
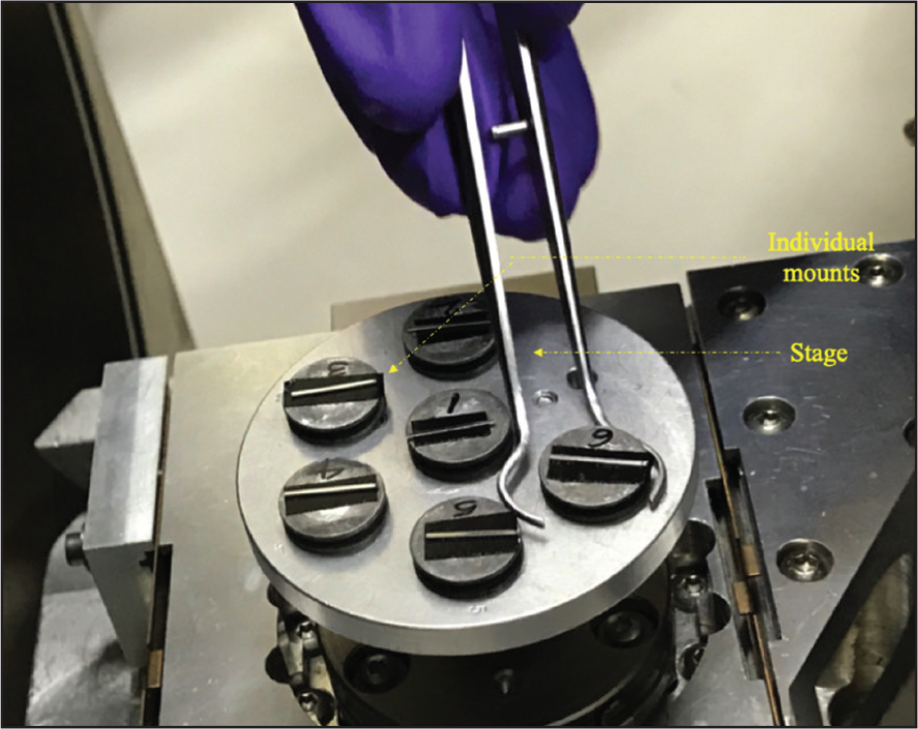
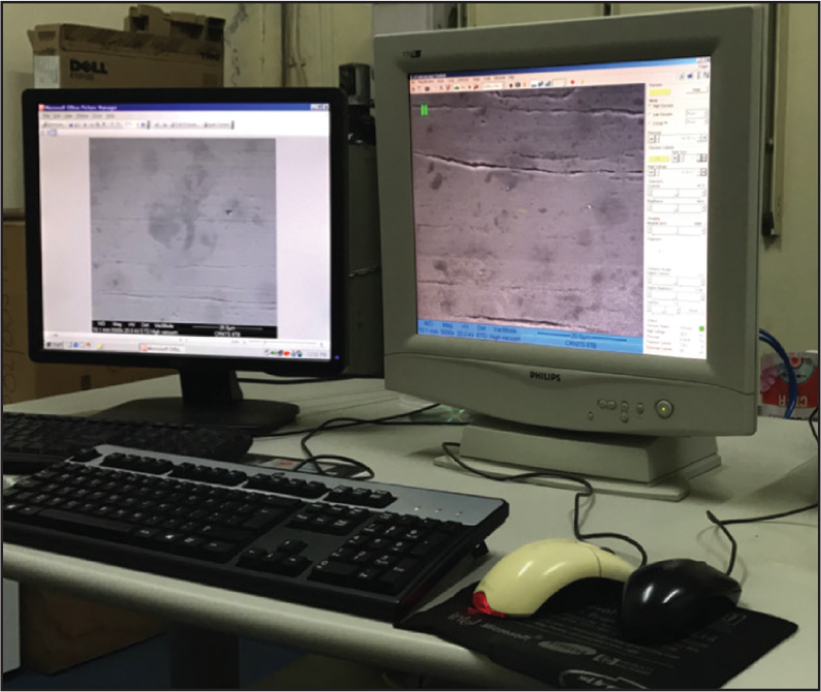
Surface irregularities were studied with a SEM (Quanta FEI 2000). Each specimen was cleaned, dried, and mounted (Figure 3) with the help of a double ended tape on cylindrical mounts of 1″ in diameter. The mounted specimens were magnified at 5,000× magnification and an image was obtained (Figure 4). Image obtained through SEM was evaluated for its roughness profile by surface analysis software “MountainsMap Premium 7.3” and degree of irregularities analyzed.
Universal testing machine (Instron) was used for evaluation of load deflection rates and frictional characteristics. For load deflection test; wire samples from each group were tested by using a specially made 3-point wire testing jig attached to the universal testing machine as described. 3
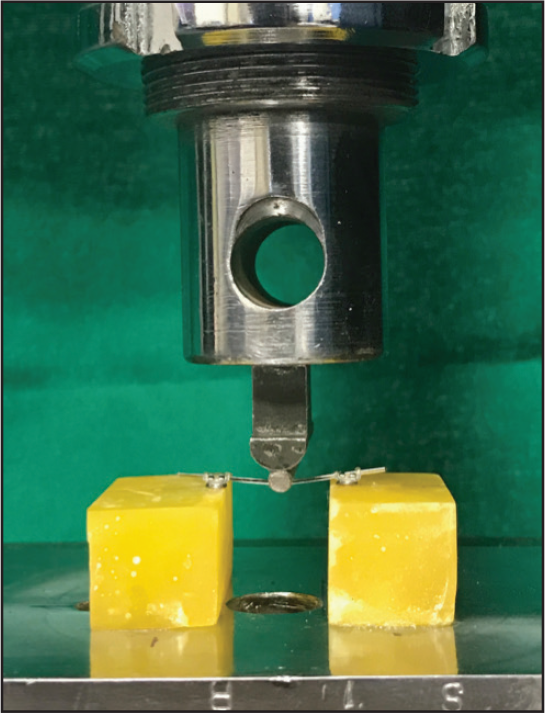
For evaluation of frictional resistance, assembly was mounted (Figure 5) on the Instron machine. Mandibular Central Incisor Standard Edgewise Bracket (0.022″ × 0.028″ slot [American Orthodontics]) were used as a part of the study. Straight length SS wires (6 aforementioned commercial houses) were used. Total of 60 tests were performed. While performing each test, new bracket, wire, and ligature was used. Wires were held in the bracket slot by elastomeric ligature (American Orthodontics). Test was conducted in dry conditions at a rate of 2.5 mm/minute for 2 minutes each.
For evaluation of load deflection rate, length of 14 mm SS wire was suspended between 2 brackets (Figure 6) and amount of load required for attaining deflection was measured. The test was measuring stiffness at 3 different stages namely 0.5 mm loading, 1 mm loading, and 0.5 mm unloading. Load deflection rates were measured in N/mm.
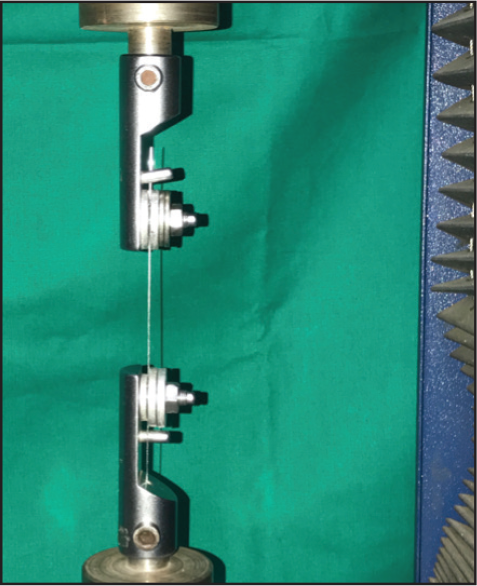
Ultimate tensile strength was evaluated by standard tensile test (Figure 7). It was done in a universal testing machine (Instron) for all the aforementioned groups. 100 mm length of wire was held between crossheads, and a full scale 1,000 N load is applied at a speed of 1 mm/minute.
Statistical Analysis
As advised by a qualified statistician, 60 0.019″ × 0.025″ SS wires; each group divided into 6 subgroups containing 10 wires each of the same commercial house, and each subgroup was designated for a particular test out of the 6 tests performed in our study.
Data obtained was processed using descriptive statistics, graphs, and charts. It was subjected to analysis of variance test (ANOVA). The level of significance was set at 0.05. All p-values less than 0.05 were treated as significant. Analysis was performed using Statistical Package for Social Science [SPSS] 17.0 software.
Results
Dimensional Accuracy
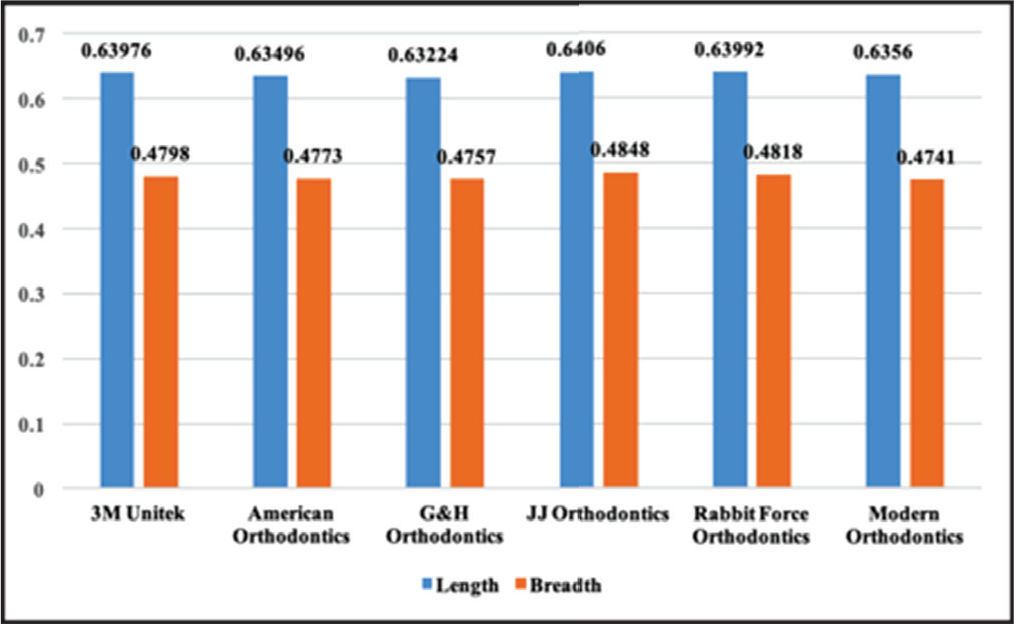
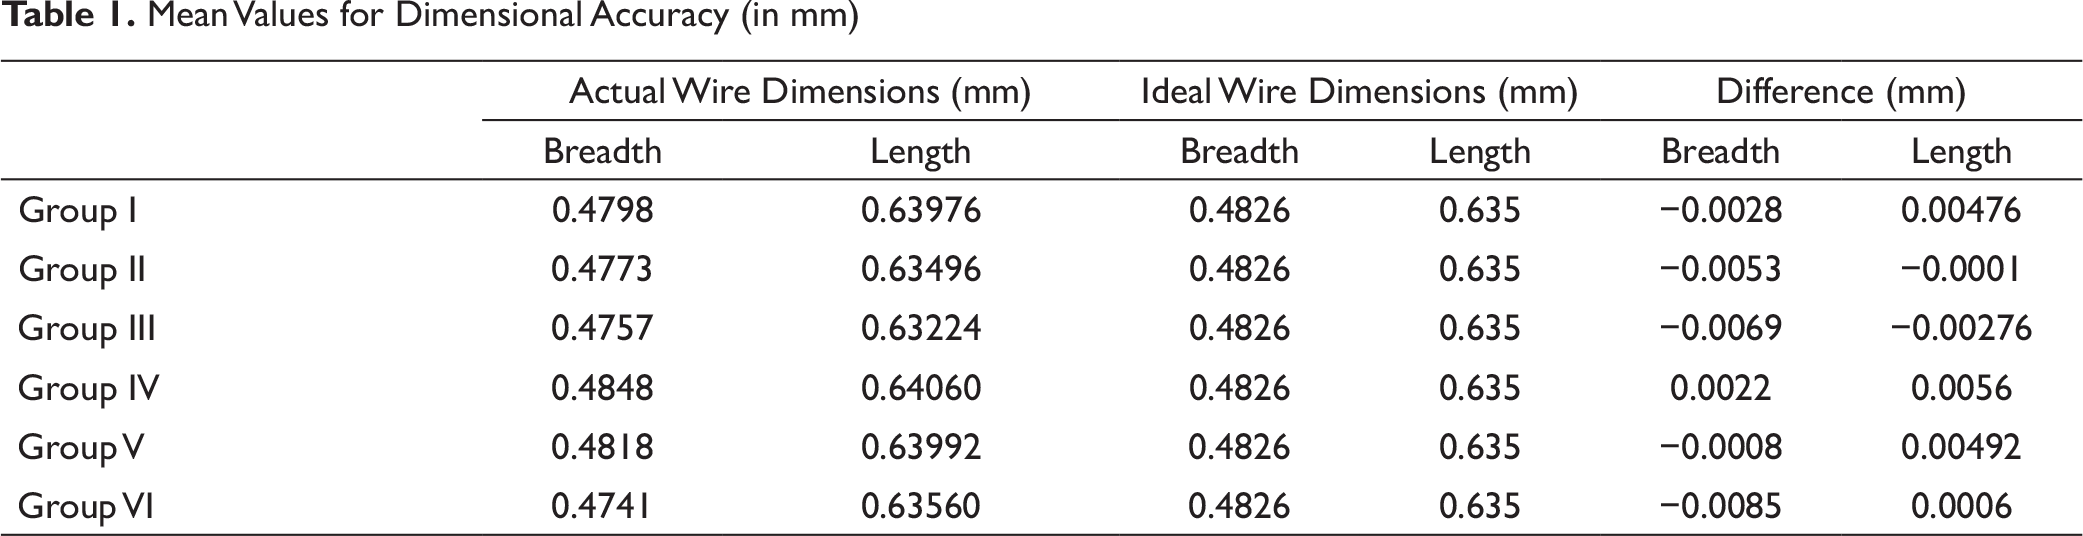
Mean values for dimensions (length and breadth) were tabulated and evaluated, and difference between the actual and ideal dimensions of wire were calculated (Table 1). Tukey’s post hoc analysis stated that dimensional accuracy in terms of length and breadth did not vary significantly (Figure 8).
Five Points as Described on SS Arch Forms
Specimen Mounted and Focused on Profilometer
Individual Mounts Loaded on the Stage of SEM
Scanned Image Obtained on the Screen
Acrylic Block Mounted on Fixed Lower Jaw of Instron
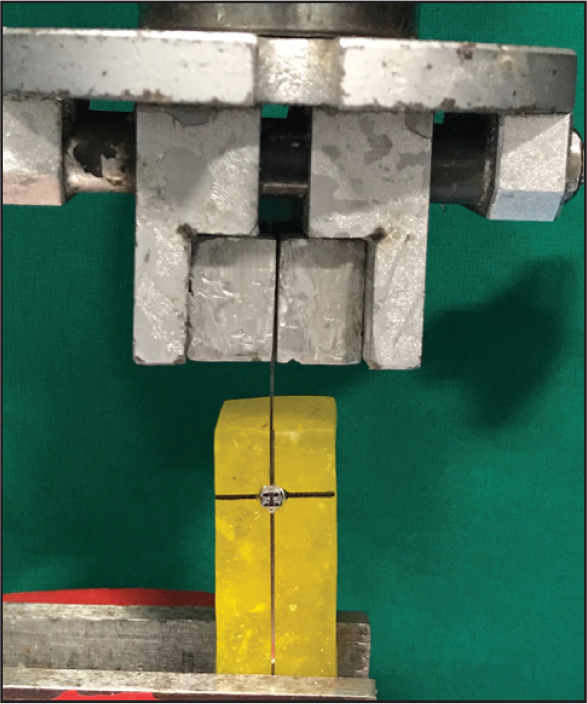
Load Deflection Measured by Deflecting the Wire
100 mm length SS wire held between the two jaws of Instro
Mean Values for Dimensional Accuracy (Length and Breadth [in mm])
Mean Values for Surface Profilometry
Mean Values of Sa and Sq (SEM)
Mean Values for Dimensional Accuracy (in mm)
Tukey’s Post Hoc Analysis for Surface Evaluation (Surface Profilometry)
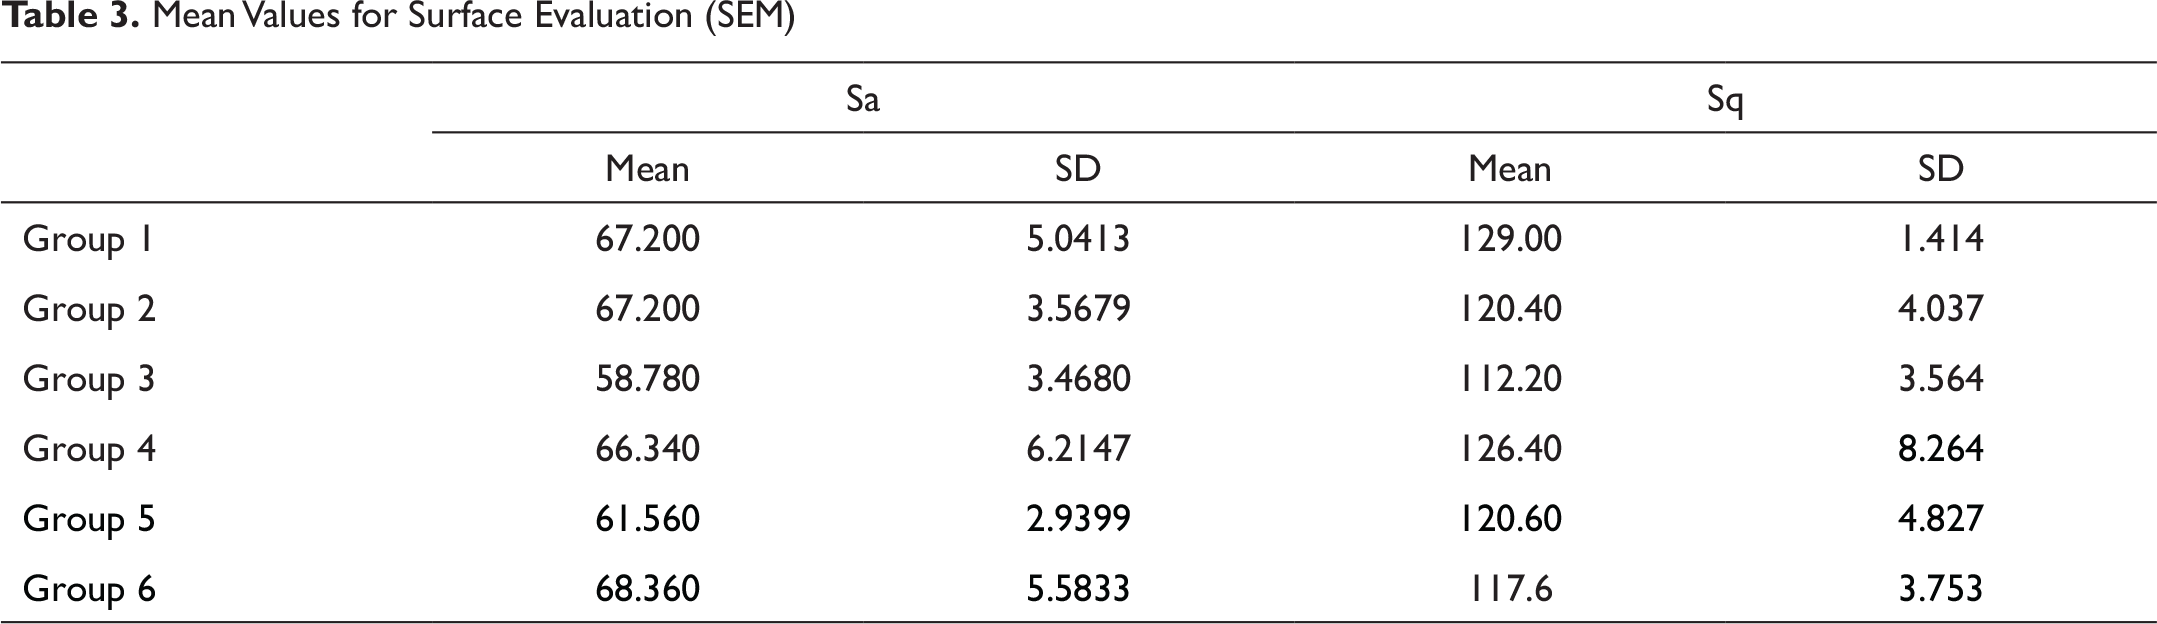
Mean Values for Surface Evaluation (SEM)
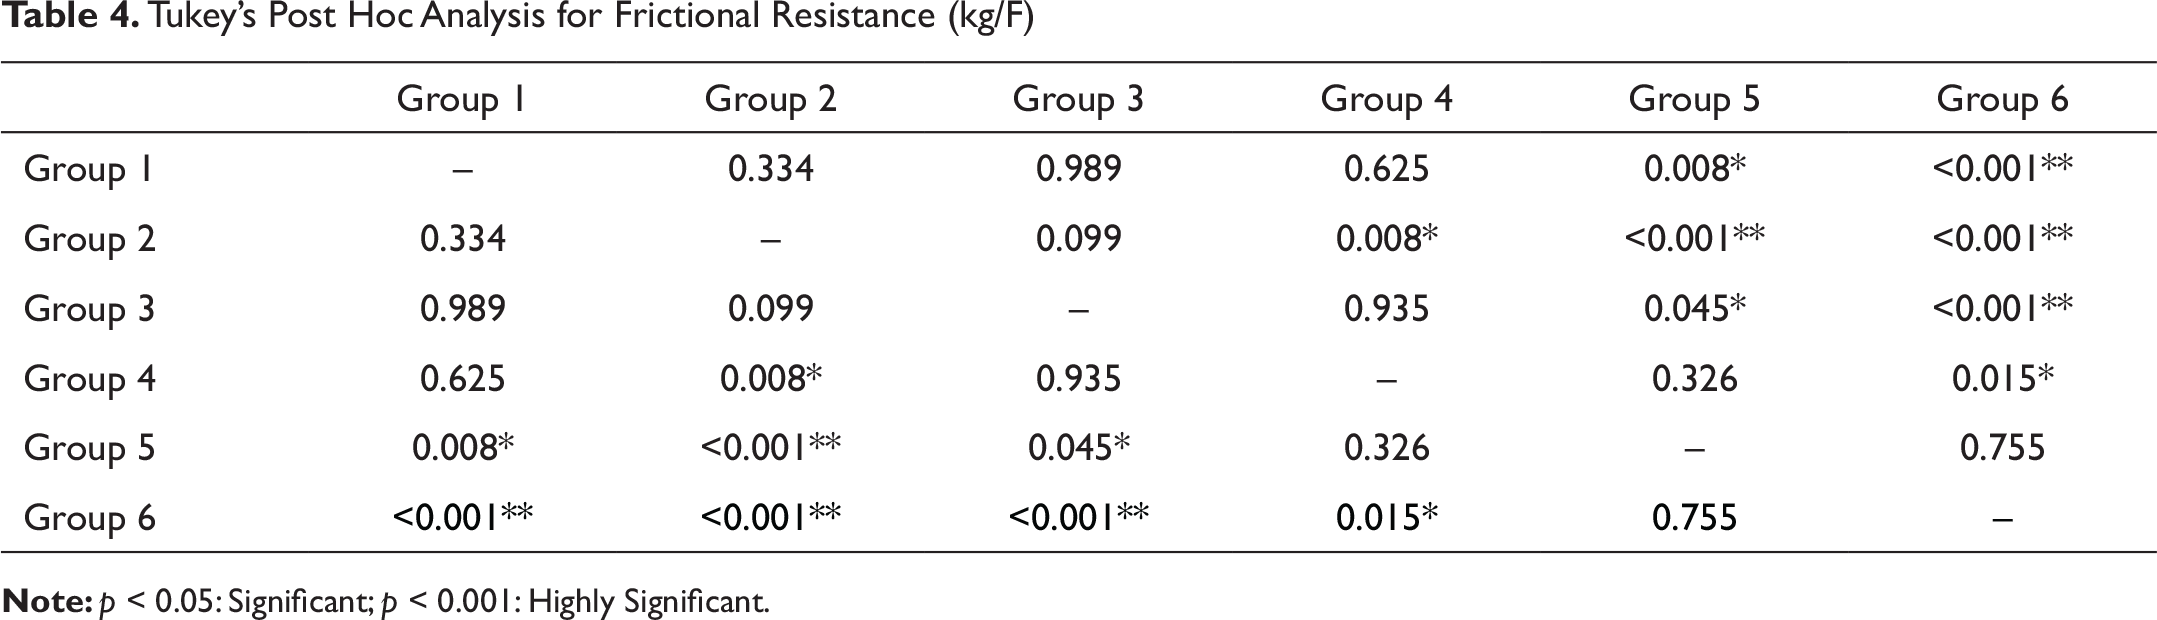
Tukey’s Post Hoc Analysis for Frictional Resistance (kg/F)
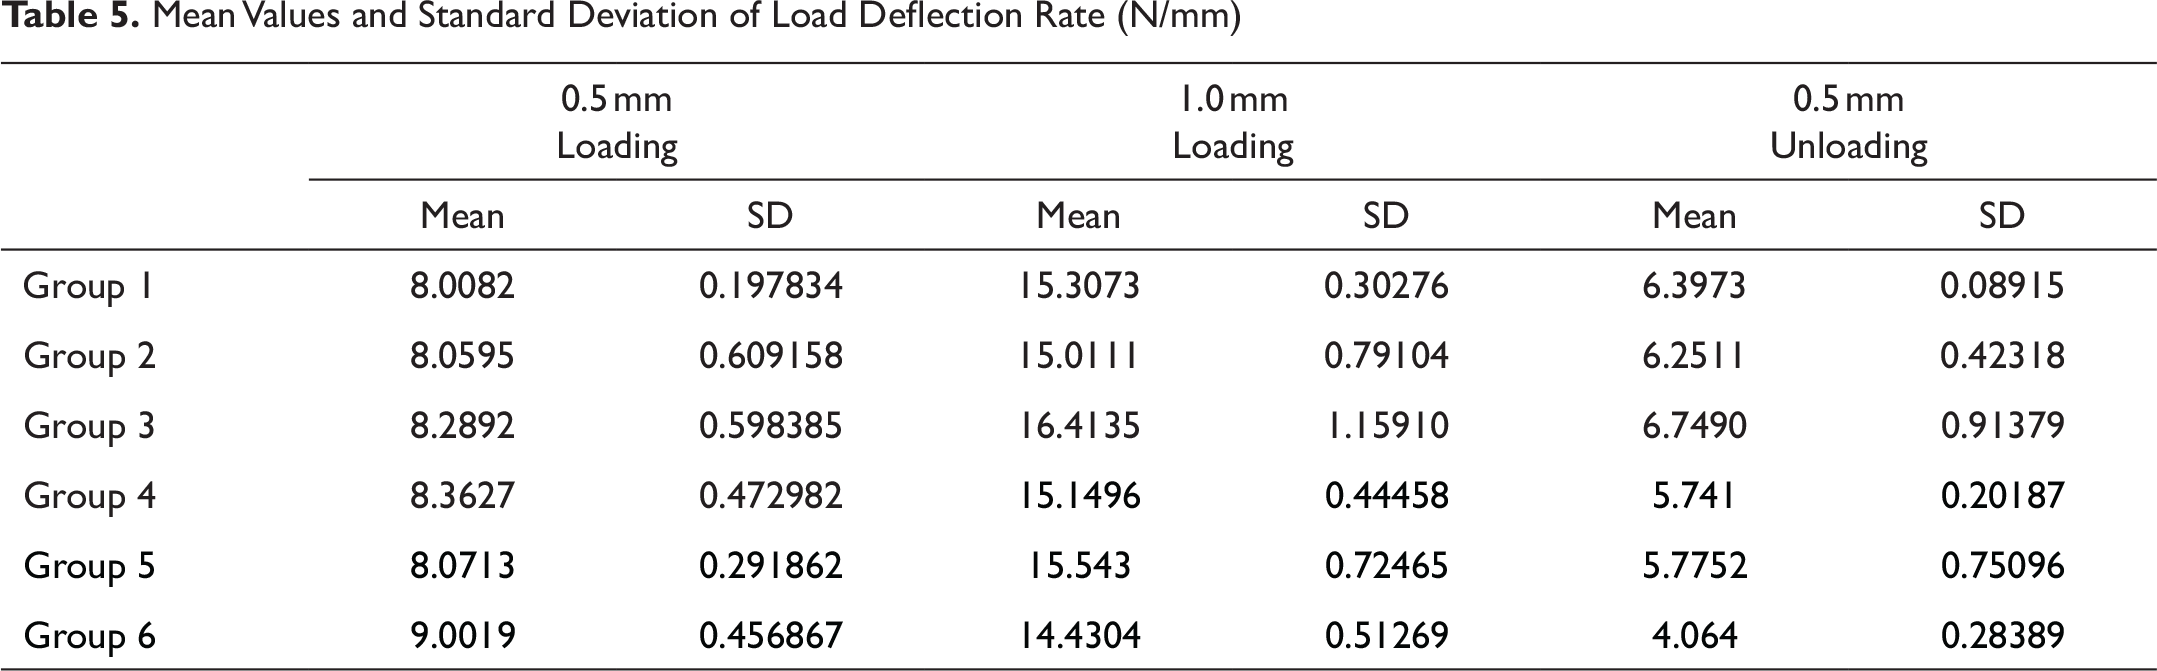
Mean Values and Standard Deviation of Load Deflection Rate (N/mm)
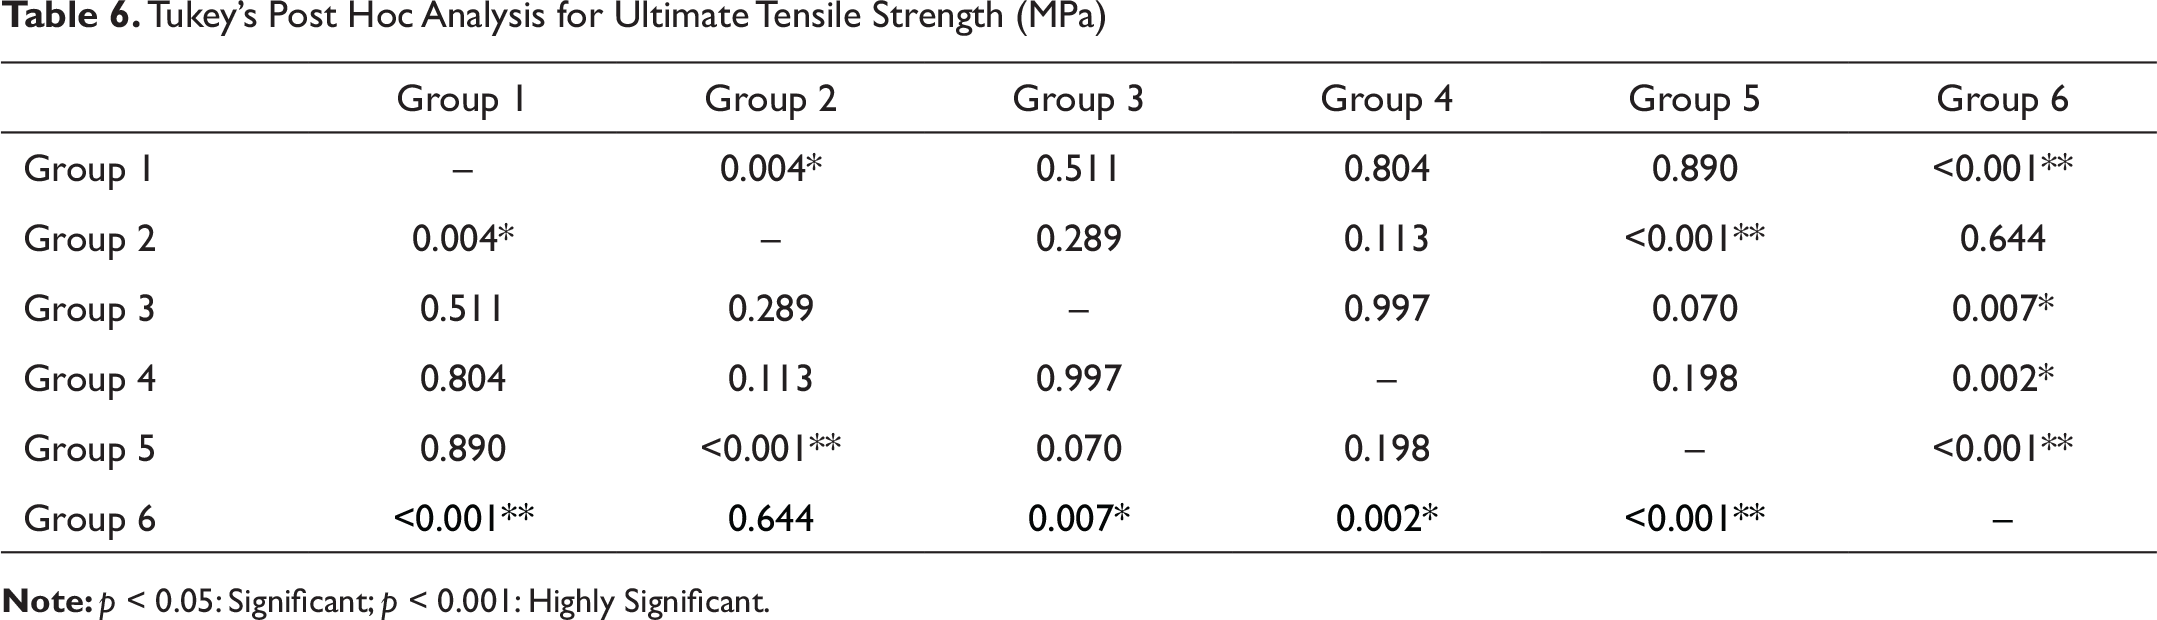
Tukey’s Post Hoc Analysis for Ultimate Tensile Strength (MPa)
Mean Values for Frictional Resistance (Kg/F)
Mean Values for Load Deflection Rate at 3 Stages (N/mm)
Mean Values of Ultimate Tensile Strength (MPa)
Surface Profilometry
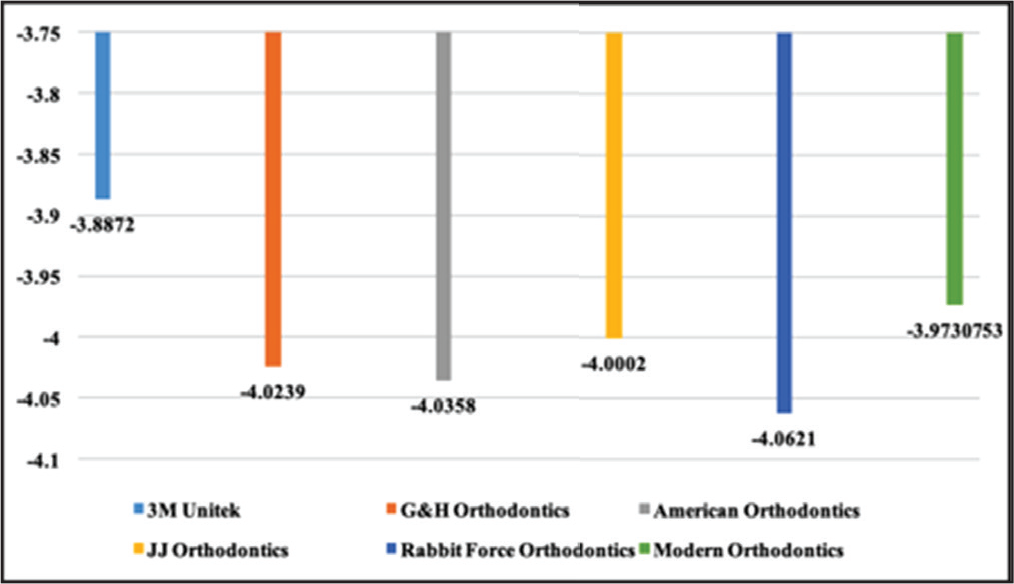
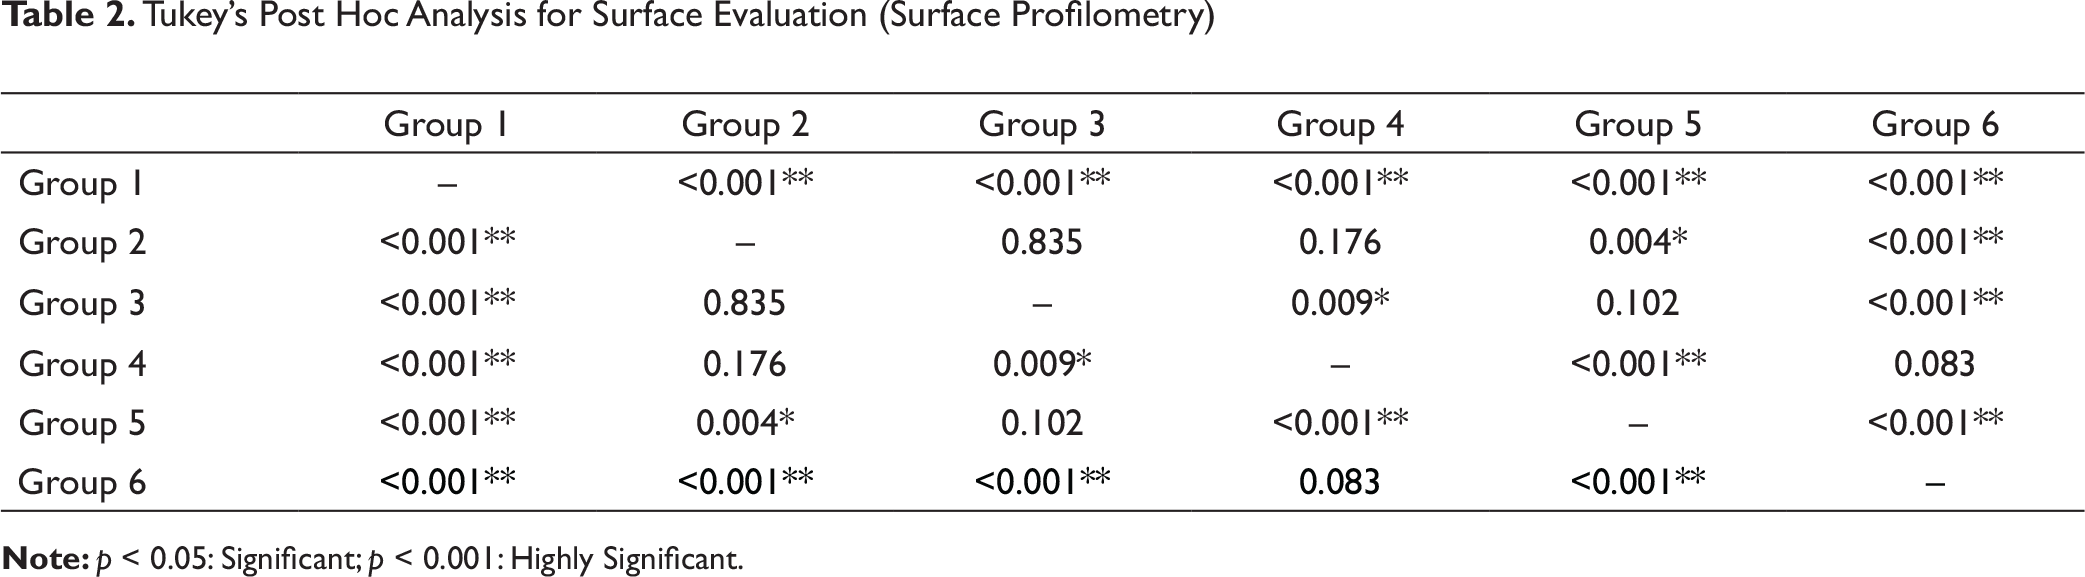
Surface evaluation was performed with a non-contact profilometer, and values obtained were tabulated. When analyzed statistically (ANOVA at 95% confidence level, significant at p < 0.05) were significant/highly significant for certain values as shown in Table 2. When they are arranged in an ascending order of their roughness (smooth to rough) they were in the following order:
Profile: Group 1 > group 6 > group 4 > group 2 > group 3 > group 5 (Figure 9)
Scanning Electron Microscopy
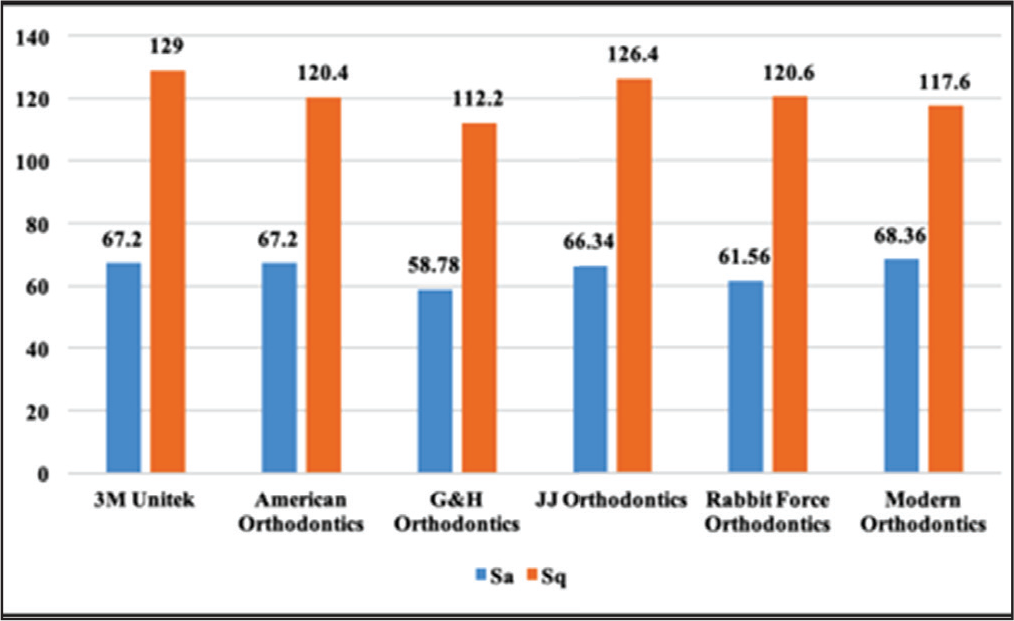
SEM was done at 5,000× for evaluation of surface irregularities. These micrographs were further transferred on a surface mapping software and irregularities in terms of “Sa” and “Sq” were calculated (Table 3).
In terms of “Sa”: Group 6 > group 1 > group 2 > group 4 > group 5 > group 3 In terms of “Sq”: Group 1 > group 4 > group 5 > group 2 > group 6 > group 3 (Figure 10)
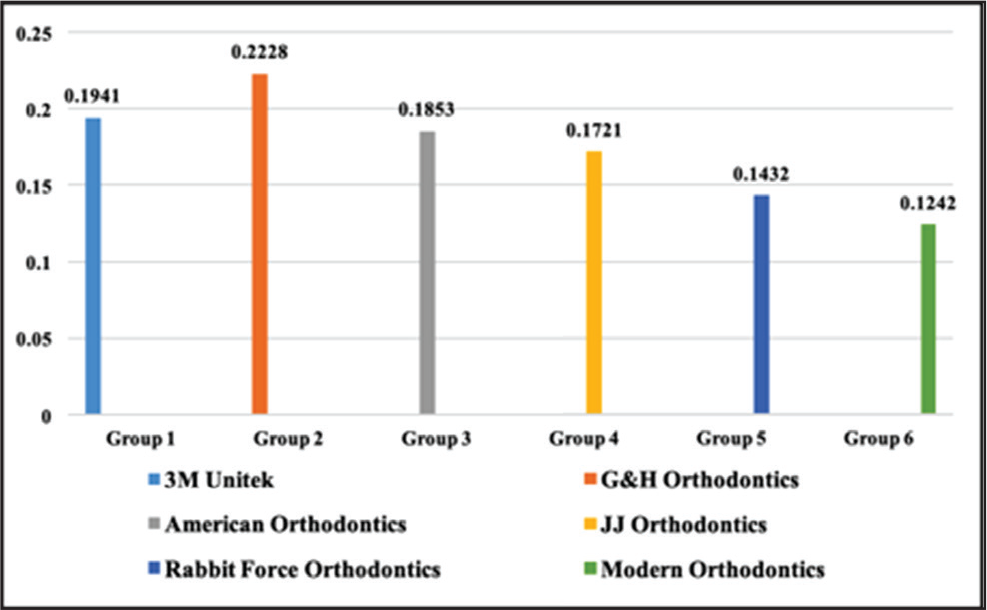
Frictional Resistance
Values were tabulated and mean values and standard deviation were obtained. When analyzed statistically (ANOVA at 95% confidence level, significant at p < 0.05) were significant/highly significant for certain values as shown in Table 4. The rank order of values are summarized in Figure 11.
Frictional resistance: Group 2 > group 1 > group 3 > group 4 > group 5 > group 6
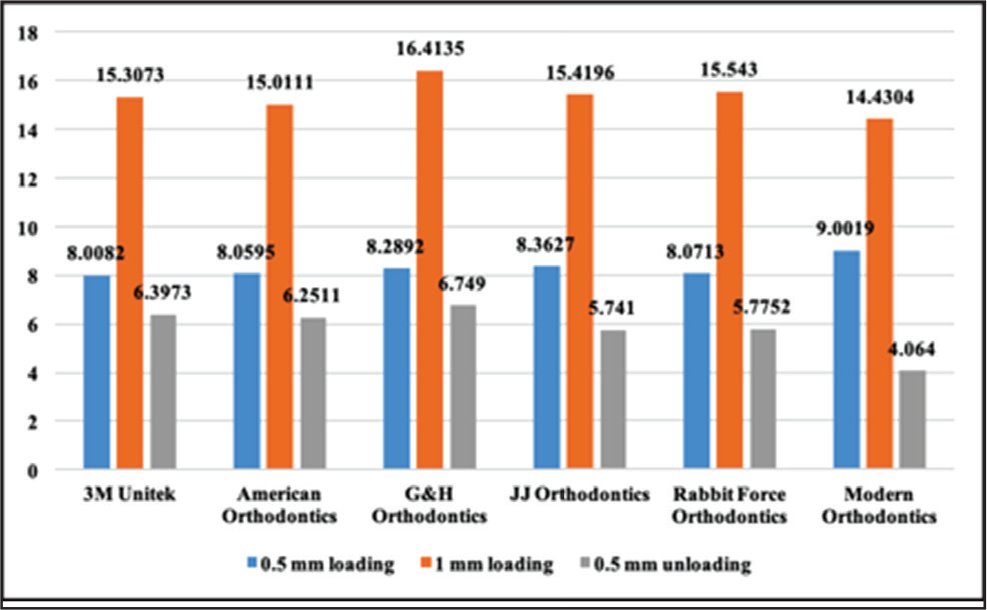
Load Deflection Rate
The load deflection values obtained through 3-point bend testing of wire specimens from groups 1–6 (Table 5), when analyzed statistically (ANOVA at 95% confidence level, significant at p < 0.05) were highly significant for 0.5 mm loading, 1 mm loading, and 0.5 mm unloading. The rank order of wires according to load deflection characteristics are summarized in Figure 12.
0.5 mm loading: Group 6 > group 4 > group 3 > group 2 > group 5 > group 1 1 mm loading: Group 3 > group 5 > group 1 > group 4 > group 2 > group 6 0.5 mm unloading: Group 3 > group 1 > group 2 > group 5 > group 4 > group 6
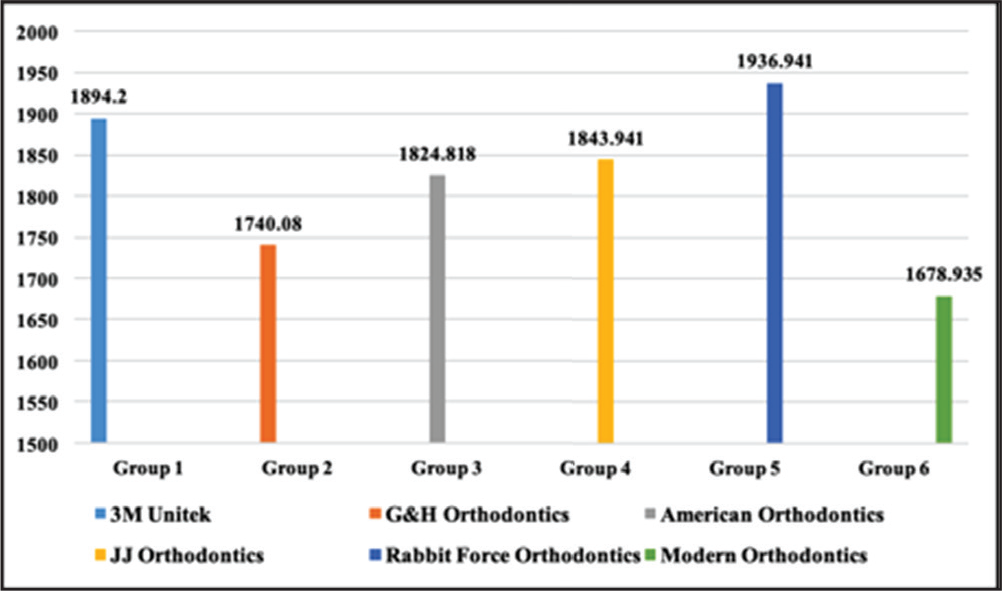
Ultimate Tensile Strength
The value obtained through tensile testing of archwire alloys indicates clearly superior strength. Values were tabulated and mean values and standard deviations were obtained. When analyzed statistically (ANOVA at 95% confidence level, significant at p < 0.05) were significant/highly significant for certain values as shown in Table 6.
Ultimate tensile strength: Group 5 > group 1 > group 4 > group 3 > group 2 > group 6 (Figure 13)
Thus, from the results obtained and stated above, no one group of wire excels in all the parameters that were evaluated, each one having its aces and minuses.
Discussion
Orthodontics and biomaterials are evolving by leaps and bounds on a day to day basis. SS wires have stood the test of time and have been and are still being used from initial to the final stages of treatment. The reduced friction and increased stiffness with SS wires is a primary advantage over other conventional wire materials. The present study focused on studying physical properties of rigid SS wires of 0.019″ × 0.025″ dimension in-vitro.
SS wires currently marketed and available in India are sourced from different overseas as well as indigenous commercial houses and have a wide range of diversity taking their cost into consideration. The decision of choosing an archwire brand based on its quality and cost becomes a self-reflective decision for the orthodontist.
Physical properties of 0.019″ × 0.025″ SS wires sourced from 3 overseas and 3 indigenous commercial houses were compared with each other. The wires used were sourced from: 3M Unitek, American Orthodontics, G&H Orthodontics, JJ Orthodontics, Rabbit Force Orthodontics, and Modern Orthodontics.
The aforementioned wires sourced from 6 commercial houses were tested for dimensional accuracy, surface roughness (surface profilometry), surface characteristics (SEM), frictional resistance, load-deflection rate, and UTS. While performing each test, new wires were used for every evaluation.
0.019″ × 0.025″ SS wires were evaluated for their accuracy of length and breadth using a digital micrometer (accuracy 0.001 mm). The dimensional accuracy of the wires as evaluated from this test, were over/under the ideal size compared to the claims made by the manufacturers. The findings of our study were in accordance with that shown by Cash 4 in 2004, and later by Bhalla 5 in 2010, and Montasser 6 in 2016.
Dimensional accuracy in terms of breadth was highest for Rabbit Force Orthodontics (group 5) and lowest for Modern Orthodontics (group 6); while in terms of length was highest for American Orthodontics (group 2) and lowest for JJ Orthodontics (group 4).
Arreghini et al 7 in 2014 concluded that all bracket/archwire combinations considered were found to have play angles far above the ideal. This is because of undersized archwires and oversized bracket slots or a combination of both. Major 8 in 2010 claimed that the actual slot size and shape of an orthodontic bracket vary to be larger and smaller from the ideal value; while Brown 9 in 2015 claimed some of them to be oversized with a range of 5%–24% with parallel, divergent, and convergent walls. Also, Sebanc 10 in 1984, Meling 11 in 1997, Lombardo 12 in 2015, and Papageorgiou 13 in 2016 claimed that variable bevelling of archwire edges affects the play.
Thus, with so many dimensional variations with brackets and archwires, controlling and achieving a satisfactory torque of the incisors should not to be taken for granted and correct finishing bends should still be advocated by the orthodontist to obtain optimum results.
The clinical significance of friction is its role in lessening the force actually received by a tooth from an active component such as a spring, loop, or elastic. Hence, greater applied force is needed to move a tooth with a bracket-arch wire combination demonstrating high magnitudes of friction (eg, polycarbonate bracket) compared with one with a low frictional value (eg, SS bracket).
Frictional resistance was evaluated on universal testing machine (Instron). Brackets were ligated with elastomeric ligatures. All tests were performed at room temperature and in dry state. Frictional resistance was lowest for Modern Orthodontics (group 6) and highest for American Orthodontics (group 2).
Highly significant difference (p ≤ 0.001) was found between mean values of groups 6 and 2. Frictional resistance was least for Rabbit Force Orthodontics (Group 5), after group 6. There was no significant difference (p = 0.755) between frictional resistance between groups 6 and 5.
SS wires exhibit the lowest friction due to properties like low roughness, high hardness, and high strength. Kusy et al 14 in 1991, Marquez 15 in 2010, and Fidalgo 16 in 2011 concluded that coefficient of friction with SS brackets and archwires was the least in dry state, and further increased when tests were performed in wet states.
Though, according to Kapila et al 17 in 1990 for most wire sizes and alloys, narrow single brackets were associated with lower amounts of friction than wider brackets; Choy and Burstone 18 in 2018 reported that surface area and friction are not directly related.
Iwasaki et al 19 in 2003, Natt 20 in 2015, and Sesham 21 in 2015 inferred that loose ligation forces were not associated with lower frictional forces than tight SS ligation. Though, use of elastic ligatures in intra-oral environment had a significant influence on frictional forces.
Thus, different archwire–bracket combinations, method of ligation, angulation of archwire with the bracket slot, 22 interaction of appliance with surrounding environment, and muscular and occlusal forces can have a profound effect on frictional resistance offered.
Though, various optical methods like total integrated scatter, 23 ellipsometry, 24 and interferometry 25 exists; SEM and surface profilometry are best used for evaluation of surface characteristics.26, 27
Kusy 28 , Whitley 29 in 1989 and 1990, Li 30 in 2013, Zhou 31 in 2015, and Rudge 32 in 2015 evaluated the effects of surface roughness and sliding velocity on coefficients of friction and inferred that smoothness of the surface should not always be equated or directly correlated to the absence of friction and many other aforementioned factors need to be evaluated.
According to this study, surface roughness measured with surface profilometer was lowest for Rabbit Force Orthodontics (group 5) and highest for 3M Unitek (group 1). Difference in surface roughness of group 5 (least rough) to group 1 (most rough) was highly significant. The second least surface roughness was found to be for G&H Orthodontics (Group 3). The difference between surface roughness of groups 5 and 3 was not significant.
Surface characteristics measurements were done with SEM at a magnification of 5,000×. “Sa” (linear measurements) values inferred that mean was lowest for G&H Orthodontics (Group 3) while highest for Modern Orthodontics (Group 6). There was significant difference (p = 0.034) found between mean values of group 3 and 6. “Sq” (area wise measurement) values concluded that mean was lowest for Group 3, while highest for Group 1. There was highly significant difference between 2 values (p ≤ 0.001).
A tensile test is normally used to determine mechanical properties of orthodontic wire and is considered more representative of clinical use than conventional tensile test.33, 34 Hence, we studied the activation behavior of the wire at 0.5 mm and 1 mm (loading); and deactivation behavior at 0.5 mm (unloading).
It revealed that at 0.5 mm loading, the load deflection rate was highest for group 6 and lowest for group 1. Statistically significant difference (p ≤ 0.001) was found between the mean values of the 2 groups. At 1 mm loading and 0.5 mm unloading, the load deflection rate was highest for group 3 while it was lowest for group 6. There was statistically significant difference (p ≤ 0.001) between the mean values of the aforementioned groups.
The findings in our study were in accordance with Taneja 35 in 2003, Khatri 36 in 2014, Dechkunakom 37 in 2014, Reddy 38 in 2016, and Lubinsky 39 in 2018, which concluded that the activation and deactivation behaviors of a wire are usually not the same. Therefore, force–deflection graphs generated during the activation (loading) and deactivation (unloading) cycles of a wire do not superimpose.
Higher values of springback indicate increased capacity for range of activation. SS wires present with the least maximum elastic strain and springback as compared to NiTi and Ti-Mo as inferred by Drake et al 40 in 1982.
Oltjen et al 41 in 1997 inferred that the mode of testing, type and size of wire, alloy material, and number of strands affect the stiffness of the wire. They also concluded that the stiffness values obtained by a 3-bracket bending test were 1.5–4 times more that of the 3-point bending systems.
UTS tests revealed that it was highest for Rabbit Force Orthodontics (group 5) while lowest for Modern Orthodontics (group 6). There was statistically significant difference (p ≤ 0.001) between the mean values for the aforementioned groups. Group 1 had the second highest UTS after group 5, though the results were not statistically significant (p = 0.890).
Thus, according to this study, no wire from a single commercial house outperformed other wires in the aforementioned physical properties that were evaluated.
Conclusion
According to the findings of this study, no wire from a single commercial house excels in all the parameters that were evaluated, each one having its aces and minuses. Bearing the clinical relevance and cost in mind, wires sourced from group 6 (least frictional resistance) and group 5 (best dimensional accuracy) performed better.
The present study was an in-vitro study. The intrinsic variations which are created in the oral environment can never be truly replicated in an in vitro environment. It is a difficult task to extrapolate the values for friction determined in vitro to an in vivo situation as reproduction of oral conditions like muscular forces, occlusal forces, and movement of tooth through bone may affect the binding of the archwire.
Footnotes
Declaration of Conflicting Interests
The authors declared no potential conflicts of interest with respect to the research, authorship, and/or publication of this article.
Funding
The authors received no financial support for the research, authorship, and/or publication of this article.