
Abstract
Abstract
Context: Self-drilling mini-implants are commonly used in orthodontic treatment procedures, but there is limited information regarding their fracture resistance in areas of high-density bone without predrilling.
Aims: The objective of this study is to compare and evaluate the maximum insertion torque and fracture resistance of 3 commonly used self-drilling mini-implants in India, and to assess the influence of variation in diameter in torque generation.
Materials and methods: 90 mini-implants from 3 different manufacturers with 2 different diameters were drilled into acrylic blocks using a dial indicating torque screwdriver. All mini-implants were drilled at the rate of 20-30 rotations/min, implants were drilled until they fractured. Torque generated at the point of fracture is shown on the dial of the screwdriver. Measurements of the peak insertion torque value for each manufacturer were recorded separately.
Statistical analysis: Analysis of variance, post hoc Bonferroni test.
Results: Analysis of variance test showed a significant difference among all the manufacturers in both the diameters with P < .05. Implants of 1.6 mm diameter of Ancer group have the highest fracture resistance value when compared with the same diameter of JJ Orthodontics and SK Surgicals. Implants with higher diameter have more resistance than those with lower diameter.
Conclusions: The observed highest fracture resistance is 47 Ncm by Ancer and least fracture resistance is 16 Ncm by JJ Orthodontics. The values are higher than the torque required to place mini-implants intraorally. Ancer mini-implants have the highest peak fracture torque, thus more than SK Surgicals and JJ Orthodontics.
Introduction
Temporary anchorage devices (TAD) provide bony support via a stable osseous interface and immobile rigid anchorage to the orthodontic loads within physiologic thresholds.1, 2, 3 TADs include implants and plates. Mini-implants of screw type are called as mini-screws, micro-screws, or micro-implants. Depending upon the placement, implants are named as palatal implants, zygoma implants, or on-plants. Skeletal anchorage plates used as adjunctive for anchorage are called as mini-plates. 4
Literature suggested a range of 6% to 30% failure rate of mini-implants. 5 Based on the reported complications and failure rates, past clinical studies and surveys revealed that implant fracture rate (10%-20%) surpassed the root damage rate (4%-6%).6, 7
The increased range of implant fracture alarms the necessity to explore the reasons. Implant breakage is positively correlated with (a) the torque generated during insertion and removal, (b) the diameter of the implant, and (c) bone density.4, 8-14
Orthodontic mini-implant has evolved over the time period in terms of design, thread, shape of head, and taper. Self-drilling type of implant does not require a predrill like in the case of self-tapping which ultimately increases the insertion and removal torque. The downside of self-drilling mini-implant is the production of increased placement torque during insertion. Torque generation will be more in the region of thick cortical bone (D2-D3). Increased torque generation is one of the factors inducing implant breakage.15, 16
Studies have reported variations in torque values in clinical and laboratory testing. Wilmes and other peer group members proved the variations in torque generation while comparing different manufacturers to know the maximum torque generated by the implants. The difference among the manufacturers was high with 53.2 Ncm, where the lowest was 10.9 Ncm and the highest was 64.1 Ncm. 9 Owing to the fact that variability occurred between manufacturers and fracture torques, an operator should have complete knowledge about the various properties and drawbacks of implants which are available in the market. Therefore, it becomes mandatory to know the resistance showed by the various manufacturers used by clinicians in their practise. 17 The aim of this in vitro study is to assess the fracture resistance of 3 commonly used self-drilling mini-implants of different diameters.
Materials and Methods
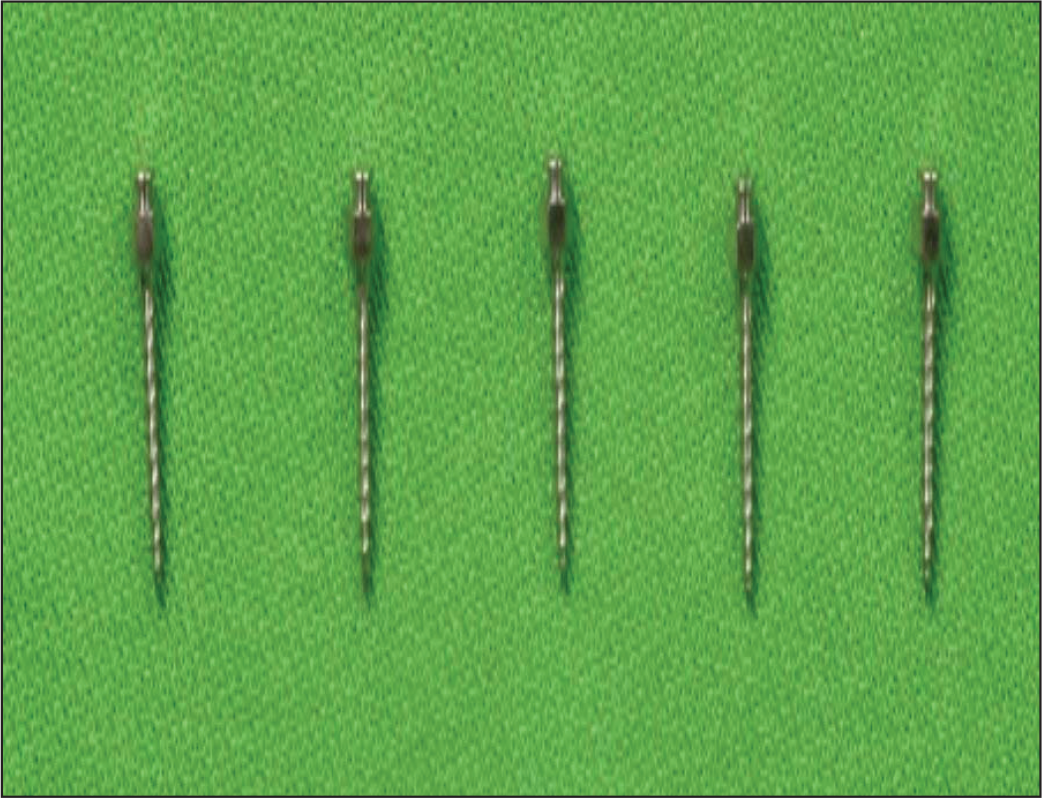
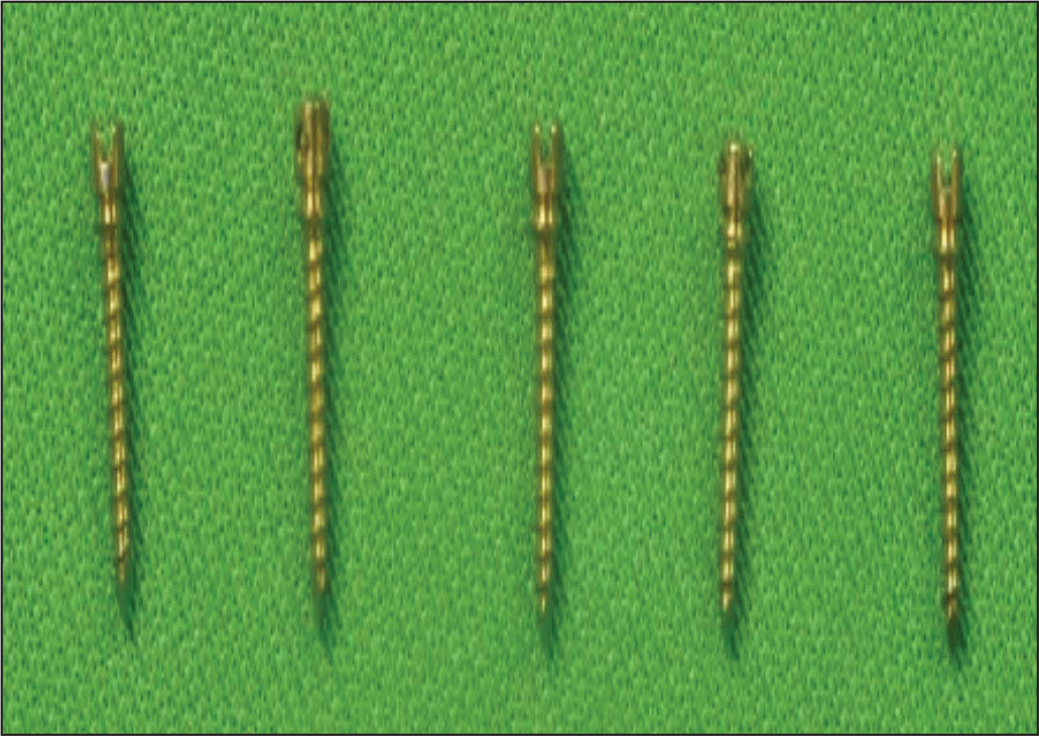
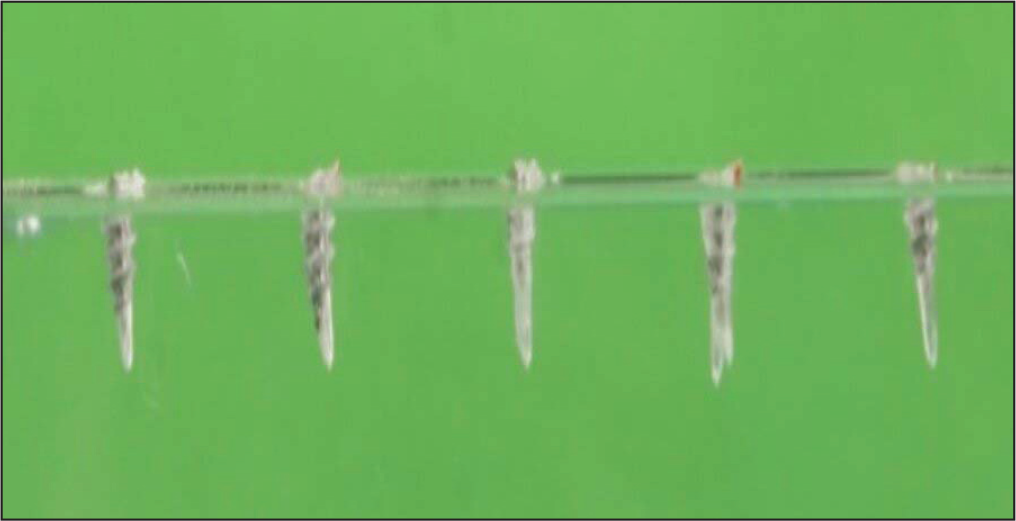
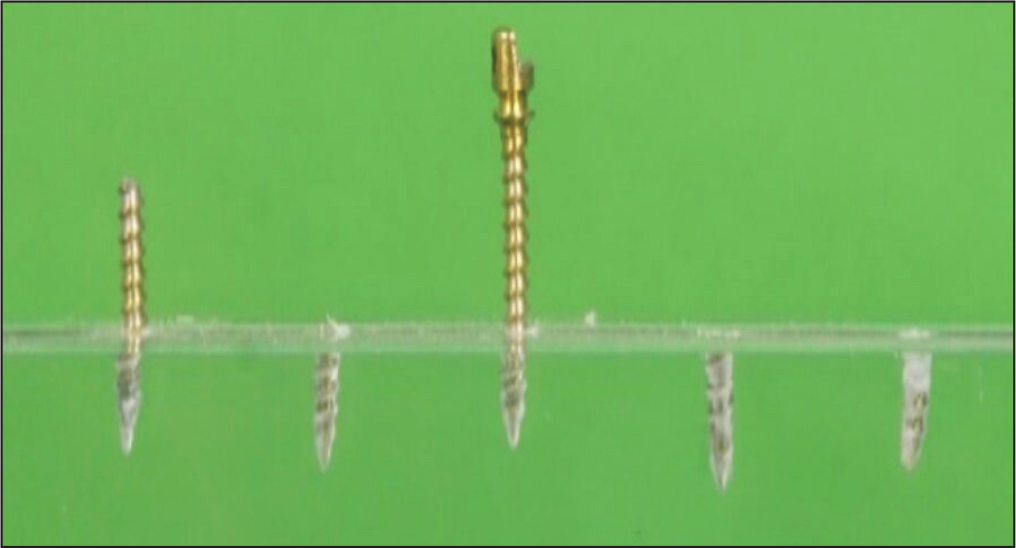
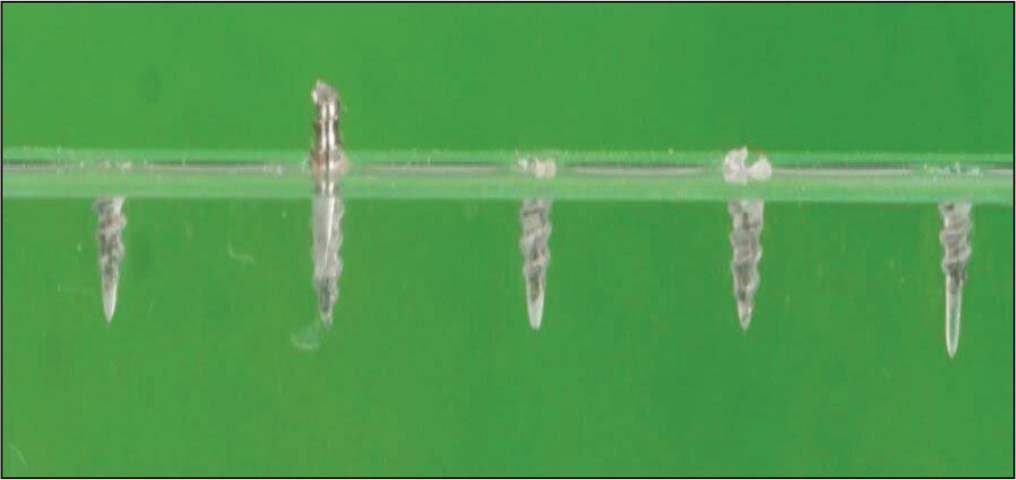
A total of 90 standardized titanium mini-implants from 3 different manufacturers—(a) Ancer, Taiwan Implant System, Taiwan; (b) JJ Orthodontics, Kerala, India; and (c) SK Surgicals, Pune, India—were investigated. Mini-implants of 10 mm length from all the 3 manufacturers with 2 different diameters of 1.4 mm and 1.6 mm are chosen for the test. Mini-implants of 3 different manufacturers are divided into 3 groups. Each group consist of 30 mini-implants with same length (10 mm) which were further divided into 2 subgroups according to their diameters (1.4 mm and 1.6 mm; Figures 1-6).
ANCER Mini-implants of 1.4 mm Diameter
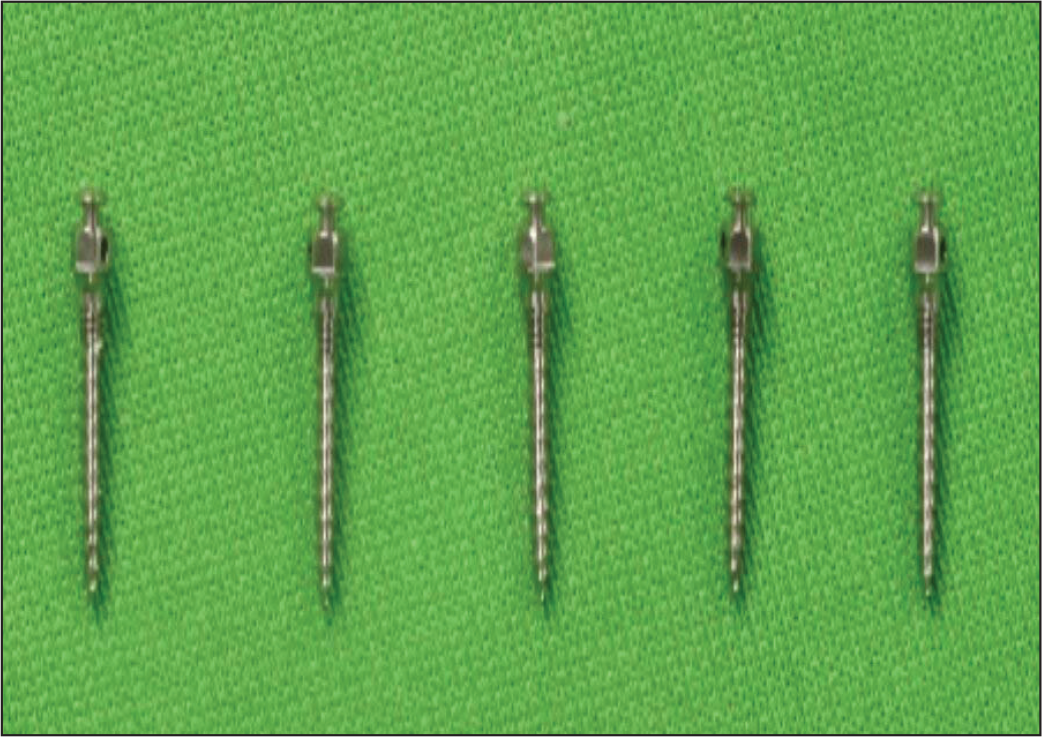
ANCER Mini-implants of 1.6 mm Diameter
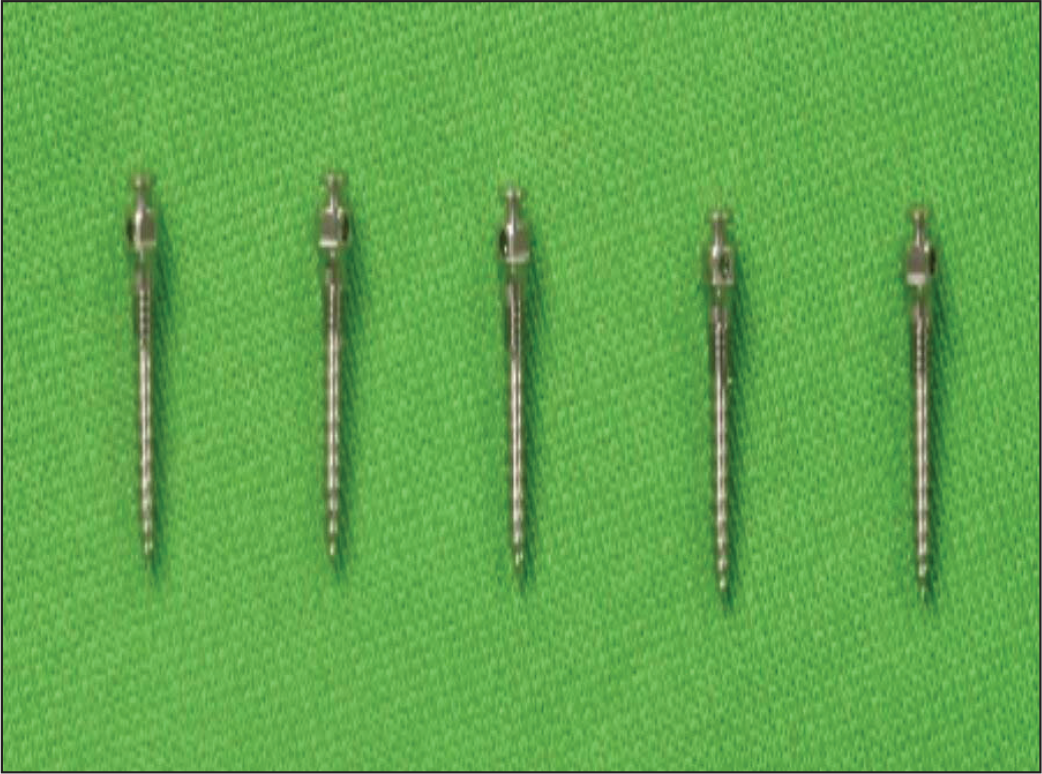
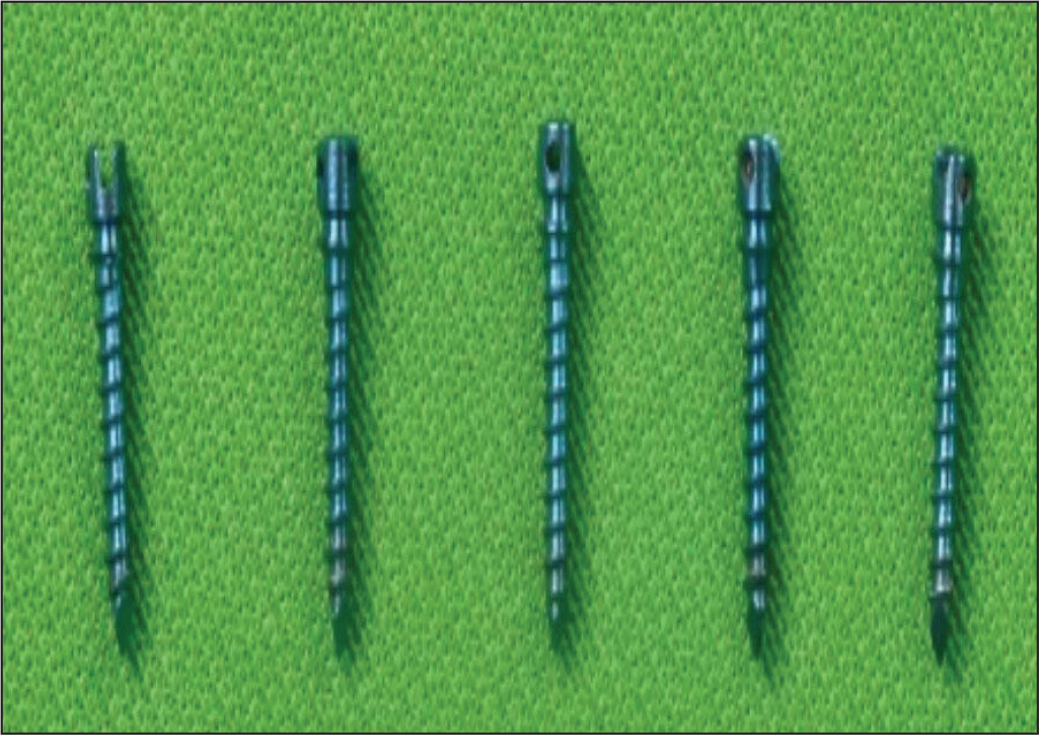
JJ Orthodontic’s Mini-implants of 1.4 mm Diameter
JJ Orthodontic’s Mini-implants of 1.6 mm Diameter
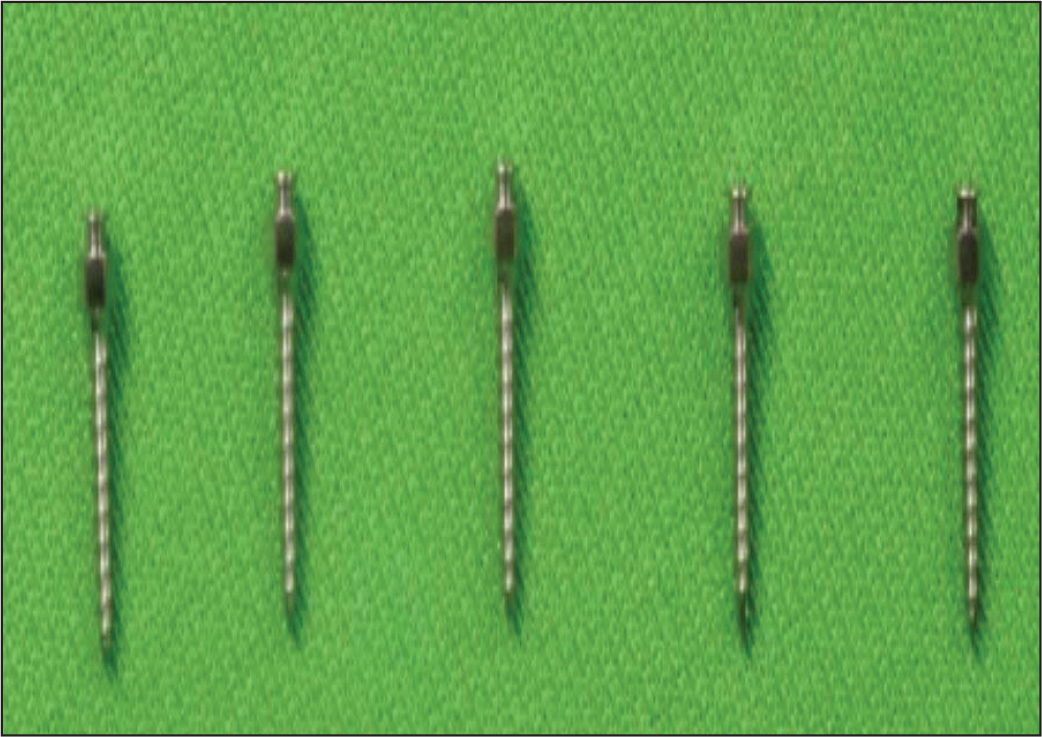
SK Surgical’s Mini-implants of 1.4 mm Diameter
SK Surgical’s Mini-implants of 1.6 mm Diameter
A customized heat-cured acrylic block of rectangular shape with dimensions 2 × 4 × 17 cm was fabricated for each subgroup. All the 6 acrylic blocks were predrilled with a straight handpiece. A predrill of diameter 0.5 mm and depth of 3 mm were drilled to guide the implants tip with an interval of 10 mm between the guiding drills. The predrilled guide holes were used to place the mini-implants up to a tapered tip.
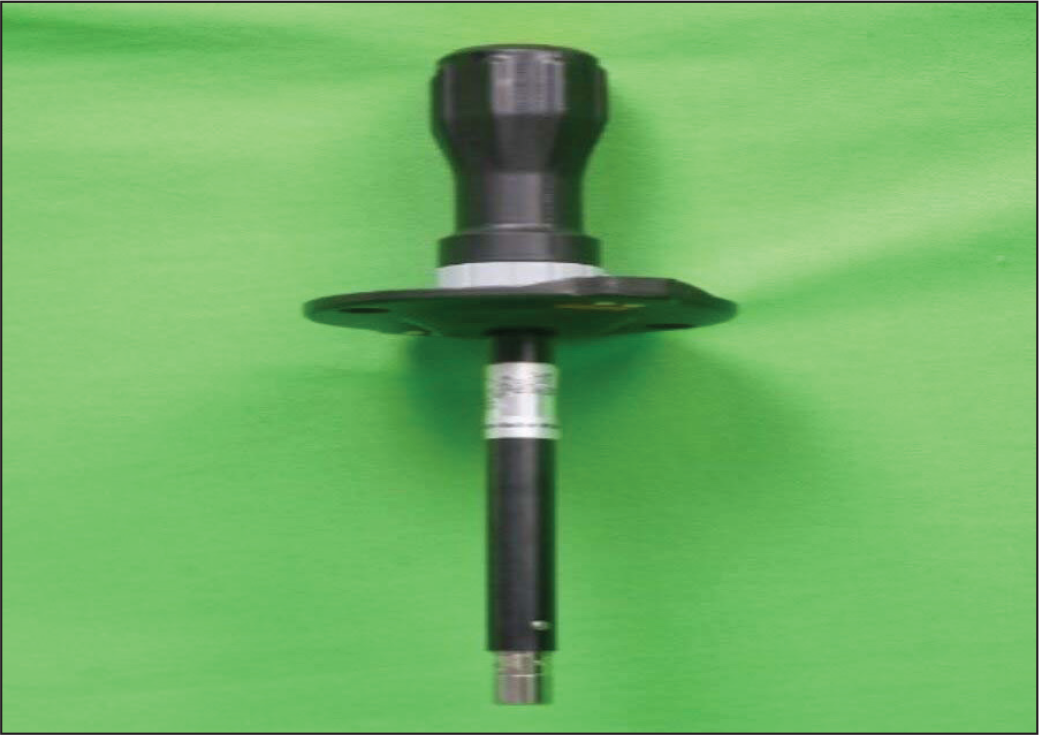
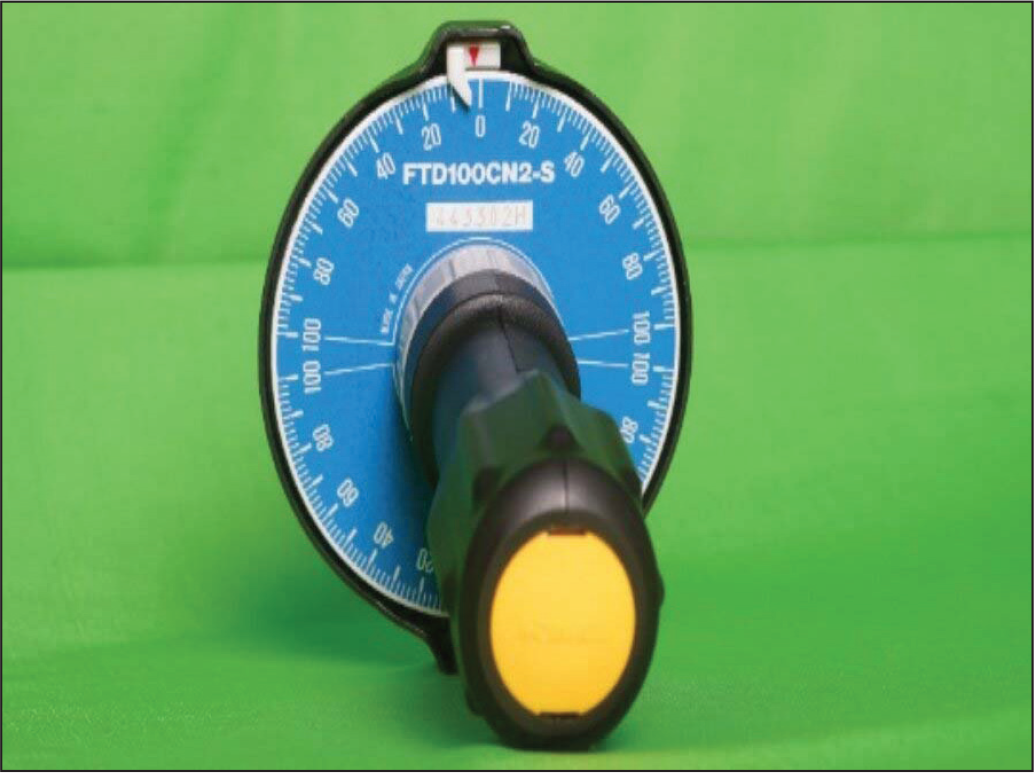
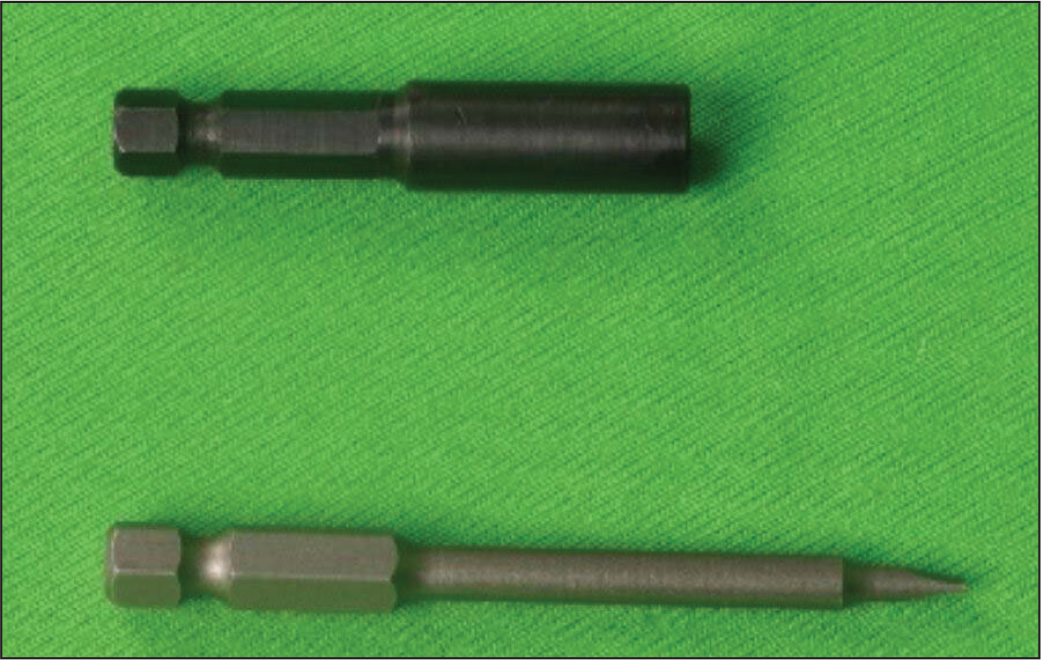
Mini-implants were inserted manually with a torque-measuring screwdriver (Figures 7 and 8) into the acrylic block with the frequency of 20 to 30 rpm (rotations per minute). The corresponding peak torque values which showed on the dial of the torque screwdriver were recorded in Ncm. The same procedure is followed for all the mini-implants, whereas the driver bits (Figure 9) were changed according to the head design of the mini-implants.
Dial Indicating Torque Screwdriver (Tohinichi FTD100 CN2-S)
Dial Indicating the Torque Values in Ncm
Customized Bits for the Insertion of Mini-implants in the Block
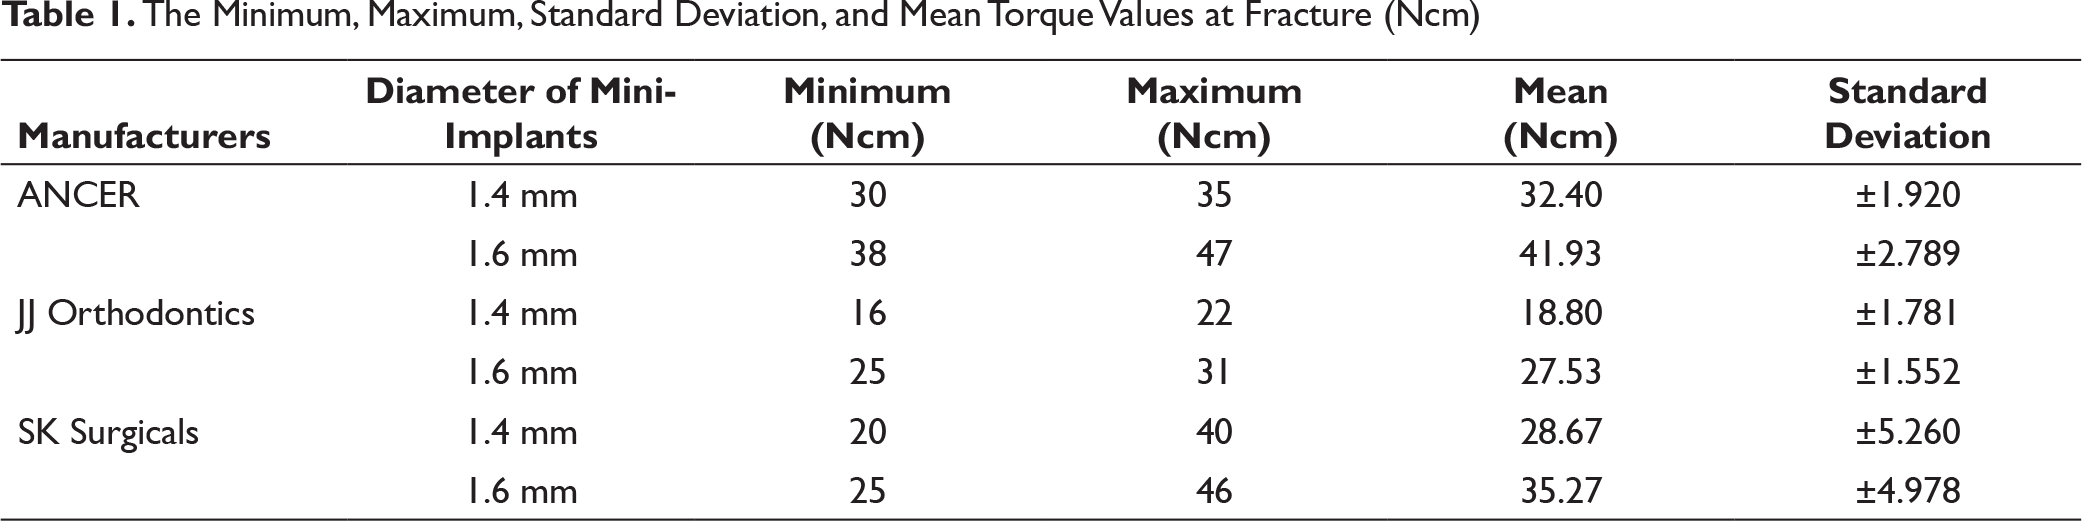
The Minimum, Maximum, Standard Deviation, and Mean Torque Values at Fracture (Ncm)
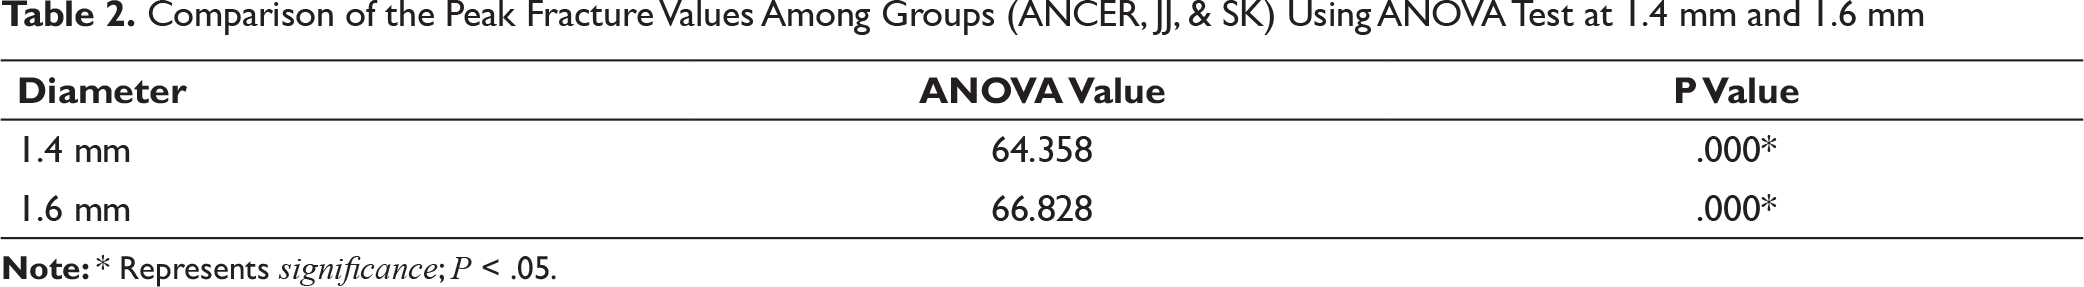
Comparison of the Peak Fracture Values Among Groups (ANCER, JJ, & SK) Using ANOVA Test at 1.4 mm and 1.6 mm
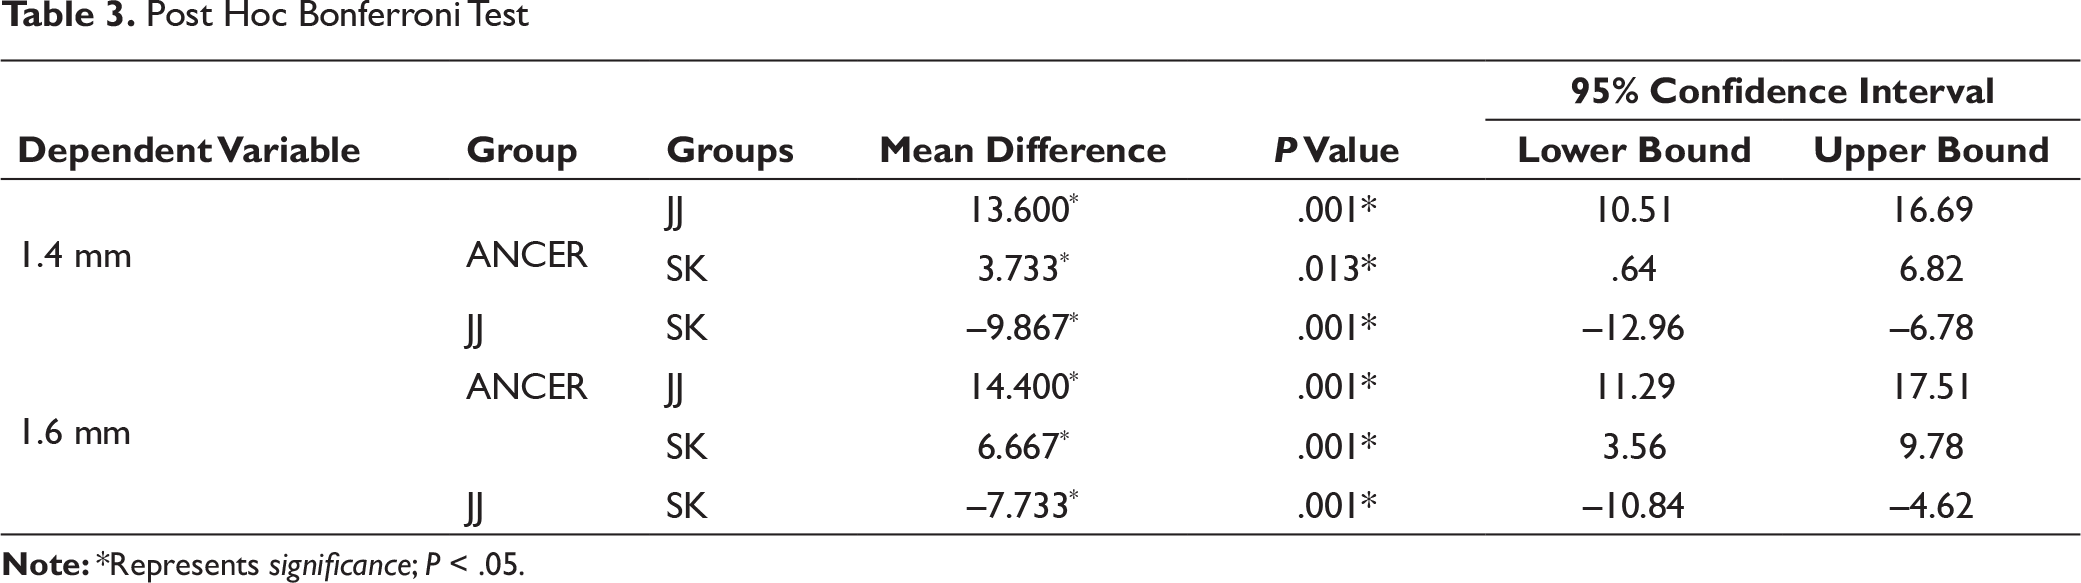
Post Hoc Bonferroni Test
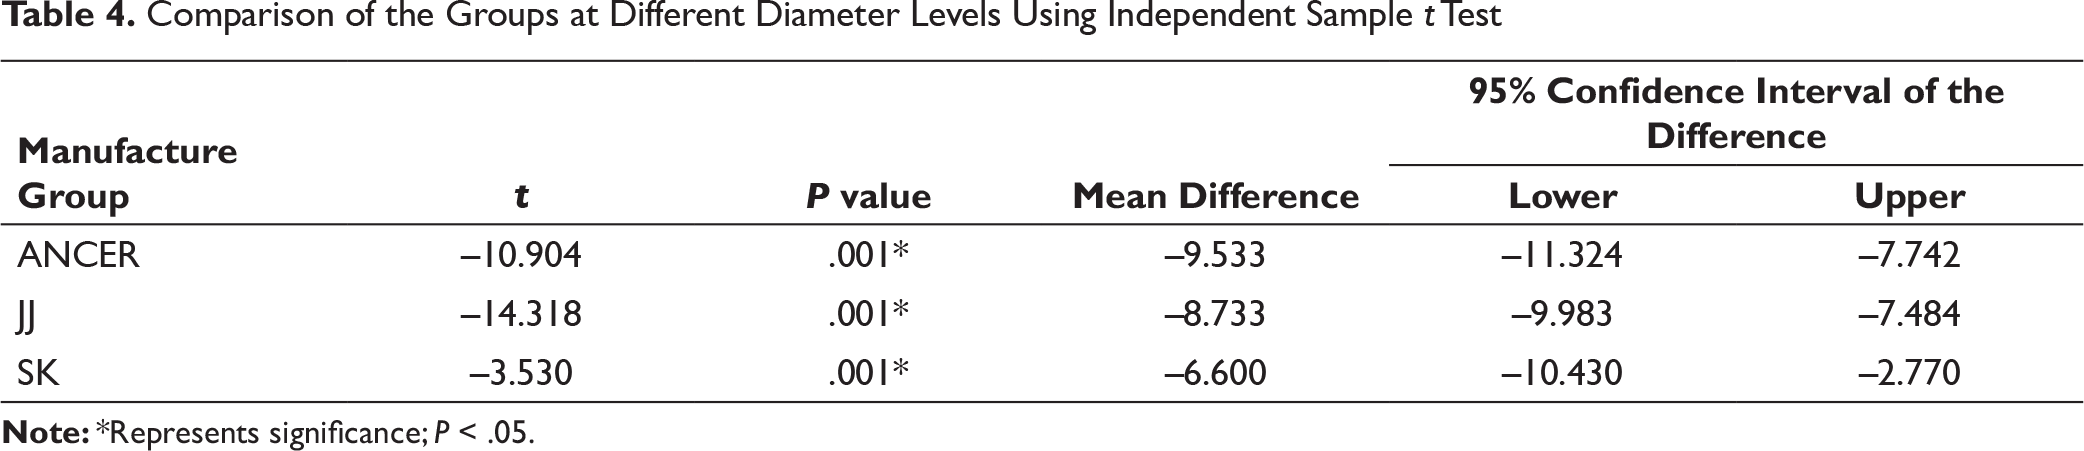
Comparison of the Groups at Different Diameter Levels Using Independent Sample t Test
Descriptive statistics including mean value, standard deviation, and ranges were calculated for all the subgroups of groups using the Statistical Package for Social Sciences. The significance level was predetermined at P < .05. A one-way analysis of variance (ANOVA) followed by post hoc Bonferroni’s test was used to detect significant differences between manufacturers. Independent t test was used for the comparison of the groups at different diameters.
Results
Descriptive analyses of all manufacturers with varying diameters are summarized in Table 1. It includes the mean, and the standard deviation along with the minimum and the maximum torque values of all the manufacturers with different diameters.
There was a significant difference among the groups of different manufacturers in the fracture torque values. The 1.6 mm had a higher peak fracture torque than the 1.4 mm mini-implants. In 1.6 mm diameter implants, the highest fracture torque was recorded in Ancer, whereas the lowest was recorded in JJ Orthodontics with the values 47 Ncm and 31 Ncm, respectively. The peak fracture torque values of 1.4 mm diameter also had the similar result of 1.6 mm, where Ancer group had the highest resistance (30 Ncm) and JJ Orthodontics the lowest (16 Ncm). The mean peak fracture torque values of all the implants were depicted in Table 1.
Table 2 shows the statistical analysis of ANOVA test for the comparison of peak fracture torque values. The test shows a significant difference among all the manufacturers in both the diameters with P < .05. Post hoc Bonferroni’s test showed significant differences among the manufacturers (Table 3).
Among the 1.4 mm diameter, a comparison in peak torque fracture value between Ancer and JJ Orthodontics showed significant difference with a mean difference of 13.60 and P = –.001. The Ancer group compared with SK Surgical group results showed a mean difference of 3.733. The comparison between the JJ Orthodontics group and SK Surgical showed a mean difference of –9.867 with significance value P = .001.
The 1.6 mm diameter comparison of peak torque fracture value between Ancer and JJ Orthodontics groups showed a mean difference of 14.40 and significance difference with P = –.001, whereas the Ancer group compared with SK Surgical group results showed that the mean difference was 6.667 and significance of P = –.001. In contrast to this, the comparison between the JJ Orthodontics group and the SK Surgical showed a mean difference of –7.733 with a significance value P = –.001.
The post hoc Bonferroni test result clearly depicts the mini-implants with the highest and the lowest torque values. The highest peak torque value is recorded in Ancer group, whereas the lowest is seen in JJ Orthodontics group in both the diameter variations.
An independent sample t test shows the comparison among the groups between the peak torque fracture values and diameter. In Table 4, all the 3 groups showed a significant difference between the diameters and the peak torque values. The mean difference was high in Ancer group, whereas the lowest was recorded in the SK Surgical group.
Discussion
Previous studies and literature report a wide variation among manufacturers in stability and fracture resistance of mini-implants. 17 There are various commercially available mini-implants in India but with wide variety of price difference among them. In this study, the fracture torque values of the generally available manufacturers in India were found.
Various insertion mediums were considered before selecting the acrylic block. A pilot study was conducted to assess the fracture of mini-implants in the self-cure acrylic block, but the stiffness and resistance were not enough to fracture the implant. Animal cortical bone samples were ruled out due to the difficulty in obtaining homogeneity and reproducibility. The properties of heat cure acrylic satisfied the requirements for the fracture test of implant. Whang et al in his study considered various substrates for mini-implant insertion and used acrylic rods in hexagonal shape fabricated from heat-cured acrylic for torque testing. 4
A predrill of diameter 0.5 mm and depth of 3 mm were drilled to guide the implants tip with an interval of 10 mm between the guide holes. Although predrill is not required for self-drilling type of mini-implants, to avoid excessive torque and to meet the American Society for Testing and Materials standards predrill was considered. 3 This is similar to the recommendations of Angie Smith’s study. However, Jolley and Chung reported that there is no much difference in torque values with and without pilot drill. 18
Torque depends upon various factors such as bone density, diameter of the screw, length of the screw, and RPM during insertion. 18 As bone density is different in maxilla and mandible, torque values vary accordingly. Knowing and measuring torque is an important concern for implant placement. 19 In this study, a torque-measuring screwdriver indicated by a dial is used for knowing the peak torque value at a fracture point. A torque screwdriver used in this study is manufactured by Tohinichi Mfg. Co. Ltd. It has the accuracy rate of ±3% and can be reliable on the torque readings shown during insertion. Similar kind of torque screwdrivers and wrenches are used by various researchers for testing the torque values. Motoyoshi et al used a torque screwdriver for knowing the stability of mini-implants. 20
Earlier many researches were conducted to know the optimum torque level required for the insertion in maxilla and mandible in both clinical and laboratory conditions. Motoyoshi et al measured the mean insertion torque required for mini-implants in maxilla and mandible in clinical conditions which was between 8.3 Ncm in maxilla and 10 Ncm in mandible. The implant used was of self-tapping type where predrill is mandatory.13, 17 Chaddad et al, suggested the required torque as 15 Ncm for placement. 21
The torque required for the insertion of an implant is different from clinical and laboratory settings. Song et al, studied the placement torque of different types of mini-implants in a laboratory setup on a synthetic bone which replicated the human bone characteristics, the insertion torque value reached up to 40 Ncm with the thickness of 2 mm cortical bone when inserting 1.6 mm implant diameter. 22 Lim et al reached up to 40 Ncm in 2 mm cortical bone thickness in artificial bone sample with 1.5 mm diameter. 12 With the consideration of torque values in clinical and laboratory from the earlier researches, it is known that the peak fracture torque values in this study is in the required range of insertion torque. Even though the torque values are in the range, the operator should be cautious while placing in the dense cortical region where the insertion torque increases due to thicker cortical plate.
Among the implants tested irrespective of manufacturers, the implants with diameter 1.4 mm have low fracture torque value than the ones with 1.6 mm diameter. This result of increased torque value with the increase in diameter shows the direct correlation between diameter and torque. This was similar to the findings of Jolley and Chung. 18 Similarly, Carano et al evaluated the mechanical properties of 2 different diameters of same manufacturers and demonstrated that the implant with less diameter showed less resistance to torsional strength and deformation. 23 Whang et al also found the similar correlation and also stated that a core diameter of mini-implant is not solely determining the torque value but also the composition and production technique. 4
The fracture resistance in Table 1 shows that all manufacturers are significantly different from each other. The mean value recorded in this study varied from 41.93 Ncm (Ancer) to 18.80 Ncm (JJ). Different manufacturers exhibited different torque levels; this is similar to the many previous study findings which were conducted to analyze the torque values of different manufacturers. However, the manufacturers used in this study have not been previously studied for fracture torque considerations.
The mini-implants showed a well-established direct relation between the diameter of implant and fracture torque. 9 Even though each group was made with same material, composition, and design, the diameter of an implant played a key role in recording the peak torque value. 17 The 1.4 mm diameter of Ancer implants showed a mean value of 32.40 Ncm, whereas the 1.6 mm diameter showed the 41.93 Ncm (mean difference –9.533). Similarly, JJ and SK mini-implants also had the same correlation between diameter and peak torque value. The mean values of 1.4 mm and 1.6 mm diameters’ torque values of JJ group were 18.80 Ncm and 27.53 Ncm, respectively (mean difference –8.733). SK Surgical implants showed a mean value of 28.67 Ncm in 1.4 mm diameter and 35.27 Ncm for 1.6 mm diameter (mean difference –6.600). This correlation of diameter to the torque values was achieved by Wilmes et al in 2011. 10
Factors such as composition, shape, thread design, and process of machining are always contributing in the fracture resistance of mini-implants.24, 18, 25 Despite this fact, in all the manufacturers using the same material, there might be minor variation in the composition during fabrication. The widest range of standard deviation can be seen in the SK Surgical group by ±5.260 and ±4.978 for 1.4 mm and 1.6 mm diameter mini-implants, respectively. This might be due to the lack of homogeneity in the implant fabrication. A similar finding was seen in Tomas-pin implants which had a wide variation in fracture torque (36.12 Ncm ± 3.89). 3
In this study (Figure 10), almost all the mini-implants were fractured at the junction of the mini-implant and the acrylic block, which is similar to the findings of Wilmes study. 9 They found that the design of the implant and the shaft may play a role in the region of fracture, which is found similar in the SK Surgical group (Figure 11). One of the mini-implants from Ancer fractured at level 2 mm from the level of the block (Figure 12); the same result was depicted in studies by Angie et al and Whang et al. The fracture at the level of block is due to the concentration of internal stress during insertion.3, 4
Figure 10. Mini-implants Embedded in the Acrylic Block After the Fracture (1.6 mm of ANCER) at the Junction Mini-implant and the Block
Mini-implants of SK Surgical Showing the Fracture at the Head
Mini-implants of 1.4 mm Diameter of ANCER, Fracture at the 2 mm Above the Junction
Implant insertion torque is directly proportional to the density and quality of bone, the thickness of the cortical bone, the design of the implant used, and the technique of placement.8, 14, 15, 20 High insertion torque and force was used for the placement of implant in high bone density regions. 26 The fracture torques of both tip and neck are higher than the torque required to insert mini-implants. 27
The peak fracture torque values of all mini-implants falls within the range of insertion and removal torque values; extra care and caution should be taken during the working process with implants. The failure rate of implant also depends on the clinician’s experience. The application of heavy force leads to fracture of the implant. In case of clinicians with less practice of placing an implant, it is safe to predrill the site of insertion before implant placement and the use of torque limiting drivers and gauges may be beneficial. The torque needed to break or fracture any of the implants is much higher than the torque experienced in the oral cavity. Hence, it is our collective clinical opinion that all the implants available in the Indian market are suitable for clinical use.
Limitations
The study only encompassed implants of 10 mm length from 3 manufacturers. Although the usual implants used in clinics are the 6 mm, 7 mm, and 8 mm implants. The diameters selected were 1.4 and 1.6 mm. Including the comparison with 1.2 mm diameter implants and varying lengths is definitely helpful for any clinician.
Conclusion
The observed highest fracture resistance is 47 Ncm and least fracture resistance is 16 Ncm. These values are higher than the required torque to position any implant intraorally.
Ancer mini-implants of 1.6 mm diameter and 10 mm length have the maximum peak fracture torque resistance followed by 1.6 mm diameter and 10 mm SK Surgical mini-implants.
The 1.4 mm diameter Ancer mini-implants have the highest peak fracture torque compared to SK Surgicals and JJ Orthodontics.
Ancer mini-implants have the highest fracture torque resistance compared to other manufacturers in this study; SK Surgicals mini-implants are the most economical and beneficial mini-implants to the patients and clinicians.
Footnotes
Declaration of Conflicting Interests
The authors declared no potential conflicts of interest with respect to the research, authorship, and/or publication of this article.
Funding
The authors received no financial support for the research, authorship, and/or publication of this article.