
Abstract
Which particular selective pressures guided the evolution of zebra stripes? This question, one of biology's most celebrated conundrums, is also of potential interest to readers of Perception, as, on most accounts, stripes’ benefits to zebras reflect perception of stripes by their predators, parasites, or conspecifics. Although stripes do not seem to camouflage zebras or warn off predators, various accounts implicate perception, including proposals that stripes disrupt predator perception, aid intra-species recognition, or deter biting flies. Currently, only the last of these enjoys strong empirical support: narrow stripes on zebras’ heads, necks, shoulders, limbs, and flanks are known to deter biting flies, and variation in patterns of those stripes is associated with parasite burden, not predators, across species. Rump stripes, however, are different. Typically broad and horizontal, there is some evidence that they vary with hyaena threat rather than parasites, consistent with an antipredator role. Here, viewing images of zebras, filtered to simulate lion and spotted-hyaena vision at distance or in motion, human observers typically judged rump stripes to be the most attention-capturing regions of the images. Computational models implicated visual salience in this effect, and pursuit simulations showed that by driving predators’ attention to a zebra's rear, rump stripes could minimise the probability of capture.
Introduction
Over a century after Darwin and Wallace puzzled over zebra stripes’ evolution, a mechanistic account of their benefits is now finally approaching consensus (Caro, 2016, 2020; Caro et al., 2014; Cobb & Cobb, 2019; Darwin, 1871; Godfrey et al., 1987; Gosling, 2017; How & Zanker, 2014; Ireland & Ruxton, 2017; Kingdon, 1984; Larison et al., 2015; Melin et al., 2016). Several intuitive accounts have been explored that can now largely be excluded, for example, zebra stripes are ill-suited to background matching (Darwin, 1871; Godfrey et al., 1987). It has been suggested, instead, that zebra stripes’ high contrast might be better suited to other antipredator effects, such as generating misleading motion-signals, crypsis, or confusing predators (Godfrey et al., 1987; Hayward & Kerley, 2005; How & Zanker, 2014; Scott-Samuel et al., 2011, 2015, 2023). However, most zebra stripes are too narrow to be visible to lions (Panthera leo) or spotted hyaenas (Crocuta crocuta) at a distance (Melin et al., 2016) and offer no clear benefit over drab colouring (Hughes et al., 2017; Scott-Samuel et al., 2011, 2023). Indeed, long observation has yielded little evidence that lions or hyaenas are confused (Elliott et al., 1977; Hughes et al., 2021; Kruuk, 1972; Larison et al., 2015; Schaller, 1972) or repelled (Caro, 2020; Melin et al., 2016; Schaller, 1972) by zebras’ stripes. Alternative theories that stripes drive cooling effects (e.g., Cobb & Cobb, 2019; but see Horváth et al., 2018) or aid intraspecific recognition (Darwin, 1871; Ireland & Ruxton, 2017; Kingdon, 1984) also are not supported by the weight of evidence. Rather, an old theory (e.g., Caro, 2016; Harris, 1930; Waage, 1981) that zebra stripes deter biting flies has by far the strongest evidence base—narrow stripes common to all zebra species do deter tabanids (Egri et al., 2012) and are associated, across species, with tabanid exposure (Caro et al., 2014).
Rump stripes, though, do not fit this picture. First, the greater width of rump stripes in plains and mountain zebras may reduce biting-fly deterrence relative to narrow stripes (Egri et al., 2012). Second, in Caro et al.’ (2014) examination of associations between stripe characteristics (on different parts of the body and in different species/subspecies) and other environment variables, while stripes on other parts of zebras’ bodies correlated strongly with tabanid presence, rump stripe width correlated, across species, with spotted-hyaena threat. Though no positive evidence of lion associations was observed (we return to this later), this raises the possibility that rump stripes might confer anti-predator benefits. This is unlikely to rely upon aposematism (warning signals to predators), as there is no evidence that hyaenas or lions are dissuaded by striped patterning (e.g., Caro, 2016). Indeed, aposematism in zebras across species is not obvious, Grévy's zebras are the largest and most formidable of zebra species, yet seem preferentially predated upon (Davidson et al., 2019; Rubenstein, 2010). Instead, as we propose here, zebra rump stripes may minimise probability of capture during pursuit, by exerting powerful effects on their predators’ attention.
Two experiments described here measure subjective capture of human observers’ attention by rump stripes in images of zebras. We filtered images to simulate estimates of lion and spotted-hyaena acuity, during daylight and at dusk, at varying distances typical of stalking and pursuit, and simulated blurring effects of horizontal image motion. We then simulated potential benefits of this effect on pursuit of zebras by their major non-human predators, finding that for most zebras, rump stripes drive human observers’ attention toward the rear of the animal. These findings supported our pre-registered predictions (AsPredicted.org #52944; #54384) concerning rump stripes in mountain zebras and plains zebras without marked “shadow” striping. For the endangered Grévy's zebra, and plains (Burchell's) zebras with marked shadow (lower contrast stripes between rump stripes that effectively reduce rump stripe width), we expected any such effect to be reduced or absent. These predictions were made on the basis of author GD's prior, unpublished observations of running zebra and zebra viewed at distance; the effect can be observed here: github.com/alexmuhl-r/Zebra-Project/blob/master/IllustrativeVideo.mp4, at author AMR's Github page, along with all other data and analysis code relating to this paper. Experiments are available online, here: https://app.gorilla.sc/openmaterials/207836
Experiments 1 and 2
Methods
Observers
Experiment 1: Fifty-two observers were recruited via Prolific.co (Palan & Schitter, 2018), 24 took part in Experiment 1 (Mean = 23.75 years, SD = 3.78, 16 female, 4 excluded due to missing data), 28 in Experiment 2 (Mean = 24.46 years, SD = 6.26, 9 females, 1 excluded due to missing data). Sample sizes were pre-registered and approval was obtained from the University of Cambridge Psychology Ethics Committee (1482.47).
Stimuli
Forty-eight photographs of zebras in profile (from online repositories) were used in both experiments, twelve of each with the following stripe patterns: “mountain zebra”, “plains zebra (no shadow stripes)”, “plains zebra (shadow stripes)”, “Grévy's zebra”. For Experiment 1, horizontal-motion blur (50 px) was applied to these images, using the GNU Image Manipulation Program, to produce a corresponding set of 48 motion-blurred images (GNU Image Manipulation Program (GIMP), 2025). While predator gaze stabilisation would likely reduce perceived blurring during pursuit, we simulated a modest level of motion blur to account for noise, retinal instability and micro-saccades. All images were scaled to 960 × 960 px, placed on a 1024 × 1024 px square Gaussian noise background, then scaled down to 512 × 512 px square. Lions’ photopic acuity at 10 m was simulated with AcuityView package in R (Caves & Johnsen, 2018), assuming observer-viewing-distance of 70 cm, an image-width of 13 cm and visual acuity of 13.42 cpd (Melin et al., 2016). Lion/hyaena dichromacy was approximated using Kovesi's MATLAB toolbox (Kovesi, 2000), with absorption peaks of 430 nm and 553 nm. Each image was duplicated and flipped-horizontally to create two sets of flipped images (one with zebras facing left, one, facing right; 196 stimuli in all). Using equal numbers of left and right facing images ensured any lateral (left-right) response bias, that observers may have, would not yield an overall front or back bias.
For Experiment 2, the 48 original 1024px stimuli were scaled to produce sets of “middle-distance” (256 × 256px) images and “far-distance” (165 × 165px) images. Presented on Gaussian noise backgrounds, the two new sets of stimuli were filtered and colour-adjusted to simulate lion-photopic (13.42 cpd), lion-mesopic/hyaena photopic (7.84 cpd), and hyaena-mesopic (4.60 cpd), acuity and dichromacy. Due to concerns that there were now too many images to view in a single session, each observer viewed equal number of left and right facing images, but not both left and right versions of each image. However, across the sample of participants, images were selected so that left and right versions of each image were presented equally often. At 7 cm square, the 20-m set should approximate image size of zebras viewed at 17.28 m—24.22, assuming mean zebra length of 2.42 m. At 3.5 cm square, the 40 m stimuli should yield image sizes typical of 35–48 m real-world viewing.
Procedure
Both experiments used the same online salience task built on the Gorilla platform (Anwyl-Irvine et al., 2020). Observers used a mouse and cursor and their own desktop or laptop computer to click on the region of each image that immediately captured their visual attention. The task was self-paced, each trial starting with a fixation cross, then a single zebra image at fixation, triggered by pressing of a mouse button. Observers were told not to reflect on which region was most salient but rather to select wherever “caught their eye”, to index subjective salience and its exogenous control of visual attention. Gorilla's credit-card screen calibration procedure ensured images were approximately equated for size across observers’ displays (confirmed by post-experiment task). Analyses were preregistered for Experiment 1 (AsPredicted.org #52944) and Experiment 2 (AsPredicted.org #54384). The dependent variable was the proportion of clicks on the front vs rear half of the zebra image, for each observer and stripe pattern, 0.5 being subtracted from each to centre the available range of scores at zero. Computational modelling of visual salience in the images used the MATLAB SMILER toolbox (Wloka et al., 2018). The LDS (Learning Discriminative Subspaces) model was selected for human comparisons as it yielded most tightly clustered estimates here and performs well on predicting human saliency judgments (Fang et al., 2016). LDS served only as an example model, the specifics of which weren’t of particular importance to our current goals; Graph-based Visual Salience (Harel et al., 2007) and Fast and Efficient Saliency (Rezazadegan Tavakoli et al., 2011) models showed similar patterns and associations with human responses. Briefly, however, the LDS model is trained by selecting many random patches from a large dataset of natural images with salient targets and uses principle-components analysis (PCA) to identify feature subspaces that best distinguish target image regions from others. LDS is therefore not a model drawn from biologically-plausible heuristics (e.g., centre bias) as they were not our focus, but does capture human perception of image regions that are most salient and which preferentially attract overt attention (Fang et al., 2016).
Results and Discussion
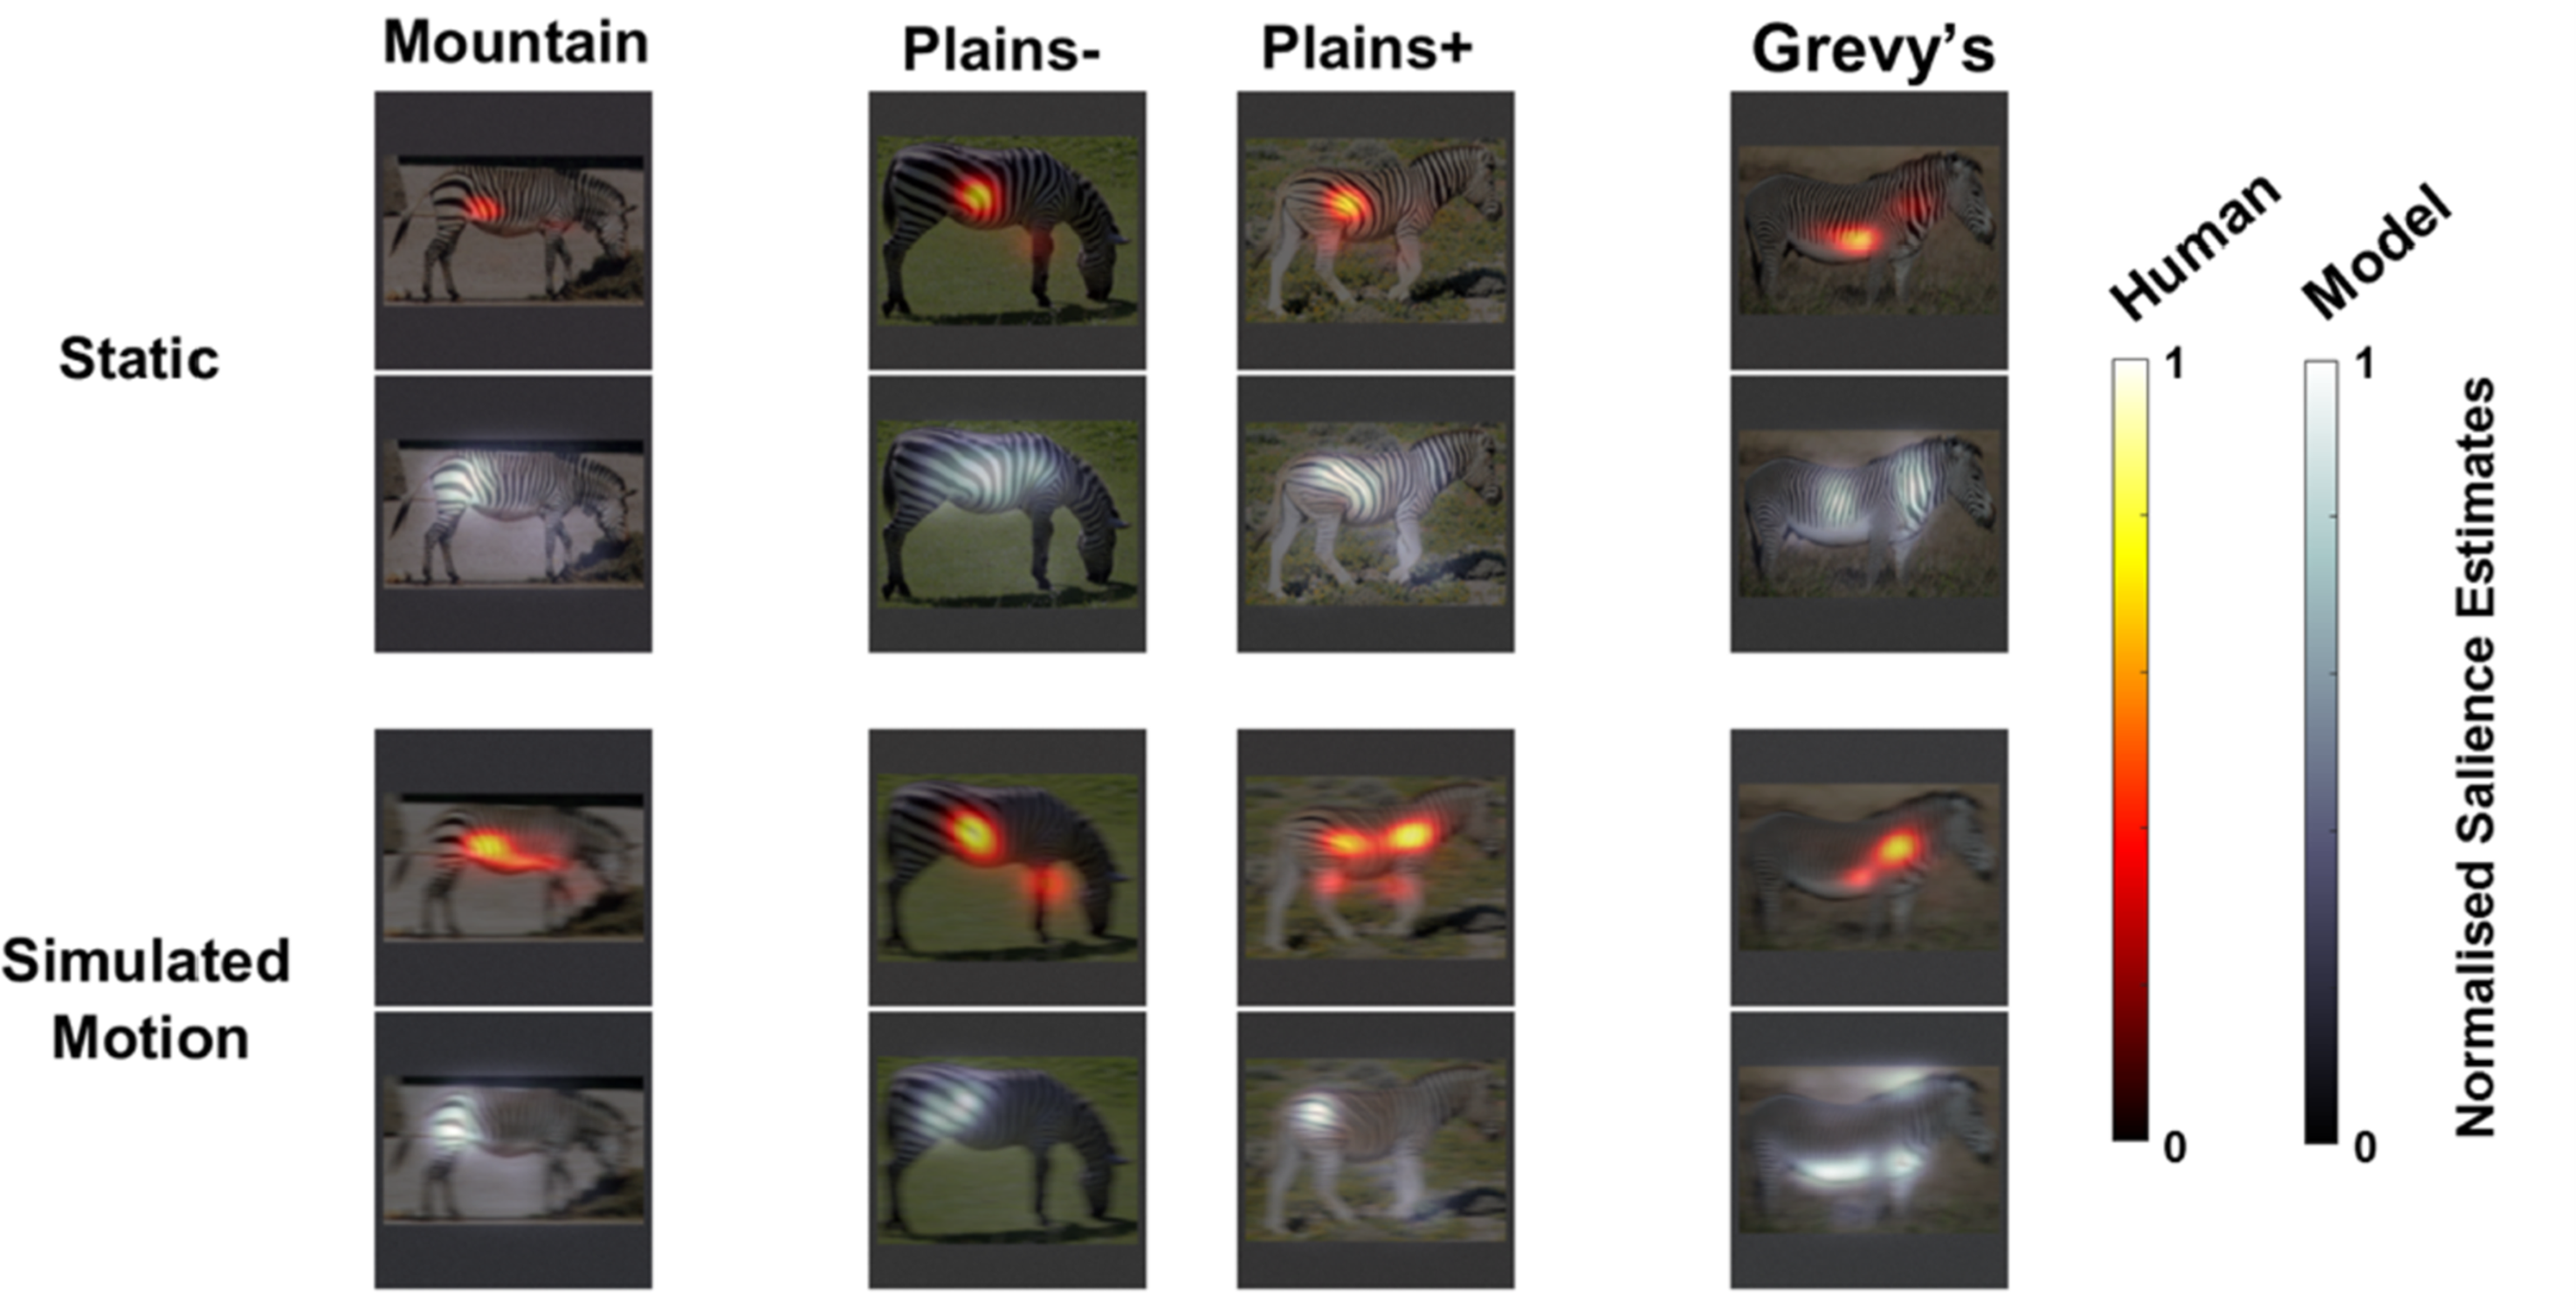
Example salience heatmaps (of normalised saliency estimates) for human observers and Learning Discriminative Subspace (LDS) model estimates for stripe patterns in Experiment 1. Columns, left to right, mountain zebras (Equus zebra zebra, Eq. z. hartmannae), plains zebra without shadow stripes (“Plains−,” Equus quagga borensis, Eq. boehmi, Eq. chapmani), plains zebra with salient shadow stripes (“Plains+,” Eq. burchellii), and rightmost, Grévy's zebra (Equus grevyi). First and third rows show example heatmaps of observers' judgments of maximally attention-capturing locations, second and fourth rows, salience heatmaps from the LDS model.
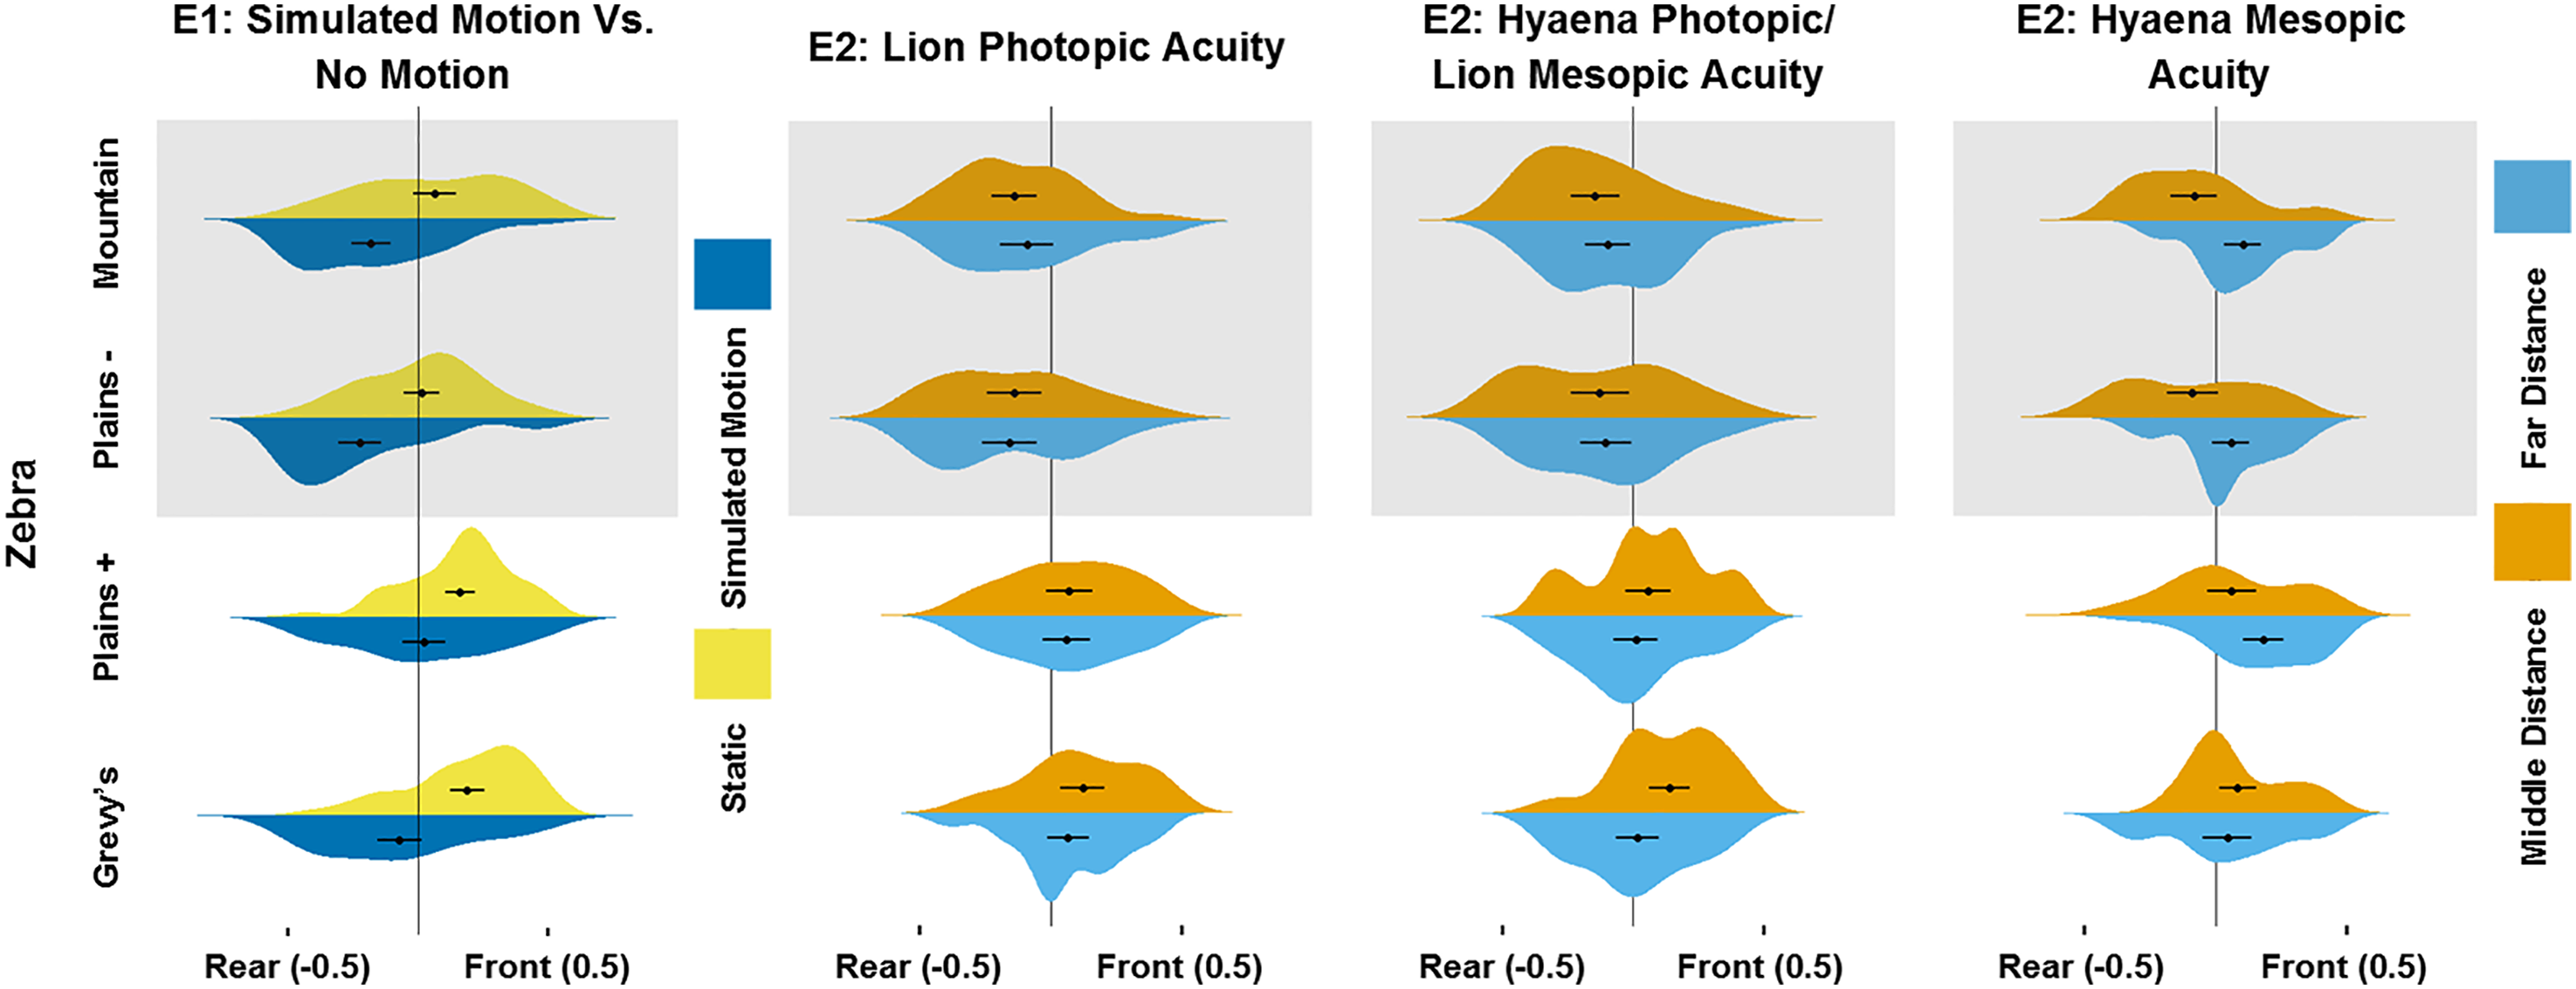
Mean proportions of human attention-capture judgments to the front versus the rear of different striping patterns. Leftmost column: Static and simulated motion conditions in Experiment 1; note reward bias with simulated-motion in mountain and plains− patterns. Rightmost three columns: Far/middle distances and three acuity levels in Experiment 2. Maximal salience judgments for mountain zebra and plains− images rearward biased in all conditions except hyena mesopic acuity at far distance (Error bars, 95% C.I.).
Principal results from Experiments 1 and 2; please see text for details; frontward bias observed in two cases for plains+.
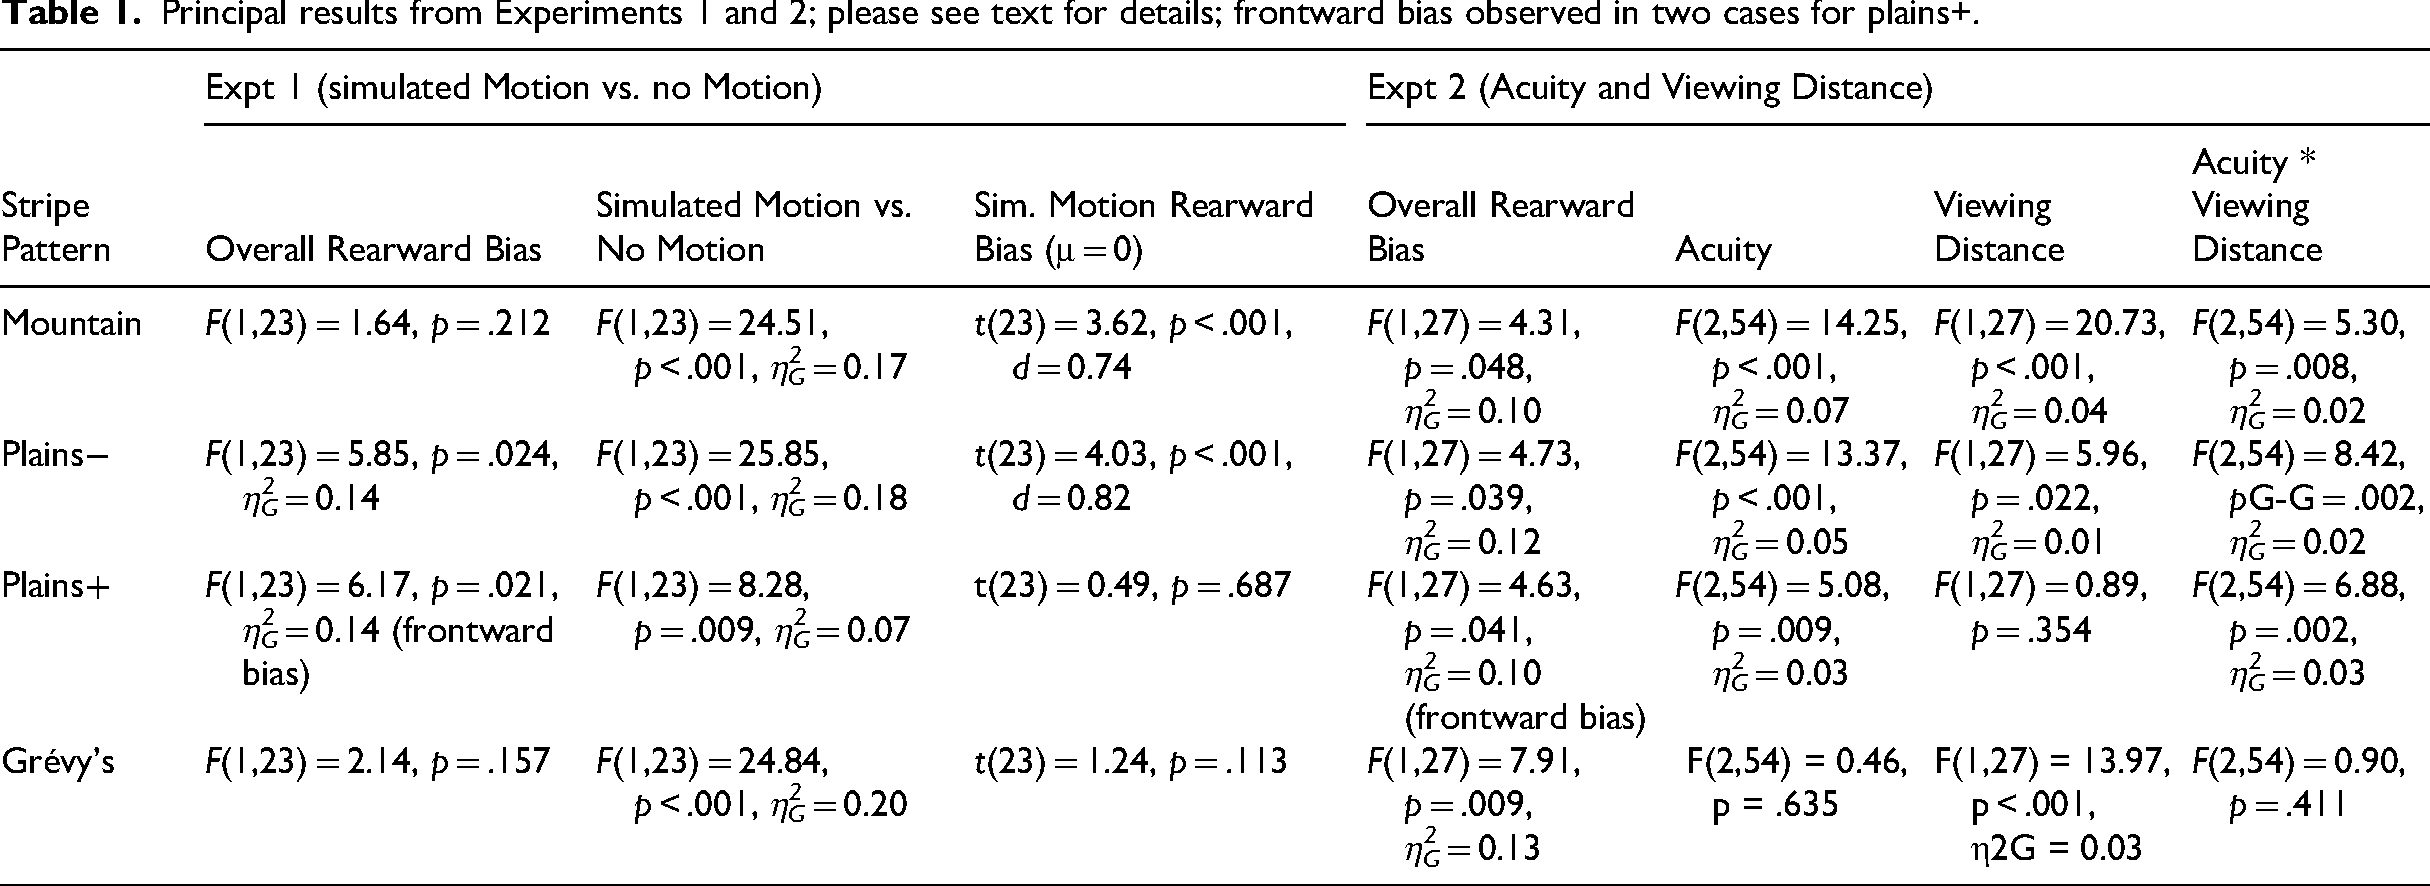
For the other two stripe patterns, rearward bias was expected to be weaker or absent. Plains+ images actually showed an overall frontward bias, reduced relatively for simulated-motion images, though this varied by facing-direction (F(1,23) = 5.83, p = .024, η2G = 0.02). For left-facing images simulated-motion showed reduced frontward bias versus static stimuli (t(23) = 3.75, p = .001, d = 0.86), but not for right-facing stimuli (t(23) = 1.40, p = .174). Results for Grévy's zebra showed no evidence of overall bias, simulated-motion increased rearward bias relative to static conditions but was not associated with absolute rearward bias. As predicted, rearward bias was greater for mountain (F(1,23) = 15.05, p < .001, η2G = 0.05) and “Plains−” images (F(1,23) = 40.11, p < .001, η2G = 0.09) than for Grévy's. These analyses revealed no higher-order interactions (Fs<=1.94). LDS salience model peaks and observer-pinpointed peaks correlated acceptably well for simulated-motion images (mountain: .419, plains−: .457, plains+: .477, Grévy's: .378) and less so for static images (mountain: .212, plains−: .363, plains+: .280, Grévy's: .183), suggesting a role for perceptual salience in subjective-attention-capture.
Experiment 1's results suggested that at close viewing range, broad, horizontal rump stripes were more salient than other stripes for plains− and mountain zebras, especially when simulated-motion is applied to images. This effect is evident in many videos of zebras, e.g., github.com/alexmuhl-r/Zebra-Project/blob/master/IllustrativeVideo.mp4. As predicted, the effect was weaker or absent in Plains− and Grévy's images. Next, Experiment 2 simulated longer viewing distances – 17.28–24.22 m (middle distance) and 34.56–48.47 m (far distance) – typical of stalking and pursuit by predators. For each range, three visual-acuity levels were simulated: lion photopic vision (“high acuity”), lion mesopic/hyaena photopic vision (“medium acuity”) and hyaena mesopic vision (“low acuity”). Experiment 2 examined only perception of static images, as horizontal motion-blurring will decrease at greater distance.
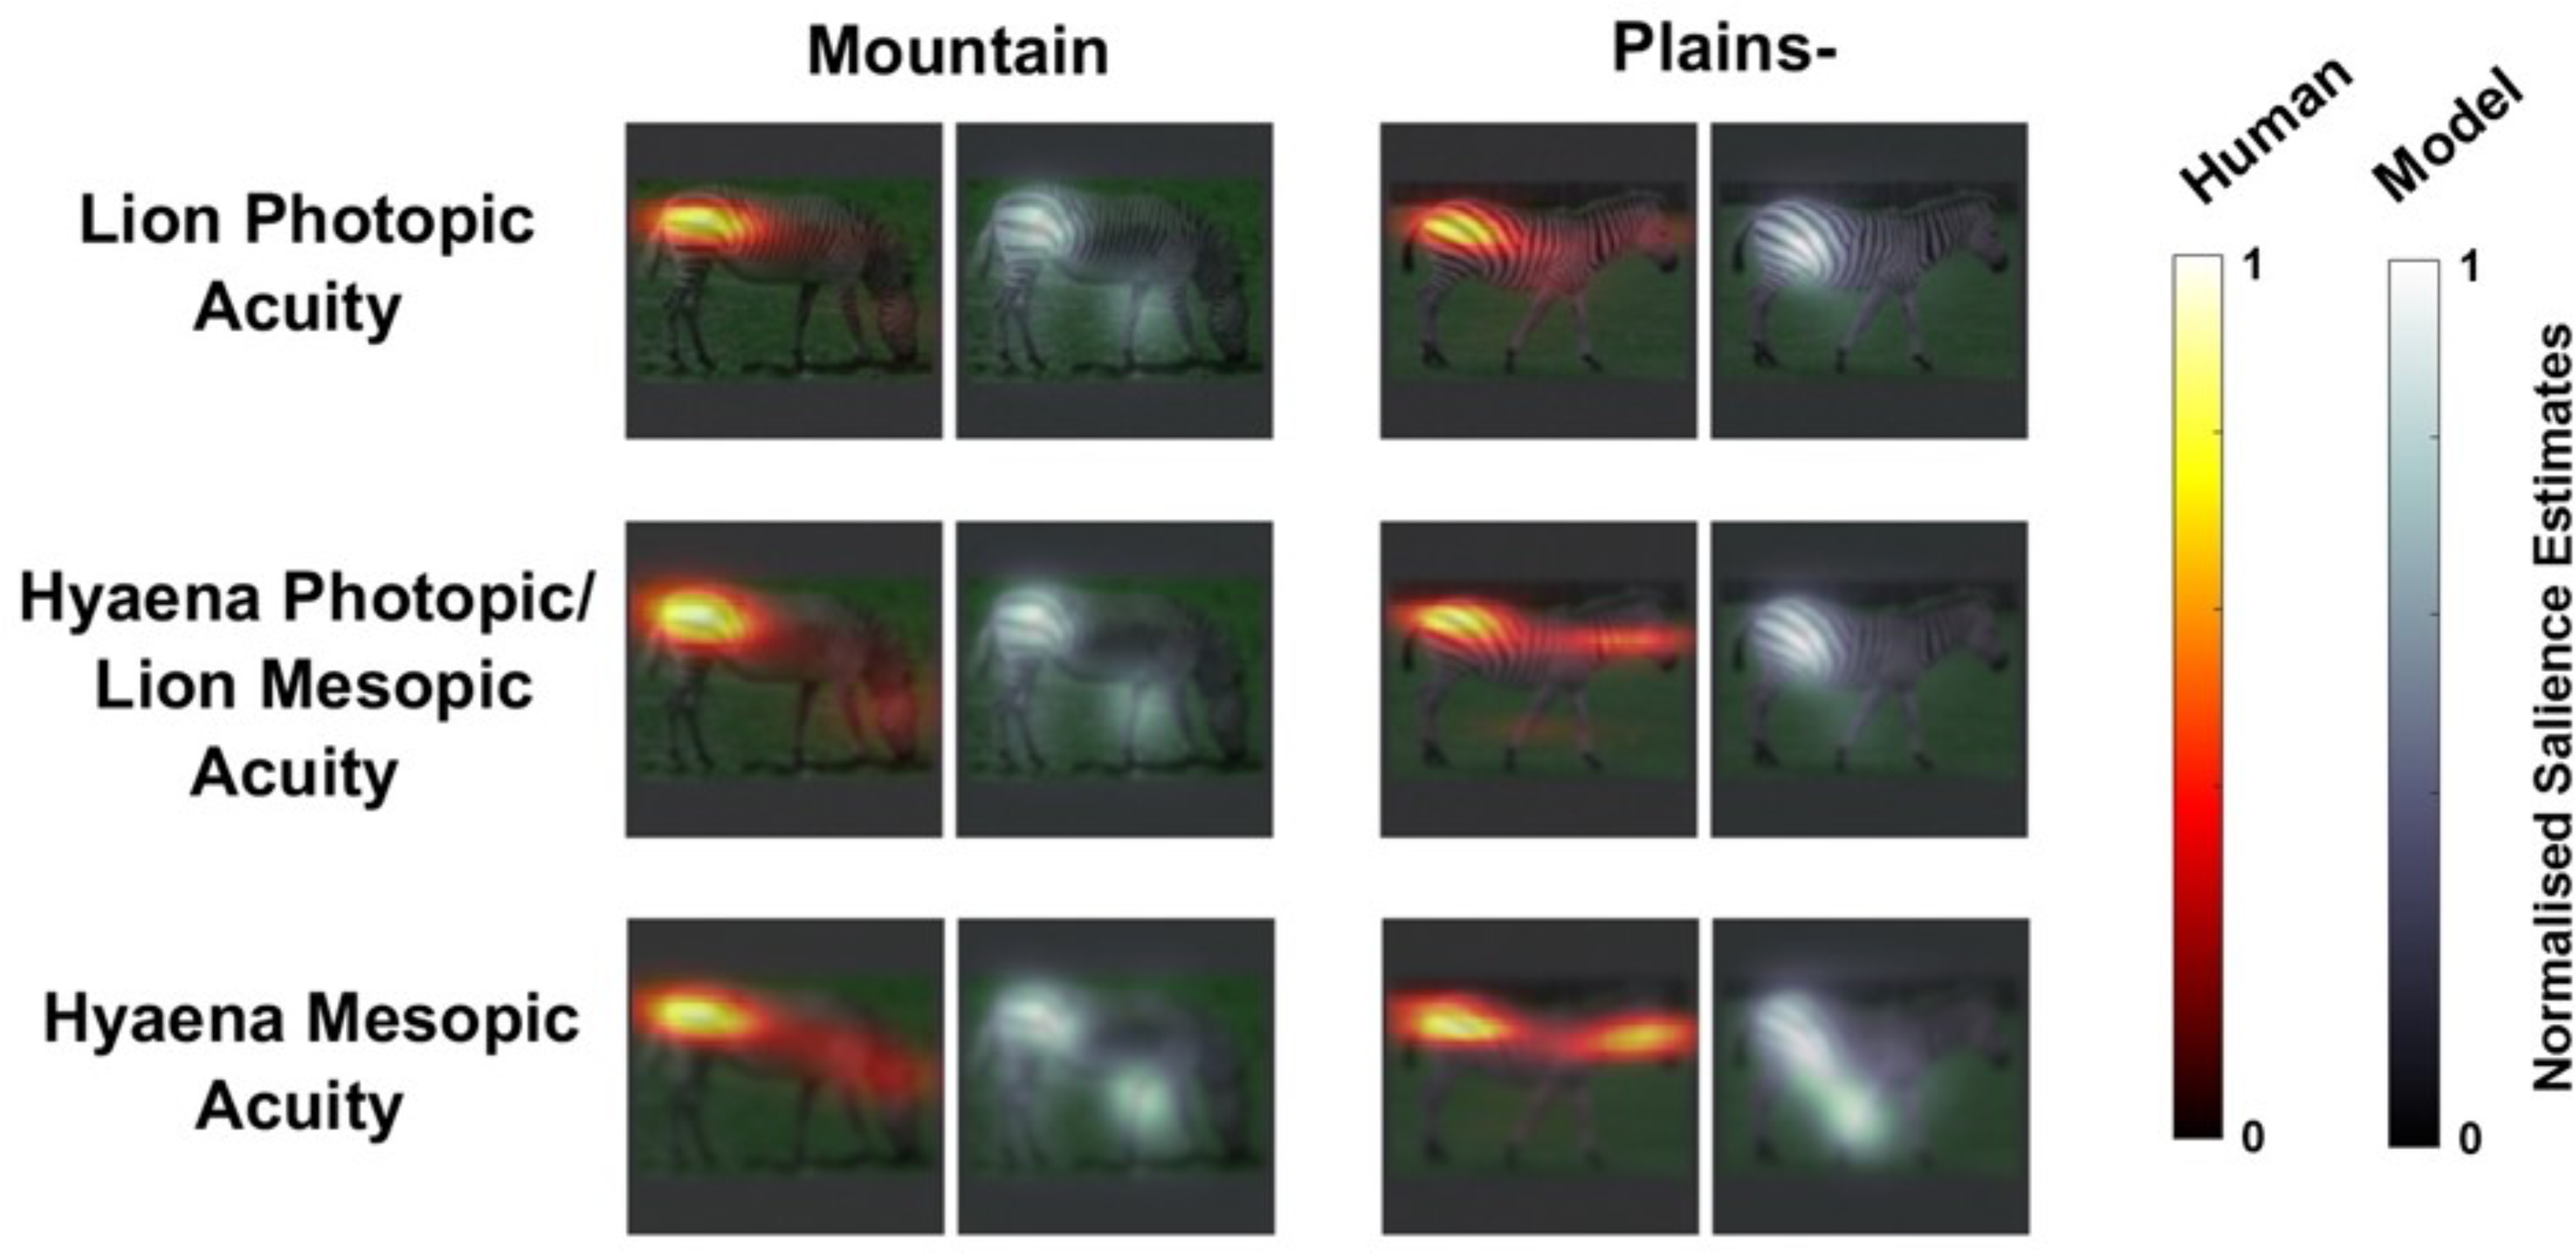
Example salience heatmaps, as for Figure 2, for human observer judgments and LDS model estimates for mountain zebra and plains zebra (without shadow stripes) patterns in Experiment 2. Rump stripes are judged most attention-capturing by human observers and most salient in the computational model.
For mountain zebra, the planned ANOVA revealed an overall rearward bias, main effects of acuity and viewing distance, plus an interaction (see Table 1). This reflected a difference in bias between middle and far distances for hyaena mesopic acuity (t(27) = 5.05, p < .001, d = 0.95), but not for other acuities (both t < 1.77, p > .088), at both of which there were overall rearward biases (across distances), as predicted (min. t (27) = 2.7727, p < 0.005, d = 0.52, one-tailed) Plains− images showed the same pattern: overall rearward bias, main effects of acuity, viewing distance and an interaction (please see Table 1). Again, rearward bias differed for middle versus far distance for hyaena mesopic acuity (t(27) = 3.84, p < .001, d = 0.73), but not reliably for the other two acuities (both t < 1.01, p > .324), at both of which there were overall rearward biases, as predicted (min. t(27) = 2.3042, p = 0.015, d = 0.44, one-tailed). While there was contrary to our expectations, no tendency for increased bias with decreasing acuity or increasing distance, the general rearward bias for Mountain and Plains- images otherwise confirmed our predictions.
Also as in Experiment 1, and again expected not to show strong rearward bias, Plains+ images showed an overall frontward bias, a main effect of acuity, not of viewing distance and an interaction. This again reflected distance effects at hyaena mesopic acuity (t(27) = 2.77, p = .010, d = 0.52), but not for the other two acuities (t < 1.33, p > .194). Grévy's zebra images also showed an overall a frontward bias, a main effect of viewing distance, not of acuity, and no interaction. As in Experiment 1, there was acceptable agreement between observers’ judgments and the LDS model (mountain: .487, plains−: .525, plains+: .427, Grévy's: .299).
Human judgments of salience and computational models again indicated that rump stripes’ characteristics “through the eyes of” zebras’ predators make them particularly attention-capturing at distance (for most plains and mountain zebras). These findings were based on estimates of lion and hyaena acuity and viewing distances over which this potential mechanism could affect predation. However, the general claim depends neither on the veracity of these estimates, nor on the exact shape of predator contrast sensitivity functions; they are evident even in standard photographic images of zebras.
We cannot yet know the adaptive value of salient rump stripes for zebras. However, if predator attention is drawn reliably to a zebra's rear during pursuit, this will likely increase time-to-capture and decrease probability-of-capture, for a range of predator ambush distances and speeds. Here, we illustrated this in simple pursuit simulations of a particularly high-risk scenario in which the predator's angle-of-approach is perpendicular to the zebra's path, allowing it to rapidly close distance between them. We modelled time-to-intercept for a range of estimated predator straight-line speeds when the predator tracked the head of the zebra versus tracked its salient rump stripes at the rear (see Figure 4). A simulation was terminated by successful interception by the predator, increasing distance between zebra and predator (indicating zebra escape) or timeout (20s: predator ceases pursuit). Figure 4, left, illustrates an example case: a predator tracking front of zebra (indicated by red triangles) captures it, but does not if tracking the rear. Figure 4, right, shows increased time-to-capture as a result of driving attention to zebra's rear. Black regions of the map (prey capture in neither case or both) aside, driving attention to the rear gains zebra 0–1.5 s, or 0–25 m, a substantial advantage.
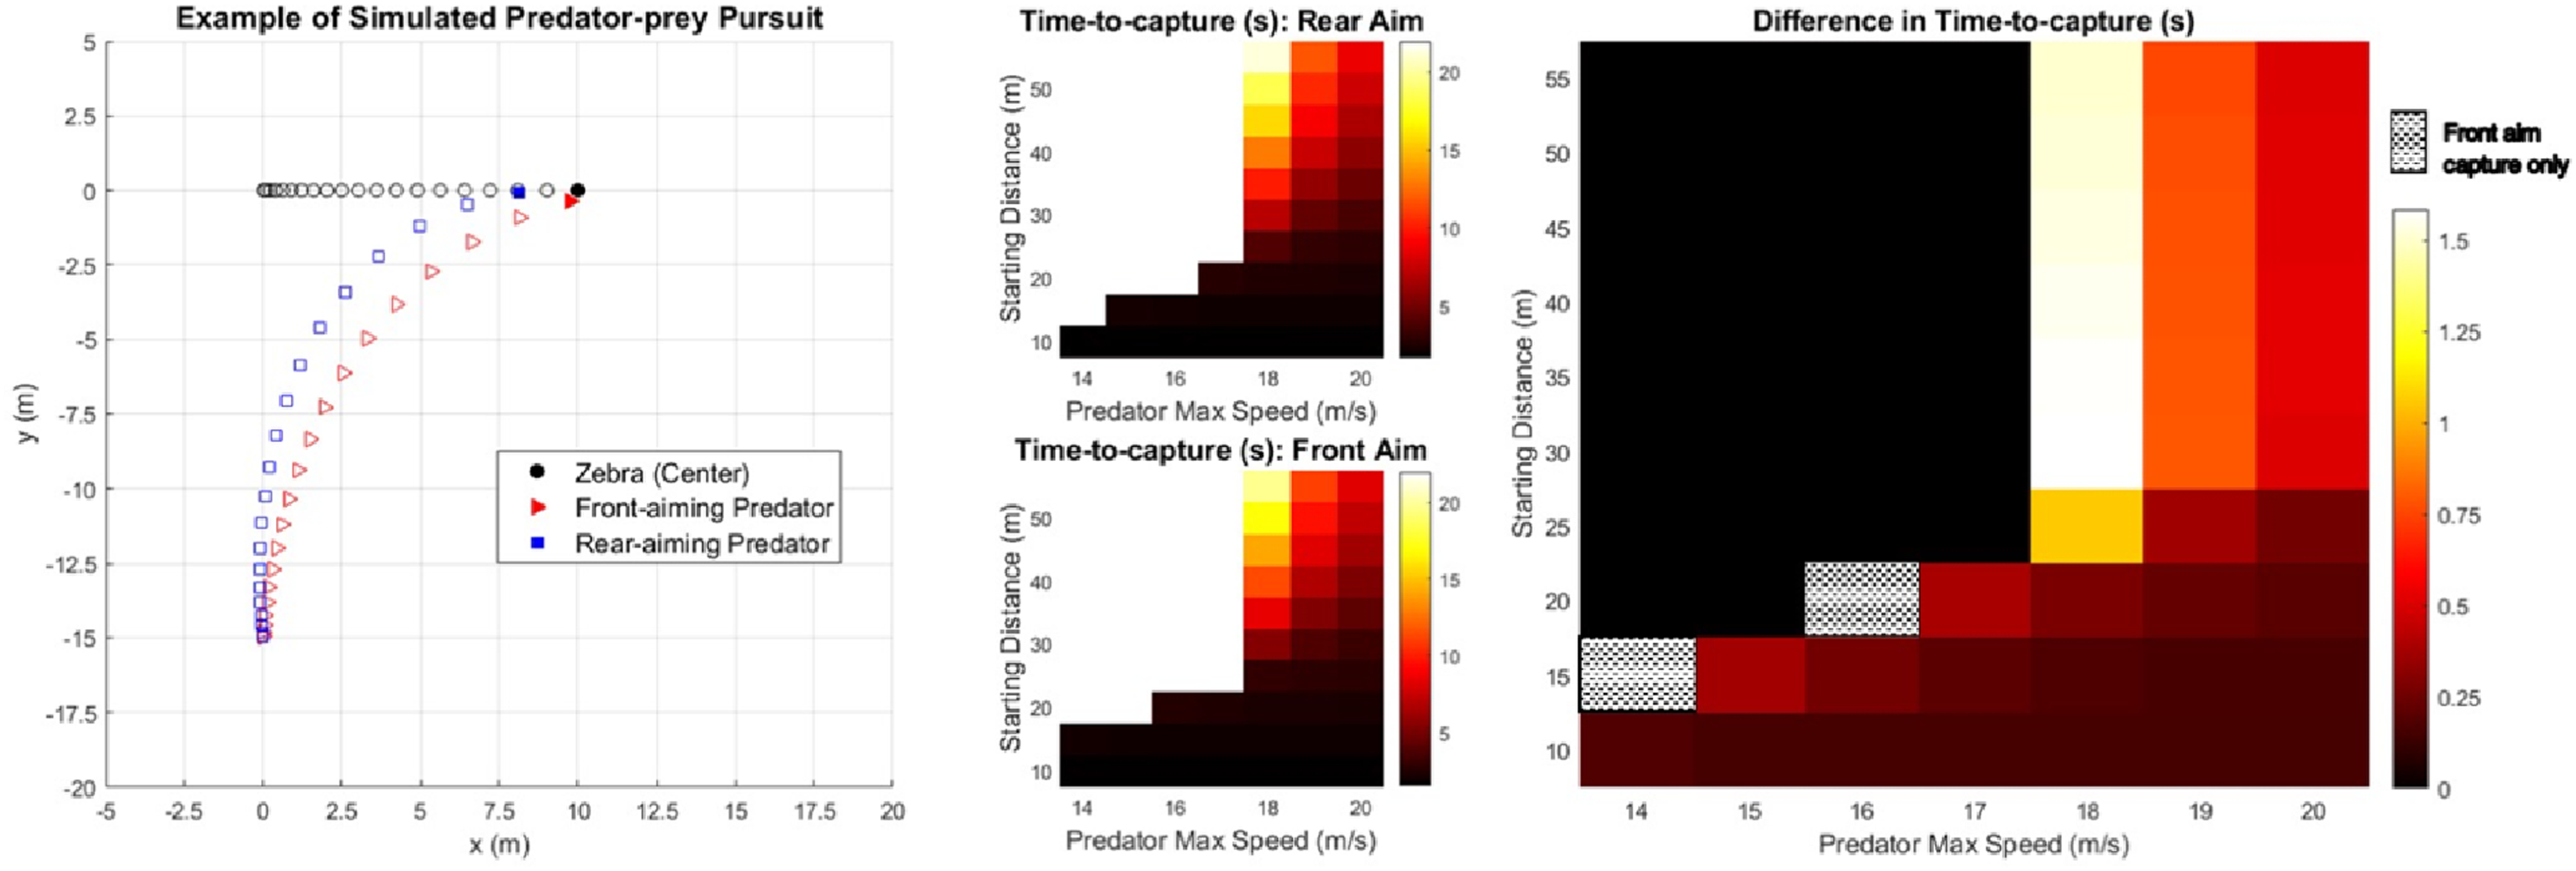
Predator-prey pursuit simulations with time-to-capture estimates for various starting distances and speeds. Left: Simulated scenario-accelerating predator tracking front or rear of zebra. Centre: Time-to-capture heatmaps for predator tracking zebra's rear or front. Right: Difference in time-to-capture when the predator tracks the zebra's rear versus front.
Conclusion
The current findings suggest that, when predators’ perception of zebras (dichromacy, limited acuity) is simulated, human observers perceive zebra rump stripes to be the most attention-capturing regions of the zebra. This will make zebras more conspicuous at a distance, including to their major predators, lions—potentially costly as there is no evidence of aposematism in that relationship. However, we highlight here a potential benefit of attention-capturing rump stripes – that driving a predator's attention to the zebra's rear may increase the chance of escape (as illustrated in our pursuit simulations).
If our view is correct, we might expect lions (and potentially, spotted hyaenas) to attack zebra's rumps (their attention being drawn to this region during hunts). Consistent with this, as Caro (2016) notes in his influential book on the topic, “Wounds on the rump, haunch, and tail vs. other parts of the body were greater in number for zebras than other species—i.e., giraffe, buffalo, and impala combined,” noting similar patterns versus waterbuck and topi. That is, zebras’ disproportionate rump wounding is much greater than expected, even relative to prey with horns. Further evidence consistent with an anti-predator role is that, across species, rump stripes co-vary with estimated hyaena threat (Caro et al., 2014), though they are only a secondary predator. No relationship with lion threat has yet been discovered regarding any aspect of stripe patterning, but an absence of simple, linear correlation cannot provide evidence against lion influences. Differences in typical group size, habitat and parasite burden may all interact with predator threats to shape these characteristics. Grévy's zebras’ lack of salient rump stripes and Burchell's zebras shadow stripes may reflect such interactions, but we forego speculation here as to what those interactions might be, as our data cannot speak to them.
In this brief report, our two experiments provided initial evidence from human observers that rump stripes in most zebras (mountain zebras and most subspecies of plains zebras) drive attention to the rear of the animal. This does not yet show that predators’ attention is effectively driven to the animal's rear during pursuit by predators and that this minimises the probability of prey-capture. Indeed, it is not clear how this might be explored. Observation of lions hunting zebras with high-fidelity head-direction estimation from multiple cameras might provide one possible route, but more feasibly (if with reduced ecological validity) experiments with lions in captivity (or other, domesticated species) and striped objects may provide further evidence for the general principle that salient stripes attract attention sufficiently to influence pursuit by predators.
We are also not yet in a position to inform speculation on the evolutionary history of zebra stripes with respect to rump stripes. It seems likely that stripes’ original benefits reflected pressures from biting-flies, not predators (Caro, 2016). However, our new findings suggest that rump stripe variation may then have emerged, perhaps via timing variation during embryogenesis (Bard, 1977) shaped by pressures from predation. Future research may help to elucidate these possibilities.
Footnotes
Acknowledgments
We thank Alexandra Woolgar, Rebecca Smith, Kayleigh Paske, and Daniele Campello of the University of Cambridge for assistance in sourcing images. AM and MGP contributed equally to experimental design, stimulus preparation, data collection, computational modelling, pursuit modelling, statistical analysis, and manuscript preparation. GD conceived of the project and contributed to experimental design and manuscript preparation.
Author Contribution(s)
Funding
The authors received no financial support for the research, authorship, and/or publication of this article.
Declaration of Conflicting Interests
The authors declared no potential conflicts of interest with respect to the research, authorship, and/or publication of this article.