
Abstract
Electrotactile stimulation is a çmethod of activating the tactile system by bypassing cutaneous mechanoreceptors and exciting the cutaneous afferent endings directly. This method is of interest for its potential in wearable tactile augmentation technologies. The generation of meaningful electrotactile sensation could benefit cases of peripheral neuropathy or prosthesis. There are limitations in our understanding of an electrotactile stimulations’ capacity to represent tactile sensibilities, and its susceptibility to missense. The spatiotemporal parameters of an electrotactile sequence were varied. The present work extends the assessment of subjective evaluations of localization, velocity, and descriptive qualities. We applied electrotactile pulses at three sites on the foot sole, using three patterns across these sites: toward the heel or toes. We tested at three interstimulus intervals (100 ms, 160 ms, 220 ms). Faster sequences produced higher velocity ratings. Sequence direction across the foot sole impacted velocity ratings—with heel-to-toe sequences demonstrating a higher velocity rating than toe-to-heel sequences. During faster sequences with site repetition, cutaneous saltation is likely causing missense during localization. The spatiotemporal missense did not impact velocity ratings. This indicates that certain aspects of electrotactile sequence perception, such as velocity, are preserved through tactile illusions. These findings may be used to increase the resolution of stimulating grids.
Keywords
Skin provides critical information to sense our environment and move safely within it. There are four classes of low threshold cutaneous mechanoreceptors in the glabrous skin of the foot sole, which are categorized based on their response to stimuli and their receptive field properties, and provide information on stretch, contact, pressure and slip (Johnson, 2001; Kennedy & Inglis, 2002; Macefield, 1998). These cutaneous receptors are distributed uniquely throughout the glabrous skin of the foot, with increasing density toward the toes and lateral arch, to maximally provide information in standing balance and movement control (Strzalkowski et al., 2018). Feedback from these skin receptors modulates postural reflexes, standing balance, and the control of gait, leading to efficient and safe movement control (Howe et al., 2015; Nakajima et al., 2006; Strzalkowski et al., 2015; Zehr et al., 2014).
Impairment of skin sensitivity develops naturally with age and is associated with decreases in reflex generation and increased falls risk (Lord et al., 1994; Peters et al., 2016). Skin sensitivity is also reduced in peripheral neuropathy, common in diabetes (Deshpande et al., 2008; Perry, 2006; Peters et al., 2016; Yang et al., 2022). Peripheral neuropathy related to diabetes presents a growing problem. Approximately 60% to 70% of diabetes patients report nervous system damage, and severe cases may result in amputation and the need for prosthetic use (National Diabetes Fact Sheet: National Estimates and General Information on Diabetes and Prediabetes in the United States 2011, 2011). These impacts on public health and personal well-being highlight the importance of compensating for sensory impairments and the consequent injury or damage. Previous research has shown that vibrating insoles and other lower limb haptic devices that enhance skin feedback improves balance in older adults and individuals with diabetic neuropathy (Costa et al., 2007; Hijmans et al., 2008; Priplata et al., 2003; Zwaferink et al., 2020). Interventions like these vibratory insoles can be considered sensory augmentation: sensory stimulation to enhance or restore performance of that same sensory system and locale. Sensory augmentation of the tactile system can enhance or restore the ability to detect and utilize information—which may be lost or decreased due to peripheral neuropathy, age related impairment, or amputation. As such, foot-tactile sensory augmentation provided by vibrating insoles may reduce the severity of neuropathy (Hijmans et al., 2008; Huang et al., 2006; Priplata et al., 2003).
Electrotactile stimulation has also shown promise as a mode of sensory augmentation, but there are many complexities in translating it to regular application. Previous works have primarily focused on enhancing perception during the use of an upper limb prosthetic or a surgical tool (Schweisfurth et al., 2016; Yoshimoto et al., 2016), with less attention for using electrotactile stimulation in the lower limb for augmenting balance control. One key challenge in electrotactile stimulation is the variability in sensitivity between individuals, which creates very broad range of tactile experiences from sensations presented in this manner (Zhou et al., 2022). Electrotactile bypasses the mechanoreceptor to directly activate the nerve fiber, thereby avoiding physical filtering or differential response from the receptor populations (Chouvardas et al., 2008). This lack of specificity in activation makes it difficult to generate and manipulate electrotactile stimulation for the purpose of sensory augmentation, since it is not known if specific percepts can be achieved.
Our sense of the environment through touch relies on the integration of many different mechanoreceptor types, which somehow combine to form sensibilities such as texture and contours of contacted surfaces. Whether and exactly how these complex sensations can be replicated by varying the parameters of electrical stimulation is just beginning to be explored. Even in modern use of presenting electrotactile stimulations as a means of investigating the ability to present “real” experiences, researchers typically rely on comparison or reference to the desired stimulus. One recent example of electrotactile rendering is Lin et al.'s (2022) work wherein a high-density electrode grid was used to present lettering and texture stimuli. While success was displayed in both lettering and texture presentations, it is worth noting that electrotactile texture simulations were driven by participant comparison to a veridical texture presentation on the opposite fingertip (Lin et al., 2022). It is still unclear what the signalling capacity of an electrotactile texture simulation would be in an unstructured presentation of stimulus—that is—an independent perceptual trial that does not rely on comparison or reference to previously gathered relation of a simulated electrotactile stimulus to a veridical texture stimulus.
Regardless of the potential signalling capacity, for an electrotactile stimulator, it appears that a unit-grid is the favored arrangement of signalling nodes. This is thought to be due to a common desire in augmentation research to maximize spatial resolution while limiting the physical footprint of a device (Chouvardas et al., 2008; Lin et al., 2022; Zhou et al., 2022). However, when using a unit-grid, the accuracy and reliability of electrotactile localization is unknown (Tong et al., 2016; Zhou et al., 2022). Researchers have identified that in cases of poor localization, cutaneous saltation may influence the accurate perception of successive “taps” or “pulses” in a presented sequence—which are present in many electrotactile designs (Kilgard & Merzenich, 1995). Furthermore, researchers have demonstrated that the subjective measurement of velocities across the skin and the localization of tactile stimulation are largely intertwined (Nguyen et al., 2015). This is due to a combination of perceptual illusions and biases influencing the perception of the spatiotemporal event. In tactile research, the localization of presented sequences is still vulnerable to missense and the influence of tactile illusions. For example, Nguyen et al. (2015) utilized physical taps, fully benefiting from both slowly and rapidly adapting mechanoreceptors being activated in “natural” proportions and still demonstrated cutaneous saltation and motion bias influencing perception. It is possible that both velocity detection and localization could be negatively impacted in electrotactile activation—which would increase susceptibility to both missense and illusion.
The aim of this work is to contribute to understanding the perceptual properties (i.e., sequence velocity, description of stimulus quality, naturalness, and location) of electrotactile stimulation in the glabrous skin of the foot. We have selected the foot sole as our body part of interest and site of stimulation due to its importance in balance and proprioception. The use of electrotactile stimulation as our mode of activation is due to its scalability and versatility, which are found in the ability to easily increase stimulation intensity and present stimulation sequences that may not be possible using traditional vibration. For this reason, we aim to evaluate the suitability of electrotactile stimulation in the communication of an important aspect of both perception and proprioception—sequence velocity. Focusing on the capacity of the tactile system to interpret electrotactile sequences that differ spatially and temporally will allow us to evaluate and cater uniquely perceived velocity experiences. An understanding of perception of these electrotactile stimuli will allow researchers to develop stimuli capable of representing a wider breadth of spatiotemporal scenarios such as, brushing, slipping, and movement across the skin.
To this aim we presented different sequences of spatiotemporal electrotactile stimulation to induce a sense of stimulation velocity. Sequences were presented on a 1 × 3 electrode grid on the foot sole at different sequential rates to evaluate the capacity of individuals to detect perceptual properties. It is expected that in cases where we decrease the total time of the electrotactile sequence, subjective ratings of sequence velocity will increase. It is also expected that the direction of the sequence will influence the rating of sequence velocity, due to familiarity with the stimulated direction (i.e., Heel-to-Toe activation during gait), whereby the heel to toe direction will be perceived as having a higher velocity. Furthermore, it is expected that missense of localization due to cutaneous saltation may occur in conditions that contain rapid repetition of stimulation at the same site. In the cases of missense due to saltation, it is expected that the rating of velocity and other perceptual qualities may be impacted. Finally, we expect that other perceptual qualities, as indicated through descriptors (i.e., buzz, tickle, shock, etc.), will change due to the stimulus parameters, however, the previous explorations of electrotactile perception are too varied and inconsistent for us to develop any specific hypotheses.
Methods
Participant Details
A total of nineteen healthy young participants (25.2 ± 3.95) with no history of a clinically diagnosed sensory loss of the lower extremity, provided informed, written consent to participate in the study. All procedures performed were in accordance with the ethical standards of the University of Guelph's Research Ethics Board and with the 1964 Helsinki Declaration and its later amendments.
Participant Setup
The average protocol took approximately 120 minutes (with 20 minutes for setup and 100 minutes of data collection). To begin, participants were seated in a standard office chair at an adjustable desk and had access to a laptop and mouse. Participants filled out a small demographic form to indicate age, height, weight, footedness, and shoe size whilst an experimenter measured and placed surface electrodes (Ambu® BlueSensor N, Ambu®, Ballerup, Denmark) at three sites on the right foot sole (see Figure 1a). Two electrodes were placed with a 2-cm interelectrode distance at each site, within a standardized stimulation area determined by anatomical markers of the individual's foot sole. Specifically, the longitudinal stimulation area was determined by measuring the distance from the most posterior edge of the heel fat pad to the most distal edge of the 5th metatarsal. Site 3's electrodes were placed at the lateral border of the foot at the most distal location in the stimulation area. The electrodes for Site 2 were centered at 50% of the length of the stimulation area on the lateral border. Electrodes at Site 1 were placed on the most proximal edge of the stimulation area, while remaining on the plantar surface of the heel. For communication with the subjects, Site 1 is referred to as Bottom, Site 2 as Middle, and Site 3 as Top.
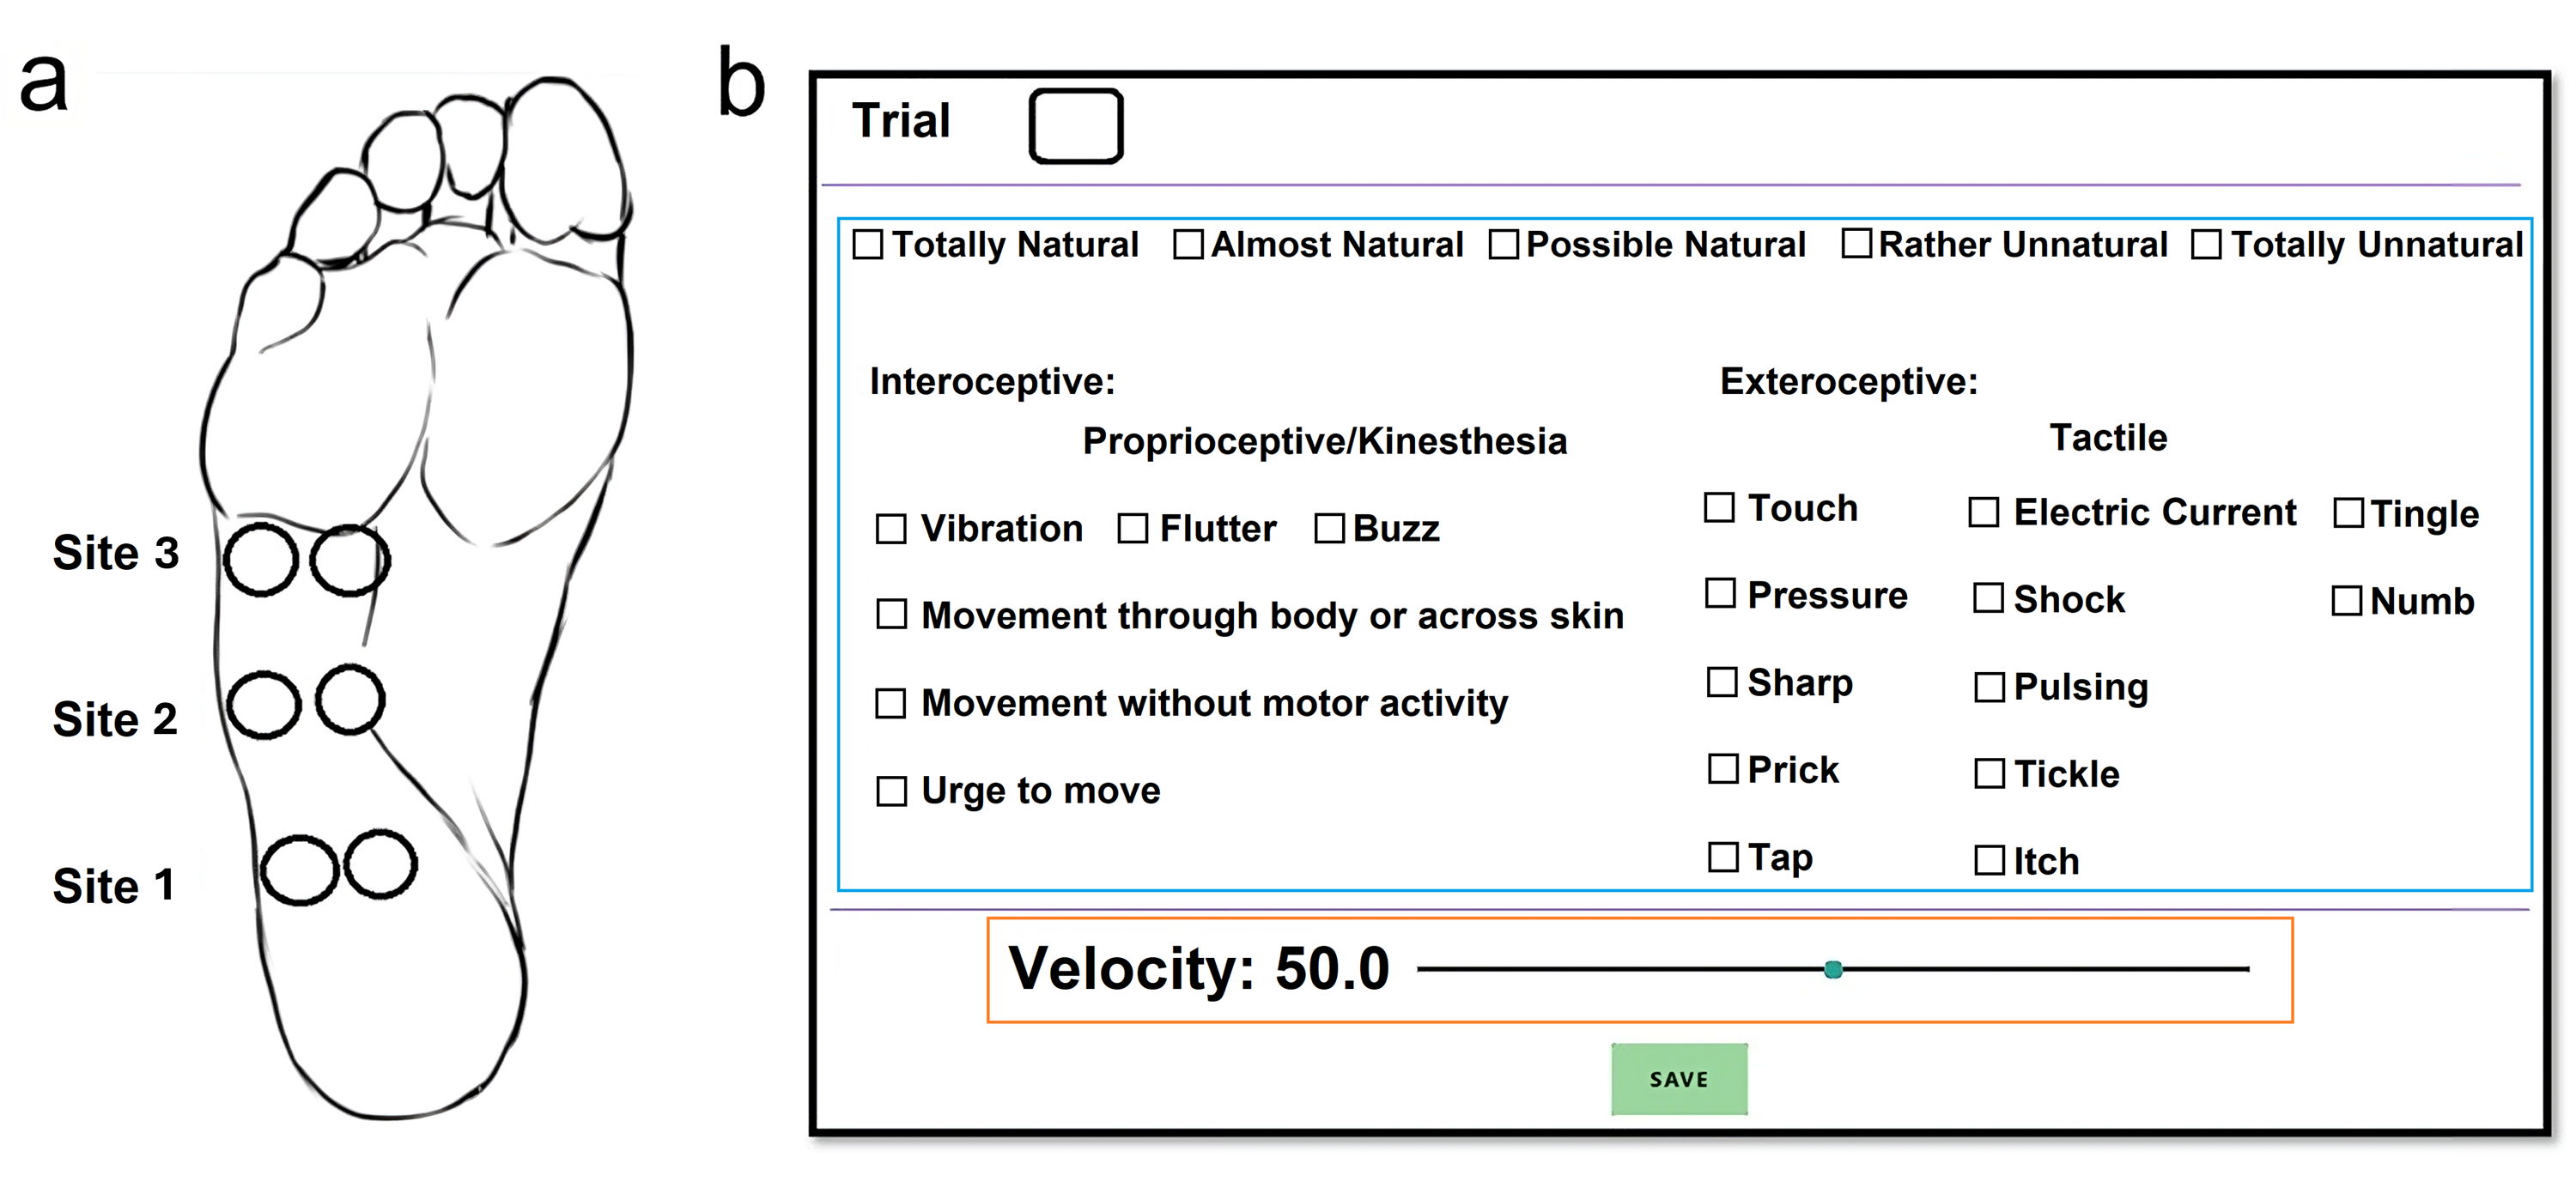
(a) Electrode placement across three sites on the foot sole. Site 3 is referred to as top, Site 2, as middle, Site 1 as bottom (b) Quality word bank and Visual Analogue Scale (VAS) or Velocity ratings. During quality evaluation trials, participants were instructed to select words from the word bank as they felt it applied to the presented stimuli. During velocity and naturalness trials, participants were instructed to rate the velocity of the sequence using the VAS and select the naturalness rating they feel most applied to the stimuli. For all trials, participants also verbally indicated at which site(s) they perceived each pulse in the sequence.
Electrical Stimulation
Electrical stimulation was delivered through a constant current high voltage stimulator (DS7AH, Digitimer limited, Welwyn Garden City, UK) with a pulse width of 200 μs and a maximum voltage range of 0 to 200 V. Stimulation was directed through a digital electrode switch (Digitimer D188 Remote Electrode Selector), which enabled stimuli to be delivered to the appropriate electrode pair for the desired sequence. Both the stimulator and the switch were controlled using Spike 2 software through a CED1401 Data Acquisition System (Power 1401, Cambridge Electronics design, Cambridge, UK).
Threshold of Detection for the electrical stimulus is measured at each of the three sites independently using a method of limits. Briefly, the method of limits uses subsequent presentations of the stimulus with small increases and decreases in stimulus magnitude to home in on the smallest magnitude the individual can reliably detect. The site with the highest Threshold of Detection value was then used as the participant's overall Perceptual Threshold for the purpose of calculating a stimulus level of 3 × Perceptual Threshold. Due to individual neurophysiological and biological differences, minor adjustments to interelectrode spacing were made to ensure the participant could feel the 3 distinct locations at a similar intensity.
Participants were only instructed that each pulse would either begin at the Bottom site or the Top site and that each sequence contains exactly 3 pulses. No additional information was provided on the sequence or expectations for verbal or recorded responses. Throughout testing, attention was only directed to the foot sole as opposed to a specific site on the foot sole.
Motion Control Trials
To evaluate the electrotactile sequence's susceptibility to missense, a subset of participants (n = 9) underwent 5 motion control blocks. These motion control blocks aim to identify the presence and source of missense experienced by the participants by comparing different electrotactile patterns. The 3 patterns presented during these blocks were named based on either their direction or the intended source of missense: Heel-to-Toe (Sites 1-2-3), Cutaneous Rabbit Effect (CRE) (Sites 1-1-3) and Motion Bias (MB) (Sites 1-3-3). The ISIs were 160 ms, 500 ms, and 1000 ms. The different ISIs were developed based on reference to previous work in the upper limb by Eimer (2005) and observations during piloting testing. These ISIs were selected to provide the spatial patterns with different temporal resolutions and alter the likelihood of missense being experienced. It was expected that 500 ms and 1000 ms ISIs would provide enough temporal spacing between pulses that participants should correctly distinguish the Heel-to-Toe, CRE, and MB patterns correctly (Flach & Haggard 2006). Additionally, it was expected that in the 160 ms ISI condition, CRE and MB patterns would be more susceptible to missense than the Heel-to-Toe pattern. Each block contained 3 presentations of each permutation, totalling 27 trials per block and 162 trials total.
The purpose of these motion control trials was to evaluate the ability to generate missense sourcing from cutaneous saltation with a minimalist stimulation pattern. It is expected that at shorter ISIs, CRE pattern cause perception at Site 2 more than MB pattern. This expectation is based on the spatiotemporal properties of the CRE pattern being more likely to cause cutaneous saltation, wherein the localization of pulse positions to shift toward one another (Eimer et al., 2005; Geldard & Sherrick, 1972). If the MB pattern evokes a perception at Site 2 as often as the CRE pattern, the missense observed in the present spatiotemporal pulse sequences could be attributed primarily to expected velocity and constant motion of the train as opposed to cutaneous saltation (Jones & Huang, 1982).
Velocity and Naturalness Trials
Velocity and Naturalness trials were presented in 3 blocks of 27 randomly ordered trials (n = 10). Each trial consisted of 1 presentation of the stimulus permutation and required the participant to evaluate the perceived naturalness and velocity, as well as indicate verbally where they perceived each pulse. Each trial contained a stimulus consisting of 1 of 3 stimulus patterns (1-2-3 “Heel-to-Toe”, 3-2-1 “Toe-to-Heel”, or 1-1-3 “CRE”), which represent the site that is stimulated (Bottom-1, Middle-2, Top-3) and 1 of 3 interstimulus intervals (ISI) (100 ms, 160 ms, 220 ms) for a total of 9 trial permutations. Each of these 9 permutations were presented 3 times. The nature of each stimulation trial type was unknown to the participant to avoid any expectation bias. Data were stored using a unique code labelled 1 to 27 for each trial, to enable identification of pattern, ISI, and trial repeat.
A Visual Analogue Scale (VAS) of Velocity rating ranging from 0.0 to 99.9 was utilized by the participants to record their experienced Velocity. Velocity rating was simply described to the participants as how “fast” they felt the sequence was from start to finish. No reference or anchor was provided, and participants were free to use the VAS however they saw fit. A Likert-scale was added to evaluate the Naturalness of the sequence, which was described to participants as “similarity to experiences they might have in everyday life.”
Standardization of Velocity Scores
Based on the subjective and open-ended nature of the VAS for velocity, participant's ratings were distributed in a non-normal fashion (see Figure 2). These VAS ratings were standardized to each participant to allow for more accurate comparisons between experimental conditions (see Figure 3). As a result, the values for velocity are displayed in Z-scores, which provide information on how many standard deviations (SDs) away the value is from the mean. Negative Z-scores indicate the value is lower than the mean velocity rating, while lower Z-scores indicate the value is higher than the mean velocity rating.
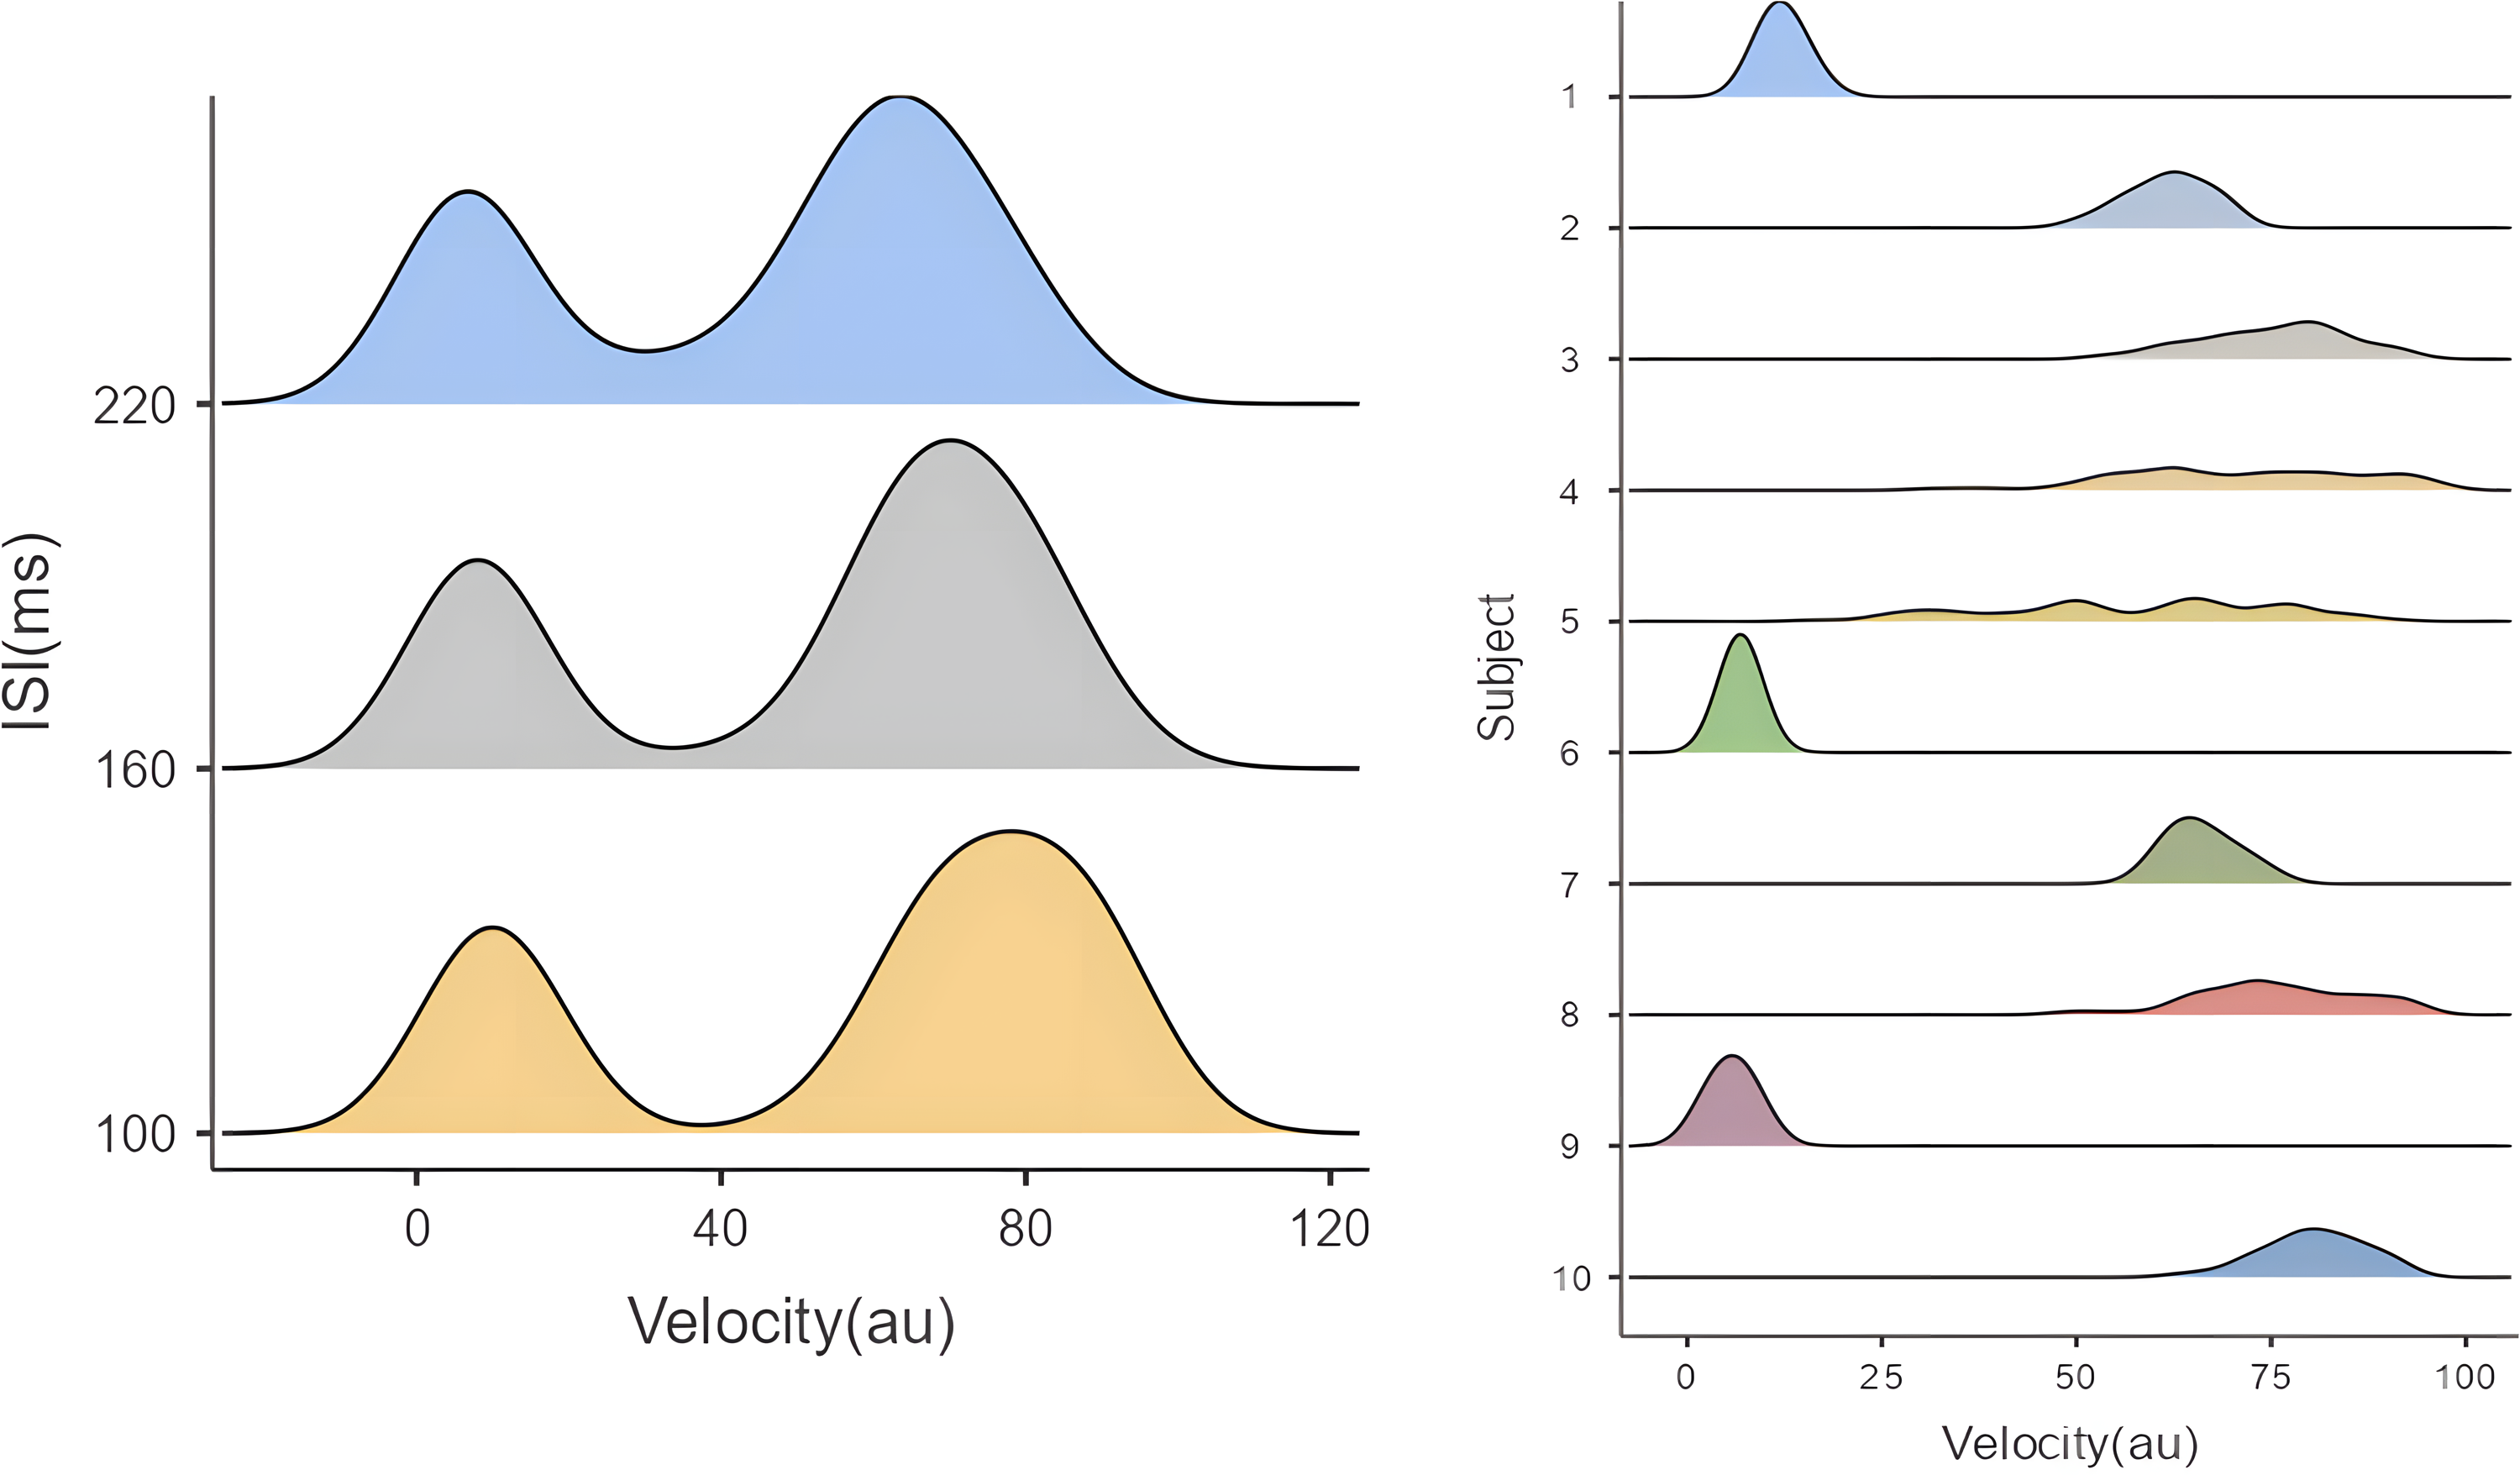
(a) Visual analog scale (VAS) velocity rating distribution across 220 ms, 160 ms, and 100 ms interstimulus intervals (ISI) (n = 10). (b) VAS Velocity rating distribution across participants. Subjects tended to utilize the VAS inconsistently, causing a binomial distribution overall, and producing variable and inconsistently anchored ratings.
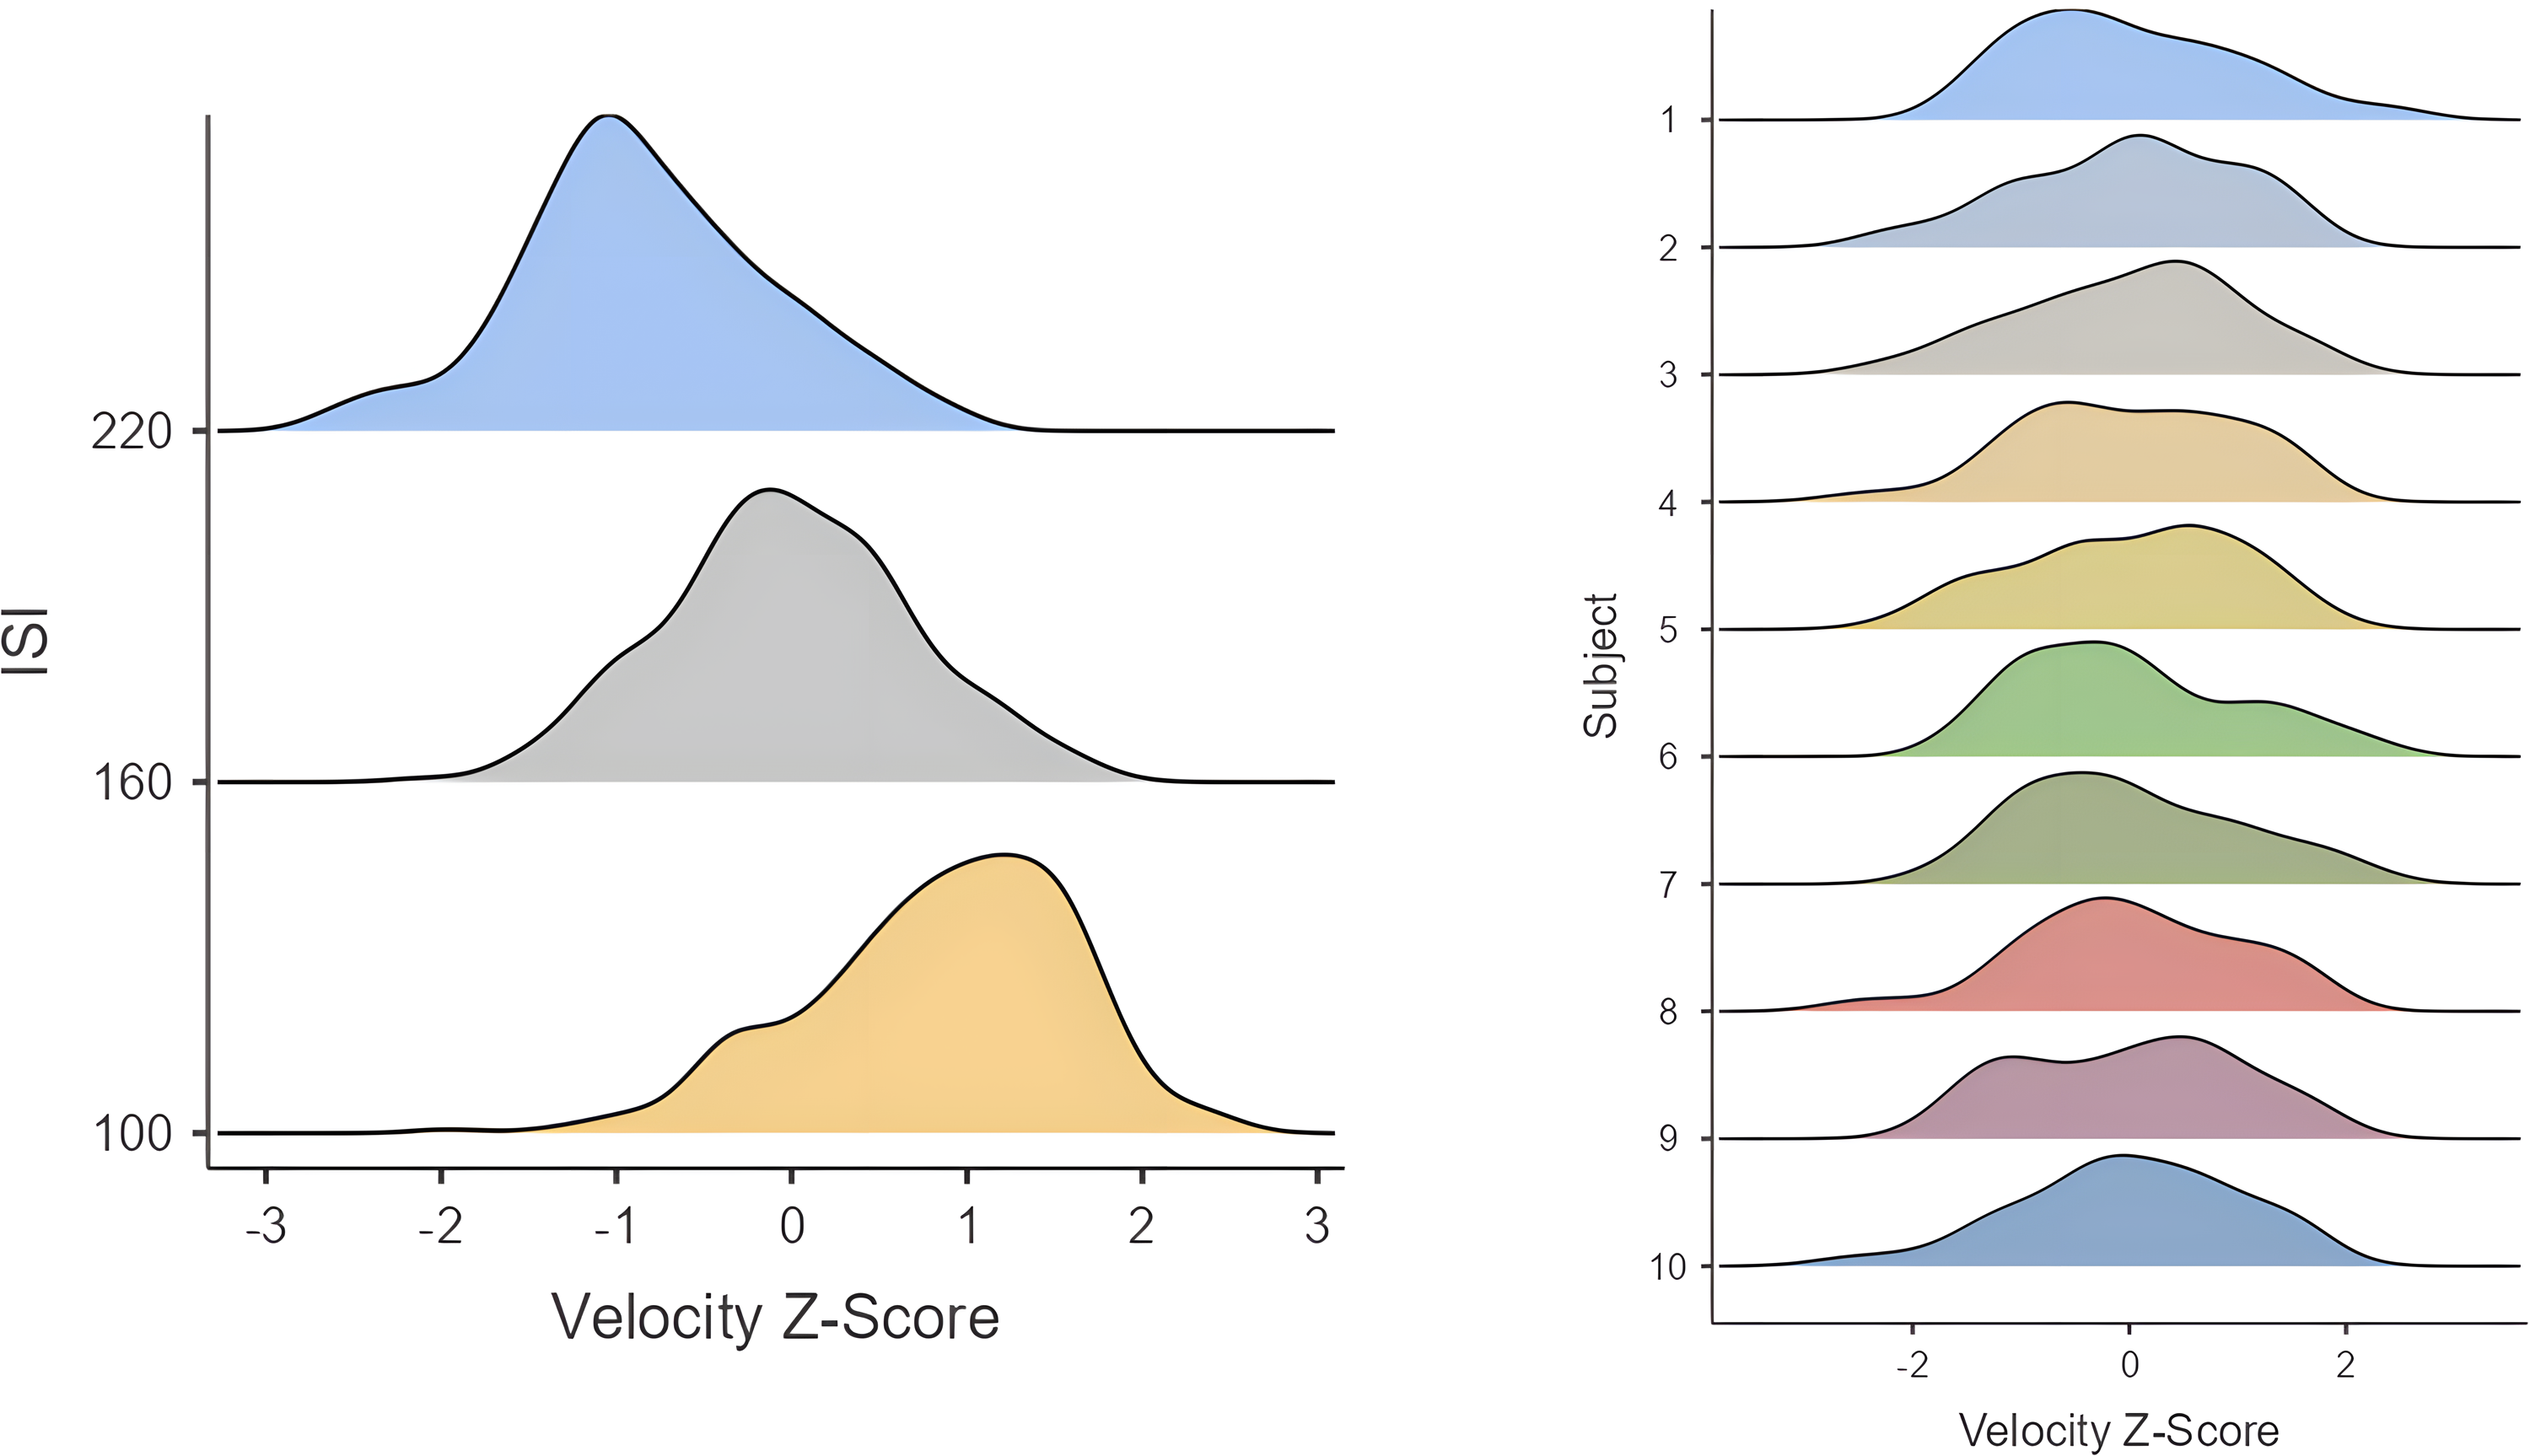
(a) Standardized velocity Z-score rating distribution across 220 ms, 160 ms, and 100 ms interstimulus interval (ISI) (n = 10), illustrating the shift in velocity Z-score across the three ISI, where 100 ms is rated faster. (b) Standardized Velocity Z-Score rating distribution across participants. Standardizing participant VAS ratings produced more normally distributed data in both the aggregate and individually. Overall, distributions appear to demonstrate deflections of the Velocity Z-score based on the ISI.
Quality Evaluation Trials
The subset of participants that completed the velocity and naturalness trials then completed a following set of 54 quality evaluation trials in 2 blocks of 27 randomly ordered trials (n = 10). These trials utilized the same stimulation permutation as the velocity and naturalness trials. Each trial allowed for the participant to “feel” the stimulus permutation 3 times within each block, this was done to ensure they were familiar with the electrotactile sequence that was being evaluated. At their own pace, participants selected all the descriptors from the quality evaluation form that they would use to describe their perception of each electrotactile sequence (see Figure 1b). The quality evaluation form that participants completed in each trial was adapted from recent somatosensory work concerned with psychometric evaluation (Kim et al., 2018). All terms used from Kim et al. (2018) were not expanded on and participants were informed to use the form as they interpreted it and as they felt it applied to the experienced sequence. Additionally, after each trial participants would verbally indicate where they experienced each pulse along their foot using the location terms bottom, middle, and top.
Data Analysis
A repeated measures analysis of variance (RM ANOVA) was conducted on the percentage of Site 2 perception in the set of Motion Control trials. A two-way 3 × 3 RM ANOVA was conducted to compare the main effects of pattern (Heel-to-Toe, Toe-to-Heel, CRE) and ISI (100, 160, 220 ms) and the interaction effect between pattern and ISI on the subjective rating of both velocity and naturalness. Where required, a Bonferroni correction was used for post-hoc comparisons. For each term in the quality evaluation form, a binary logit generalized estimating equation (GEE) was utilized with an independent correlation matrix structure, with both stimulus pattern and ISI included as predictors (Liang & Zeger, 1986; Zeger et al., 1988; Wang, 2014). When required, an LSD correction was used for post-hoc analyses for the GEEs. An alpha level of .05 was used for all statistical tests.
Power and Sample Size Justification
The G*Power 3 software (Faul et al., 2007) was used post hoc to determine the sensitivity of the design with the 9 or 10 participants in each trial condition. The main analyses of interest are the velocity × pattern × ISI and percent middle perception × pattern × ISI. Since there are no similar studies to inform our expectations, we would hope to be able to detect a small effect or larger with our present design. Sensitivity analysis was conducted for these effects at 80% power with alpha = .05. The results showed that for Motion Control trials (10 participants, nine spatiotemporal permutations, 15 repetitions), the design was sensitive to effects as small as Cohen's f = 1.69 (ηp2 = 0.064). For Velocity and Naturalness trials (9 participants, 9 spatiotemporal permutations, 9 repetitions), the design was sensitive to effects as small as Cohen's f = 1.95 (ηp2 = 0.096). In all cases, the design was able to identify small or larger effect sizes.
Results
Motion Control Trials
Sphericity was not assumed; a Greenhouse-Geisser correction was used. There was a significant interaction of Pattern and ISI on the frequency of Site 2 perception with a large effect size (F
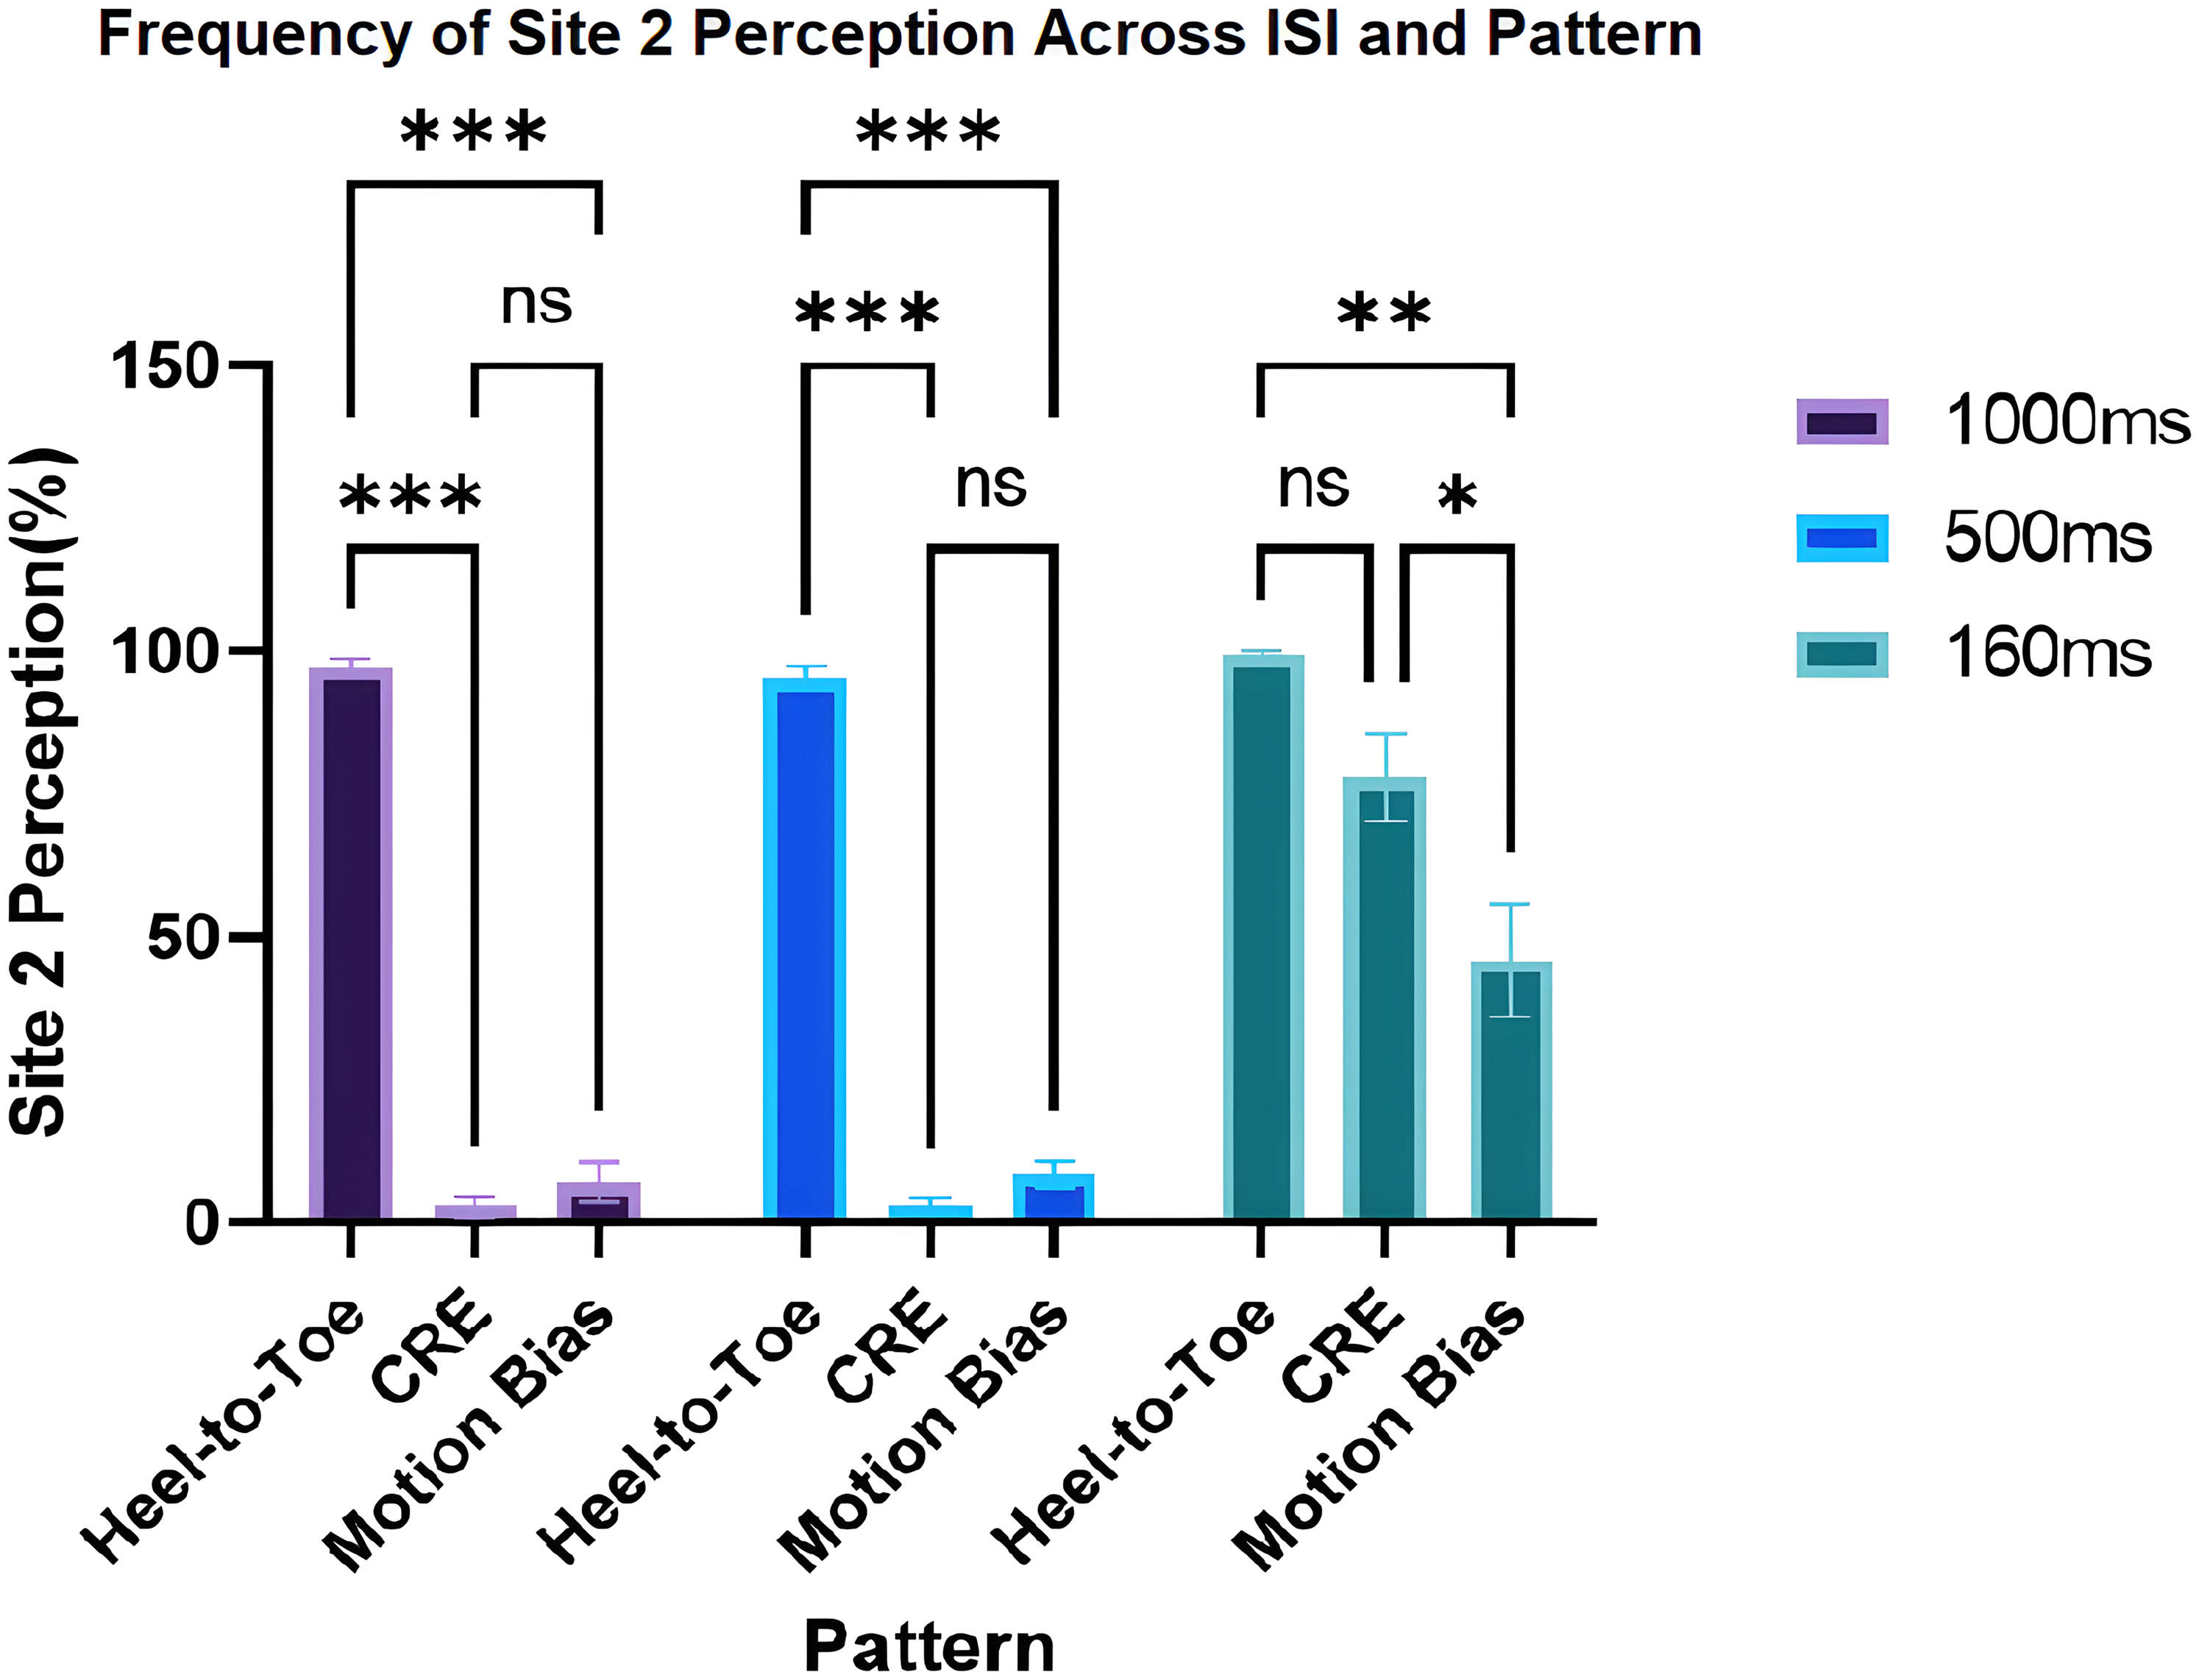
Aggregate repeated measure ANOVA percentages of Site 2 perceptions across stimulation pattern and interstimulus interval (ISI) from motion control trials (n = 9). Grouped bars from left to right represent the ISI of 1000 ms, 500 ms, and 160 ms. Patterns are labelled along the x-axis: Heel-to-Toe (Sites 1-2-3), CRE (Sites 1-1-3), and Motion Bias (1-3-3). The Heel-to-Toe condition was the only stimulus pattern that physically stimulated Site 2, other indications of Site 2 perception are considered illusory. Evidence of fewer perceptions at Site 2 at 160 ms for Motion Bias trials compared to CRE trials indicates that cutaneous saltation is occurring and causing a spatiotemporal illusion during perception. ns = not significant, *p < .05, **p < .01, ***p < .001.
Velocity
Mauchly's test of sphericity indicated no violations for Pattern (χ2 (2) = 5.75, p = .056) and ISI (χ2 (2) = 4.03, p = .133), however the Pattern × ISI required a Greenhouse-Geisser correction (χ2 (9) = 27.34, p = .002, Greenhouse-Geisser p = .484). It was indicated there was a main effect of ISI on Velocity with a large effect size (F
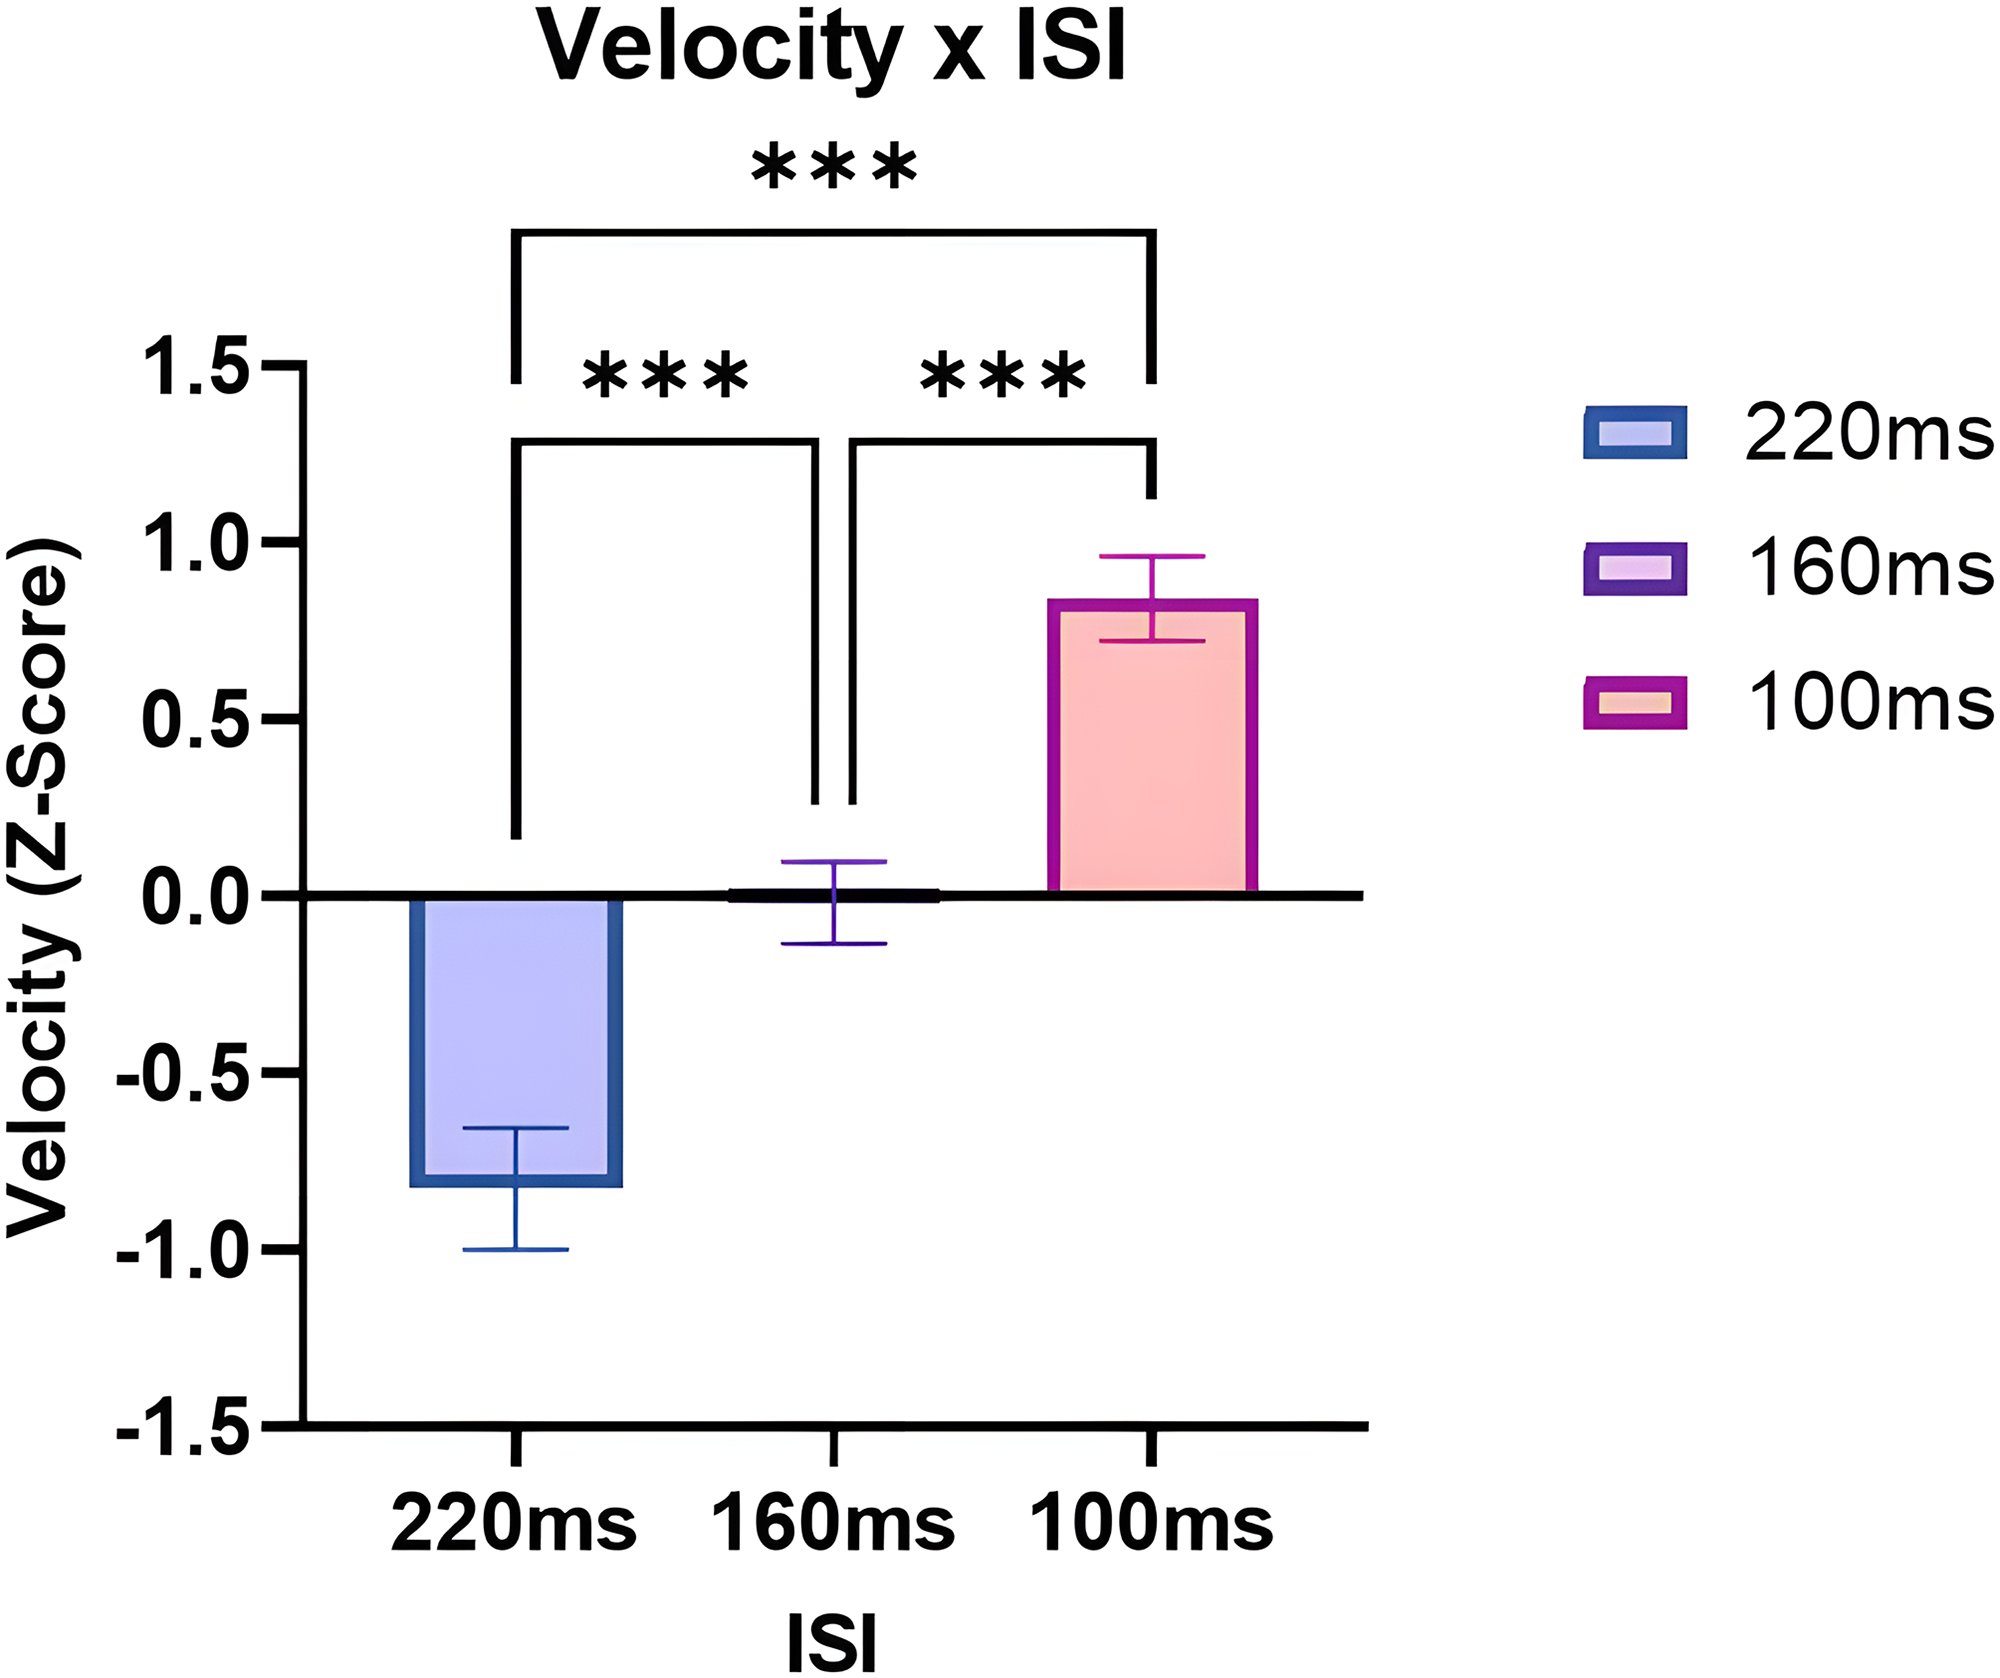
Standardized velocity Z-score across interstimulus interval (ISI) (n = 10). The ISI and the Velocity rating appear to be inversely related, with longer intervals relating to lower or slower Velocity ratings and shorter intervals relating to higher or faster Velocity ratings. ***p < .001.
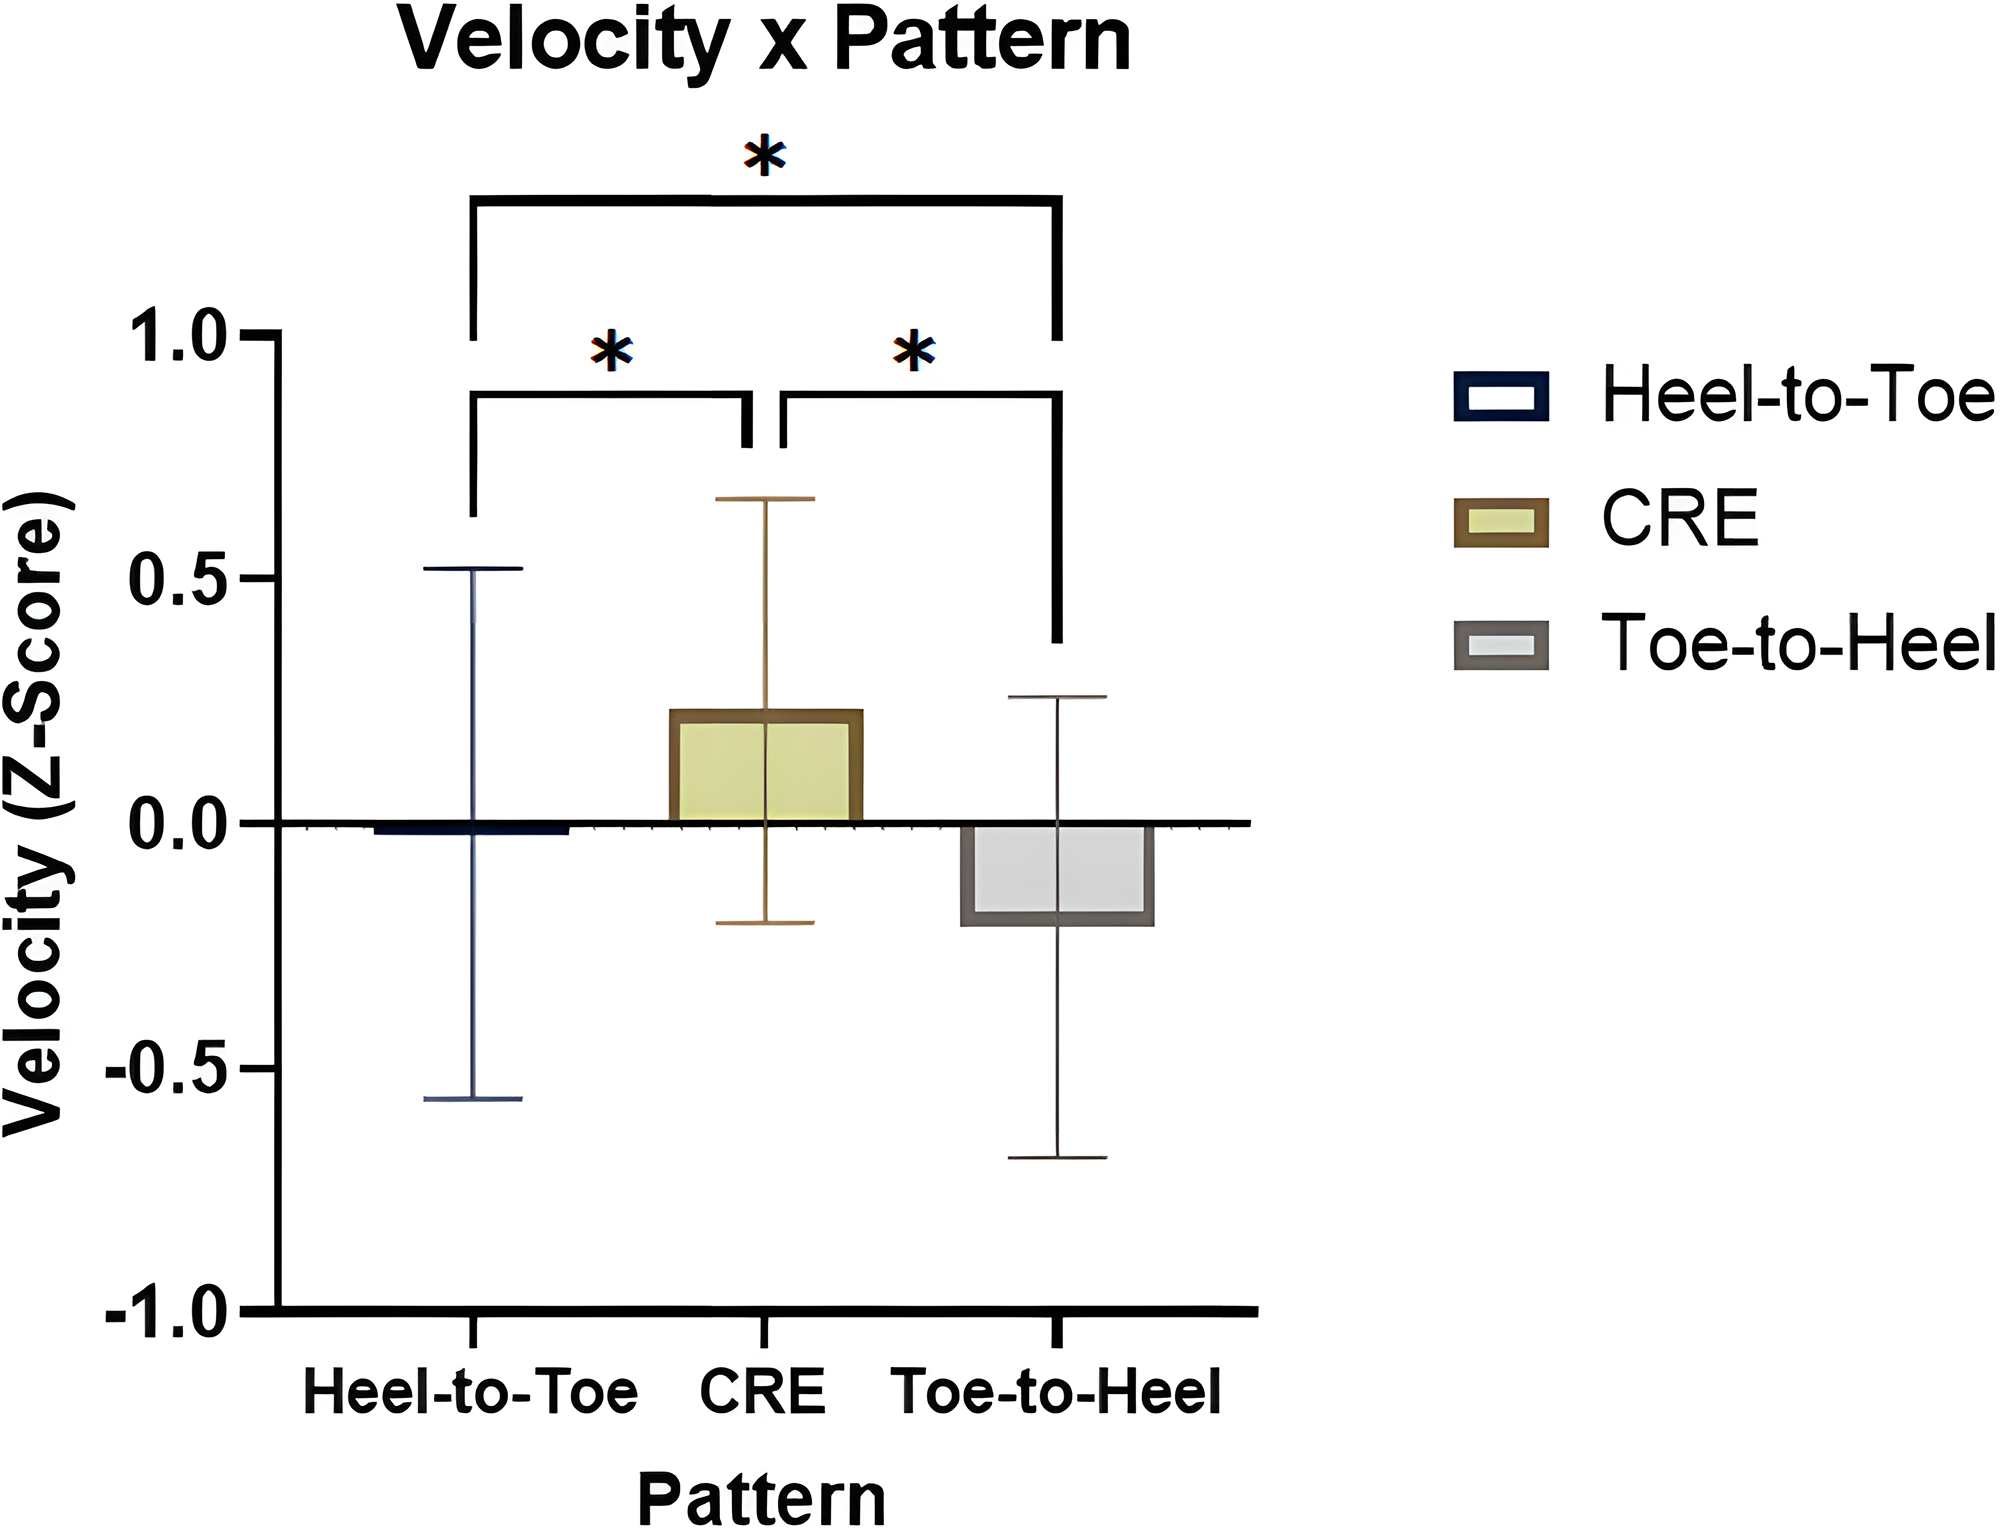
Standardized velocity Z-score across pattern (n = 10). Overall, the CRE Pattern demonstrated the greatest Velocity rating, followed by Heel-to-Toe, and finally, Toe-to-Heel. *p < .05.
Changing the pattern from Heel-to-Toe to CRE resulted in an increase of 0.25 in standardized Velocity rating for the CRE pattern across ISIs (p < .05). Changing the direction of the pattern from Heel-to-Toe to Toe-to-Heel resulted in a decrease of 0.19 (p < .05) in standardized Velocity for the Toe-to-Heel pattern. Although, no interaction was observed between Pattern and ISI on Velocity (F
ISI demonstrated significant differences between standardized Velocity ratings within each Pattern (see Figure 7). Within each Pattern, all ISIs were significantly different than one another, indicating unique velocity experiences between ISIs at the Pattern level. Furthermore, Patterns demonstrated significant differences between standardized Velocity ratings within each ISI (see Figure 8). In the 220 ms ISI condition, the CRE pattern's velocity rating were different than both the Heel-to-Toe and the Toe-to-Heel patterns, with the CRE being rated significantly faster. Within 160 ms and 100 m ISIs, Heel-to-Toe and CRE were not significantly different, indicating that Velocity ratings for these pulses were similar during the faster ISIs. Overall, these analyses indicate that the chosen stimulus parameters can measurably influence the individual's Velocity rating between 19% and 84% of their SD.
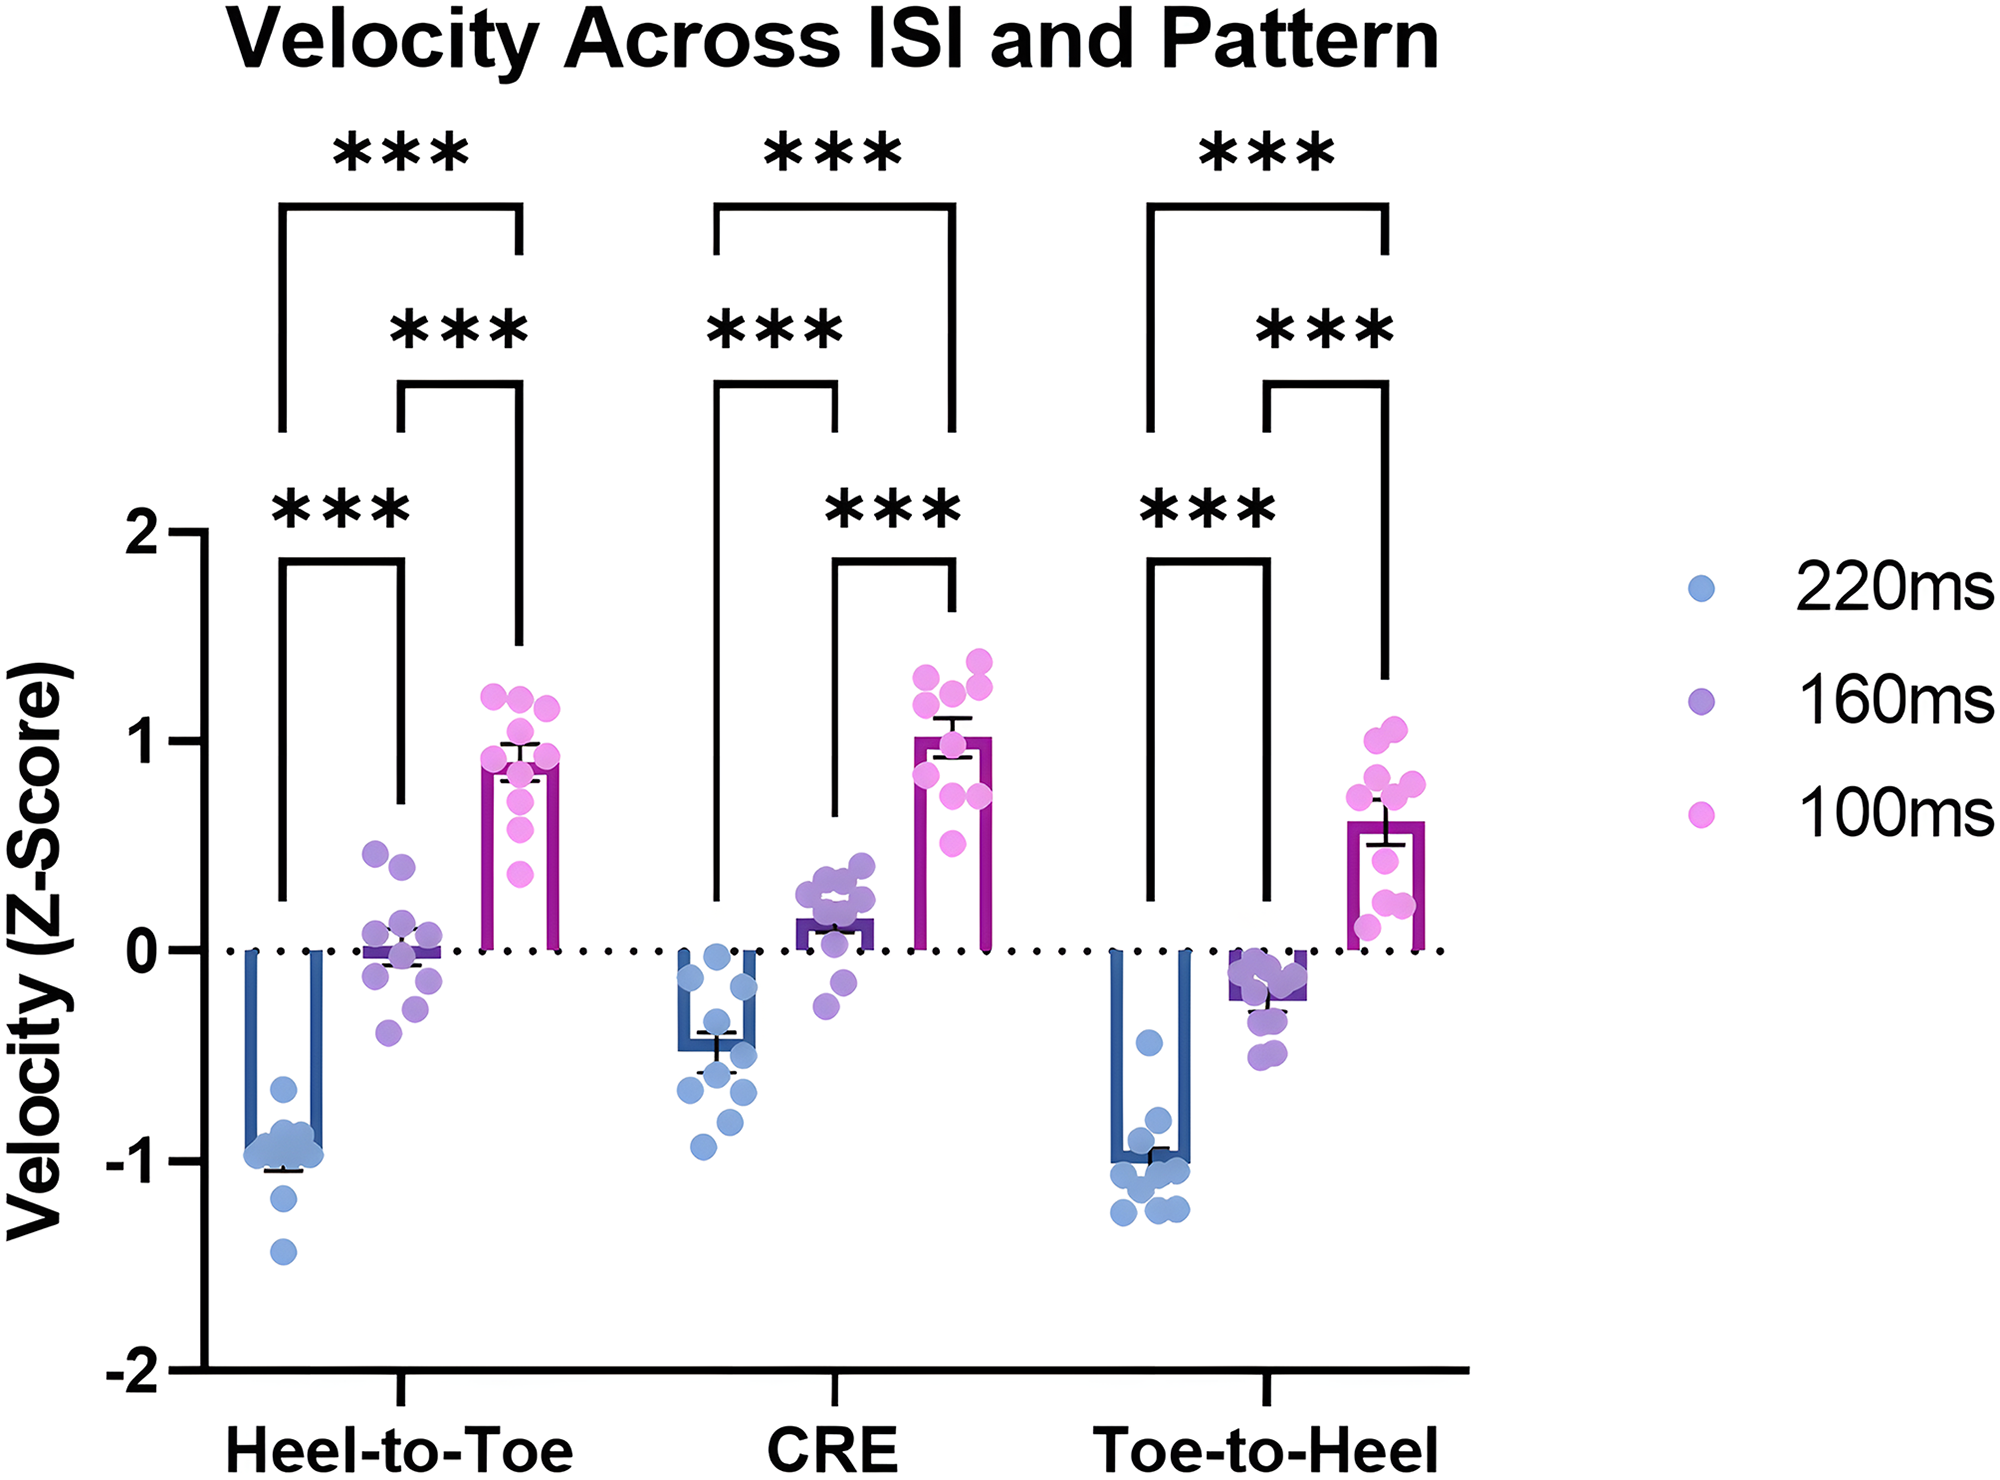
Standardized velocity Z-score across pattern and interstimulus interval (ISI), dots represent an individual's aggregate data for the condition (n = 10). Within each stimulation Pattern, bars from left to right represent 220 ms, 160 ms, 100 ms respectively. Within each stimulation Pattern the Velocity rating increases as ISI decreases. These comparisons indicate that the velocity experience at different ISIs was unique enough to be statistically significant within a single stimulation Pattern. ***p < .001.
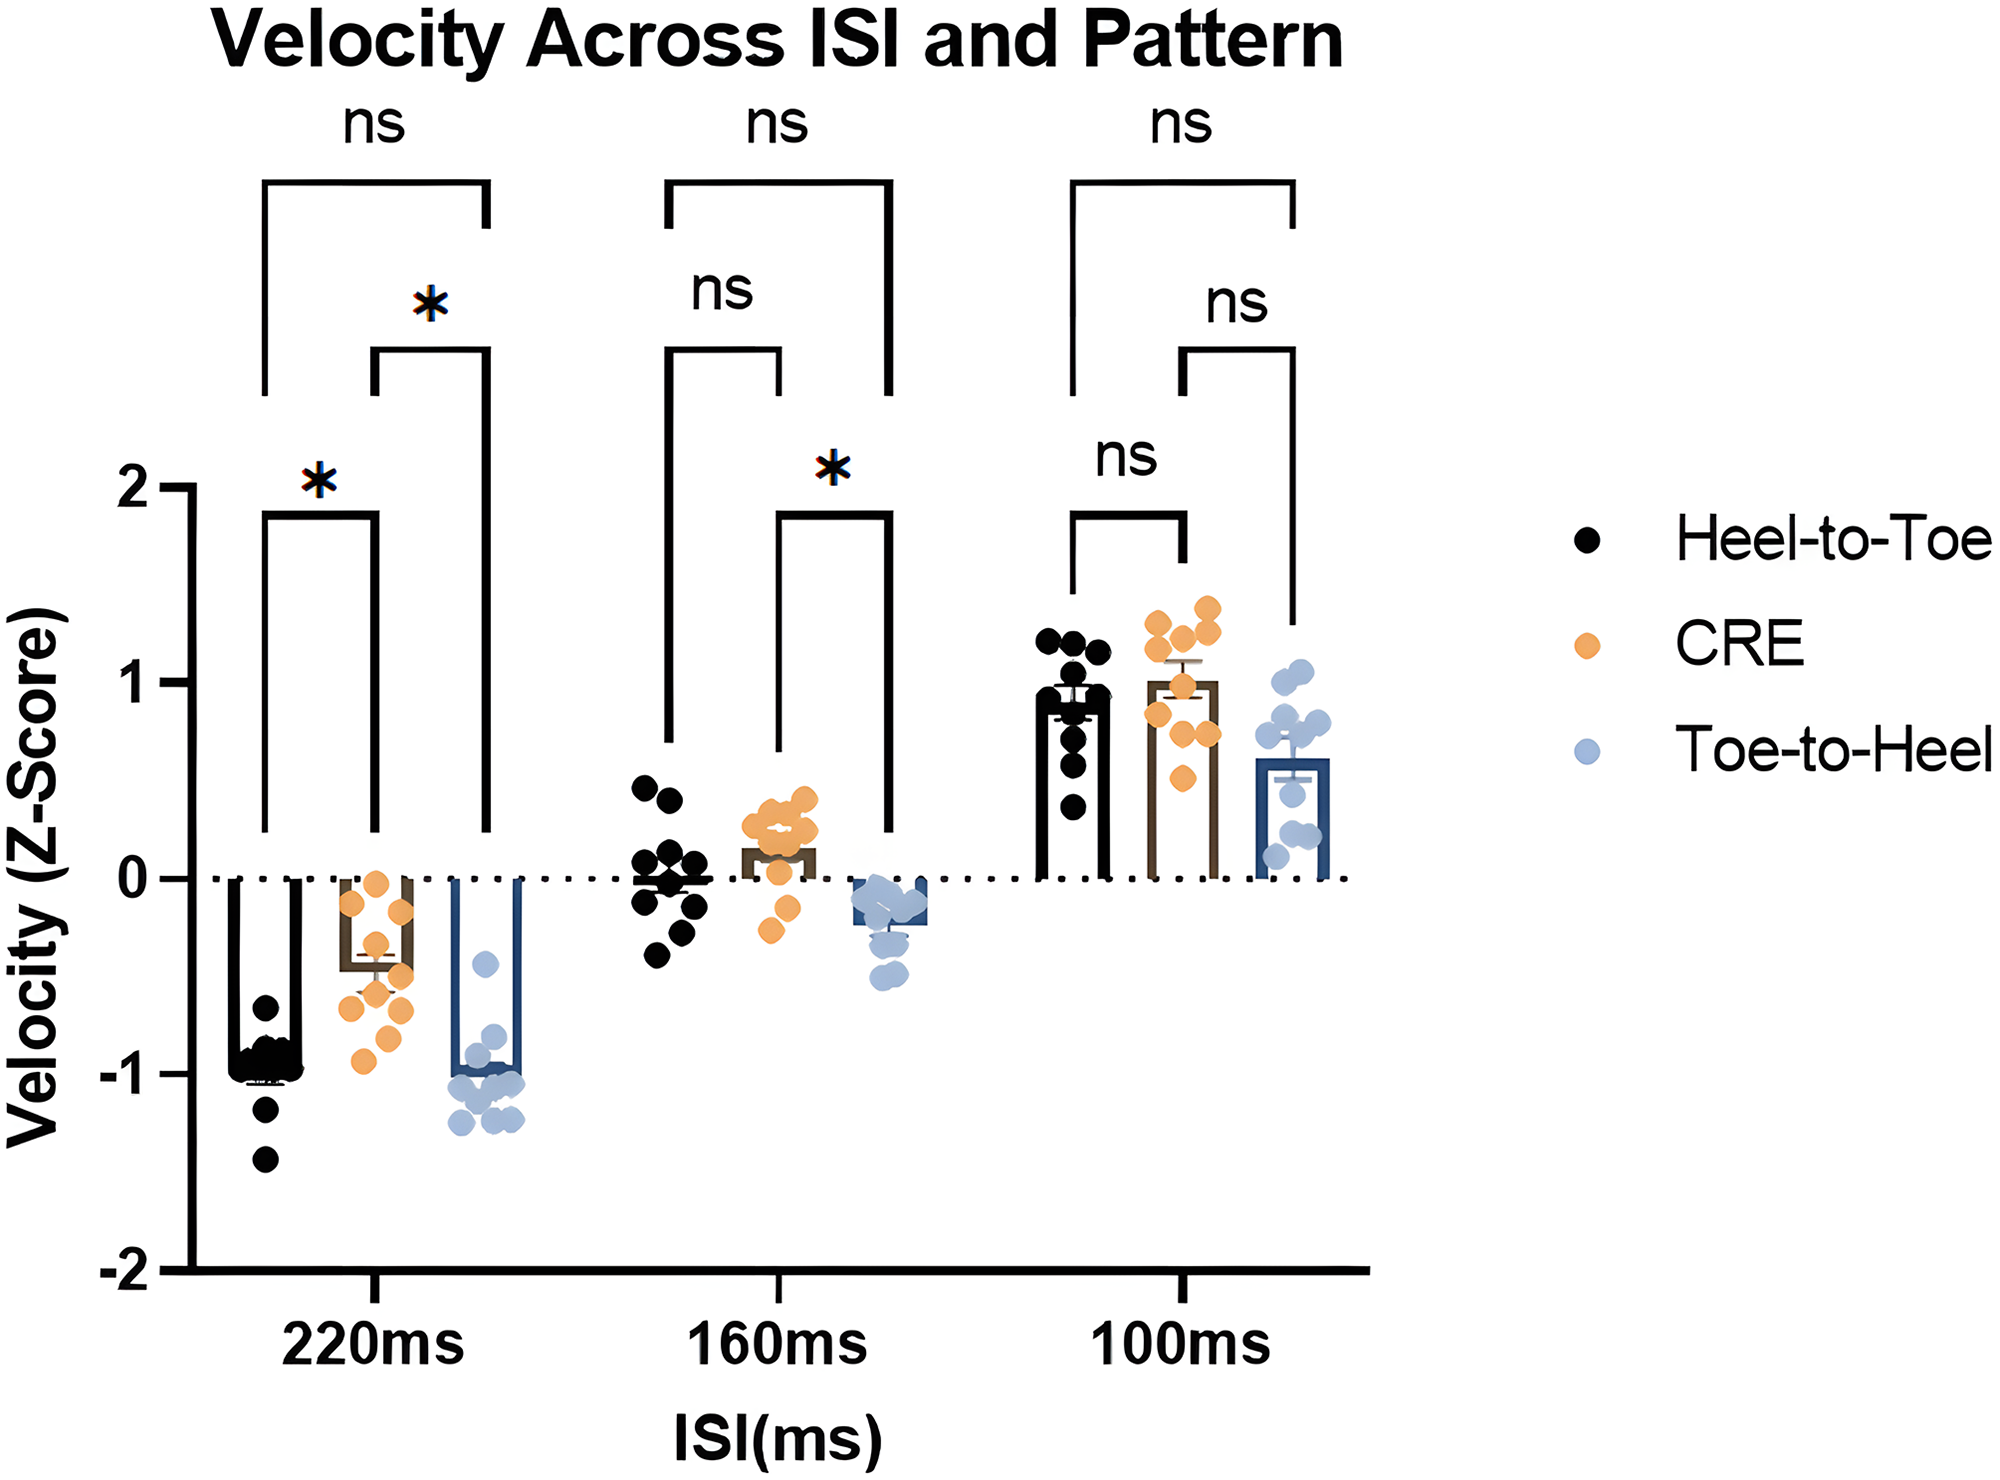
Standardized velocity Z-score across interstimulus interval (ISI), dots represent an individual's aggregate data for the condition (n = 10). Within each interstimulus interval, bars from left to right represent Heel-to-Toe, CRE and Toe-to-Heel respectively. Within the 220 ms ISI both Heel-to-Toe and Toe-to-Heel differ meaningfully from the CRE pattern. At 160 ms and 100 ms ISI, Heel-to-Toe and CRE are no longer differ significantly, indicating a similar velocity is experienced between the two patterns at these ISIs. ns = not significant, *p < .05.
Stimulus Quality Evaluation
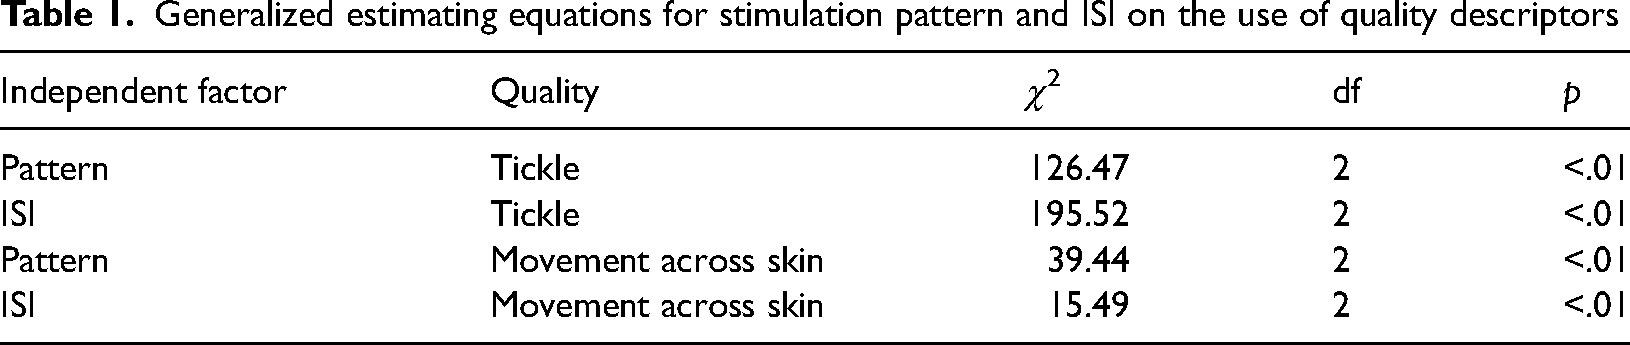
The top 5 most used descriptors selected by participants were flutter (used 50% of the time), tingle (49%), tap (48%), touch (38%) and pulse (32%). The 5 least commonly used descriptors selected by participants were urge (1%), itch (1%), movement without motor activity (1%), tickle (3%), and numb (5%). The binary GEEs conducted for descriptor selection yielded significant results for two different descriptors (see Table 1). These tests indicate which words were influenced by our stimulus parameters, regardless of the base frequency of the word's use. The CRE pattern was related to an increase in the use of “tickle” compared to both Heel-to-Toe and Toe-to-Heel patterns. The Heel-to-Toe pattern was related to an increase in the use of “movement across skin” as compared to both the CRE and Toe-to-Heel patterns. Selection of “movement across skin” and “tickle” both increased with decreasing ISI, indicating that the faster sequences were related to more clear perception of movement and “tickle”. These results indicate that some descriptors are being influenced by the stimulus parameters used in the present electrotactile sequence. Other descriptors appear to be more stable in their applicability and representativeness of the presently used electrotactile experience.
Generalized estimating equations for stimulation pattern and ISI on the use of quality descriptors
Naturalness
Mauchly's test of sphericity indicated violations for ISI (χ2 (2) = 17.09, p < .001), but not Pattern (χ2 (2) = 0.661, p = .718). Pattern × ISI also demonstrated sphericity (χ2 (9) = 14.47, p = .115). In cases of violations Greenhouse-Geisser corrections were applied. No main effects of Pattern (F2,18 = 0.99, p > .05) or ISI (F1.06,9.57 = 1.31, p > .05) on Naturalness ratings were indicated. No significant interaction of Pattern and ISI (F4,36 = 0.146, p > .05) was indicated. Overall, these results indicate that the present range of electrotactile sequences may not differ enough to impact ratings of naturalness, or that ratings of naturalness are not impacted by sequence ISI or Pattern. Alternatively, these results may indicate that the present method of measuring Naturalness rating was not effective at representing the experiences of the individual.
Discussion
Overview
We set out to investigate the impacts of stimulus ISI and Pattern on the qualitative and velocity perception of electrotactile sequences. We first examined the presence of both cutaneous saltation and expected motion bias and determined that in our reduced cutaneous rabbit paradigm the primary driver of the sensory missense was cutaneous saltation. The impacts of ISI and Pattern on VAS ratings of electrotactile sequence velocity were explored, with both variables independently affecting the Velocity rating. In quality evaluation trials, although some descriptors were used in up 50% of all trials, our ability to evaluate differences in descriptor use between the presented ISIs and Patterns appear limited. Furthermore, naturalness evaluations were not indicated to be impacted by the ISIs or Patterns used in the present work.
Motion Control Trials Indicate Cutaneous Saltation is the Source of Missense
The present work is in agreeance with other works using both electrotactile and tactile explorations of CRE and motion bias trials such as Warren et al. (2010) and Eimer et al. (2005), where they showed that shorter ISIs enables the sequence to cause illusion, which occur more frequently in CRE sequences than motion control sequences. In the motion control trials, we utilized 3 distinct patterns and ISIs across the foot sole to explore the individual's perception of a stimulus at Site 2. As expected, under slower ISI conditions of 1000 ms and 500 ms, each pulse in the CRE and Motion Bias pattern was correctly sensed. This lack of an illusory percept at Site 2 in supports the notion that the limited instructions provided to participants, in tandem with the clarity of the sensation allowed for an accurate report of the electrical stimulation pattern's location (Eimer et al., 2005; Warren et al., 2010). In contrast, results from the 160 ms ISI condition clearly indicate that the sequence length was not adequate for participants to accurately report the location of each pulse. Specifically, both the CRE and Motion Bias trial contain a large increase in Site 2 reports, with CRE causing Site 2 percepts as frequently as the Heel-to-Toe condition and more frequently than the Motion Bias.
These motion control bias trial results indicate that in the electrically evoked reduced rabbit used in the present study, the primary driver of the observed missense is cutaneous saltation as opposed to constant motion bias. This finding supports and extends upon previous explorations of tactilely evoked reduced rabbit illusion across three sites and enables us to use this as an effective model in the current study (Geldard, 1977). The evocation of the CRE using three pulses allows us to explore the interpretation of electrotactile sequences at the foot sole under minimalist conditions with each pulse being equally spatiotemporally valuable.
Standardized VAS Rating of Sequence Velocity
In the Velocity and Naturalness trials, we utilized electrical sequences of differing patterns and ISIs to investigate various aspects of perception such as estimates of sequence velocity and localization. The VAS ratings of Velocity from participants were standardized to account for an individual's anchoring (mean) and standard deviation, the resultant Z-score Velocity allowed for meaningful comparisons and explorations of the participants’ velocity experience across the provided Patterns and ISIs.
Our work demonstrates a novel approach to account for individual differences in VAS scale use in psychophysical evaluations. Differences in anchoring and standard deviation appear frequently in reflections of conscious perception and are said to be due to a combination of psychological effects such as error of central tendency or extreme label bias (Ramsøy & Overgaard, 2004; Rausch & Zehetleitner, 2014). It is worth noting that even if anchoring took place, it still would not alter their deviations from that mean position, meaning the standardization would still need to take place in some form to allow for fair aggregation of ratings between individuals. In the present raw VAS Velocity rating data, individuals appear averse to the middle region of the VAS scale, preferring to evaluate their experience using either the low or high extreme of the scale. To limit exposure to these issues, we instead focus on isolating the individual's differences in conscious perception of velocity across our ISI and Patterns through subject-based standardization of VAS Velocity ratings. This allows us to pool and compare conscious perception data that was originally heterogenous in both its individual anchoring and standard deviation. This method could be implemented for other data sets where subjective evaluation is used to build understanding of psychophysical phenomena. Typically, these types of ratings are difficult to work with due to the differences in both an individual experience and their evaluation. Standardizing as demonstrated in this work minimizes the confounding impact of the individual's evaluation process and leaves a structured understanding of an individual's experience with the ability to compare within and between subjects.
Velocity Rating is Influenced by ISI and Pattern
The present study examined whether stable and relative velocity perceptions occurred with electrotactile sequences that differed in ordered pattern, direction, and ISI. Since the strength of the electrotactile pulses was held constant across all conditions, ISI and prior expectations were the only way that salience could be afforded or detracted from a sequence. The low-speed prior is a processing heuristic that results from a computational advantage to consistent underestimation in the perceptual inference process—that is—if sensory processing requires some aspect of estimation or inference, it is best if that estimation is always in the same direction of inaccuracy. The influence of this low speed prior to the resolution of a percept depends on its own strength (familiarity) and the amount of data (salience) input during resolution (Goldreich & Tong, 2013). More time given to interpret each pulse of data in a sequence awards more salience for each pulse. Furthermore, more familiarity with the stimuli being evaluated (more like everyday experience) means less reliance on the “default” low-speed prior for tactile activation. This allows instead for the influence of an “updated” prior that more accurately represents the expectations of the evaluated experience (Goldreich & Tong, 2013).
These factors of sequence familiarity and timing contribute to the salience awarded to the stimuli, and therefore, a more accurate calculation of the sequence velocity during perception, less perceptual inference, and less underestimation from the low-speed prior. As it pertains to the present study, longer ISIs increased both the salience of the sequence as well as decreased the true velocity being presented across the electrodes. As such, our hypothesis regarding ISI and the rating of Velocity was supported and the Z-Score Velocity ratings indicated that the interpretation of velocity in the present range of ISIs changes by a similar amount between ISIs (100 ms/160 ms and 160 ms/220 ms). Based on the principles of sensory evaluation covered above, one would expect more extreme sequence speeds to provide less salience per pulse and be more unfamiliar in terms of the prior expectations, causing a heavier reliance on underestimation during inference during this high speed, essentially causing the participant's interpretation of velocity to be nonlinear when compared to the veridical change in ISI. This is not what we found and therefore requires further exploration. Future works could continue to explore the psychometric function of electrotactile sequence velocity perception and attempt to better characterize how it might behave at both faster and slower speed extremes.
Sequence Direction Influences Velocity Rating
To ensure accuracy in our analysis, we found it imperative to examine the behavior of each pattern within various levels of awarded salience from the ISI, considering velocity as a spatiotemporal calculation susceptible to misinterpretation of location and timing. In terms of the presented patterns, the interpretation of the Toe-to-Heel pattern may rely more on a low-speed prior compared to the other patterns. This is because it opposes the standard propagation of skin activation during gait, as marked by heel strike and toe-off. Upon analysis, we discovered that for ISIs of 160 ms and 100 ms, the Toe-to-Heel pattern was rated as slower than the Heel-to-Toe pattern. This observation suggests that for these ISIs, the amount of salience awarded to each pulse was outweighed by the lack of experience or familiarity with this direction. Consequently, there was a heavier reliance on the low-speed prior during perception, ultimately resulting in an underestimation of sequence velocity.
The underestimation of unfamiliar skin activation could have unknown impacts on the handling of unfamiliar perturbations, such as those in a laboratory setting. Participant perception of perturbation's direction is integral in balance control (Puntkattalee et al., 2016). Likewise, the familiarity of perturbation magnitude has been shown to impact recovery strategy, with unfamiliar perturbations causing participants to rely more on prior experiences (Kaewmanee et al., 2020). Underestimation of perturbation magnitude could relate to poorer balance performance and postural anxiety, which has been shown to negatively impact compensatory postural adjustments (Carpenter et al., 2004). Our work demonstrates that it is possible an incorrect interpretation of skin activation velocity may negatively impact the estimation of perturbation magnitude, and therefore, the generation of appropriate compensatory postural adjustments. This observation may also extend to real world situations of balance control.
CRE and Velocity Ratings Function with Minimal Electrical Pulses
A reduced CRE was of specific interest for this experiment. Other implementations and explorations of the CRE have utilized endpoint-anchors and differing amounts of locator, attractee, and attractor stimuli (Goldreich, 2007; Warren et al., 2010). In the present work, no additional pulses were provided beyond those necessary to facilitate the CRE. In its most basal form, the electrotactile CRE pattern allows for evaluation of cutaneous saltation on the perception of velocity without undue perceptual biases and confounds. A reduced stimulus also allows us to represent the natural world more closely, where skin may be activated sequentially by an object with a uniform speed. Additional pulses, anywhere in the electrotactile pattern, may interact with the conscious perception of velocity and the generation and interpretation of cutaneous saltation.
The direction of the subject's attention in the present experiment was minimal—this was done in effort to reduce the impact of any attention or bias during the experiment. The evaluation of sequence velocity and location took place without any attentional direction to a specific locus. Other works have demonstrated that both the spatial and temporal aspects of a sequence can be influenced by the direction of participant attention which, in most cases, was to the middle loci - which also serves as the illusory site in CRE conditions (Flach & Haggard, 2006; Goldreich, 2007; Kilgard & Merzenich, 1995). This work demonstrates an avenue to utilize cutaneous saltation and resultant illusions to minimize the number of stimulation sites required to translate information. Information, in this case velocity, that previously required three sites (tactors or electrodes) could potentially be translated, via cutaneous saltation, through two sites. The limit of cutaneous saltation's ability to preserve information from a sequence is presently unknown, but as demonstrated in the present work, it may be able to preserve and communicate sequence velocity and infer positions while using virtual or illusory stimulation sites.
True Sequence Velocity is Comparable to Skin Activation During Gait
In the present work, the average distance from Site 1 to Site 3 was 7.95 cm (+/- 0.68 cm) combined with presented ISI of 100, 160, and 220 ms, gives a true sequence velocity of 40 cm/s, 25 cm/s, and 18 cm/s, respectively. Literature concerning gait kinematics have estimated stance phase of gait to last approximately 0.64 s and is conventionally defined to begin with heel strike and end with toe off (Murray et al., 1964). Based on foot scans, the average length for a North American foot is 25.75 cm (Jurca et al., 2019). These aspects in conjunction allow us to roughly estimate experienced foot velocity as 25.75 cm/0.64 s or 40.23 cm/s. As such, the fastest ISI of 100 ms utilized in the experiment may be similar to the experienced velocity across the foot during standard gait, while the slower ISIs may be more appropriate for slower gait speeds or stance phases (heel strike to toe off). For example, studies included in a review by Bouça-Machado et al. (2020) indicated that the average Parkinson's disease participant stance time to be 0.74 s (+/- 0.11), and by incorporating the same foot size determined by Jurca et al. (2019) we can estimate average skin activation speed to be 25.75 cm/0.74 s or 34.80 cm/s. This estimated gait velocity seems reasonable, as one might expect that individuals with a greater degree of ambulation impairment would have further decreased skin activation speed. Overall, our ability to generate a range of electrotactile sequence perception at both low and higher speeds, may mimic natural gait speed across various health and impaired ambulation.
Applications
The observed higher velocity ratings of the CRE condition over both Heel-to-Toe and Toe-to-Heel patterns within the 220 ms ISI suggests a potential decrease in illusion stability and cutaneous saltation, impacting perceptual uniformity and potentially warranting these higher velocity scores. This finding also indicates the utility of both stable and unstable illusory representations and the potential for cutaneous saltation to streamline stimulation grid design for conveying sequence velocity. In the context of the 220 ms ISI, the CRE condition demonstrates a higher rating in comparison to both Heel-to-Toe and Toe-to-Heel patterns. This outcome suggests a potential decrease in the stability of the illusion and the degree of cutaneous saltation at this slower ISI. Even though a less stable illusion may still lead to the perception of the middle site, the percept might not be evenly distributed between the two veridical electrode sites 1 and 3 (Goldreich & Tong, 2013). Consequently, this uneven distribution could create a sensation that seemingly accelerates from between Site 1 and Site 2, toward Site 3, potentially warranting a higher velocity score. However, it's important to note that the utilization of both stable and unstable illusory representations could enhance the signaling capacity of a stimulation device.
If sensations can be consistently evoked at midpoints between stimulation positions - as demonstrated in the present study - there could be greater utility in eliciting sensations at more positions between real stimulation sites. Mastery of both stable and unstable illusions may enable stimulators to access perceptual sensations at a myriad of locations between real stimulation sites. Furthermore, the maintenance of velocity experience between the illusion-causing CRE and the veridical Heel-to-Toe pattern suggests that under ISIs inducing adequate cutaneous saltation, the illusory localization of a pulse to Site 2 suffices to maintain the sensation of velocity established in a veridical Heel-to-Toe activation. Under lower ISI conditions, the illusory velocity experience using only two loci of stimulation equates to the veridical velocity experience, which requires three loci of stimulation. This exciting finding implies that cutaneous saltation could serve as a valuable tool in designing and communicating through stimulation grids to convey sequence velocity, as fewer tactors are needed to evoke a similar outcome.
Stimulating devices could be improved through the application of this work by improving a user's ability to detect velocity or reducing the complexity of the stimuli through cutaneous saltation. For example, an electrotactile stimulating device could be used to signal movement of an avatar in a virtual reality by using rapid pulses of electricity across only two sites. In addition, this electrotactile stimulating devices could also reliably present across-skin tactile velocities with pulses across multiple sites—while altering the stimulation during high velocities to utilize the cutaneous rabbit illusion and reduce any potential impact of unaccounted for saltation.
Quality Evaluations Indicate Mostly Homogenous Participant Experience
We explored stimulus quality to evaluate the usability of a clinical word bank from Kim et al. (2018). The primary goal of this exploration was to determine whether some of these words would be commonly applicable for electrotactile sensations. The secondary goal was to determine if the ISI and Pattern would have any impact on quality selection. Generally, it seems our stimuli were likely too similar to evoke any difference in qualitative perception as it relates to the selection of words. To provide a more fulsome opportunity for varied perceptual experiences, future stimulus profiles should explore sequences that differ in pulse width, duration, frequency, and amplitude. However, we did find that some words were impacted by the ISI and Pattern of the sequence and may be of general interest. Words that demonstrated significant effects appear to be related to the concept of contiguous movement (movement across skin) or comfort with the sequence (shock and tickle). Movement across skin was used more frequently when approaching the speed of natural foot skin activation of 40.23 cm/s, as demonstrated in 100 and 160 ms ISIs (equivalent to 40 cm/s and 25 cm/s) and when pulses were presented in the natural sequence of skin activation during gait, that is, Heel-to-Toe. Interestingly, CRE experiences more “ticklish” may indicate a qualitative difference in the perception of the illusory sequence, which appears to not influence the conscious perception of velocity. CRE may afford an opportunity to generate more differing perceptual experiences, while not compromising the presentation of a velocity. Future work may be interested in attempting to further reduce perceived discomfort of electrotactile sequences by leveraging perceptual illusions.
Conclusions
In this work, we highlight that both ISI and Pattern meaningfully contribute to the perception of electrotactile sequence velocity, location, quality, and nature. We quantify the rating of sequence velocity using a VAS and provide evidence that a reduced CRE can both evoke cutaneous saltation on the foot sole and communicate sequence velocity. We indicate that both stimuli temporal salience and low-speed prior expectations of direction and/or stimuli speed may impact the interpretation of electrotactile sequences. Finally, we show that individuals can discern the sequence velocity between ISIs that differ by only 60 ms, and that this velocity is preserved through cutaneous saltation. Electrotactile sequences about the foot sole can meaningfully communicate the velocity of a sequence regardless of whether that sequence was presented veridically or through tactile illusions. This use of cutaneous saltation presents an avenue to reduce and optimize the density of tactors or electrotactile nodes required to translate a signal to the skin, which would have a considerable impact on the design of signalling displays.
Footnotes
Author Contribution(s)
Declaration of Conflicting Interests
The authors declared no potential conflicts of interest with respect to the research, authorship, and/or publication of this article.
Funding
The authors disclosed receipt of the following financial support for the research, authorship, and/or publication of this article: This work was supported by the Natural Sciences and Engineering Research Council of Canada (grant number RGPIN-2018-06436 to LRB).
Data Availability Statement
The data that support the findings of this study are not openly available due to reasons of sensitivity and are available from the corresponding author upon reasonable request. Data are located in controlled access data storage at the University of Guelph. Data or materials for the experiments are available upon request, and none of the experiments were preregistered.