
Abstract
Everyday experiences suggest that a container, such as a box of cereal, can convey pertinent information about the nature and quantity of its content. This study investigated how well people can judge large quantities of objects in a container through haptic perception. Stimuli consisted of plastic drinking straws cut to “small” (1.5 cm) or “big” (4.5 cm) pieces contained in plastic food containers. Participants performed both a magnitude estimation of the number of objects and a direct estimation of the proportion of the container perceived to be filled with objects. Overall, participants demonstrated considerable accuracy for both tasks and irrespective of the size of the content. Post-experiment interviews revealed three potential strategies. Participants either focused on the container's contents, the excess space in the container, or the perceived weight of the container (content).
Humans are highly adept at gaining behaviorally relevant information from their environment by active touch, otherwise referred to as haptic perception (Grunwald, 2008; Lederman & Klatzky, 2009; Ziat, 2023). When actively handling an object, various stimuli impinge on the receptors in the skin, tendons, and muscles; the stimulation, in turn, is a function of our movements and the inertial properties of the object. But how good are we at employing these tools in learning about objects that are inside a container and therefore hidden from direct touch?
Containers pose a particularly interesting challenge to the haptic sense since they create a go-between, or intermediary, between the information about their contents and the observer. The intermediacy raises the basic question of whether a container can indirectly convey pertinent information related to its content. Daily experiences suggest that it can; shaking a box of cereal allows for distinct impressions of how much content is left (e.g., Hirota & Sekiguchi, 2009; Koshiyama et al., 2015; Plaisier & Smeets, 2017; Tanaka & Hirota, 2012).
While containers have received attention in marketing and consumer research, these works focus on how the tactile attributes of a product's packaging can bias someone's appreciation of the product's quality and pleasantness (e.g., Pramudya & Seo, 2019; Spence & Gallace, 2011). In contrast, here we are interested in documenting what people can tell about the actual nature of the content through the intermediacy of the container (e.g., Frissen et al., 2022, 2023; Jansson et al., 2006; Plaisier & Smeets, 2017).
Specifically, we are interested in how accurately people can haptically judge the amount of content in a container. Earlier work (Frissen et al., 2023; Plaisier & Smeets, 2017) has found that people are quite accurate at telling small numbers of objects (i.e., up to about four) inside a handheld box. In the present work, we extend these works by considering much larger numbers of objects, up to more than 600. To this end, we first review the literature on haptic numerosity perception.
Literature Review
Humans, and many animals alike, have a natural capacity to estimate the number of objects. This capacity is typically understood to exist in two separate components (Feigenson et al., 2004; Revkin et al., 2008). The two-component model distinguishes between subitizing and the approximate number system (ANS). Subitizing processes small numerosities, up to about 4, rapidly and essentially without error. The ANS processes numbers larger than that, using estimation to make approximate and imprecise judgments of numerical magnitudes (Dehaene, 1997; Feigenson et al., 2004).
The ANS produces a representation of number that is noisy and ratio-dependent. That is, the discriminability of two quantities depends not so much on the absolute numerical difference but on their ratio (e.g., Gimbert et al., 2016). Consequently, the ANS follows Weber's law, suggestive of a logarithmic relation between physical magnitudes and the sensory system's representation of those magnitudes (Petzschner et al., 2015). 1
While numerosity perception has mostly been investigated in the visual domain (see Anobile et al., 2016 for a recent review), there are several studies in the haptic domain using quantities that implicate either subitizing or the ANS.
Haptic Numerosity for Small Numbers
Riggs et al. (2006) were the first to present evidence that subitizing occurs in passive touch. They had participants judge the number of fingers stimulated and found that both accuracy and response times depended on numerosity. A discontinuity in both accuracy and in response times was observed. For numerosities between one and three, accuracy was high (between 93 and 99%) and response times increased by about 270 ms/item. For numerosities between four and six, accuracy dropped markedly to between 48 and 74% and response times increased by about 630 ms/item. Additional evidence for subitizing in touch comes from a study by Plaisier et al. (2009). Whereas the stimuli in the Riggs et al. (2006) study were received passively, here participants actively explored varying numbers of objects. Again, the typical discontinuity was observed between three and four objects. For numerosities between one and three, accuracy was 100% and response times increased by about 170 ms/item. For numerosities between four and seven, accuracy dropped to between 96 and 78% and response times increased by about 840 ms/item.
Several studies have considered numerosity perception in container haptics (Frissen et al., 2022, 2023; Hummel et al., 2022; Plaisier & Smeets, 2017; Sekiguchi et al., 2005). All of these studies used one to five objects and therefore fall mainly within the subitizing range. However, the studies were not designed to demonstrate subitizing per se; they were designed to assess how accurately people could perceive or discriminate small numbers of objects in a container. Sekiguchi et al. (2005) examined whether people can discriminate the number of objects in a container. The results of five participants suggested that performance was accurate with up to three to four objects. This study employed virtual reality techniques to present participants with a consecutive pair of physical containers. Moreover, the task design does not allow any conclusions about whether participants accurately perceived the exact number of objects in the container, only that they could tell that there were different numbers of objects.
Plaisier and Smeets (2017) tested the idea that people can estimate an exact number of objects inside a box. Seven participants were handed a small cardboard box containing one to five wooden spheres. They were allowed to handle it for five seconds, after which they were to estimate the number of spheres inside the box verbally. The task was performed under two conditions. In one condition they received auditory and haptic information from handling the box; in another, they heard playbacks of auditory recordings from that handling. The results showed that participants could perform the perceptual task accurately when the number of objects was between one and three, and that they tended to start underestimating their number when there were more than three, which is consistent with most haptic subitizing studies—without containers—summarized above. The main difference between the two conditions was that performance was considerably more variable in the auditory-only condition, which the authors attributed to cue integration processes (e.g., Ernst & Bülthoff, 2004).
Notably missing from the Plaisier and Smeets (2017) study was a haptic-only condition, limiting any conclusions about people's ability to do the estimation task based on haptic cues alone. Hummel et al. (2022) conducted a user study with thirty participants featuring three sensory conditions: haptic-only, auditory-only, and auditory plus haptic. Their results mirrored those of Plaisier and Smeets in showing good numerosity estimates for all three conditions thereby demonstrating that people can also perform the estimation task under haptic-only conditions. However, like Sekiguchi et al. (2005), this study used virtual objects rather than real ones and its stated objective was to render virtual stimuli such that they would generate interactions that are conducive of performance “as close as possible to that that humans achieve when interacting with a hollow container filled with real objects” (p. 194).
Frissen et al. (2023) conducted a series of three haptic-only container experiments, with 15 participants each that used physical objects. The first two experiments demonstrated very accurate performance, provided the objects were of sufficient weight. A third experiment demonstrated that removing the weight cue leads to systematic underestimations but also that it does not eliminate people's ability to distinguish between different numbers of objects in the container.
Haptic Numerosity for Large Numbers
The performance of the ANS in the haptic sense has also been investigated in two, methodologically similar, studies (Gimbert et al., 2016; Ziegler & Drewing, 2022). The objective of these studies was to investigate whether number representation was modality specific by correlating performance on visual and haptic numerosity tasks. These investigations used visual and haptic versions of a dot ratio comparison task that assessed whether observers can identify from among two simultaneously presented quantities of dots which one had the larger quantity.
We focus, for the moment, on the results for the haptic tasks. Gimbert et al. (2016) studied number perception in five- and seven-year-old children using 3D-printed, raised-dot, stimuli constructed to present dot ratios ranging from 1.2 to 2.8, between the two hands. The results showed that children were able to perform the task well-above chance: Starting at about 65% accuracy for the most difficult ratio, performance quickly improved to above 80% for intermediate ratios and went up to around 95% for the easiest ratio. Ziegler and Drewing (2022) studied adult observers using pins in Styrofoam shapes constructed to present dot ratios ranging from 1.1 to 2.0. They reported results that were comparable to those of Gimbert et al. Also starting at about 65% accuracy for the most difficult ratio (1.11), performance improved to above 85% for a ratio of 1.33, and went up to almost 100% for the easiest ratio (2.0). At the same time, the comparisons between visual and haptic tasks led the two studies to draw divergent conclusions. Whereas the results of Gimbert et al. (2016) suggested modal specificity of the ANS, those of Ziegler and Drewing (2022) suggested a modality-independent system.
Present Study
At present, there is no research that documents container haptics with large numerosities. To address this gap, the present study has set two objectives. The first objective is to explore and document whether people can judge large quantities of objects in a container under haptic-only conditions. The objective is addressed by posing participants with two different numerosity tasks. The second objective is to gain preliminary insights into the possible perceptual strategies that participants used to solve the perceptual tasks.
Method
Participants
Seventeen participants were recruited for the study. One participant was excluded from the data analysis for not following instructions, later confirmed during the experimental debrief in which the participant communicated a misunderstanding of the experimental tasks. The resulting 16 participants’ data were used for analysis (mean age = 22, range: 20–27; 10 females; one left-handed).
Materials and Stimuli
During the experiment, stimuli were hidden from view by having participants place their dominant hand inside a box. The box was constructed by cutting a hole from the front side of a standard cardboard moving box. The hole was covered with a small cloth curtain to prevent participants from seeing through the hole. The back side of the cardboard box was removed so that the experimenter could hand the participant the stimuli during the experiment (see Figure 1). To mask the sound of the objects being shaken in the container, participants wore a set of earplugs in addition to a pair of headphones that played white noise.
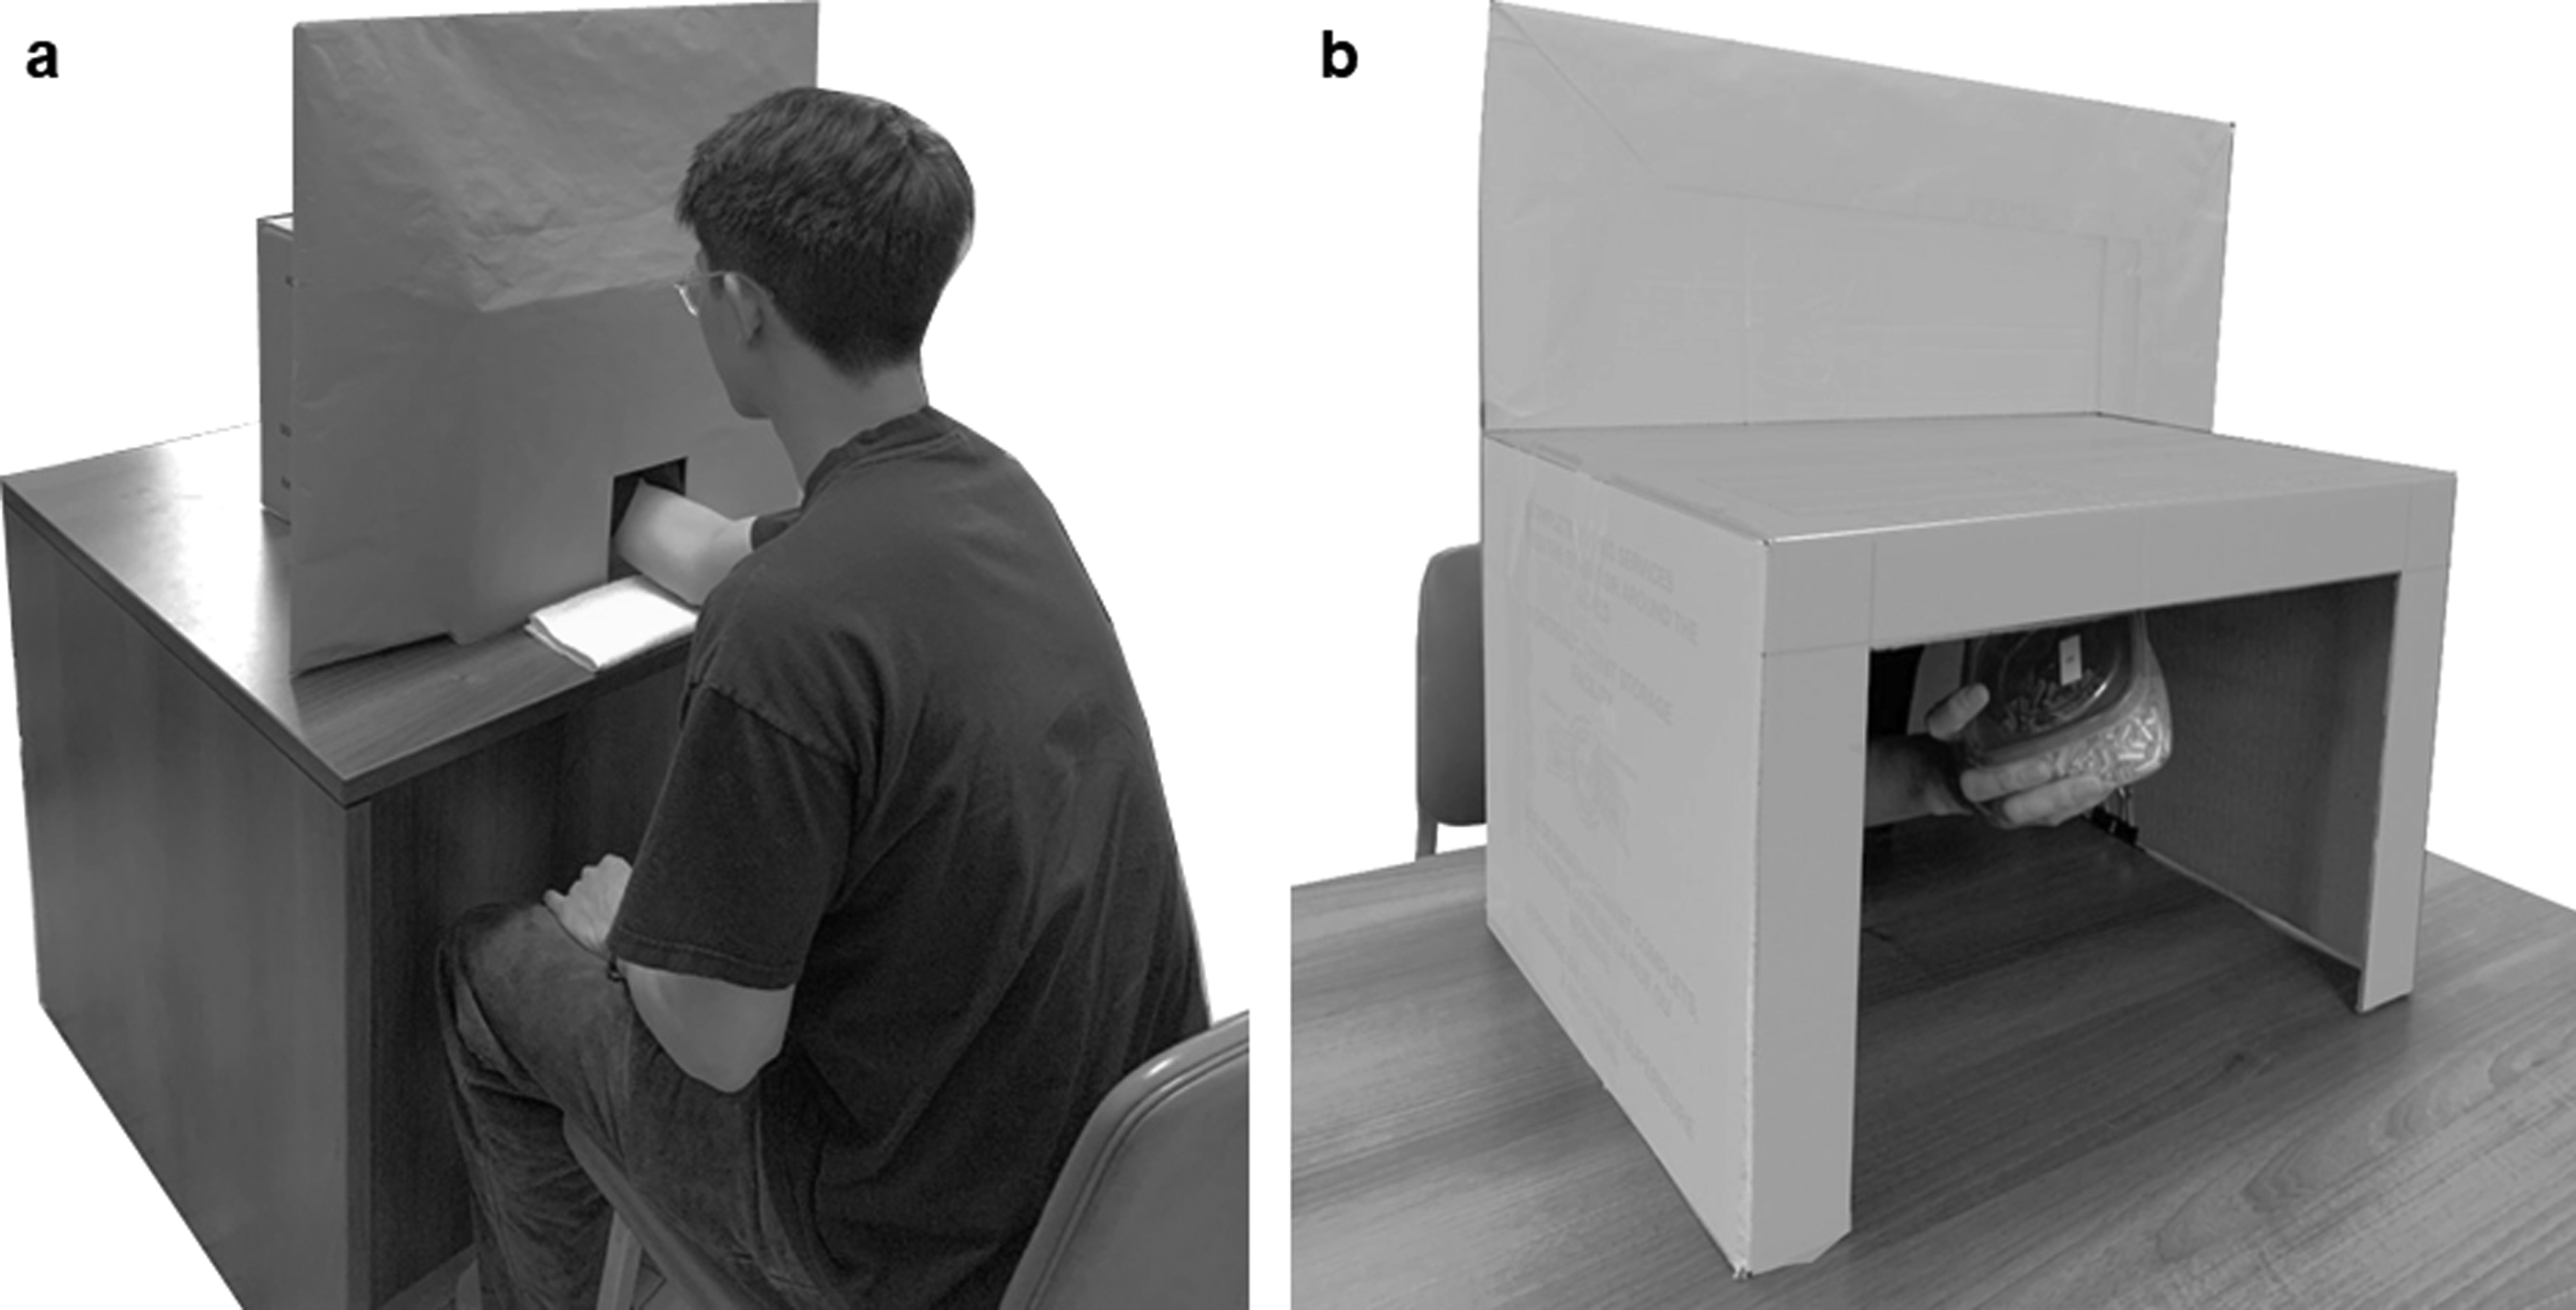
Experimental setup. (a) A person with their hand placed inside the box. (b) The experimenter's view.
Stimuli consisted of containers and the objects to be contained. The containers were twelve identical plastic tapered food containers (Base: 8 × 8 cm; Lid: 11.3 × 11.3 cm; Height: 7.8 cm). All containers had lids, thus preventing participants from being able to touch the content directly. The objects were created by cutting plastic drinking straws into one of two lengths: 1.5 cm (“small”) and 4.5 cm (“big”). The reason for using straws was to minimize weight cues, as straws are hollow and light. Six containers were filled with the small objects, and the other six were filled with the big objects (see Figure 2). Five experimental containers were constructed containing an incremental number of objects, accompanied by one reference container for use during a familiarization phase. For the big objects, the exact number of objects was counted for each container. The containers for the small objects were visually matched to have a similar height in content with their corresponding big object container. The number of small objects was then counted for containers 1 and 2, and estimated on the basis of the average weight of an individual object for the remaining containers (see Table 1 for details).
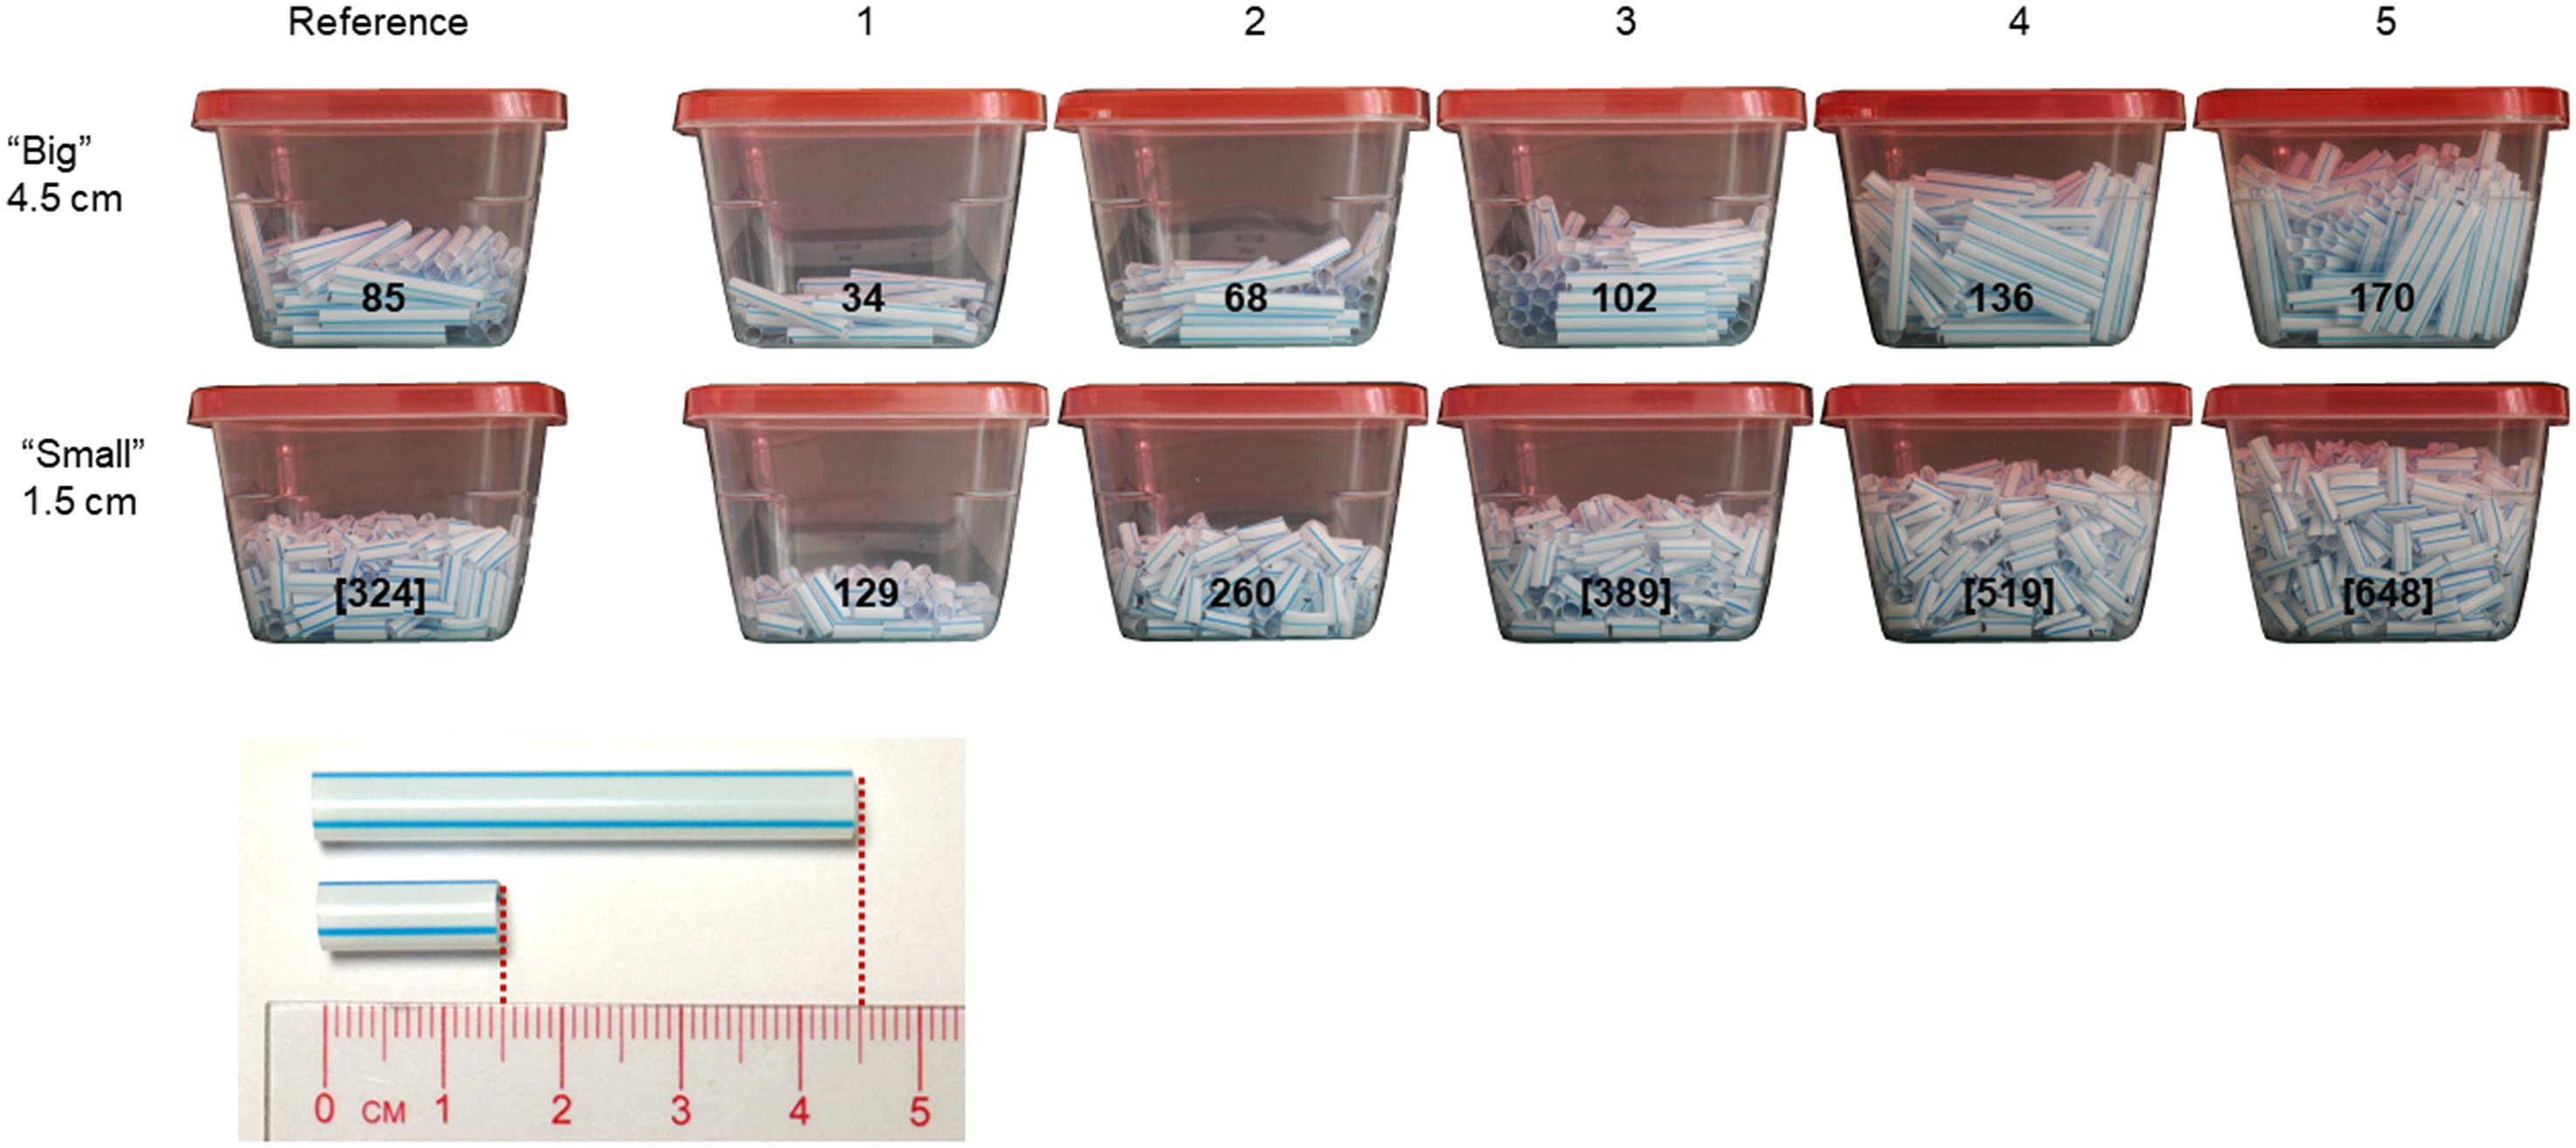
Container stimuli. Values superimposed on the individual containers are the number of objects. Values are based on counting the individual objects except for those in square brackets which are estimated based on the average weight of one object (see Method for details).
Detailed description of the stimulus parameters.
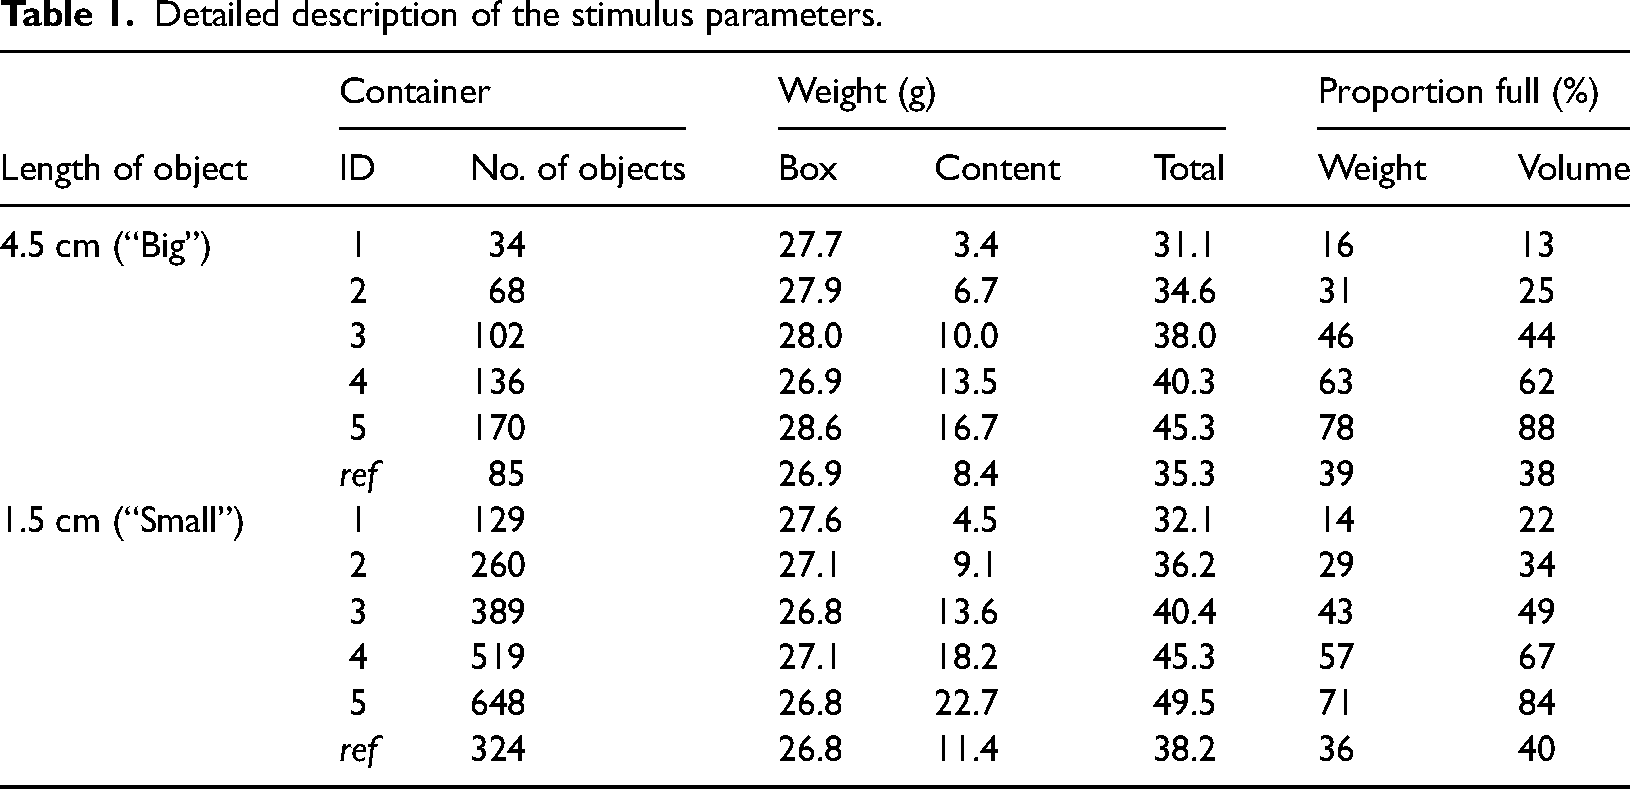
As noted, containers were filled by eye and the physical proportion to which a container was filled was determined after the fact using two calibration methods. The first, weight calibration, was based on the weight of the content. We calculated the weight of each container's content as a fraction of the weight of a full container's contents. Full was defined as the contained objects no longer being able to move when shaking the container. Thus, two full containers were constructed, one for each object size. The second, volume calibration, was based on the volume of the container. The height of the container's contents was used to calculate the volume of the container which was occupied. First, a height-volume calibration curve was generated by filling a container to various points with room temperature water, recording the height and volume at each point (assuming 1 g of water = 1 cm3). Second, the height of the straws in each experimental container was measured using a ruler. The resulting values for both calibrations are reported in Table 1.
Design and Procedure
The experiment followed a 2 (Task: Amount vs. Proportion) × 2 (Object Size: Small vs. Big) × 5 (Number of Objects: 1–5) within-subjects design. The four conditions resulting from the factorial combination of Task and Object Size were blocked and counterbalanced. Counterbalancing was restricted such that the tasks were never interleaved. In other words, for half of the participants, the first and second blocks featured the amount task and the third and fourth blocks featured the proportion task. For the other half the order of tasks was reversed. Under these four conditions, each of the five containers was presented twice, for a total of 40 trials, randomized according to a 5 × 5 Latin square.
On any given trial, participants were handed one of the containers. They were tasked to shake it and judge the quantity of objects they perceived to be in each container. For each trial, the experimenter placed a container in the participant's dominant hand. The participant was given five seconds to interact with the container before verbally reporting their numerosity judgment to the experimenter. The experimenter recorded the participant's response and replaced the container in the participant's hand with the next container in the sequence. The participant did not receive any feedback on whether their response was correct or not.
Before the start of the actual testing, participants were handed the two reference containers for a 1-min familiarization period. They were allowed to explore the stimuli visually, auditorily, and haptically. No explicit information about the stimuli was provided. After familiarization, participants were instructed to put on the earplugs and headphones.
Between blocks, participants were given a short break and were then presented with the instructions for the subsequent block. After completing the experimental trials, the experimenter conducted a brief qualitative interview to ask participants about the strategies they used to perform the two tasks.
Tasks and Analysis
This study used two tasks: An adaptation of a magnitude estimation (ME) task and a proportion estimation task.
To date, only dot ratio discrimination tasks have been used to study large-quantity numerosity perception in the haptic sense (Gimbert et al., 2016; Ziegler & Drewing, 2022). There are, however, alternative methods, that have been employed in visual numerosity research, including magnitude estimation (e.g., Durgin & Portley, 2023; Krueger, 1982, 1984), which is a common method for measuring psychophysical ratio scales (Gescheider, 1997). In an ME task, participants are asked to make numerical estimations of sensory stimuli in proportion to their magnitude, without extensive training. Participants are typically left to establish their own internal reference (i.e., modulus) rather than have it established by the experimenter since that might introduce biases by forcing the use of numbers that do not match the perceived sensation.
The current ME task was framed as an amount estimation task designed to place the perceptual focus on the content without making explicit reference to the container which here merely functions to hold the content together. 2 The basic problem for the participants to solve was to determine how many objects there are in the container. Instructions were modeled after the suggestion by S.S. Stevens (as cited in Gescheider, 1997; see Appendix A for precise instructions). Responses on the amount tasks were normalized to account for participants’ individual response ranges (Gescheider, 1997; Jones & Tan, 2013). Accordingly, each response was divided by the overall mean of the participant's responses for the particular experimental condition and then multiplied by the mean of the actual number of objects in the small and big containers. The geometric mean was calculated across the two repetitions for each experimental level. Group averages were then obtained by calculating the geometric mean across all participants.
A compelling property of containers is that they naturally bound their contents in a fixed space. The task of quantifying contained contents, then, could also be interpreted as being bounded (by the container) as opposed to being unbounded. Accordingly, the proportion estimation task was designed to include the container in the perceptual focus. The basic problem for the participants to solve was to determine the proportion of the container they perceived to be filled with objects and report a percentage that matched that proportion. Contrary to the amount estimation task, responses on the proportion task were not treated as magnitude estimates. Instead, the geometric mean was calculated across the two repetitions for each experimental level, followed by the arithmetic mean, calculated across all participants to obtain group averages, plus their corresponding confidence intervals.
As part of the data analysis we also explore whether performance on the amount and proportion estimation tasks were somehow related. If both tasks relied on the same mental processes then we expect them to be positively correlated. To operationalize this correlation, (normalized) mean responses were (linearly) regressed on the actual number of objects; the logic being that perfect performance would produce a regression line with a slope of 1 and an intercept of 0. Here, only the slopes are taken as proxies for performance.
Results
Quantitative Data
The results for the amount and proportion tasks are first treated separately and then compared directly. The widths of all confidence intervals (and error bars) are 95% and based on empirical bootstraps. These and all other reported bootstrapped measures are based on 10,000 samples.
Group mean and individual psychophysical magnitude functions for the amount tasks are plotted in Figures 3a and 4a, respectively. While mean estimates of the absolute numbers of objects were grossly underestimated (Figure 3a; grey markers), the magnitude functions show accurate performance in relative terms (dark markers). That is, whereas participants were unable to determine exactly how many objects there were, they were highly accurate in relative terms: If the amount of content was doubled, so did the estimates. This pattern held true across individual participants. This relative accuracy is consistent with the numerosity perception being ratio-dependent.
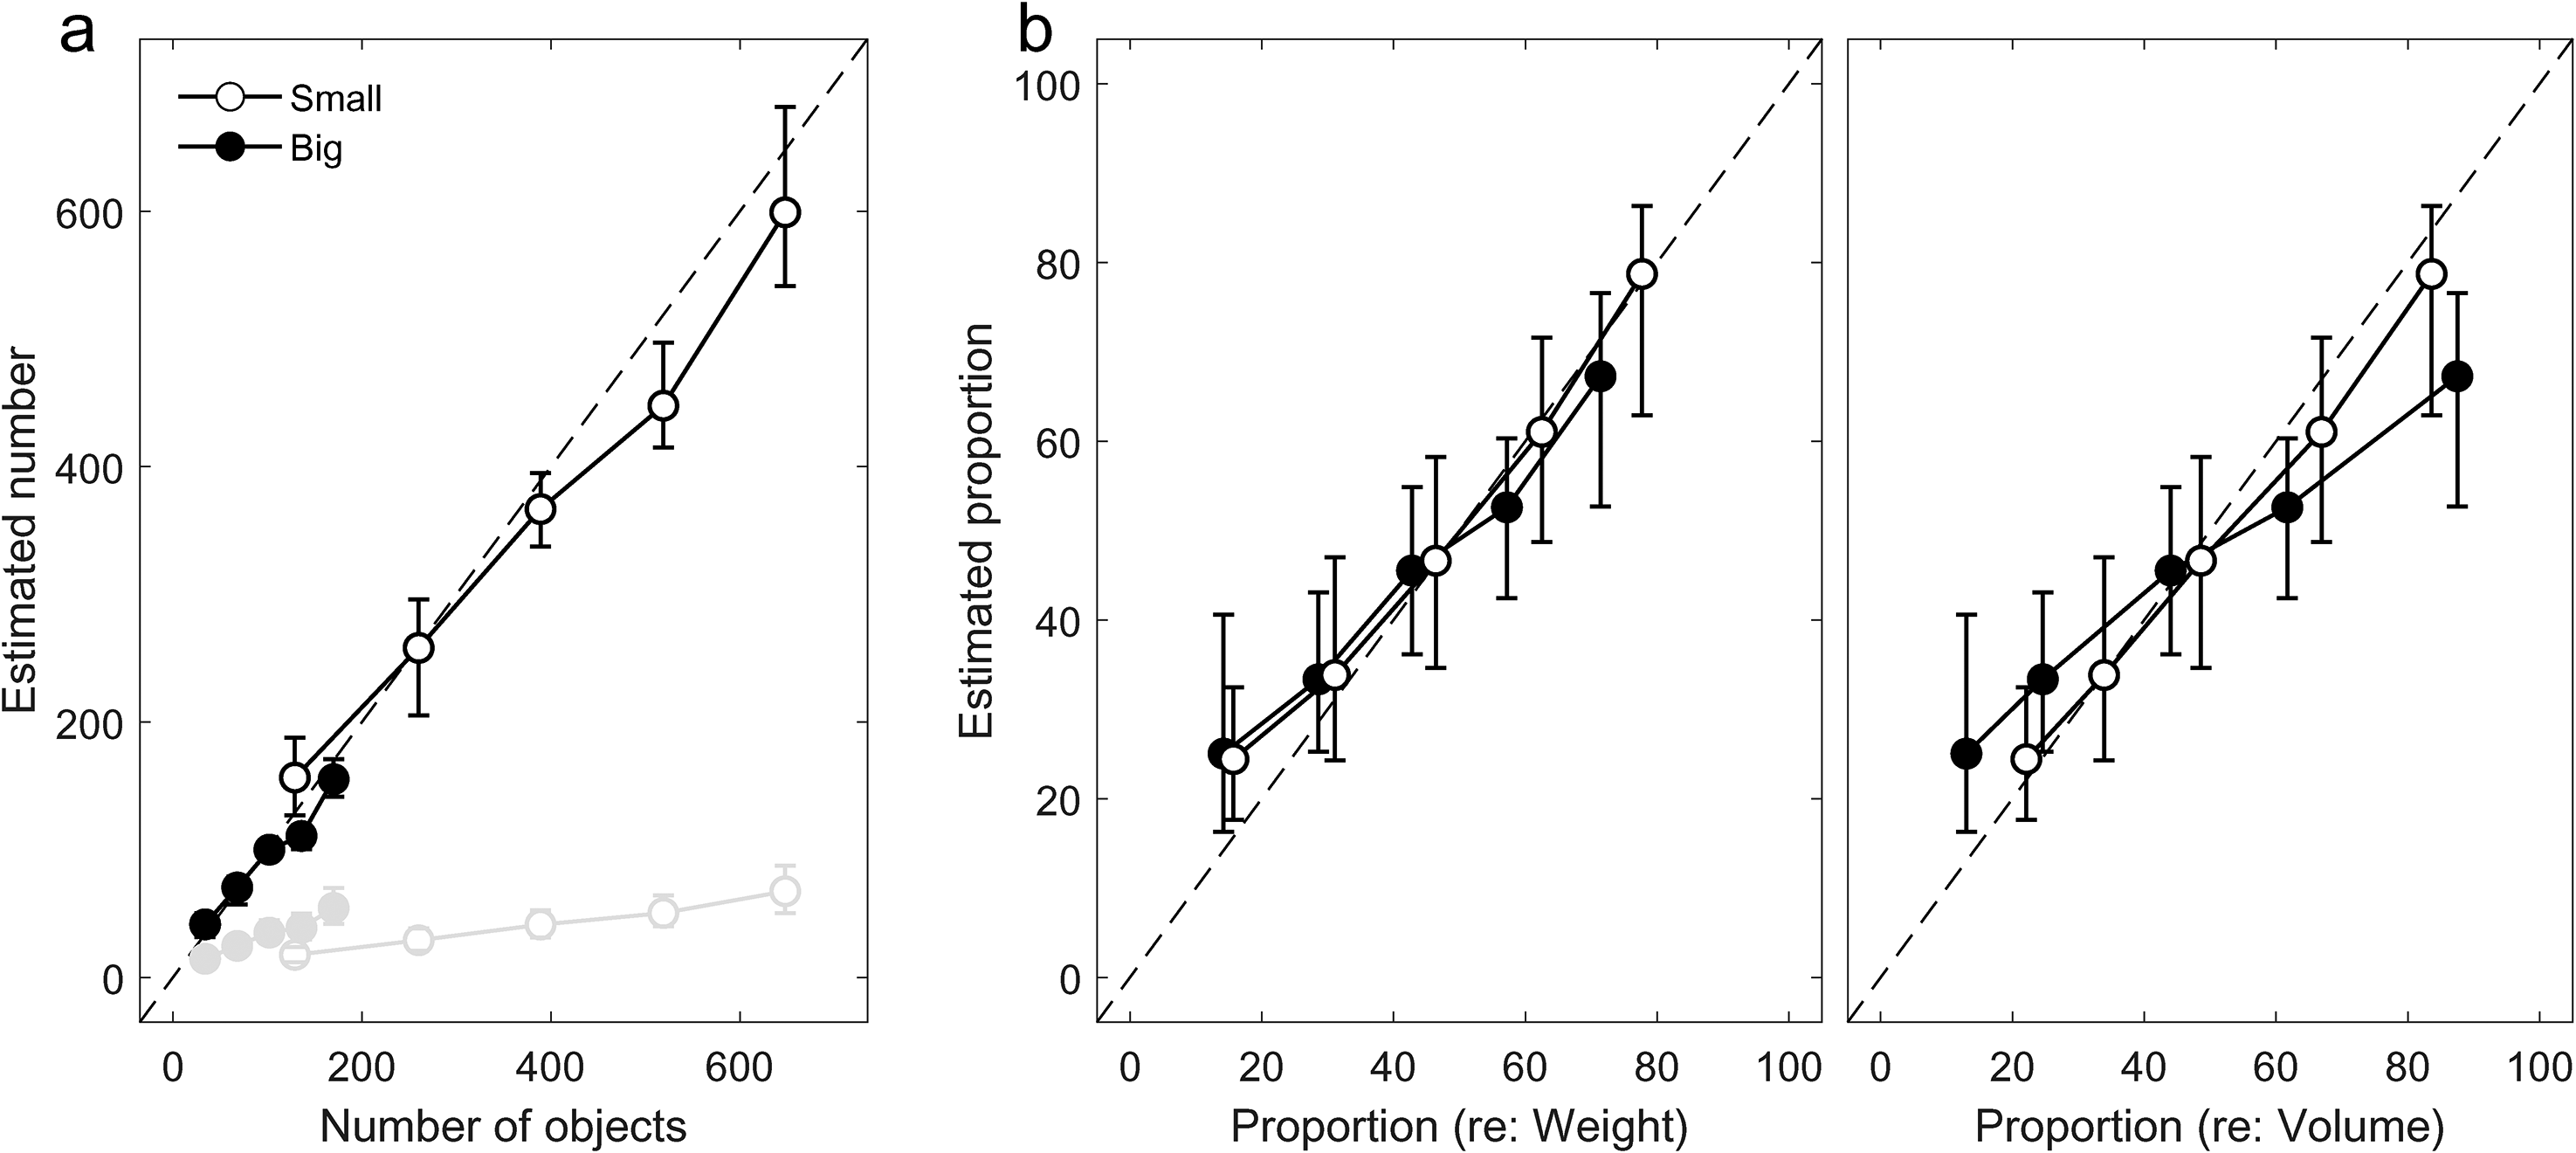
Group average results. (a) Group average magnitude estimates for the amount task. Markers in grey are group averages for non-normalized results. Error bars show confidence intervals for the geometric mean. (b) Group average proportion estimates. The left and right panels plot the estimates as a function of the weight and volume calibrated container content, respectively (see text). Error bars show confidence intervals for the mean.
Group mean and individual psychophysical functions for the proportion task are plotted in Figures 3b and 4b, respectively. On average, participants were very accurate in judging the proportion of the container which was filled; although there was a large amount of individual variability. There were also nuanced differences in accuracy depending on whether the weight or volume calibration was used. When results were plotted as a function of weight-calibrated containers (Figure 3b, left panel), both the “small” and “big” objects were slightly overestimated at the smallest proportion but were accurately estimated for all other proportions. Plotting the results as a function of volume (Figure 3b, right panel), suggests a bias for “big” objects: The two smallest proportions were overestimated and the two largest were underestimated. No such bias was apparent for “small” objects.
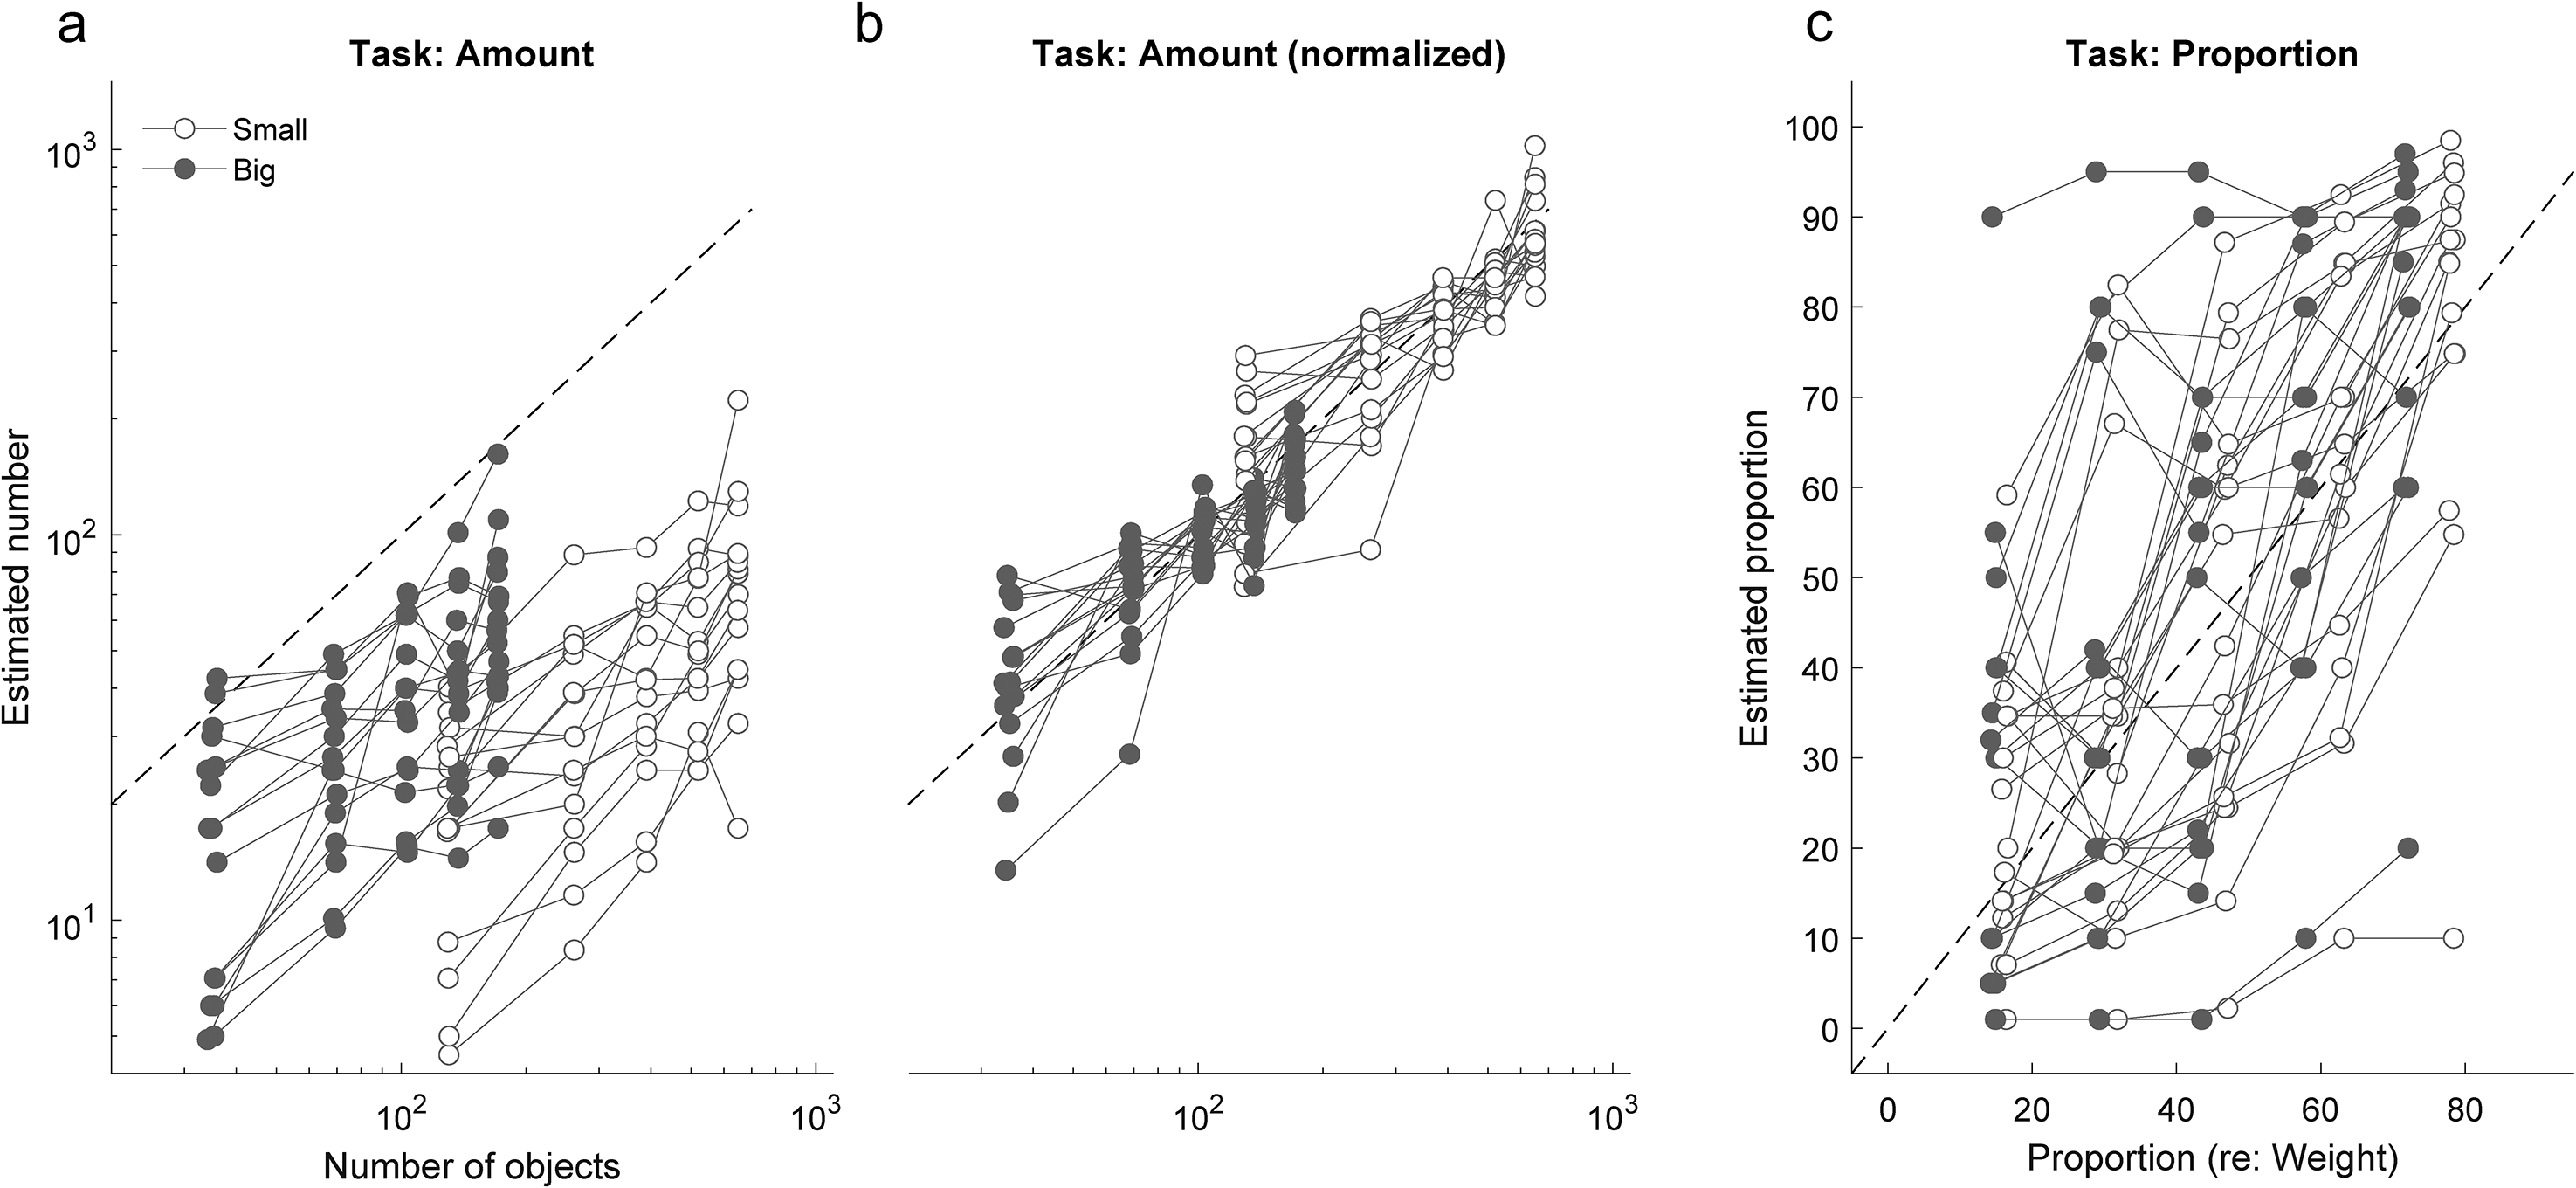
Individual results for the amount (a and b) and proportion (c) tasks. For readability, series in all plots are slightly jittered horizontally, and estimates for the amount task are plotted on log scales. Dotted lines represent veridical performance. The individual results for the proportion task (c) are shown only as a function of the weight-calibrated proportions (see Materials and Stimuli).
Comparison of the Amount and Proportion Tasks
Figure 5a plots the slopes for the proportion estimates against those for the normalized amount estimates. The correlation for the small objects (r = 0.07, CI [−0.76; 0.65]) and the big objects (r = 0.29, [−0.41; 0.71]) were apparently not significant since the confidence intervals were very wide and included zero. However, these correlations and wide confidence intervals were highly driven by the outlying slopes from one participant (see grey bar in Figure 5a and thin lines in Figure 5c). Indeed, excluding the two outlying data points reveals substantial correlations between the tasks. Both the correlation for the small objects (r = 0.52, [0.12; 0.78]) and the big objects (r = 0.55, [0.17; 0.82]) were significant. These results are therefore suggestive of there being a common set of perceptual processes between the two tasks.
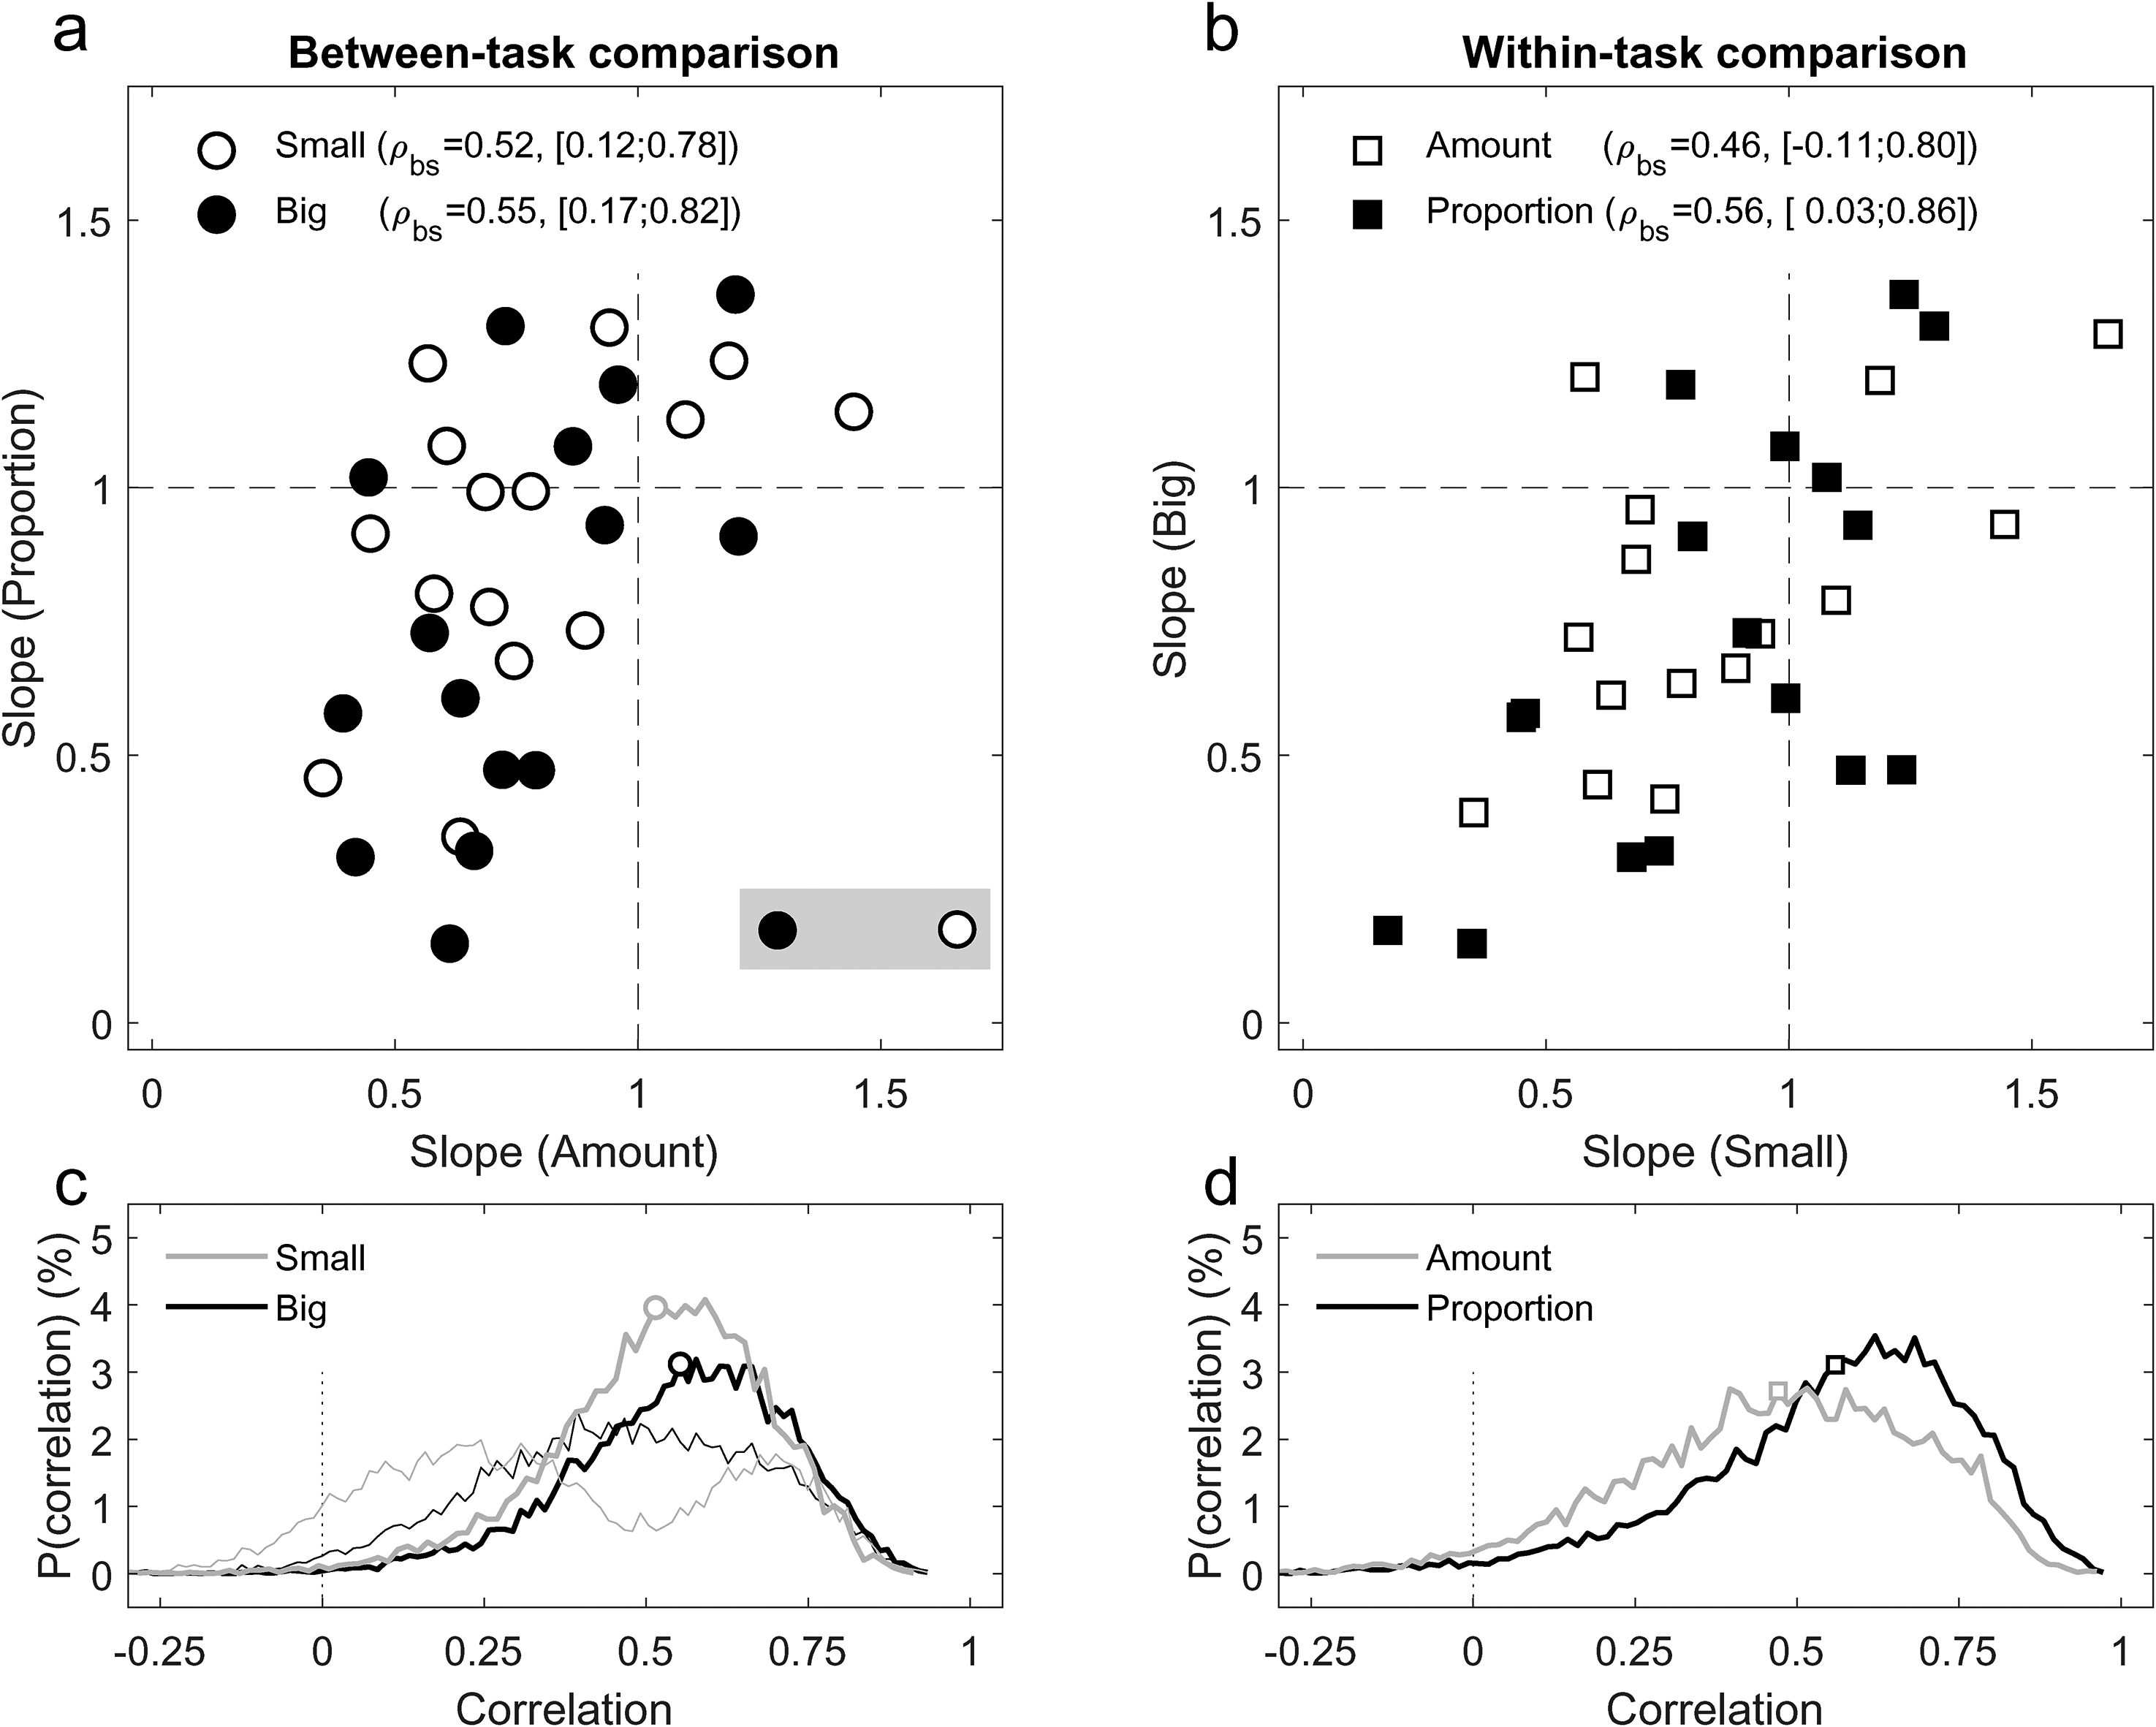
(a and c) Comparison between the two tasks. Values in the legend correspond to mean bootstrapped correlations and corresponding 95% CI. The grey box in the bottom right hand corner of (a) identifies outlier values from one participant which were excluded from the correlations shown (see text). (b and d) Comparison within the same task. (c and d) Histograms of bootstrapped correlations based on the values shown in (a and b). Markers indicate the mean correlations and thin lines correspond to values calculate with inclusion of outlying values.
For the sake of completeness, a secondary correlation analysis was conducted for a within-task comparison. Figure 5b shows the slopes for the big objects plotted against those for the small objects for the two tasks. Interestingly, while there was a substantial correlation (r = 0.46) on the amount task, the corresponding confidence interval, [−0.11; 0.80], includes zero, suggesting the correlation could be non-significant. This could be attributed to a distribution of correlations for the amount task that is flatter (with a higher proportion of negative correlations) than that of the proportion task (Figure 5d). The correlation for the proportion task was significant (r = 0.56, [0.03; 0.86]).
Qualitative Data
In the post-experiment interviews participants self-reported the strategies they employed during the experiment. The collected notes were analyzed in a qualitative content analysis, which produced three strategies. First, the label Positive Space was assigned to cases in which participants make reference to the container's contents when constructing their quantity judgments. Second, the label Negative Space was assigned to cases in which participants make reference to the excess space in the container. That is, the space that is not filled with objects. Finally, the label Weight was assigned to cases in which participant explicitly mentioned using the perceived weight in making their judgments.
There was considerable variety in the use of strategies. Six participants reported using one strategy, six more reported using two strategies, one reported using all three strategies, and three more mentioned different (combination of) strategies for the two tasks. Table 2 gives a detailed breakdown.
Qualitative data analysis.
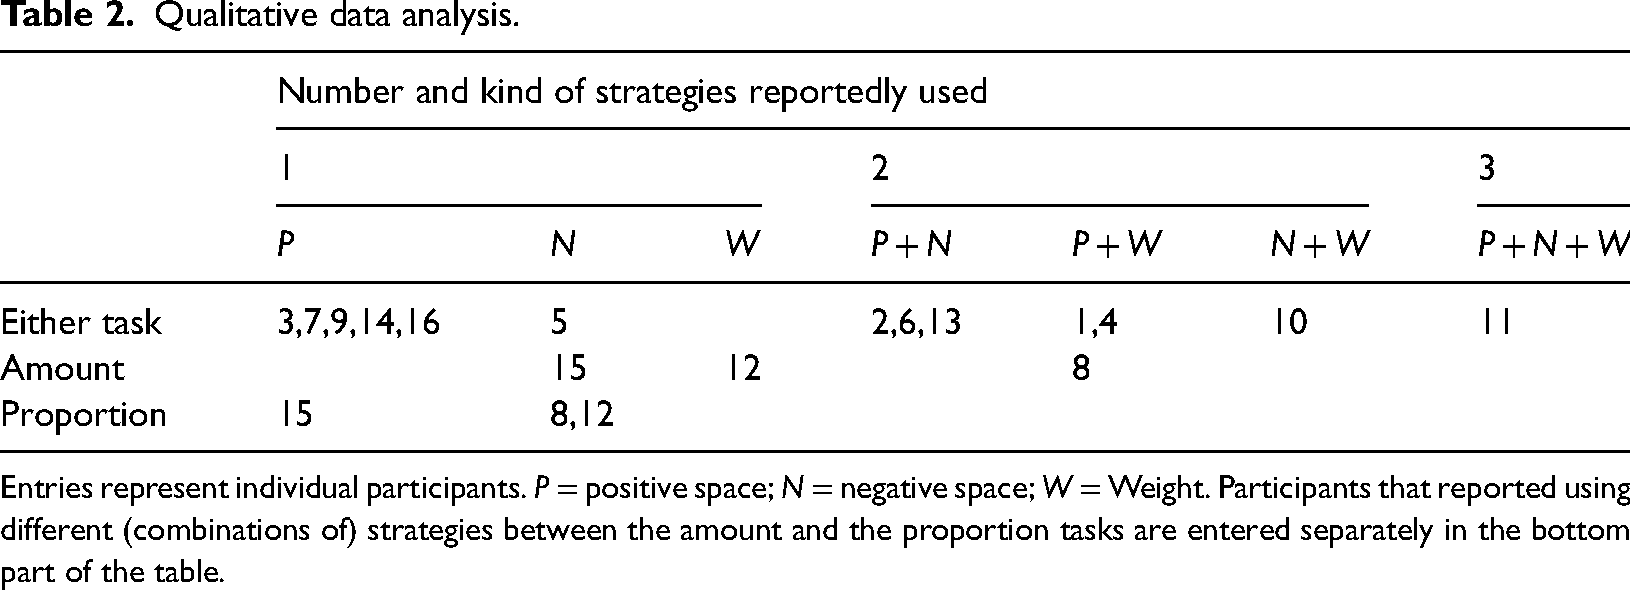
Entries represent individual participants. P = positive space; N = negative space; W = Weight. Participants that reported using different (combinations of) strategies between the amount and the proportion tasks are entered separately in the bottom part of the table.
The most common strategy appeared to have been positive space. Participants generally mentioned using the dynamic forces of the container's contents to judge quantity. This included the vibrations of the objects against the container's walls and the movements of the objects within the container. Negative space was also a common strategy; although mostly in combination with one or both of the other strategies. Participants reported shaking the containers up and down or flipping the container upside down to deduce the amount of empty space in each container. These participants mentioned paying attention to the time it took for the container's contents to “hit” the lid of the container or “fall” to the bottom of the container to infer how much empty space was left over in each container. The less excess space available, the greater their estimates and vice-versa. The weight strategy was the least common and, like for negative space, was reported mostly in combination with one or both of the other strategies. Participants reported taking into account how heavy the containers felt to infer quantity.
Discussion
This study investigated how well people can judge large quantities of objects in a container through haptic perception. On average, participants demonstrated an ability to judge different large quantities of contained objects for both “small” and “big” objects. This ability, however, depended on the framing of the task.
For the amount task, participants grossly underestimated the absolute number of objects in all containers. However, after normalization, it was revealed that participants were largely precise in judging the amount of objects in each container relative to other containers. In other words, while participants were not able to estimate exact numerosities, their judgments retained proportionality in accordance with the containers’ actual contents.
As for the proportion estimation task, participants, at a group level, were proficient in estimating the proportion of the container which was filled. As a function of weight, participants were considerably accurate in their responses, apart from a slight overestimation at the smallest proportion. The consistency here between estimates for “small” and “big” objects could be taken to mean that the internal references used by the participants were likewise based on weight, rather than volume. However, the calibrations were conceived in an ad hoc fashion and this interpretation is speculative that warrants a dedicated study. As a function of volume, small proportions of “big” objects were overestimated while those for large proportions were underestimated. Such systematic biases are reminiscent of studies in vision in which proportions less than 50% are generally overestimated and proportions more than 50% are generally overestimated (Varey et al., 1990). Moreover, in comparison to the amount task, the proportion task was subject to substantial individual differences.
Both the quantitative and qualitative analyses suggest that the amount and proportion tasks share the same perceptual processes. The quantitative data revealed substantial correlations between performance on the two tasks and the qualitative data suggest that, at least within any particular participant, strategies remain largely the same between the two tasks. Moreover, given that the results of both the normalized amount and the proportion estimates were largely accurate, we can infer that the underlying perceptual processes are mostly tuned to proportional changes in stimulus magnitude rather than absolute differences. This is of course consistent with the idea that performance is underpinned by the ANS. And if this is indeed the case, we can expect number perception in container haptics to follow Weber's Law; a testable hypothesis.
As one of the first container haptic studies investigating large quantities of objects, it features a number of limitations that constrain the generality of the conclusions that can be drawn. First, the amount task was implemented as a magnitude estimation task. While it revealed accurate performance in proportional terms, the raw estimates showed that participant were not able to accurately estimate the absolute number of objects. Before attributing this inability to limits of the (haptic) sensory apparatus, we consider the idea that it might be related to the participants’ unfamiliarity with the stimulus materials. Since it seems reasonable to assume that none of them had extensive previous experience with handling containers full of cut-up plastic straws, their chosen internal modulus would be mostly arbitrary. Future work should investigate how accurate absolute estimates can be when the content is highly familiar to the observer, or when participants first receive training.
Second, the fact that there were at least two different ways of calibrating the proportion of container content signals a certain ambiguity in knowing how full the containers were. Indeed the proportions determined by the two calibration methods did not perfectly agree. While the difference was negligible for the big straws (about 1% on average), it was considerable for the small straws. The volume calibration produced consistently larger proportion values; about 8% on average, and as high as 13% for container 5 where the calibrated proportions were 71.4% and 83.6%, for weight and volume, respectively. Not surprisingly then, using the two calibrations to assess the accuracy of perceptual estimates led to slightly different pictures. The likely sources of the ambiguity are the tapered walls of the containers and the size and shape of the objects. The tapered walls meant that there was a non-linear relation between, on the one hand, the height of the content, and on the other hand, the absolute amount of content and the volume it occupies. That is, the amount and volume change at a slightly accelerated rate as height increases. The ambiguity is not only present in the design of the current study, but is likely to be an issue in future container haptic studies that needs to be acknowledged and addressed when moving forwards. Plastic straws were chosen as the basis for the objects because they minimized weight cues. However, their size and shape affected how they occupied space within the container: unlike liquids which would assume the shape of the container, the straws were often heterogeneously arranged within the containers after being shaken. The heterogeneity was worse for the big objects: whereas the small objects were able to act more fluid-like, any set of big objects was more likely to arrange itself non-uniformly and to assume a relatively greater volume within the container.
Third, the strategies garnered from the post-experiment interviews only reflect participants’ impressions of their strategies. Given that perception may occur below the threshold of conscious awareness (Ramsøy & Overgaard, 2004), the strategies reported by the participants may not be indicative of the actual perceptual mechanisms used to perform the experimental tasks. Thus, the qualitative results are noteworthy insofar as they are suggestive of participants’ conscious experience of judging large quantities of contained objects; isolating the perceptual strategies at play may require additional investigative approaches.
Conclusion
This study was the first to document container haptics with large numerosities. The results show an ability to judge different large quantities as long as the task is framed in proportional terms. That is when estimating amounts directly, judgments retained proportionality in accordance with the containers’ actual contents and when estimating how full a container was in terms of proportions, judgments were very accurate on average; though displayed considerable individual variability. These results are generally consistent with the known characteristics of the ANS and by extension might be construed as additional evidence that the number sense is amodal (e.g., Togoli & Arrighi, 2021).
This study suggests that containers are haptically “transparent” enough to convey pertinent information to the ANS. As such it contributes to a small but growing body of studies demonstrating the ability of our haptic sense to extract veridical information from content hidden from touch because they happen to be in a container.
Footnotes
Author Contribution(s)
Declaration of Conflicting Interests
The authors declared no potential conflicts of interest with respect to the research, authorship, and/or publication of this article.
Funding
The authors received no financial support for the research, authorship, and/or publication of this article.