
Abstract
Studies have found that observers pay less attention to cast shadows in images than to better illuminated regions. In line with such observations, a recent study has suggested stronger change blindness for shadows than for objects (Ehinger et al., 2016). We here examine the role of (overt) visual attention in these findings by recording participants’ eye movements. Participants first viewed all original images (without changes). They then performed a change detection task on a subset of the images with changes in objects or shadows. During both tasks, their eye movements were recorded. In line with the original study, objects (subject to change in the change detection task) were fixated more often than shadows. In contrast to the previous study, better change detection was found for shadows than for objects. The improved change detection for shadows may be explained by the balancing of trials with object and shadow changes in the present study. Eye movements during change detection indicated that participants searched the bottom half of the images. Shadows were more often present in this region, which may explain why they were easier to find.
Introduction
Digitally manipulated images and videos make it increasingly difficult to distinguish fact from fiction. Various studies have suggested that humans generally struggle to detect changes in images, either when digitally manipulated images are presented in isolation (Nightingale et al., 2017, 2019) or when the original and manipulated image are presented side-by-side (Le Moan et al., 2018; Venkataramanan et al., 2021).
An often used paradigm to study humans’ (in)ability to detect changes in images is the change blindness paradigm (Simons & Levin, 1997; Simons & Rensink, 2005). In the standard version of the paradigm, two versions of image (the original and a digitally manipulated version) are presented in alternation. When no intermediate image or blank screen is presented between the images, changes are easily detected from motion cues that originate from the change. However, when the images are separated by a blank screen of sufficient duration, changes become difficult to find (Rensink et al., 1997). A similar situation arises when changes are made during a blink (Kevin O’Regan et al., 2000) or a saccade (Grimes, 1996), or when images are presented side-by-side (Le Moan et al., 2018; Venkataramanan et al., 2021).
Images often contain cast shadows, which provide information about the overall layout of the scene and light sources that illuminate the scene (Dee & Santos, 2011). Cast shadows indicate the size and shape, position of the object that generates the cast shadow, as well as whether the object is (partly) translucent. They also provide information about the shape, size, colour, intensity and position of the light source (Dee & Santos, 2011). Cast shadows thereby provide information about the object that casts the shadow and the surface that the cast shadow is projected on (Mamassian et al., 1998), and consequently, the spatial layout of the scene (particularly for moving shadows). Cast shadows can also reveal objects that are outside the image (Dee & Santos, 2011; Ehinger et al., 2016).
There are indications that humans fail to consistently use the information provided by cast shadows. Art works do not always show shadows (Cavanagh, 2005). Items that could be perceived as cast shadows took longer visual search times than other objects (Rensink & Cavanagh, 2004; Porter et al., 2010). While some studies have suggested that inconsistently illuminated objects are easily detected in a visual search (Braun, 1993; Enns & Rensink, 1990), others have suggested an effortful visual search for such inconsistencies (Ostrovsky et al., 2005). When asked to indicate whether a computer-generated city scene contained an inconsistent shadow, people were only slightly better than chance level (Nightingale et al., 2019). When asked to position or scale a shadow so that it was consistent with the remainder of the scene, performance was also poor (Nightingale et al., 2019).
The differential role of shadows on perception may relate to visual attention in the presence of cast shadows. When participants were asked to judge faces that had a cast shadow over one half of the face, more attention was placed on the illuminated half of the face than the other half (Hermens & Zdravković, 2015). Such a strategy makes sense, since information extraction can be expected to be better in the higher contrast region of the face. Likewise, when observers are asked to match the colour of objects, they focus on the best illuminated regions of each object (Toscani et al., 2013). Moreover, during a visual search task, participants make more saccades when searching for shadows, although it is unclear how to interpret this finding (Porter et al., 2010).
In agreement with less attention for shadow regions of a face (Hermens & Zdravković, 2015), a recent study reported that shadows are at a disadvantage in a change blindness paradigm (in line with an earlier study by Wright, 2005). Using an online experiment, Ehinger et al. (2016) asked participants to detect changes in alternating images with an object change (an object deletion or colour change), or a shadow change (copy, deletion, rotation, or translation). While no differences in reaction times or time-outs were observed between object and shadow changes, object changes were detected with higher accuracy than most shadow changes. These results were independent of whether the shadow change was related to an object inside or outside the image (i.e., whether the source of the cast shadow could be seen).
The authors speculated that the stronger change blindness for shadows may be the result of a reduced attention for shadows in images. If it is accepted that shadows are less salient than objects, the reduced change detection performance for shadows would be in line with the observation that eye movements converge more quickly to salient changes than less salient changes (Boyer et al., 2011). The present study aims to directly test the link between saliency of shadows and objects and change detection. First participants were asked to freely view each of the images before the change. They were then asked to perform a change blindness task on the same images. If poor change blindness for shadows (compared to objects) is due to reduced attention for such areas of the display, we expect shorter dwell fixations and fewer fixations of the shadow changes in the images than of the object changes. Furthermore, within each category of changes (objects and shadows), it may be expected that objects or shadows that are fixated less often (for example, because they are further away from the centre of the image, because they are smaller in size or because they are less salient) will be more difficult to detect in a change blindness paradigm.
The same images as in Ehinger et al. (2016) were used, but some changes were made to the experimental design. Some of these changes were introduced to adopt the experiment from an online setting to an in-lab eye tracking setting. Such changes include the a reduction of the time-out interval, the removal of filler items (both to reduce the overall testing time and therefore the time that participants had to sit in a somewhat uncomfortable chin-rest), and a side-by-side presentation of the images (so that eye movement recordings could be more easily linked to the pre- and post change images).
Others changes to the original design were made to avoid a possible bias towards object changes over changes in shadows. The study by Ehinger et al. (2016) appears to have used a large number of filler items, some without a change (around 17%), but many with a change in an object (but not a shadow). During instruction, participants also seem to have been provided an example of an object change, but not a shadow change. When asked at the end of the study, around 60% of participants indicated to have noticed the shadow changes, and those who reported the shadow changes showed a smaller advantage for objects. It is, however, unclear at what point the first shadow change was detected by these 60% of participants (towards the end or early on in the experiment).
To ensure an equal focus on objects and shadows from the start of the experiment, we therefore informed participants that the changes they had to find could be either in objects or shadows in equal numbers. To avoid that this information would bias participants during free viewing of the images, this information was only provided after having freely viewed the images and before the start of the change detection task. Despite these changes in the paradigm, based on longer search times for shadows in visual search (Rensink & Cavanagh, 2004) and reduced attention cast shadow regions in faces (Hermens & Zdravković, 2015), we still expect better change detection for objects than shadows.
Methods
Participants
Forty-two students at the University of Lincoln (UK) were recruited from the study participation system at the School of Psychology. Participants took part in return for course credit. They all provided written consent for the study that was approved by the ethics committee of the School of Psychology of the University of Lincoln (UK).
The minimum number of participants was based on typical sample sizes in eye tracking studies (30 or more) and in the change blindness study that inspired the present study (Ehinger et al., 2016) (21 and 24 in each of the two experiments). The main aim of the study was to determine whether fewer fixated changes during free viewing were associated with fewer detections in the change detection task (i.e., a correlational study). The minimal sample therefore involved both images and participants (lower variance per image). This situation is similar to a mixed effects analysis (with includes both stimuli and participants as random factors), for which around at least 1600 combinations of stimuli and participants are recommended (Brysbaert & Stevens, 2018). Our free viewing (94 images times 44 participants) and change detection (64 images times 44 images) tasks both meet this requirement.
Apparatus
An Eyelink 1000 system (SR Research, ON, Canada) was used to record the eye movements of the participants. Stimuli were presented using the Experiment Builder software (SR Research) on a Viewsonic VX2268WM flat computer monitor, set at a resolution of 1280 by 1024 pixels, corresponding to 45.7 by 37.3 degrees of visual angle at the 80
Stimuli
During the (always first) free viewing block of the experiment participants saw all 94 original images provided by Ehinger et al. (2016). The reason for using all images in this block, and not just the images presented in the subsequent change detection block, was that dwell times and fixation frequencies collected during free viewing would ultimately also allow for a comparisons original data from Ehinger et al. (2016).
During the second, change detection block, participants were (unknowingly to them) split into two groups. For each scene, one group received an object change, whereas the other group received a shadow change. Object and shadow changes were distributed equally across the two groups, so that both groups received equal numbers of object and shadow changes.
Shadow and object changes were selected from the original set in the order of the numbering of the images. This led to a final set of 32 object changes and 32 shadow changes of which 14 were a shadow deletion, 11 a shadow copy, 4 a shadow rotation, and 3 a floating shadow (Figure 1). The lower numbers of shadow rotations and floating shadows were a consequence of how images were sampled from the original set of images, in which there were fewer shadow rotation and floating shadow images than of the other categories (Ehinger et al., 2016). In the interpretation of the results, the main focus will therefore be on the comparison of interest, namely between shadows and objects (each 32 images). Some graphs will show the different shadow conditions, where it is important to take into account the relatively small number of images in the shadow rotation and floating shadow conditions. The statistical analysis, using a mixed effects analysis with random factors for participants and images, performed on all data (i.e., no pooling across images), takes these smaller numbers of images in the two conditions into account.
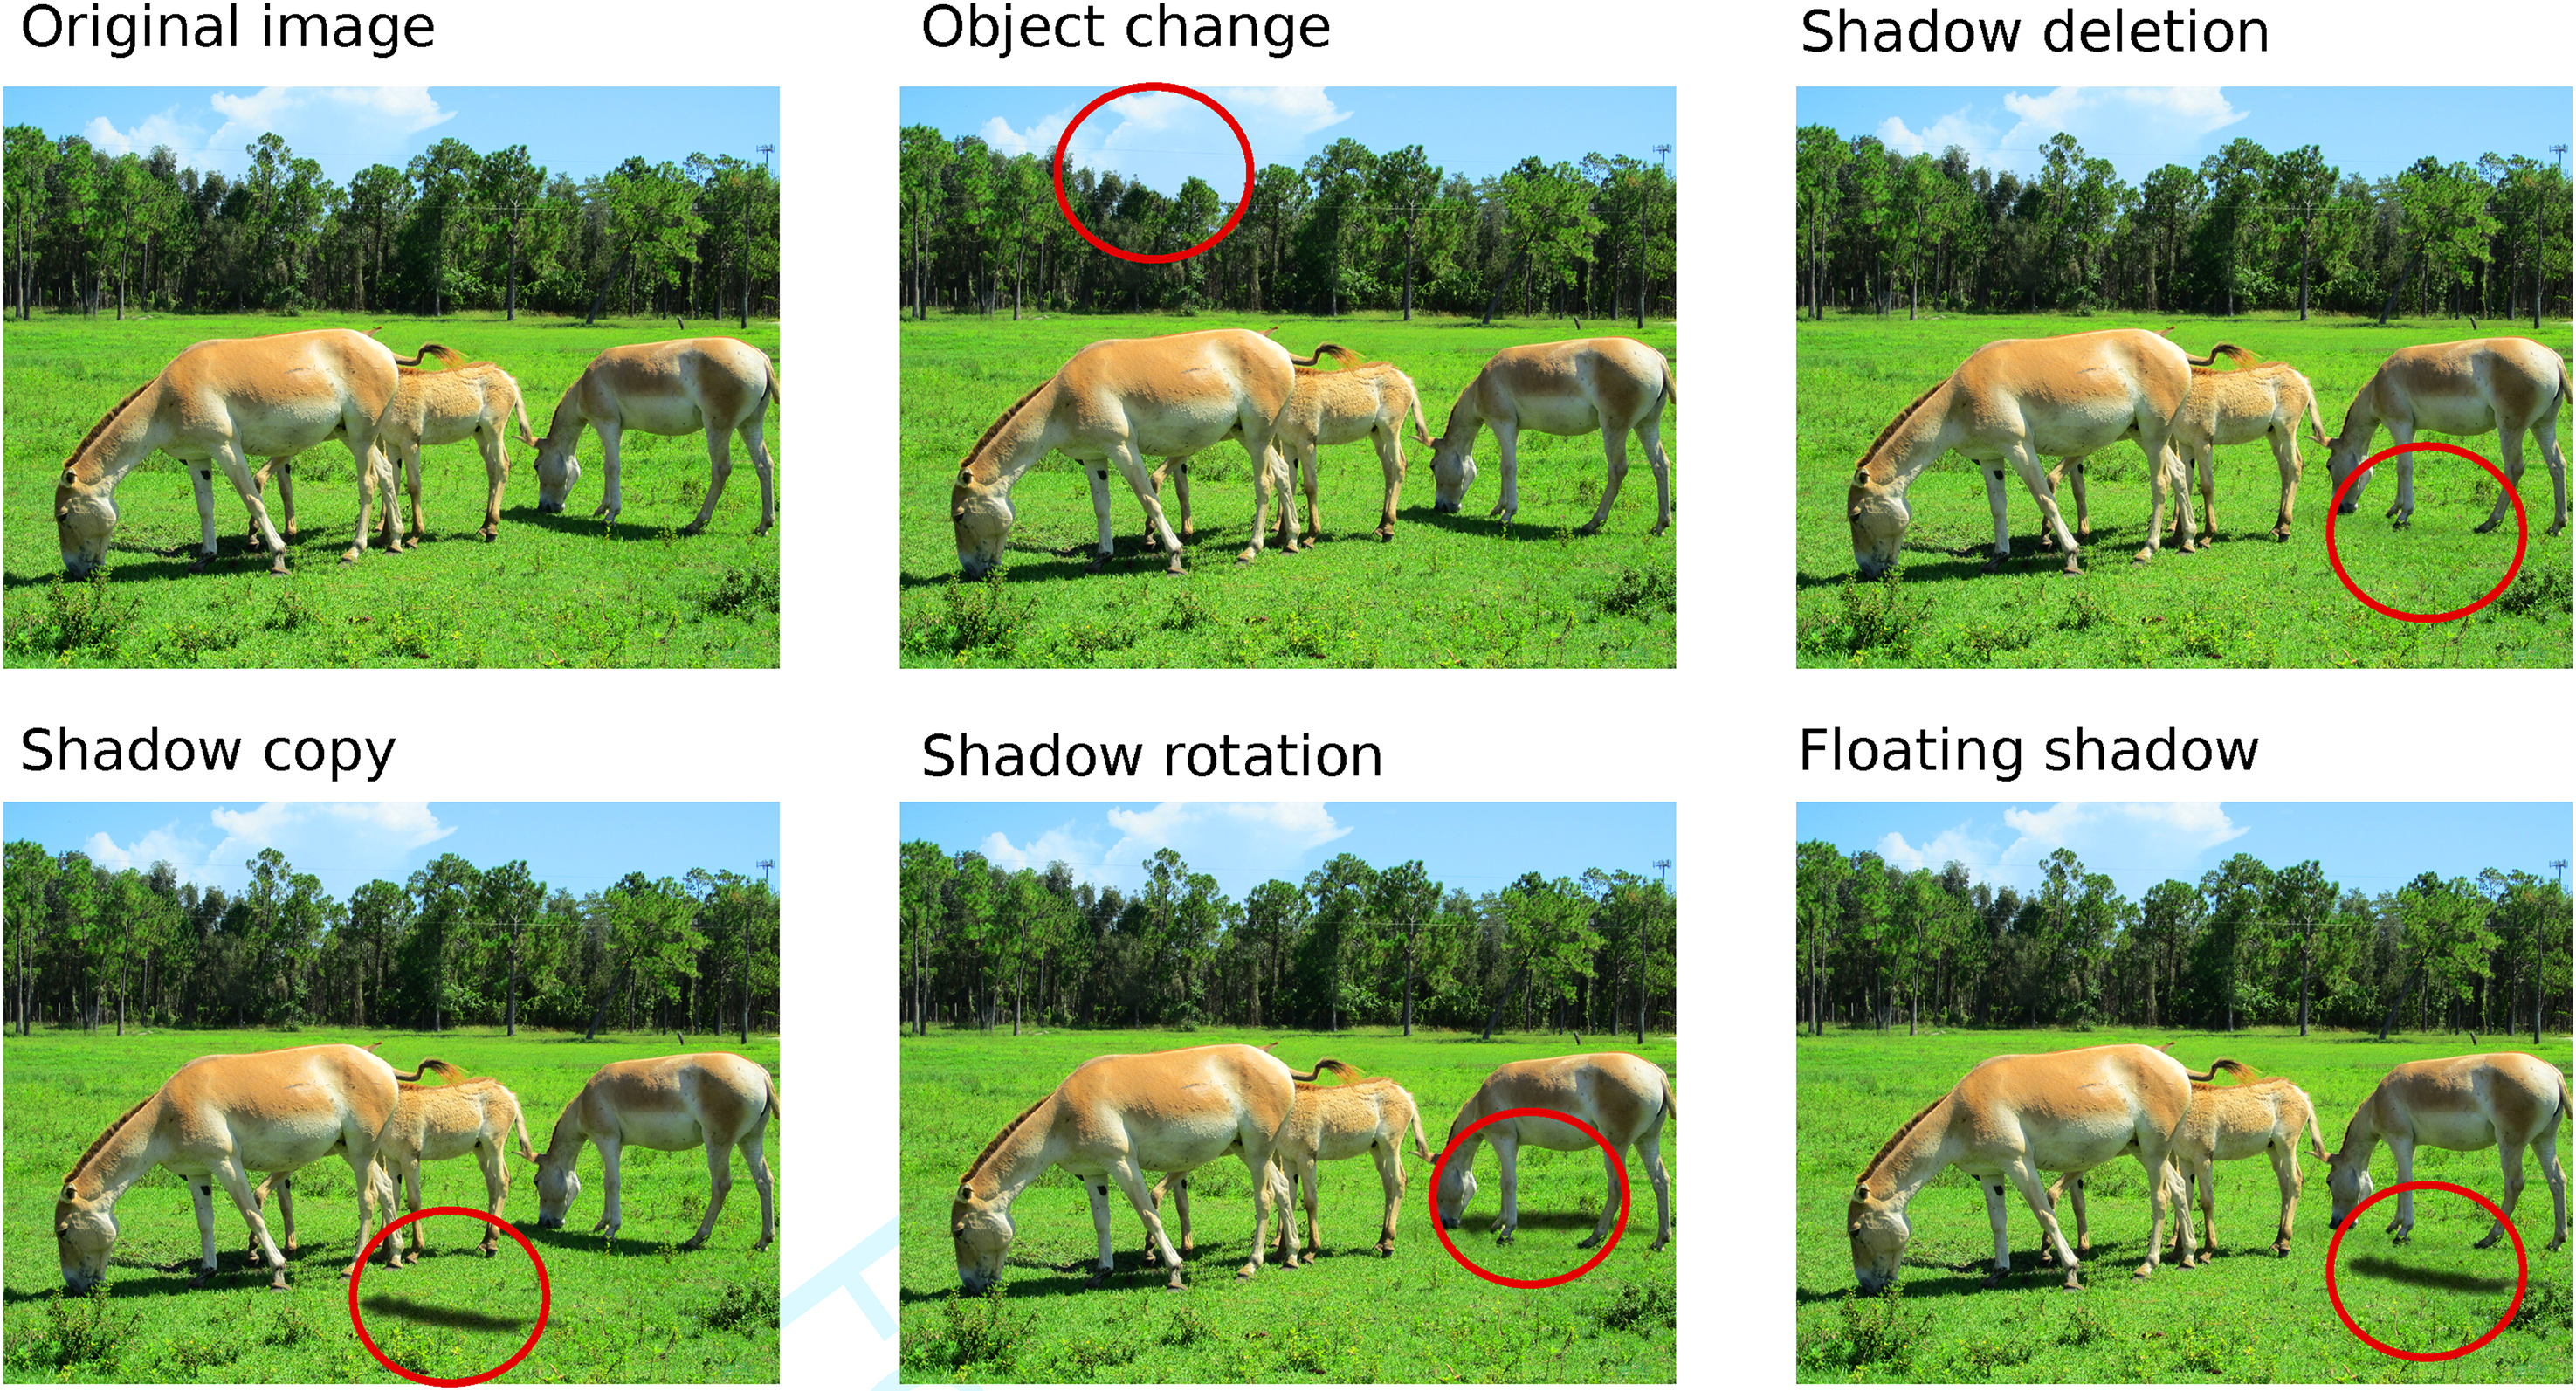
Examples of the stimuli, using images from Ehinger et al. (2016). Note that we use the term ‘shadow copy’ where Ehinger et al. (2016) use ‘surface change’ (in this particular example, there is a copy of the shadow below the horse on the right).
Design
The experiment used a within-subjects design, testing the effects of type of change (object or shadow) on various eye movement parameters (during free viewing and change detection) and on change detection performance (detection rates and response times). The order of trials was randomised for each participant to reduce order effects in the average data. To ensure that each image (scene) was equally often shown with an object and a shadow change, participants were split into two groups for the change detection task. If an image was presented with a shadow change in one group, that same image would be shown with an object change in the other group. Shadow and object changes were distributed across the two groups such that each participant saw equal numbers of object and shadow changes. Participants always performed the free viewing task first, so that the search of the change was always similarly biased by having seen the images before.
Procedure
Participants were tested individually. Before taking part, they were informed that they would first see a series of images, and would then have the task to detect changes between pairs of images, after which written consent was sought from each participant.
They then took place in the head-and-chin rest positioned at around 60cm from the computer screen, after which the default 9-point calibration of the Eyelink 1000 system was used until calibration points were aligned with the 3 by 3 grid on which the calibration targets were positioned, and the calibration was considered to be good according to the system (with a reported worst point error below
During the free viewing task, all 94 images were presented one by one, each for 2500ms, and separated by a drift correction target (presented to the left, right, top or the bottom of the image) that was shown until the participant fixated the target and the experimenter confirmed fixation with a key press.
After a short break, participants were verbally informed about the change blindness task that they were going to do, and informed that they had to look for either changes in objects or in shadows, in similar numbers. The change detection block was then started. It was split into sections of 10 trials each, separated by a message to take a short break.
Each trial in the change detection block started with a centrally presented drift correction target, which also served as a check of whether calibration had to be repeated if participants took their head out of the chin rest during the break. After confirmation of fixation by the experimenter, the two images were shown left and right of fixation for a maximum of 15 seconds or until participants pressed a key to indicate that they located the change, after which they used to mouse to click on the change.
The total duration of the experiment depended on how difficult the change detection task was for each participant, but most commonly lasted between 30 to 45 minutes. After completing the two tasks, participants were debriefed about the purpose of the experiment and were shown the changes that they had not found within the 15 seconds intervals.
Data Analysis
In order to find the regions of interest for the classification of eye movements and for computing properties of the changes, such as the size of the area and the distance towards the centre of the image, we compared the original and modified images using the openCV toolbox in Python. The difference image (absolute differences) was converted to grayscale, thresholded (pixels with a value of 20 or more were set to 255, i.e., white) and contours were detected.
The has been some debate about the best way of coding regions of interest (ROIs). Some software packages allow the use of rectangles and ellipses, while others allow for the use of more complex shapes (Hessels et al., 2016). Without custom-made software, any type of shape ROIs can be used by creating an ROI-image (such as shown in Figure 2), superimposing fixations onto these images, and by determining the color positioned behind each fixation (for the examples in Figure 2; green = change, black = background).
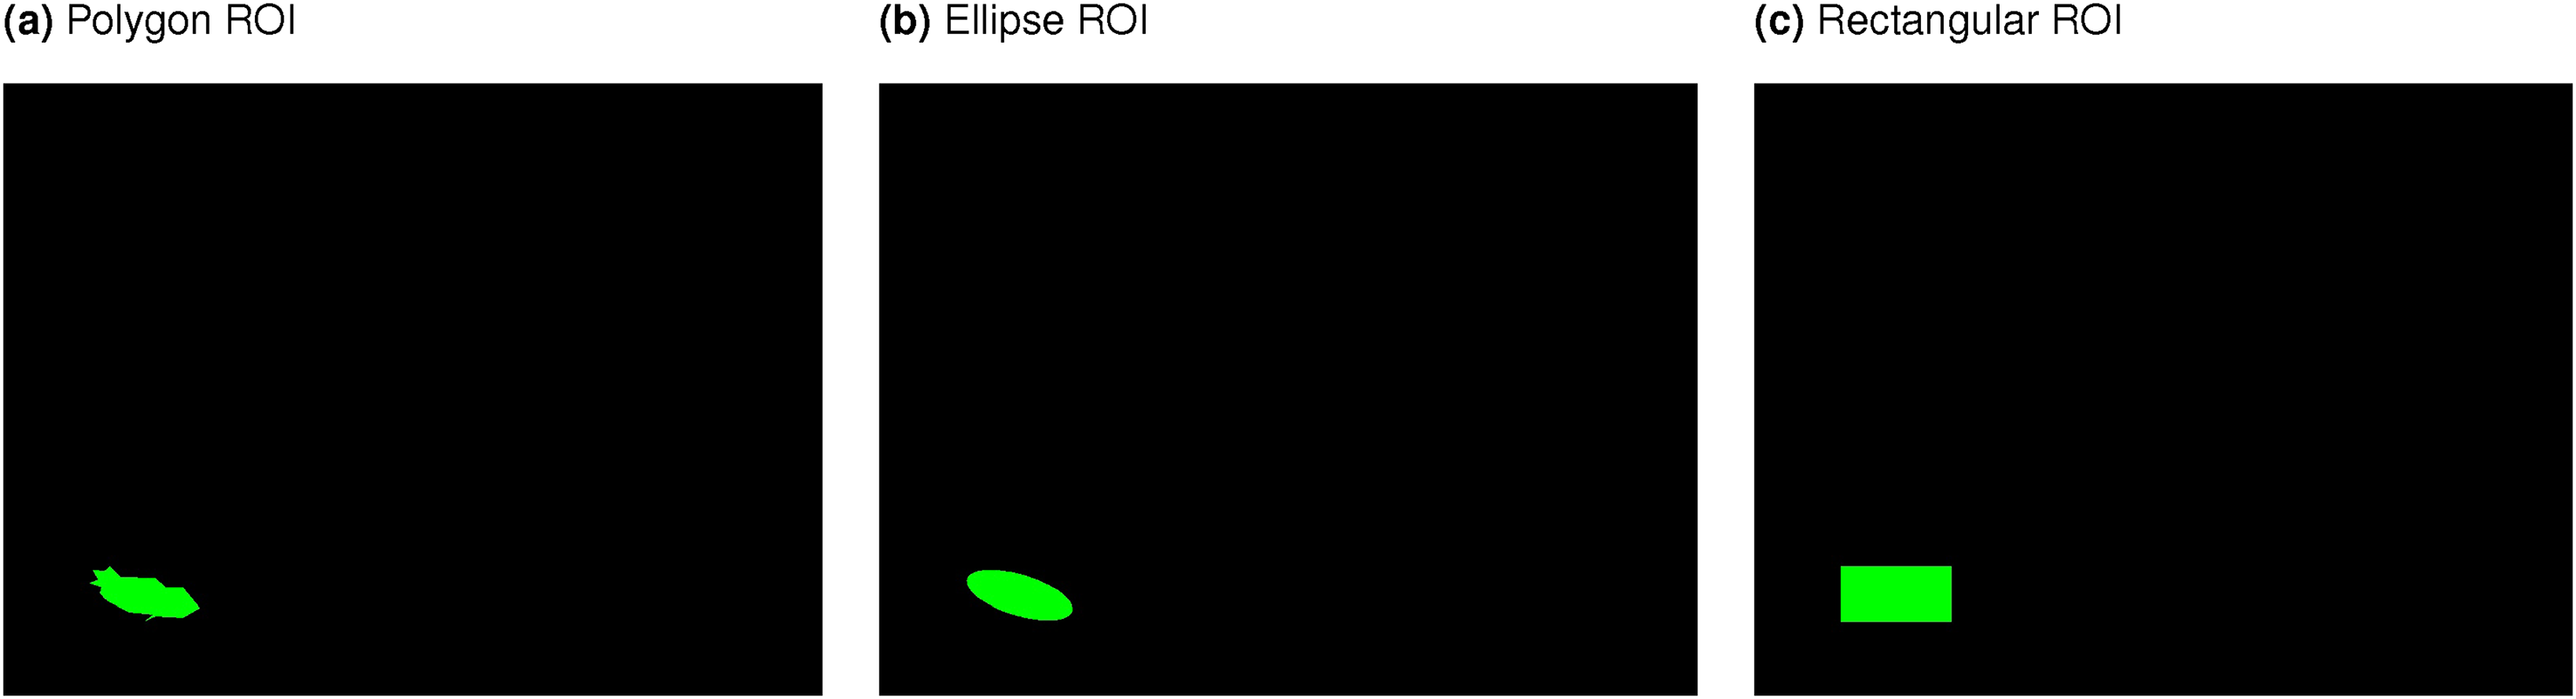
Automatically detected ROIs, which were based on taking the difference between the original and changed image, thresholding, detecting bounding areas (polygons), fitting either bounding polygons, ellipses or rectangles around these areas with a minimum surface area (to avoid fitting regions around noise). The procedure differs from that reported in a poster in that bounding boxes were fitted around detected polygons, rather than on the thresholded image, avoiding fitting boxes are noise pixels.
Without such a method, rectangles and ellipses have the advantage that the allocation of fixations to ROIs can be controlled with simple decision rules, whereas such rules become more complicated with more complex shapes. Rectangles and ellipses also have the advantage that they can easily be expanded around the centre without affecting the overall shape of the region, to counteract any effects of noise in the recording (one direct comparison showed more fixations to be allocated to ROIs when using widened bounding boxes, but no change in differences between conditions, Hermens & Walker (2016), others recommend that the margin should depend on whether adjacent ROIs may overlap, (Orquin et al., 2016)).
Rectangles, in particular, have the disadvantage that parts of the background can enter the ROIs unintentionally. For example, when a rectangle is drawn around an arm pointing at a 45 degrees angle into the air, the rectangle will contain many pixels of the background rather than the arm (Hermens & Walker, 2016). To examine whether the shape of the ROIs had an effect on dwell times and counts of whether the region was fixated, we compared three shapes of ROIs: polygons, ellipses and rectangles, as shown in Figure 2. In later analyses, we used the polygons to compute the centres of the ROIs and the areas of the ROIs (for an analysis of whether these two factors influence detection rates).
To avoid ROIs around very small regions (noise) only regions were used of at least 80 pixels (based on visual inspection of the results). Detected regions were visually inspected to ensure that they indicated the change in the image. In the first run of the analysis, we found that drawing bounding boxes directly onto the difference image led to noise pixels to mark entire image as one large ROI for a few images (which strongly biased the results, as presented in our poster at ECVP 2021). This was corrected by first fitting contours and then fitting polygons, ellipse or bounding boxes around these contours.
Results
Change Detection Performance
We first focus on performance in the change detection task to examine whether with the changed design (no object change fillers), instruction (indicating both object and shadow changes) and presentation (side-by-side instead of alternating) the advantage for object changes could be replicated (Ehinger et al., 2016). To examine whether incorrect responses had to be removed, visual inspections of the locations of the mouse-clicks was performed. These showed that when participants indicated to have found the change, they located it correctly, with the exception of one participant who clicked on 6 locations that were not changes. This participant was removed from the analysis. With this participant excluded, we treat responses within the 15 seconds interval as correct change detections (for a few trials the software failed to stop recording after 15 seconds, but we censored these trials to 15 seconds in line with the vast majority of trials).
Strong individual differences were observed in the detection rates. Figure 3a shows that participants varied substantially in how often they found the change within the 15 seconds interval, from around 10% to around 50%.
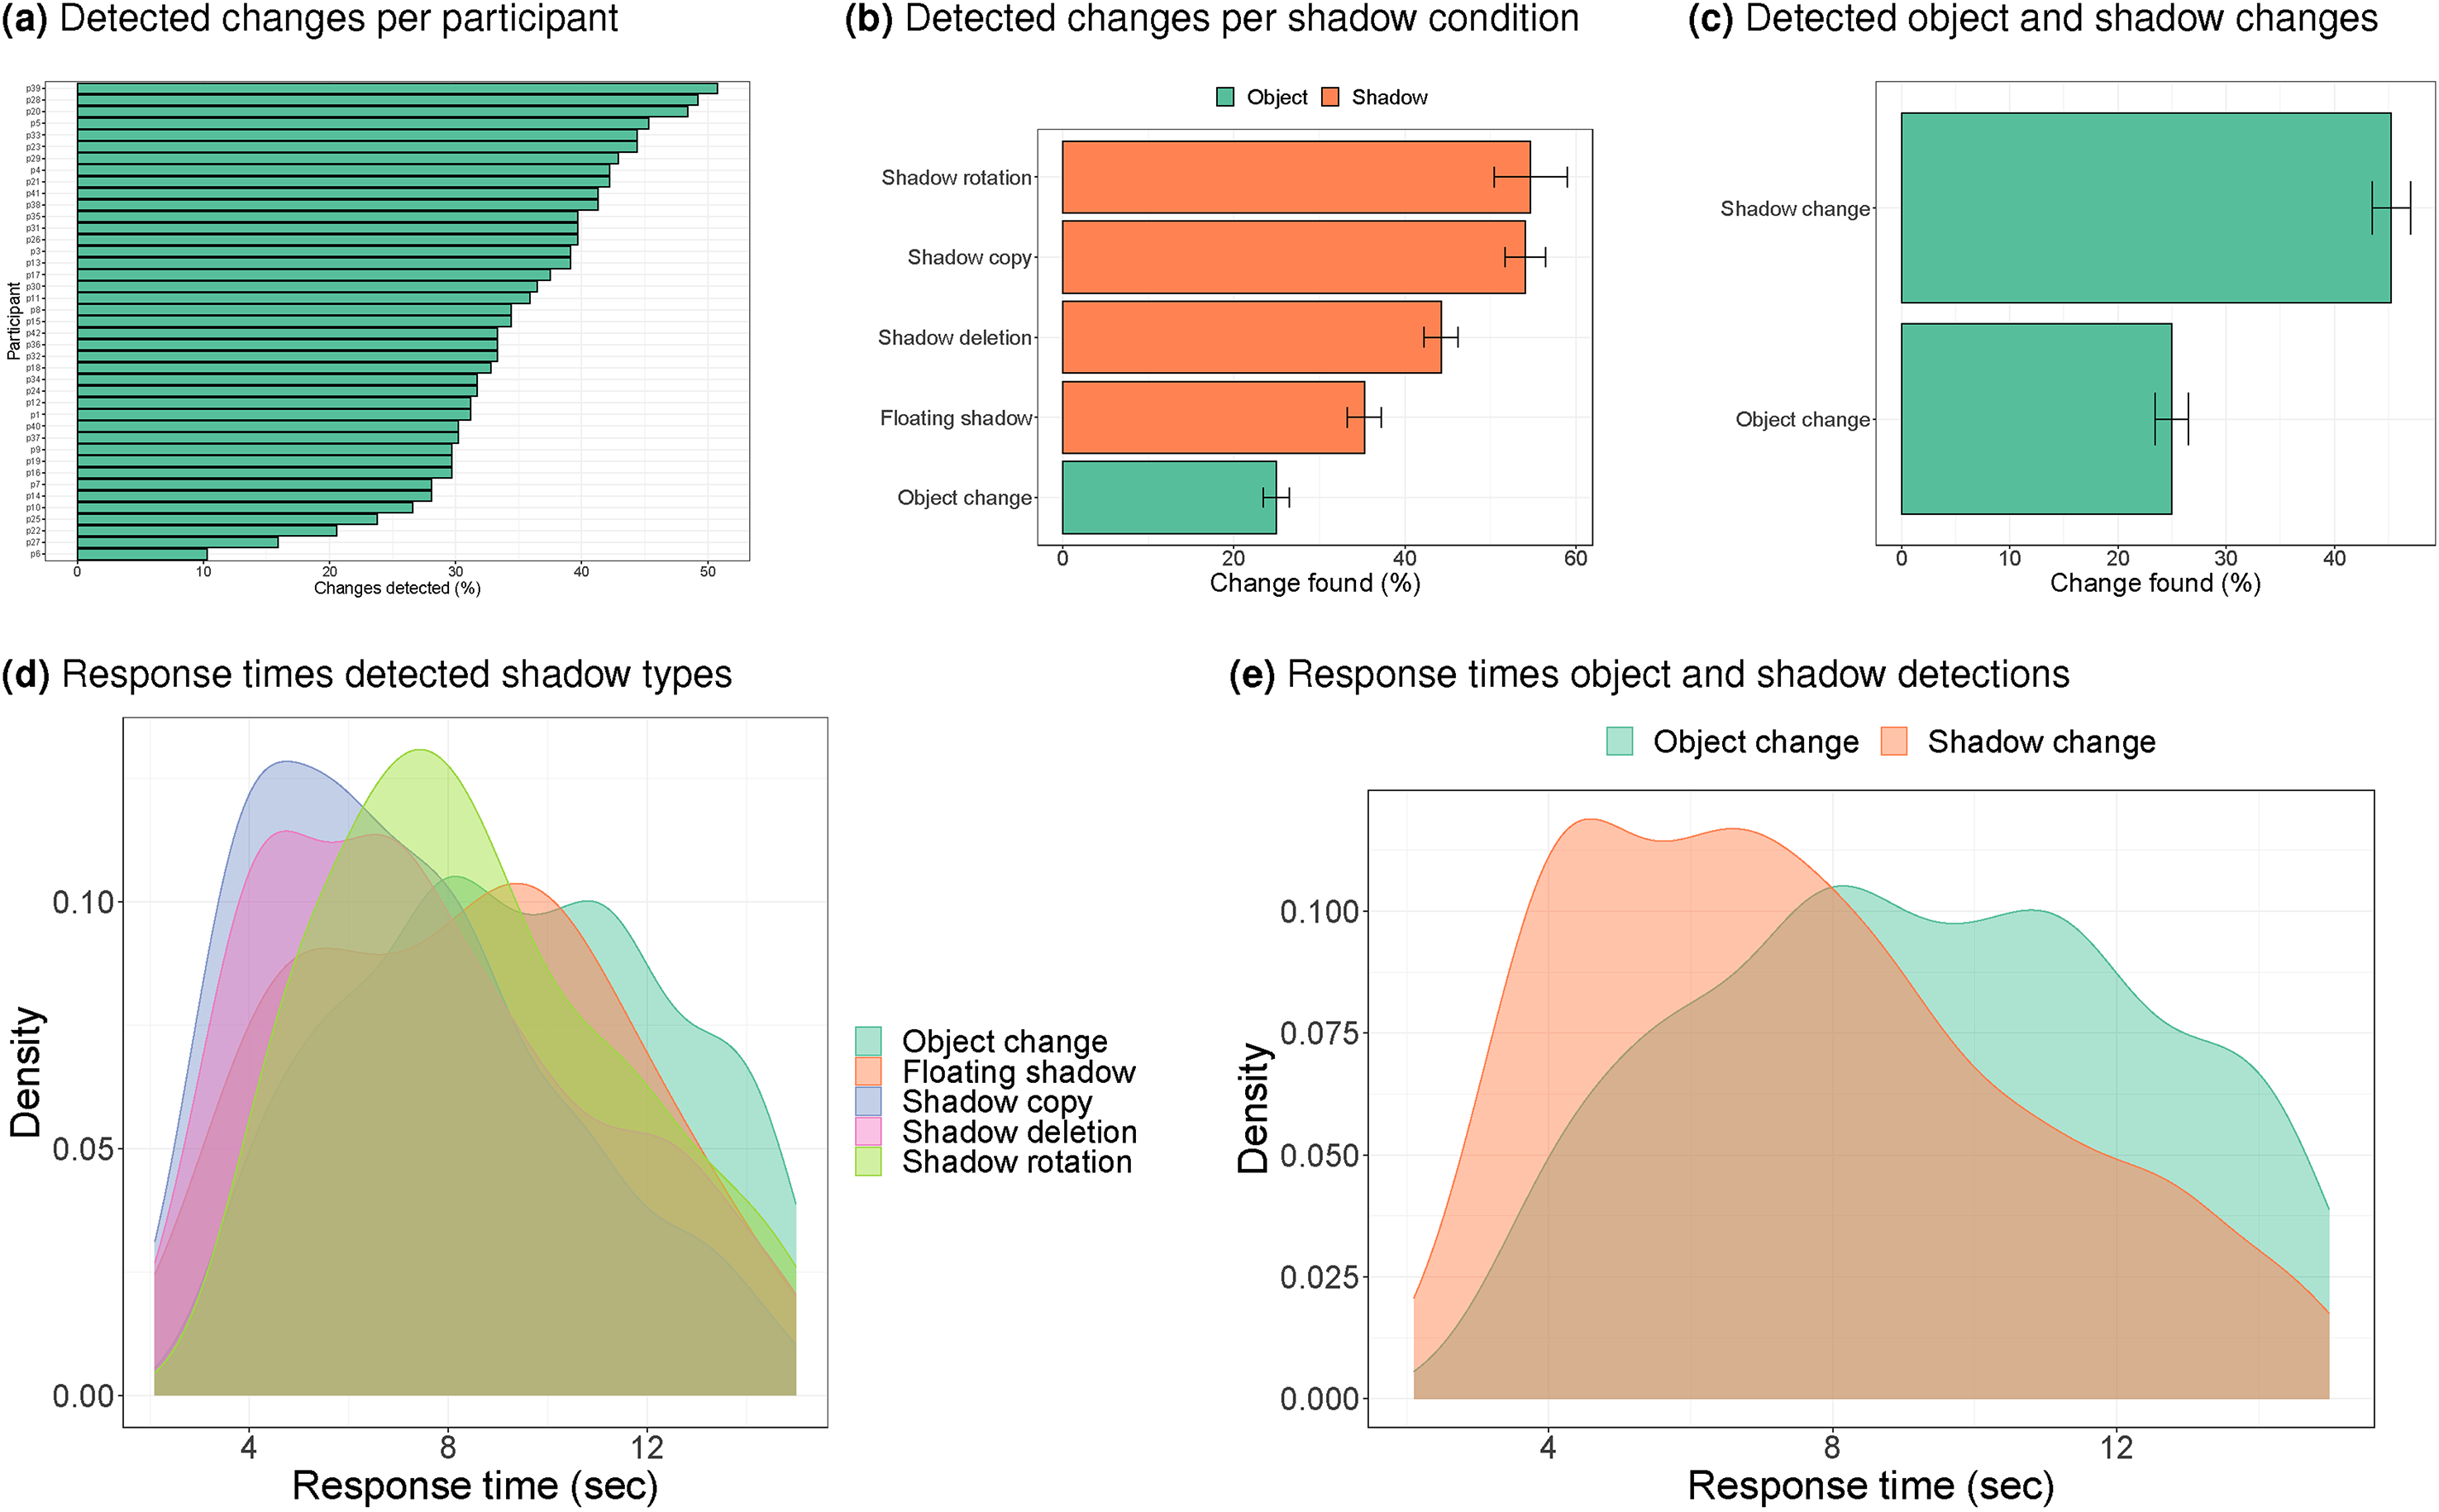
Detection rates and distribution of reaction times when the change was detected. Error bars show the standard error of the mean across participants. Note that the averages in (b) and the distributions in (d) may be based on different numbers of images (for details, see the ‘stimuli’ section). The averages and distributions in (c) and (e) are based on the same number of images. Note. Please refer to the online version of the article to view the figure in colour.
To compare detection rates across conditions, we first pooled responses per condition within each participant and then across participants (so that the corresponding standard errors reflect the standard error of the mean across participants). The resulting detection rates for all types of shadow changes exceeded that for object changes (Figure 3b), in contrast to Ehinger et al. (2016), who found no differences in rates between shadows and objects.
To examine which of these differences were statistically significant, we used a mixed effects logistic regression with random intercepts for participants and for images, allowing for variations in baseline rates across participants and images. A statistically significant difference was found between the chance of detecting the change in each shadow condition compared to the object condition (all
Pooled across shadow conditions, the advantage for shadow changes is confirmed in the average data (Figure 3c) and in a mixed effects analysis, showing that the chance of finding a shadow change before the 15 seconds time-out was significantly higher than finding an object change (
A similar advantage for shadows over objects was also found in the distribution of search times (when the change was detected within 15 seconds, see Figure 3d and 3e). A mixed effects analysis of the reaction times with participant and image as random factors showed a significant difference between search times for shadows and objects (
Survival analysis
The analysis of the behavioural responses so far has considered time-outs (failures to find the change within the 15 seconds interval) and response times within the time-out interval separately. These two measures can be combined into one analysis by using a survival analysis. In such an analysis, response times that are longer than the time-out interval (15 seconds) are treated as censored data. This means that the analysis assumes that these response times are longer than the time-out interval, but it leaves open how much longer.
Standard packages for drawing survival curves, assume that each participant generates one observation (survival analysis was developed for tracking survival of patients). The curves in Figure 4 therefore reflect ‘survival’ (of the change from detection) by assuming that repeated trials from participants are independent. The curves therefore need to be interpreted with some caution, and instead, conclusions about differences between conditions need to rely on statistical analysis (reported below). The curves in Figure 4a and b suggest better performance for detection of almost all shadow changes (except floating shadows) than of object changes.
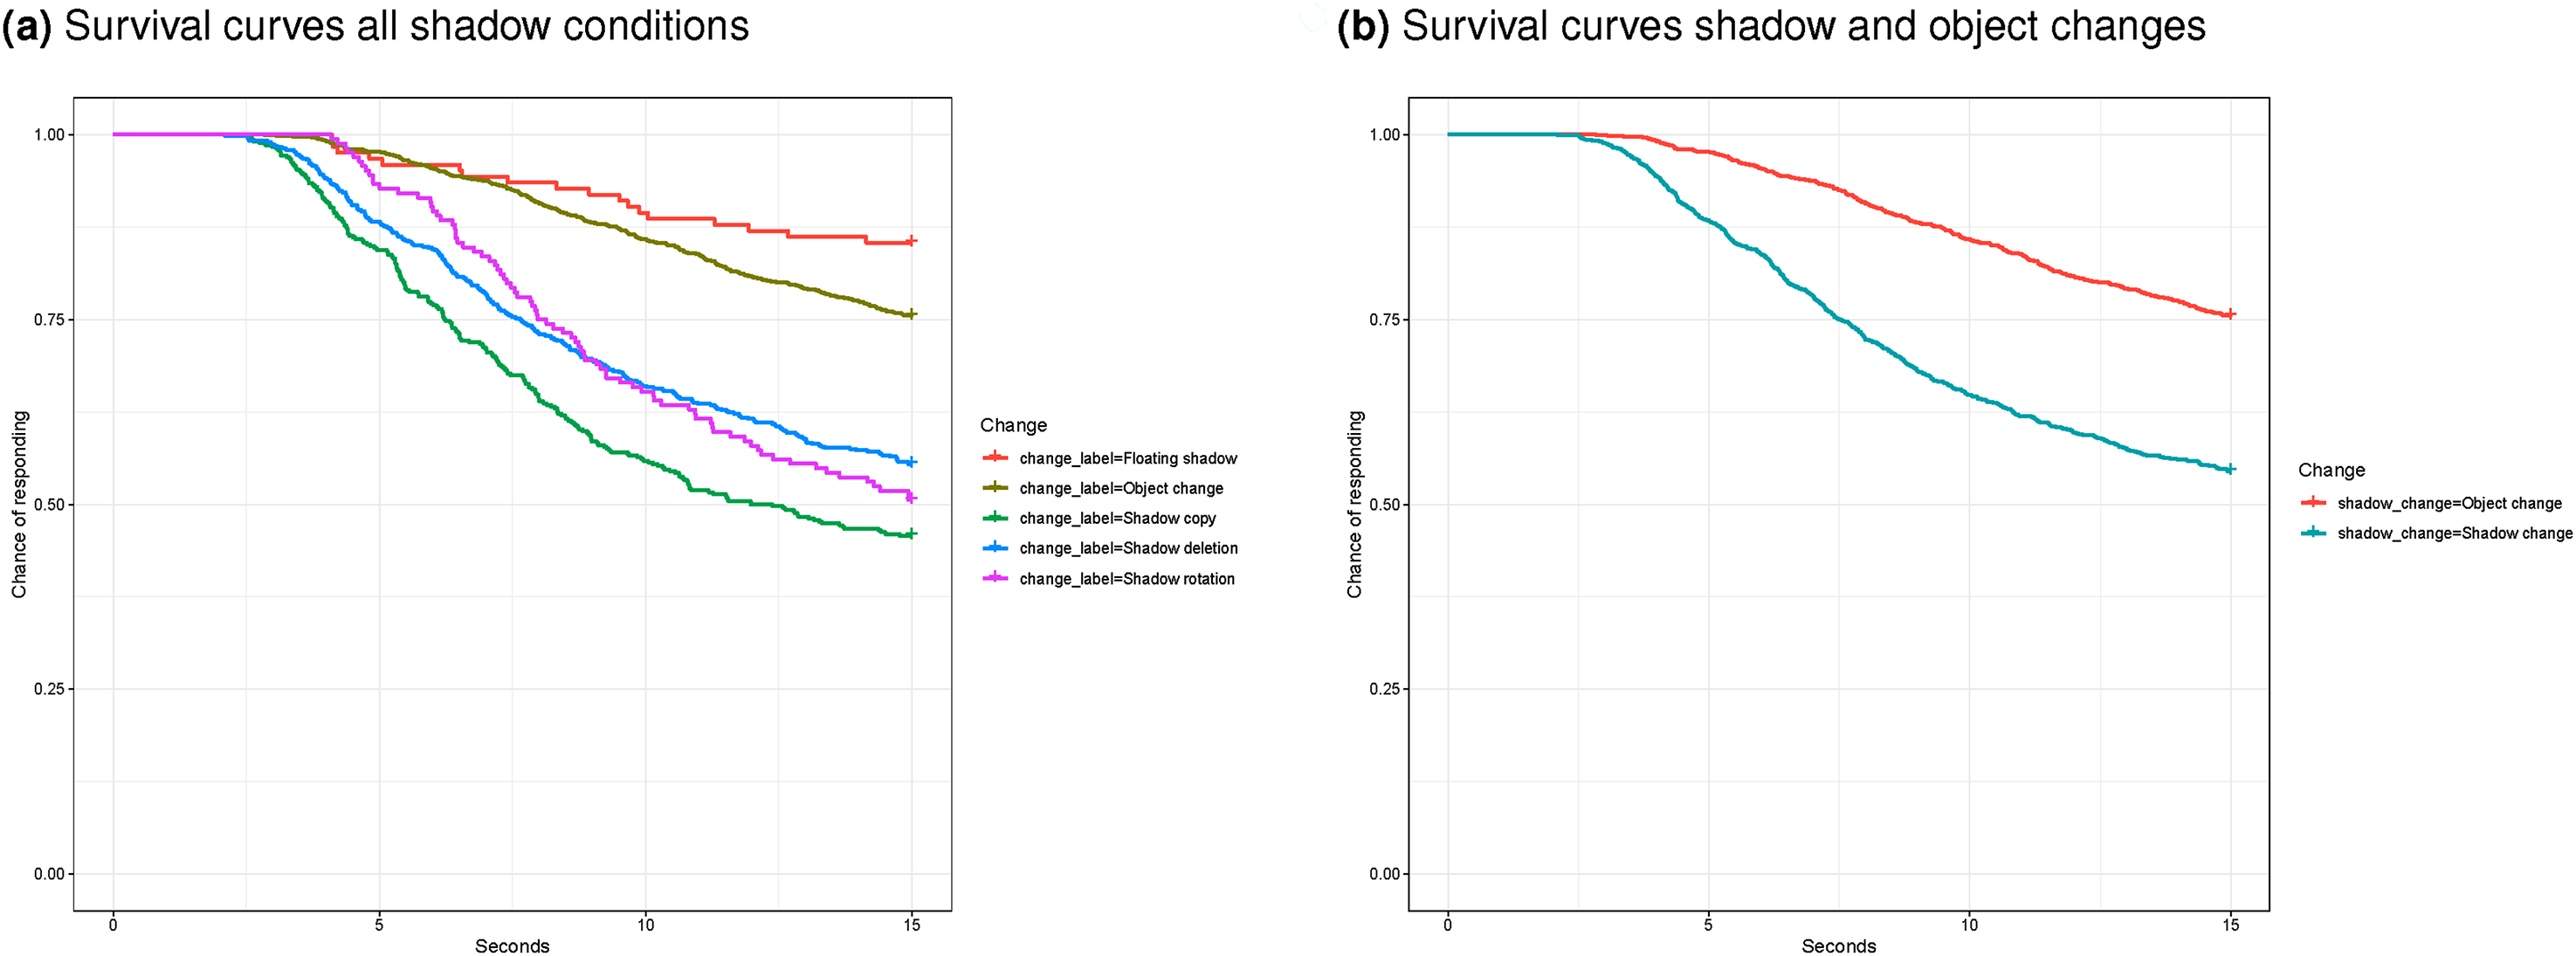
Survival curves, representing the chance of failing to find the change until the time point on the horizontal axis, (a) per shadow change (number of images per condition may differ) and (b) comparing all shadow changes and object changes. The software used to draw these curves assumes that the individual responses are independent.
To take into account the likely interdependence of the repeated responses per participant, a mixed effects Cox regression was performed. The results indicate that performance is significantly better for object changes than for floating shadow changes (
Eye Movements During Free Viewing
We next turn to investigating where participants viewed during the free viewing task that preceded the change detection task (i.e., participants at this stage were unaware of the regions that they were going to have to find). As indicated in the data analysis section of the methods section, we compare three methods to code for the regions of interest: polygons, ellipses and bounding boxes, in order to determine whether the exact coding of the regions of interest influences the results (bounding boxes will span a larger region than ellipses and polygons, taking more of the area surrounding the change into account).
Figure 5 shows the dwell times (as a percentage of the overall trial duration) and the percentage of trials with at least one fixation on the ROI for the three methods of defining the ROIs (polygons, ellipses and bounding rectangles). Some small differences are found between the three methods and the dependent measure (dwell times or percentage fixated), but the overall pattern is the same. The ROIs of the object change were fixated more frequently than the ROIs of the shadow change (i.e., the original position of the shadow that was deleted, shifted or rotated, because the final position of the shadow is not part of the original images used in the free viewing task). These differences are significant in mixed effects analyses of the effect of type of change (shadow versus object; p < 0.001 for all comparisons).
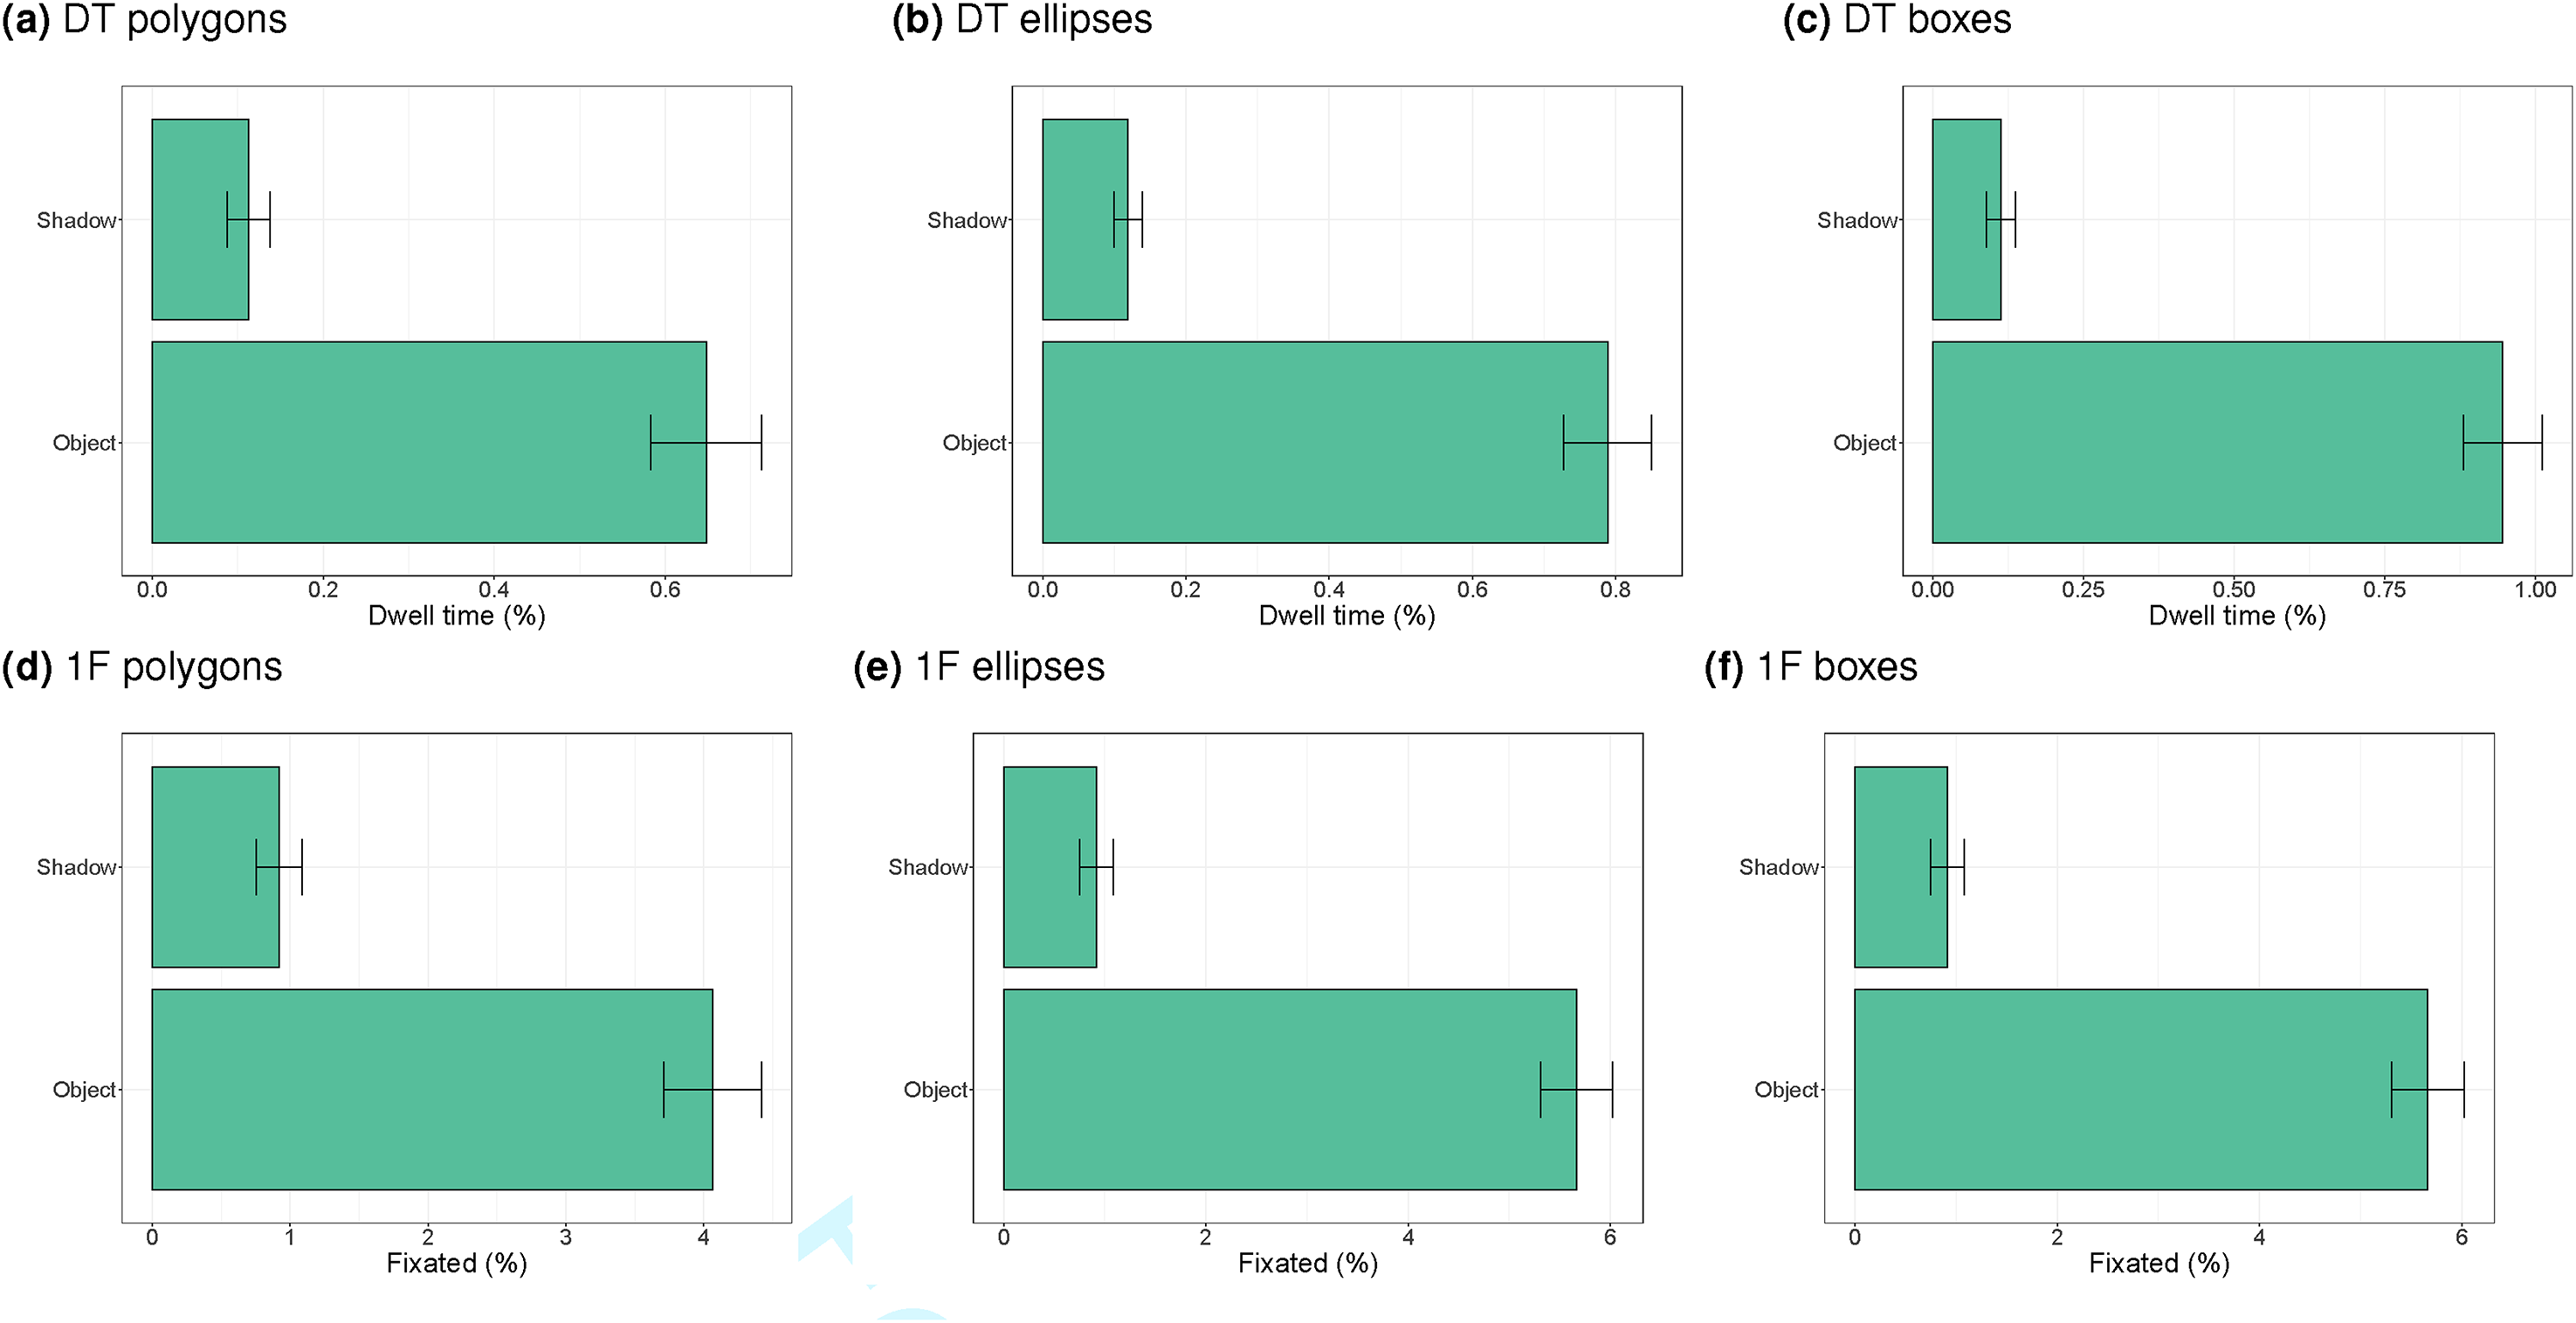
Dwell times (DT), as a percentage of the trial duration, and trials with at least one fixation (1F), as a percentage of the total number of trials, on the basis of polygon, ellipse and rectangular regions of interest (ROIs). The values are based on free viewing of all original images from Ehinger et al. (2016).
Note that the values were computed across all original images (Ehinger et al., 2016). This means that our free viewing data provide an explanation of the original finding of better detection of objects than shadows. Objects were more salient (in terms of eye movements) than shadows. That said, the numbers in Figure 5 are small: less than 1% of the time participants looked at the change ROIs and on most of the trials people did not look at the change ROIs.
Some perception may occur when fixating close to the change region rather than on the change region (peripheral vision). There are different ways to investigate how often people fixate near the region of interest. One could increase the size of the regions of interest and count how often participants look at theses larger ROIs. Alternatively, the centre of gravity of each change can be used and the distance between each fixation and centre of gravity determined. Centres of gravity will also inform where in the images the changes occurred, which can then be compared with the overall distribution of fixation locations, which is known to be biased around the centre of the image (Tatler, 2007).
We first examine where in the images the changes occurred. Figure 6a plots the distribution of the centres of object and shadow changes. This plot suggests that most shadow changes occurred in the bottom of the images, whereas object changes sometimes also occur in the top region of the images. The larger symbols for the shadows also suggest that the regions occupied by shadow changes may be larger than by object changes. Figure 6b and a
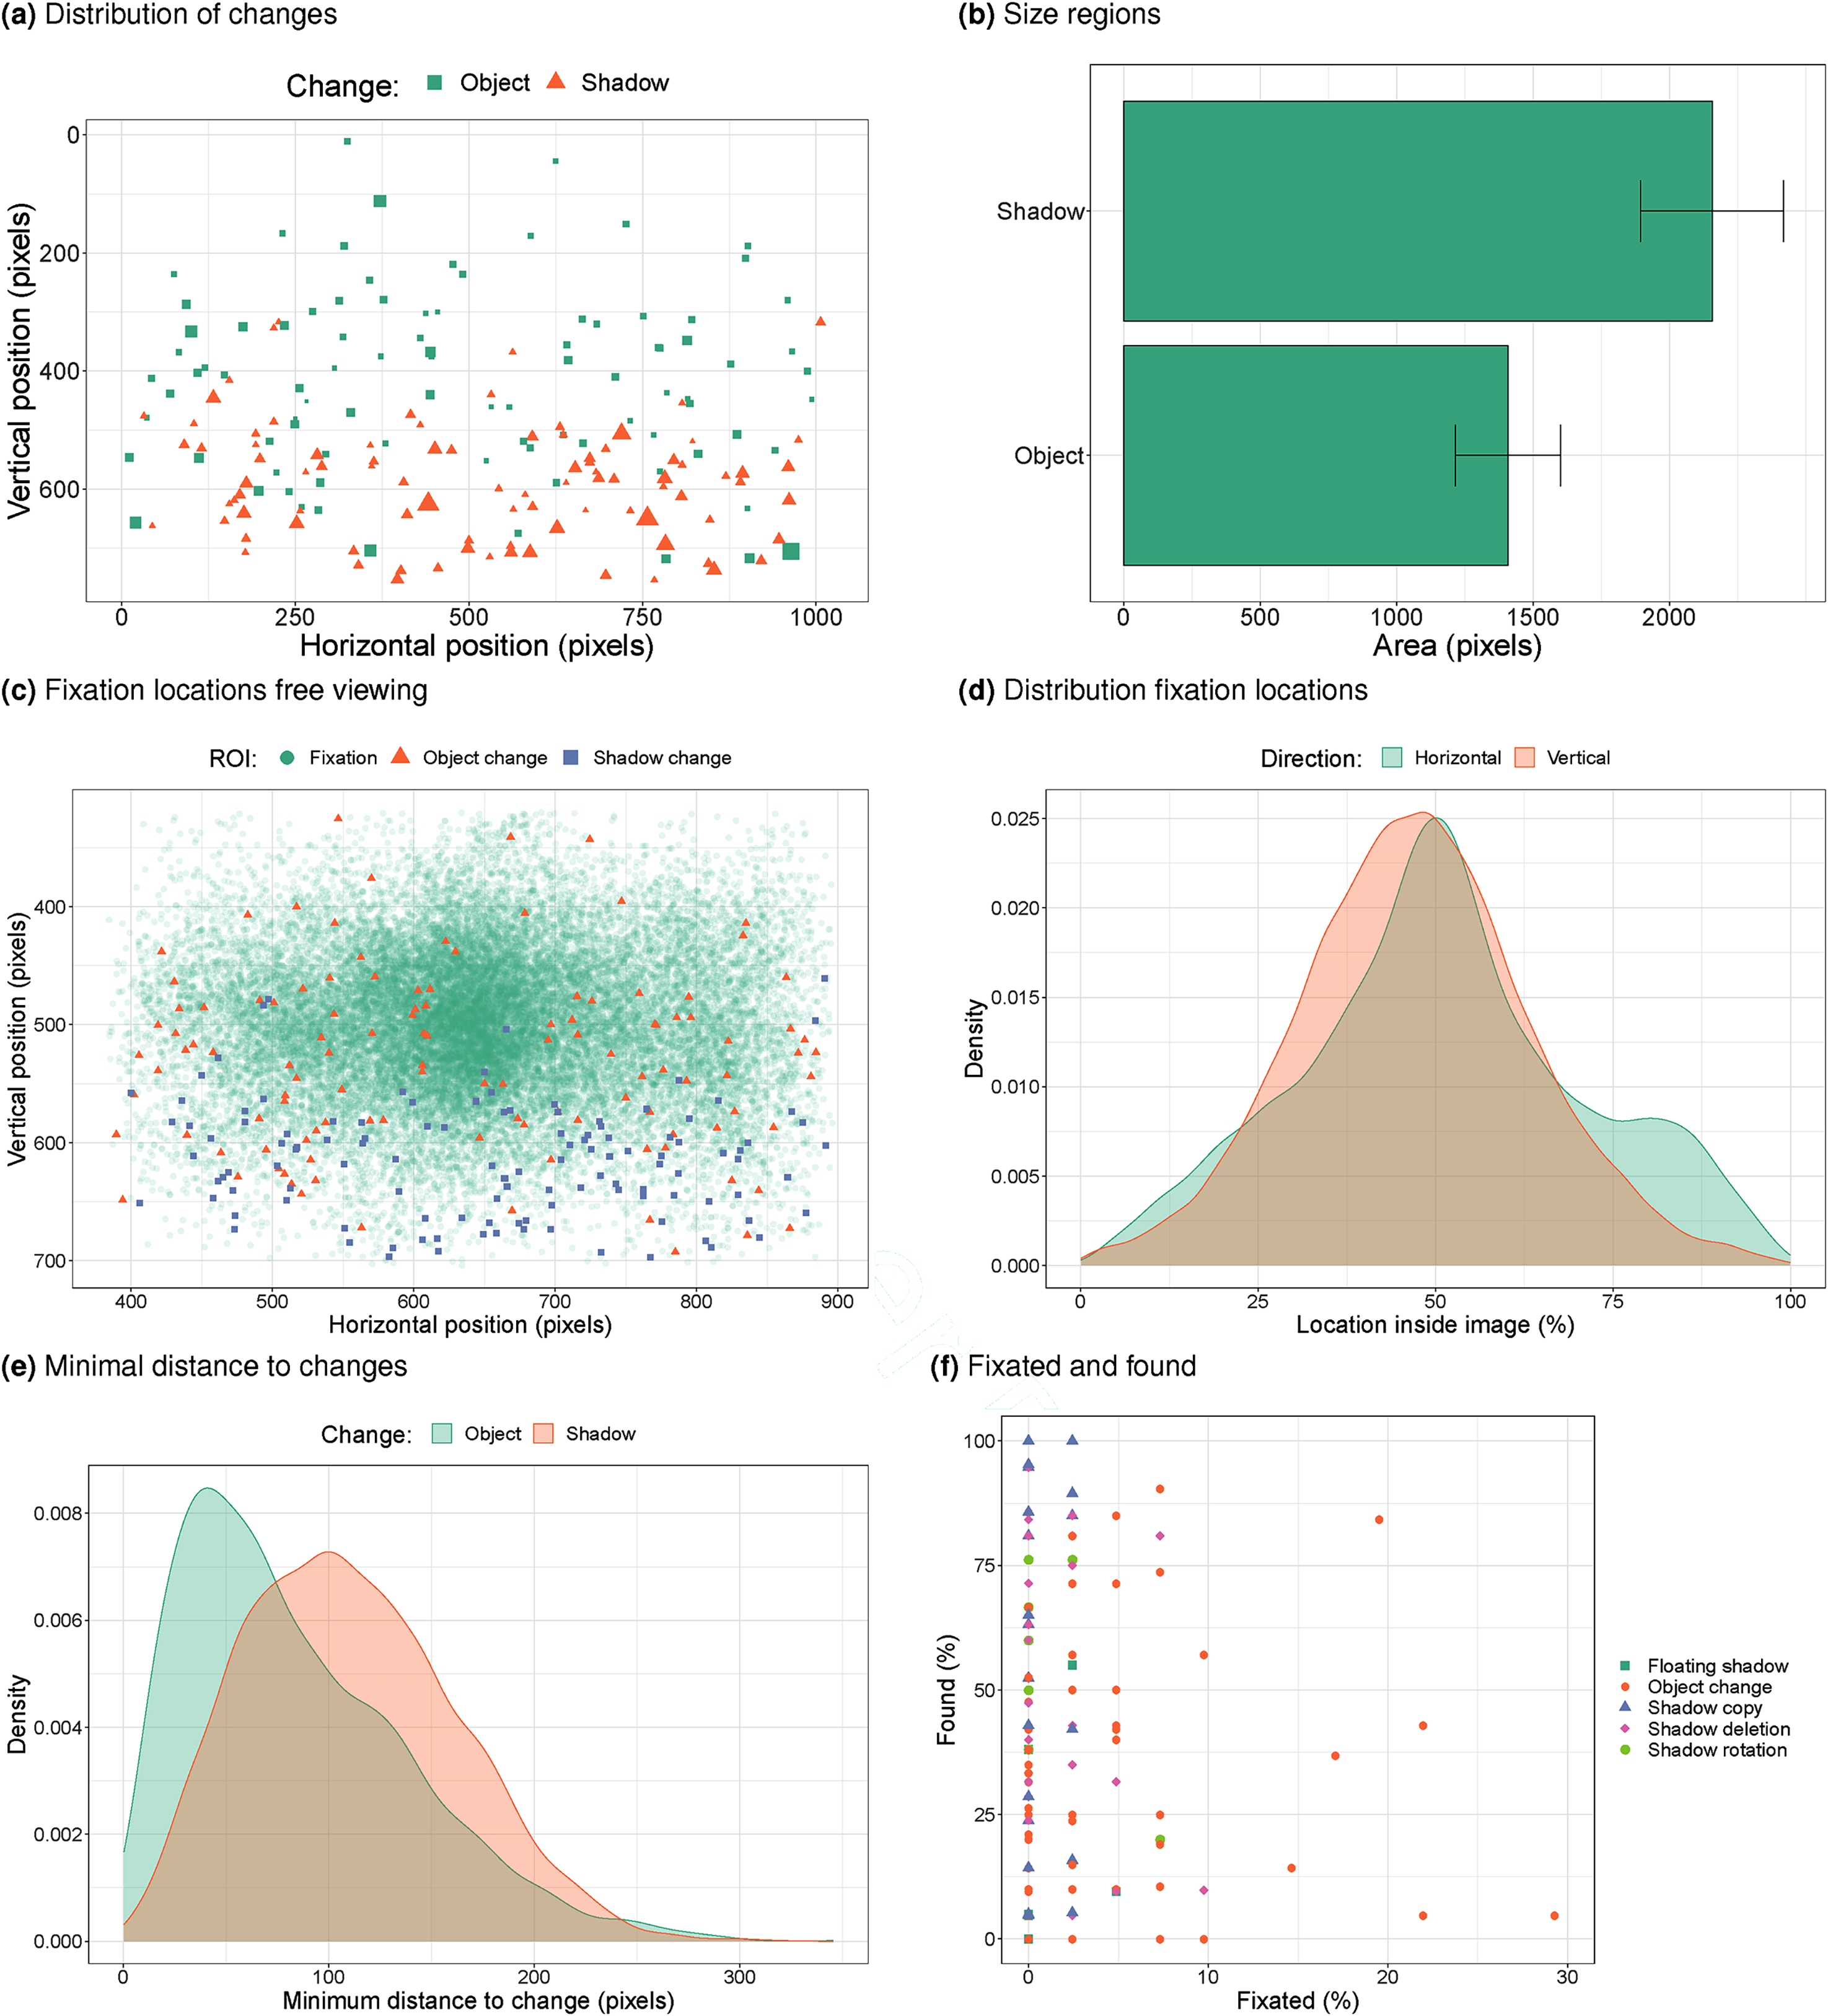
a) Distribution of the locations of changes in the original images (1024x768 pixels). The size of the marks indicates the size of the regions (derived from the polygon areas). b) Average size of the polygons fitted around areas of change. c) Fixation locations during free viewing. d) Distribution of horizontal and vertical fixation positions (horizontal: < 50% = left, vertical: < 50% = bottom of image). e) Minimum distance (pixels) to change during free viewing (data across participants and trials). f) Within image-change comparison of how often a change was fixated during free viewing and how often it was found.
Figure 6c shows that participants fixate a large portion of the images (the region shown has been cropped to the region occupied by the image), but that the edges and corners were not always inspected, and that there are more fixations near the centre and the horizontal mid-line. Superimposed onto the fixation locations are the locations of the changes, showing a larger overlap between object changes and higher fixation counts than for shadow changes (in line with dwell times and trials with at least one fixation). To get a better sense of where in the images people look, Figure 6d shows the distribution of horizontal and vertical fixation positions, as a percentage of the image size. It shows that participants look most often just below the mid-line (values < 50% for the vertical position indicate fixations in the bottom half of the image) and most often at the horizontal mid-line (values around 50%). There is a second peak of horizontal positions at around 80%, which is to the right of the images (but it is unclear why this smaller peak occurs).
Figure 6e plots the distribution of the minimum distance on each trial (and across participants) to the centres of the changes. The distribution of these minimum distances is shifted to the left for the object changes compared to the shadow changes, suggesting participants more often fixated near the objects, in line with the observation that participants more often fixated the objects than the shadows. This difference was statistically significant in a mixed effects analysis (
Within each image and change it is now possible to compare how often a change was fixated during free viewing (we here use the ROIs based on ellipses, but similar results are found for the other two types of ROI representations) and how often it was found in the subsequent change detection task. Figure 6f shows that there is no relation between these two (
Eye Movements During Change Detection
We also recorded participants’ eye movements during the change detection task and can therefore analyse the distribution of these eye movements across the two images. We can also determine whether the change was fixated before participants found it.
Figure 7 first shows some general properties of eye movements during change detection. Figure 7a shows an example scanpath indicating that the participant made a few fixations inside each image before shifting their gaze to the other image. Participants often started looking in the image presented on the left (Figure 7b). After around three fixations on the image, participants shift their gaze (Figure 7c, often to the other image, not shown).
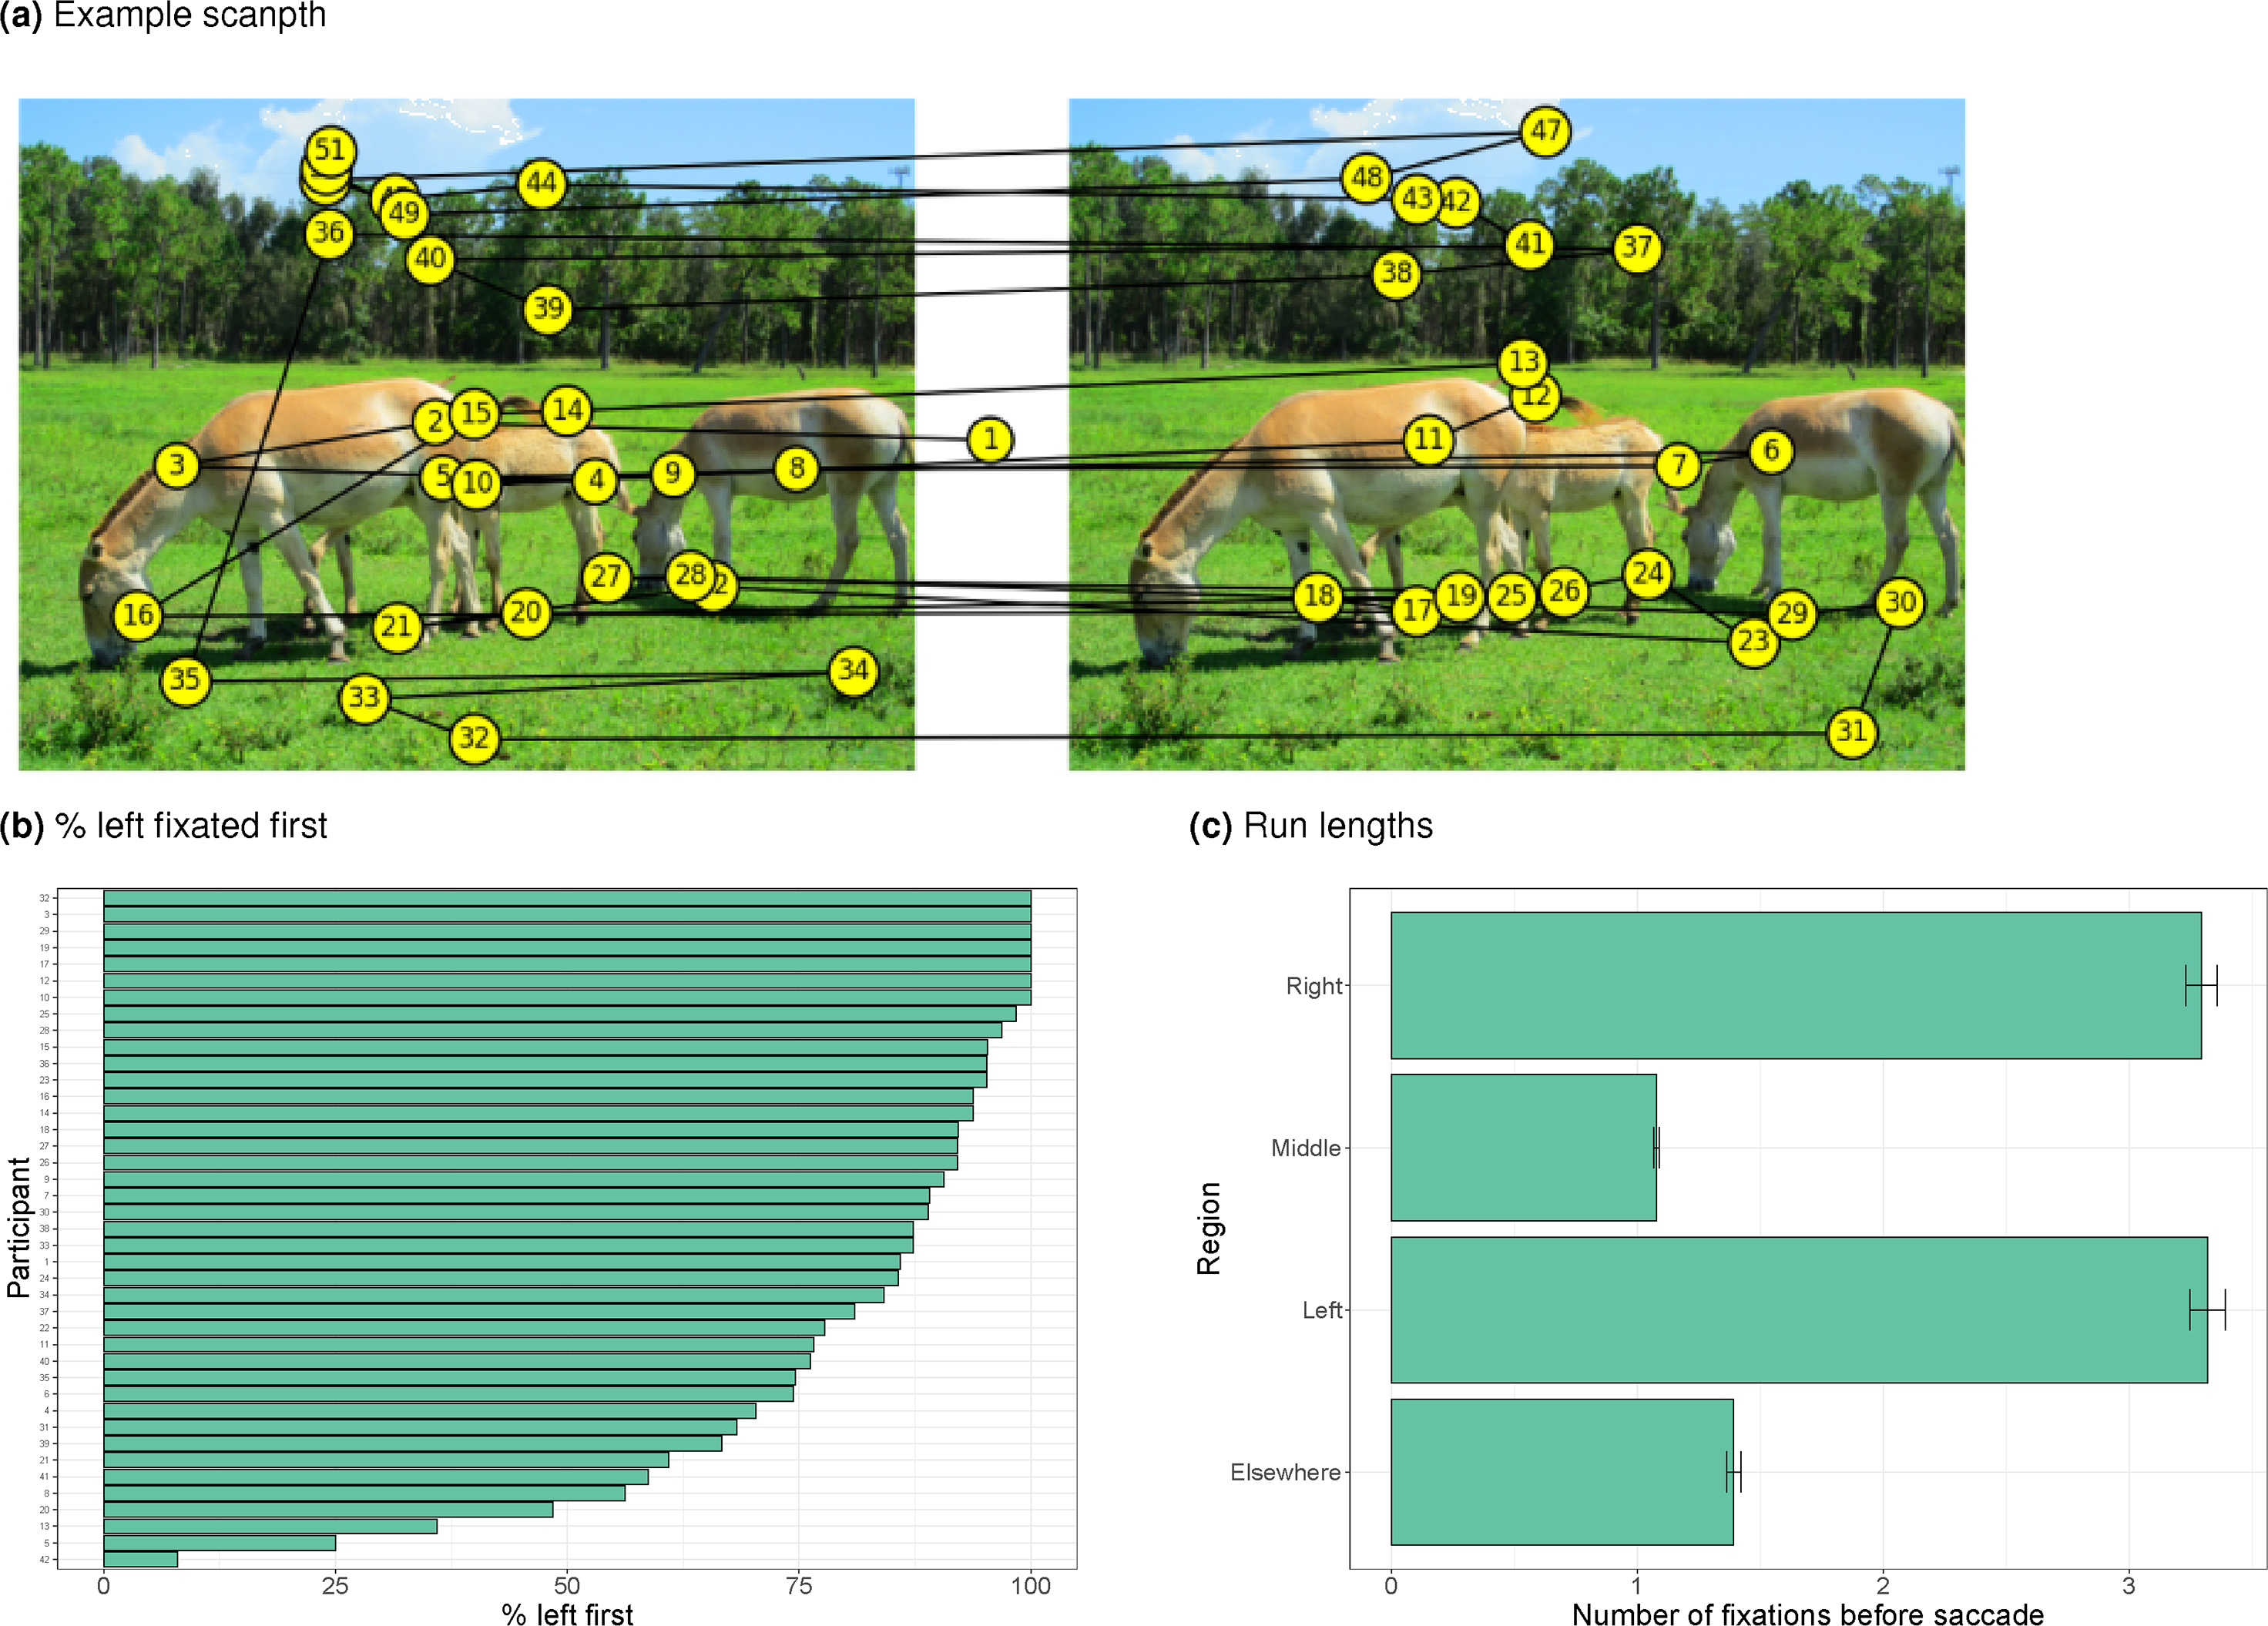
a) Example of a scanpath during change detection. b) Percentage of trials in which the left image was fixated first, by participant. c) Number of refixations of the four ROIs (left image, right image, centre, elsewhere) before fixating another ROI.
Figure 8 examines how often the change was fixated (based on the ellipse ROIs), expressed as the percentage of trials with at least one fixation on the change. Compared to the free viewing task, we expect more fixations on the change because participants had more time to look at the images (2 seconds during free viewing, and a maximum of 15 seconds during change detection), and because participants were specifically looking for the change.
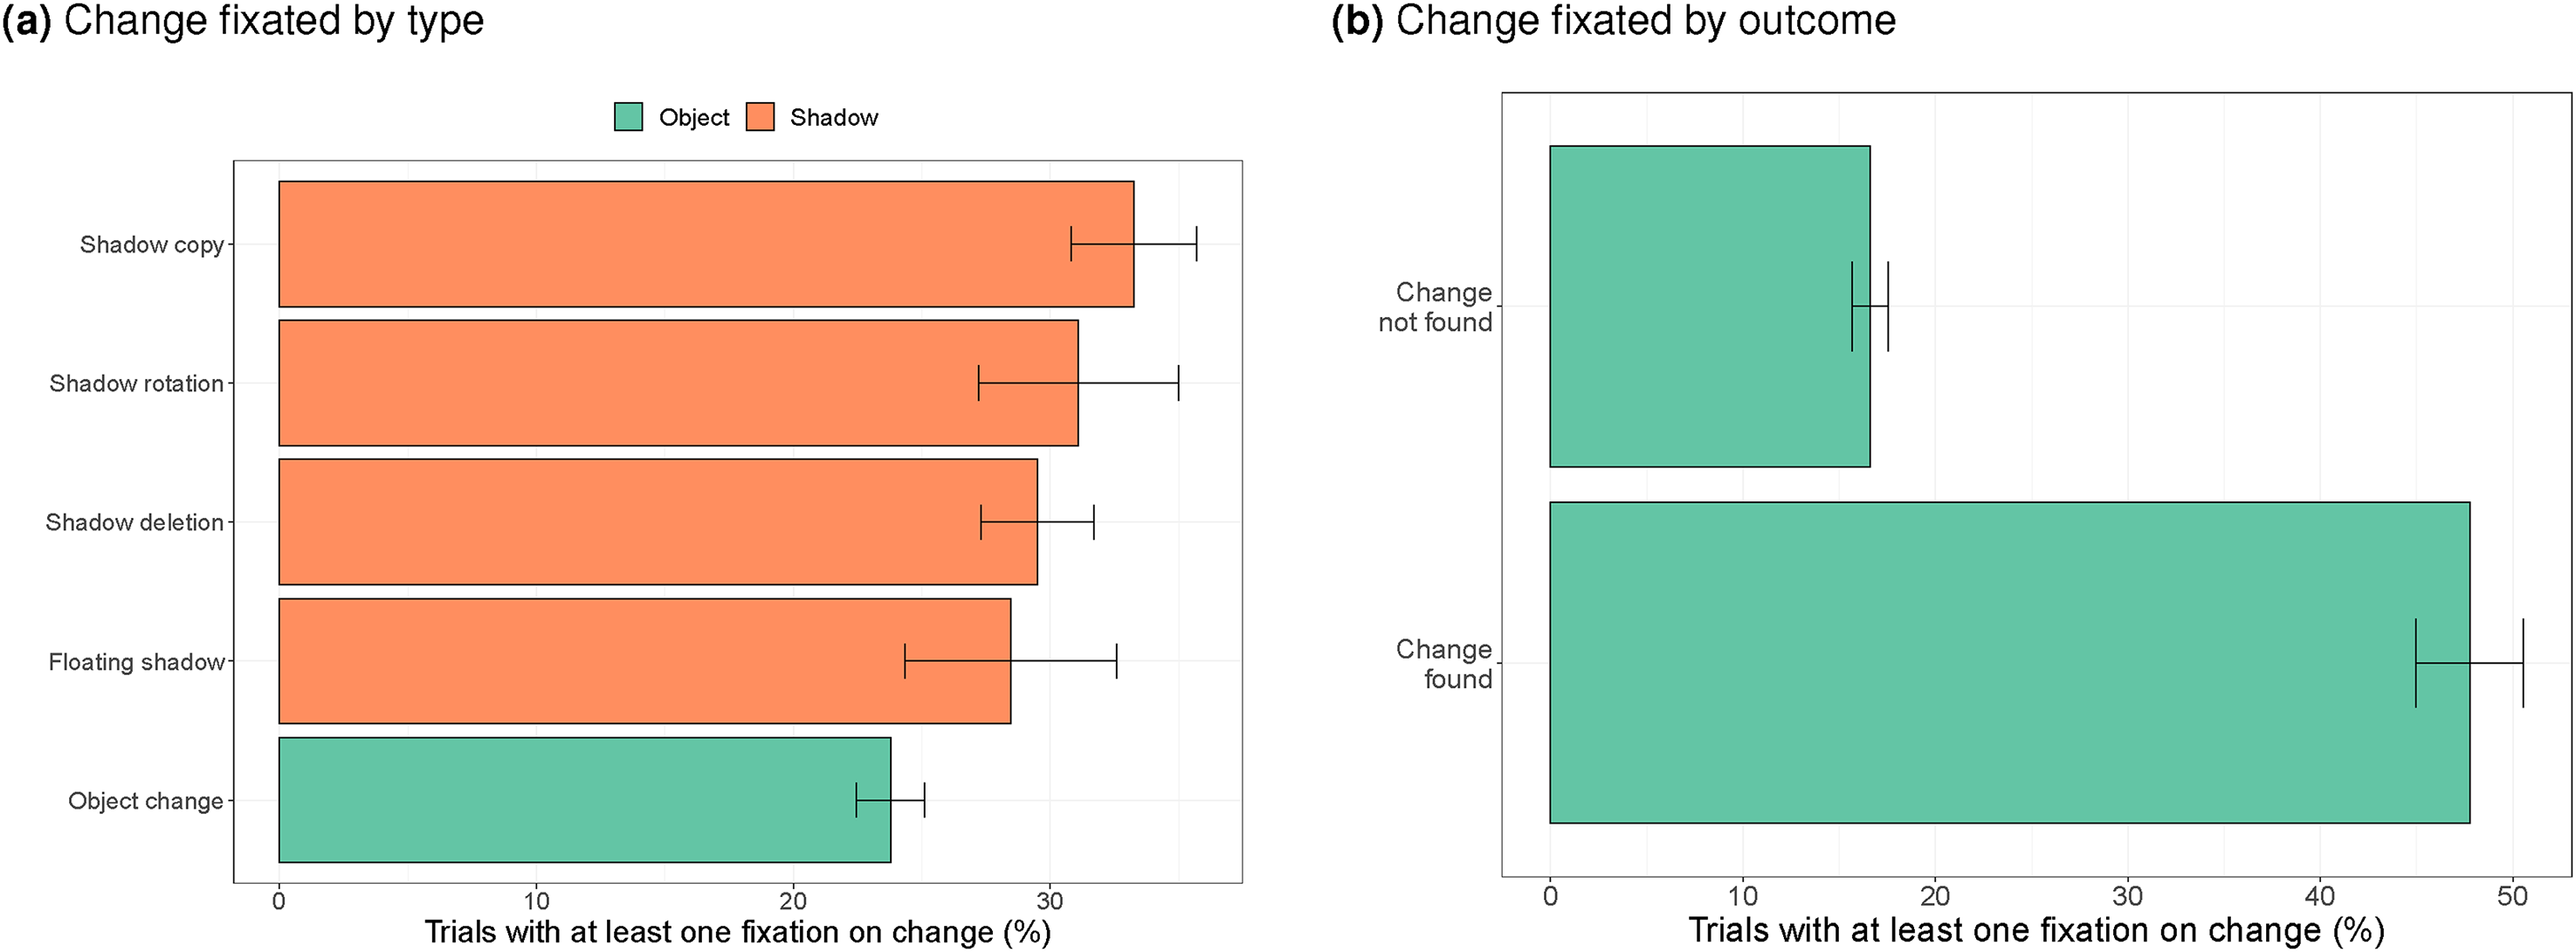
a) Percentage of trials with at least one fixation on the change per type of change, b) Percentage of trials with at least one fixation on the change when the target was found or not found.
Figure 8a shows that the change was indeed fixated more often (around 30% of the trials during change detection, compared to less than 10% of the trials during free viewing). In contrast to during free viewing, object changes were fixated less often during change detection, compared to shadow changes. This may relate to the position of object changes (more often in the top half of the image). It also explains that object changes were found less often. Compared to the object change, shadow deletions (
Figure 8b shows that changes were fixated on almost 50% of the trials when the change was found, and on around 20% of the trials when the change was not found within the 15 seconds time-out interval. This difference is statistically significant (
As indicated, the less than 50% fixations of the change on trials during which the change was detected, suggests that participants may perceive the change without directly fixating on it. To examine whether some proximity to the change is needed, Figure 9 plots the distance towards the centre of the change as a function of the time until the response (at a percentage of the total) time. Figure 9a shows that participants move their eyes closer to the change when they get closer to detecting it and are within 2 degrees when detecting it (Kevin O’Regan et al., 2000). Figure 9b shows that this pattern of homing in onto the change is similar across the different types of change. Figure 9c shows that this pattern is also relatively unaffected by the size of the change, except for the very largest changes, where participants may be further away with their gaze when failing to spot the change.
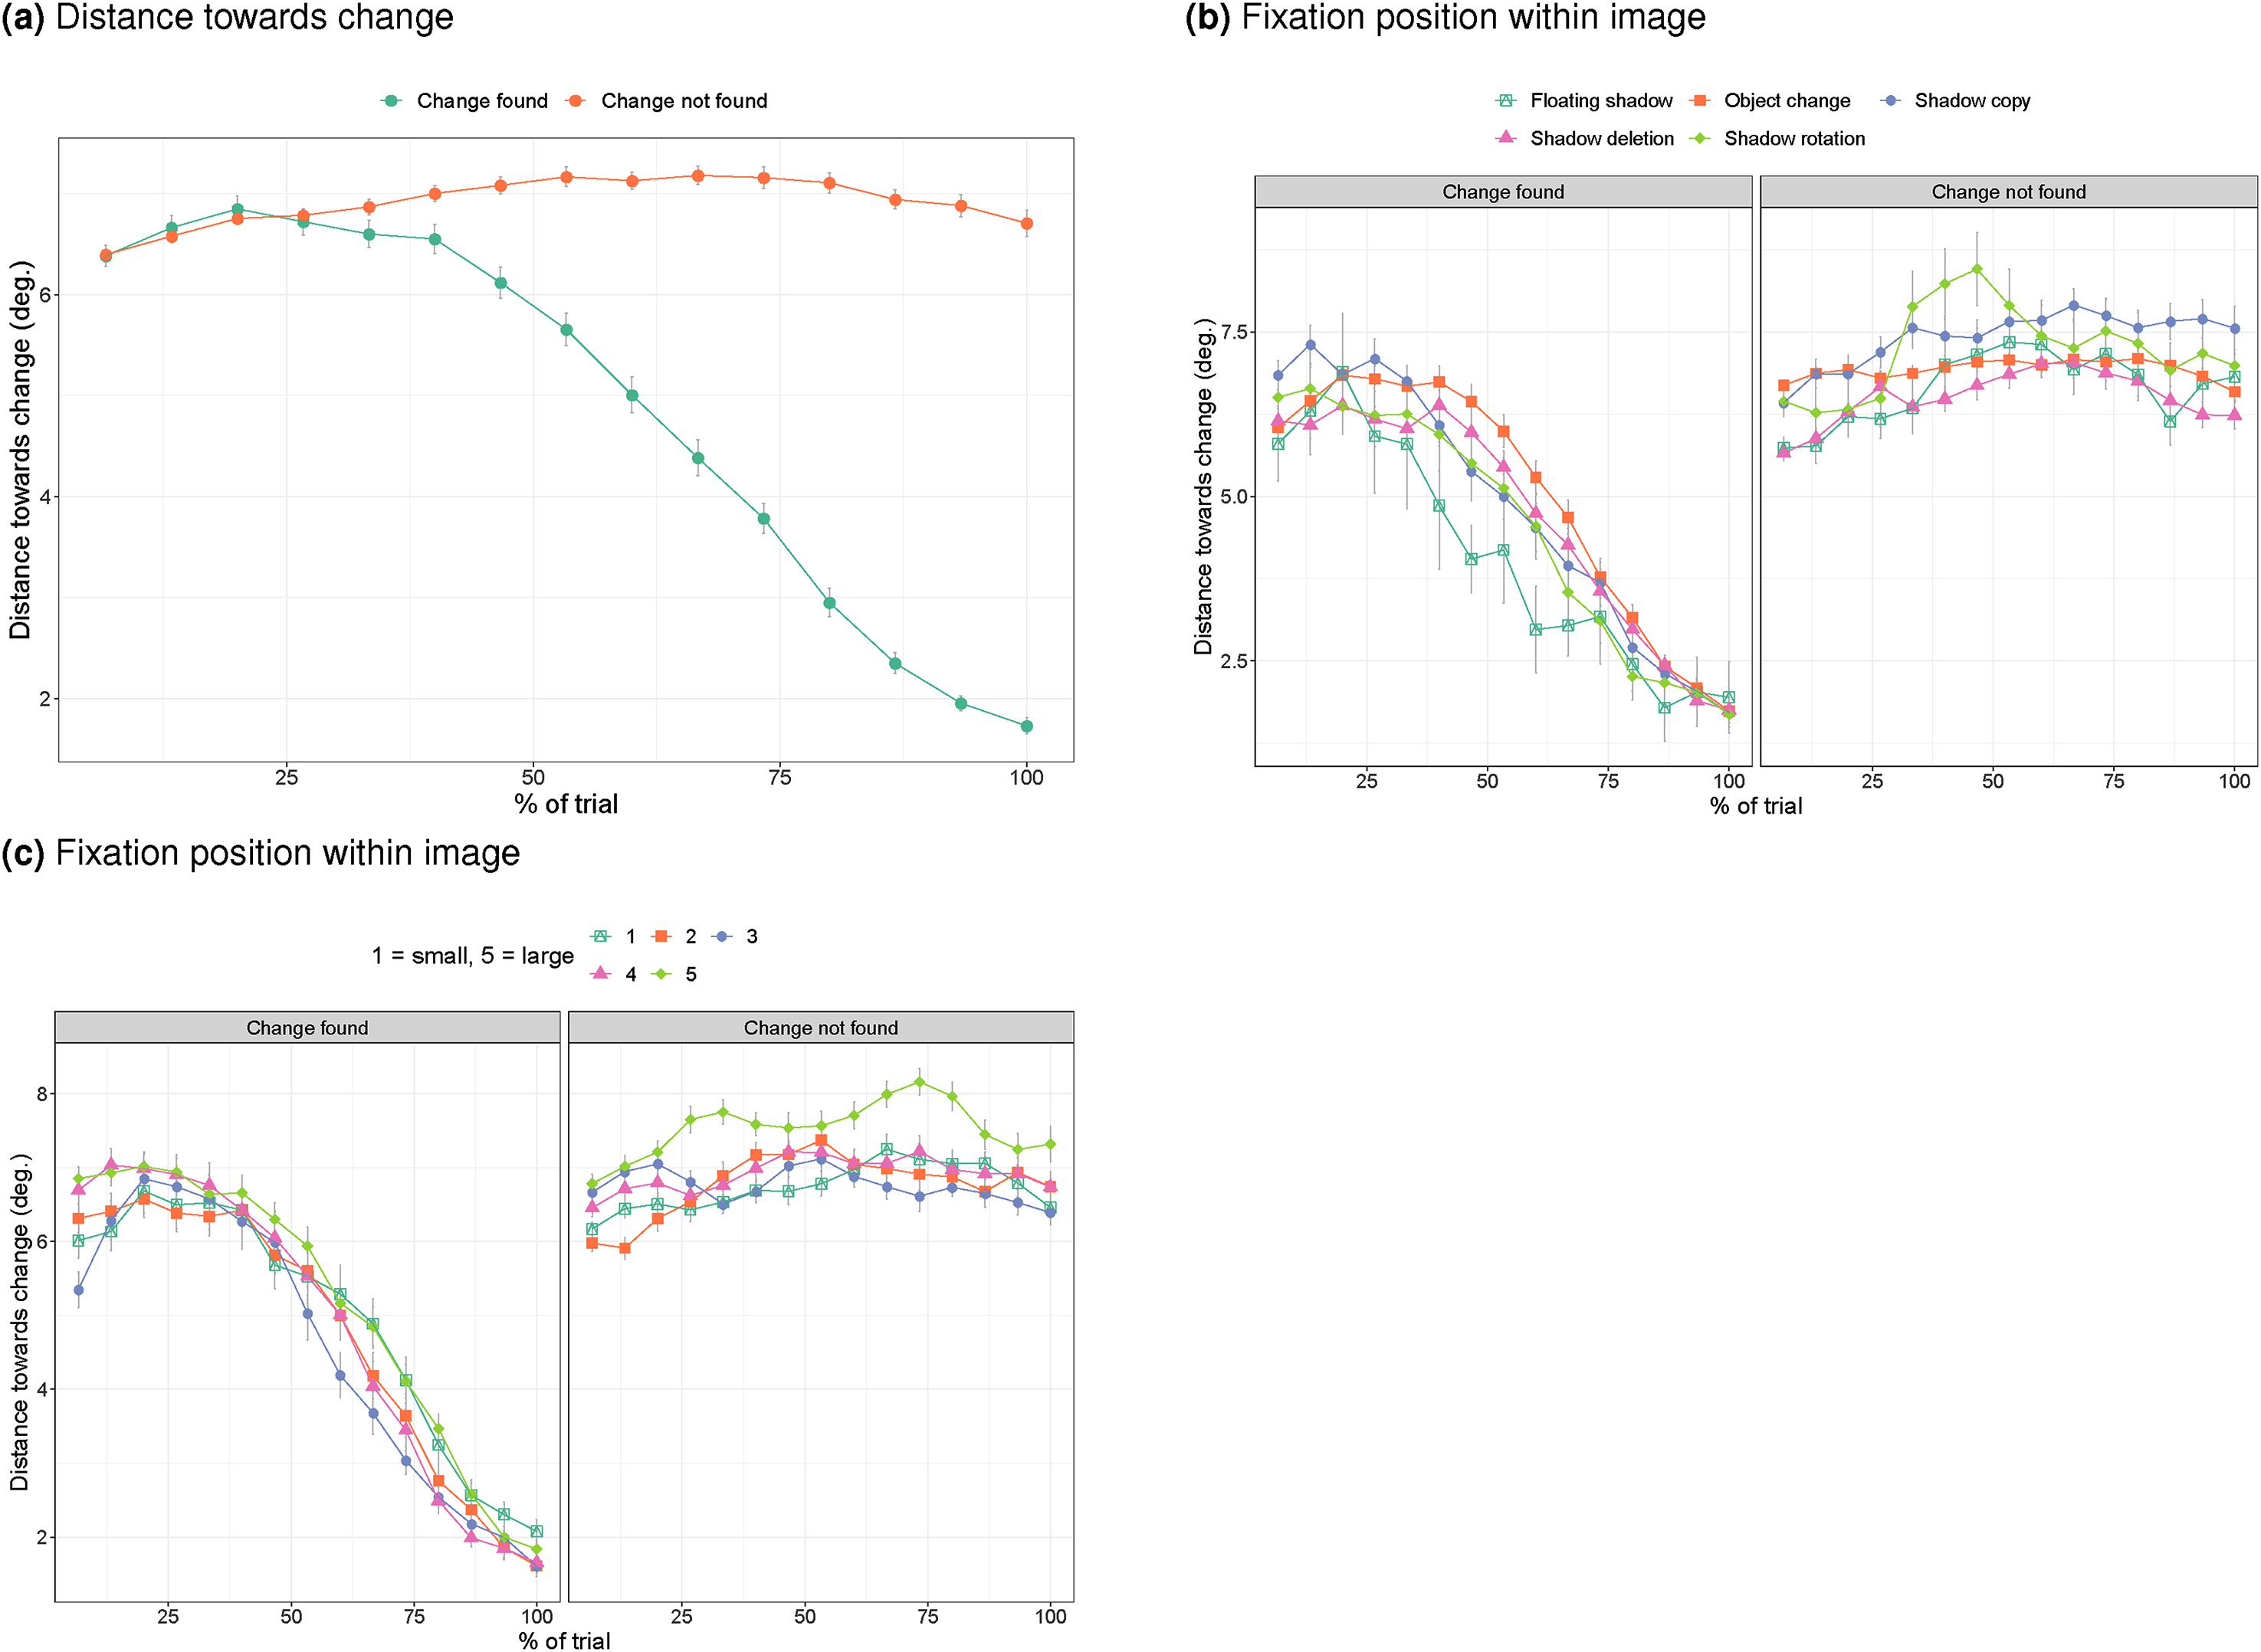
a) Distance towards the change over time when the change was or was not found. b) Distance towards the target over time split by response and type of change. c) Distance towards the target over time split by size of the change.
Finally, we can examine what determines whether a change is detected. First, we examine the preferred viewing positions during the change detection task. Figure 10a indicates that during change detection, people prefer to look in the horizontal middle of the image, but below the vertical mid-line (larger numbers in this plot indicate fixations in the lower part of the images), with no clear differences between the left and right images. This means that the preferred viewing direction is quite different from that during free viewing (Figure 6d). During free viewing participants look around the mid-line, in line with the central bias (Tatler, 2007). During change detection, participants fixate the bottom half of the images. Such a change in viewing strategies is in line with past work that showed effects of task on eye movements (Buswell, 1935; Yarbus, 1967), and may be due to participants expecting object and shadow changes in the bottom half of the display (shadows slightly below where objects are expected).
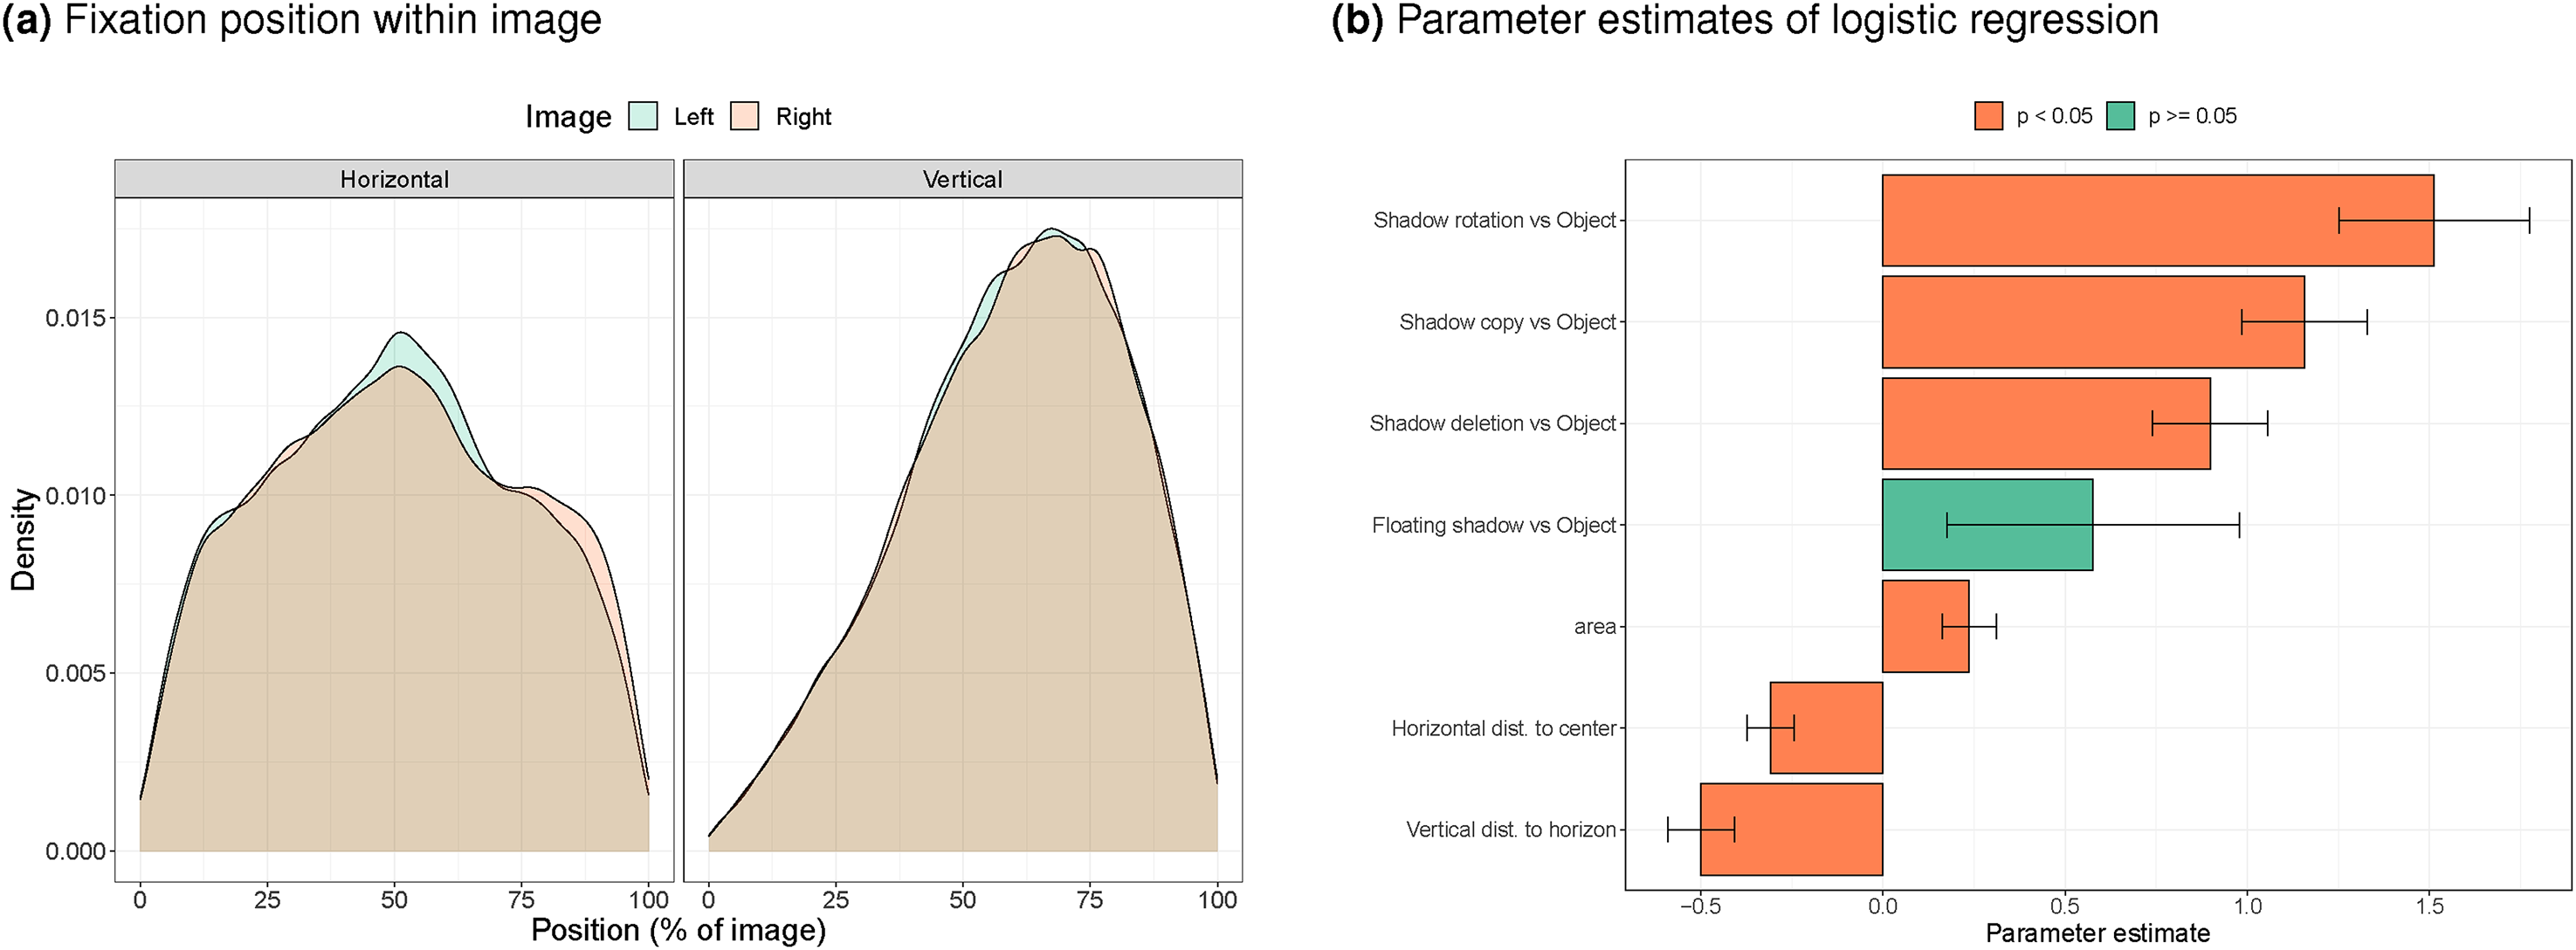
a) Distribution of gaze positions within the left and right image during change detection. b) Joint contributions of type of change, distance to preferred viewing position and change size on chance of finding the change.
We can now use the preferred viewing locations (around 50% for the horizontal position and around 72% for the vertical position) in a mixed effects logistic regression that predicts the chance of finding the target on the basis of: (1) the type of change (a nominal variable with five levels - four shadow changes and an object change, used as the baseline), (2) the size of the change (in pixels), (3) the horizontal distance of the change to the mid-line, (4) the vertical distance of the change to the preferred viewing position during change detection (72% of the image). The numeric variables were standardised to a mean of 0 and a standard deviation of 1 before being entered in the logistic regression so that the fit would not depend on the range of the variables. Figure 10b shows the parameter estimates and their statistical significance. It shows that the advantage of shadow changes over object changes in terms of detection rates persisted after controlling for the size of the changes and their distance to the preferred viewing distance during change detection (with the exception of the floating shadow). The effects of the size and change position are in the expected direction: larger changes are found more often, changes further away from the preferred viewing location are found less frequently, with the vertical distance having a larger effect than the horizontal distance.
Discussion
Change blindness studies (Le Moan et al., 2018; Venkataramanan et al., 2021; Rensink et al., 1997; Simons & Levin, 1997) and studies that examine whether people are able to spot digital image manipulation (Kasra et al., 2018; Nightingale et al., 2017, 2019) have shown that human observers struggle to spot changes in images. A recent study (Ehinger et al., 2016) has suggested that this inability to spot changes may be stronger for changes in shadows compared to changes in objects. Such observations may be in line with studies suggesting that people fixate shadow regions in images less (Hermens & Zdravković, 2015; Toscani et al., 2013). The present study used eye tracking to determine whether the stronger change blindness for shadows observed by Ehinger et al. (2016) can be directly explained by a tendency to fixate objects rather than shadows when inspecting the images.
Participants were first asked to freely view all images from Ehinger et al. (2016), while we tracked their eye movements. We then compared whether viewing of the changes during free viewing (an indicator of visual saliency, Itti & Koch, 2000; Parkhurst et al., 2002) was related to detection of the change. Change detection was recorded during a separate block of trials. By also tracking participants’ eyes during this change detection block, we could determine whether participants looked at changes before detection and how participants distribute their attention while searching for changes.
In our own change detection task, we used equal numbers of object and shadow changes to examine whether the stronger change blindness for shadows in Ehinger et al. (2016) would also occur with equal numbers of changes in both categories. The original study made use of filler items that often involved an object change, with the result that participants saw more object than shadow changes overall. In our own change blindness task, we also used an instruction in which participants were informed that changes could equally often be expected in objects and shadows. The original study (Ehinger et al., 2016) appears to have instructed participants on the basis of an object change and only asked participants at the end of the study whether they noticed the shadow changes. To reduce testing time in the eye tracker, we shortened the time-out interval (from one minute to 15 seconds). To allow for easier alignment of recorded eye movements with what participants saw on the screen, we presented images side-by-side. To ensure sufficient statistical power following the shortening of the time-out interval, we ran the study with a sample almost twice the size of the original study.
The results suggest that the proportion of shadow changes and the instruction matter for change blindness. In contrast to the original study (Ehinger et al., 2016), our participants showed better change detection for shadows than for objects. This was reflected in both better detection rates and shorter search times, which contrasts with Ehinger et al. (2016) who only found an effect on accuracy. As we did not use the exact same design as in Ehinger et al. (2016), it is unclear at this stage whether the stronger change blindness for objects in our study (rather than for shadows) was due to the changes that we made to the design or due to the changes that we made to accommodate the set-up to the eye tracker (i.e., shorter time-out intervals and side-by-side presentation of the images). A further study will be needed to isolate the effects of the different factors.
Analysis of the fixations during the free viewing task (that preceded the change detection task) showed that participants (during the 2 seconds interval) almost never fixated on the change regions (with dwell times of around 1% of the total trial interval and fewer than 10% of the trials had at least one fixation on the change). During free viewing, there were more fixations on the object changes than the shadow changes, but this pattern reversed during change detection. This could be due to the shift of participants’ attention towards the bottom half of the image during change detection, which is where most of the shadows were located.
The shorter dwell times on shadows during free viewing is in line with the results by Ehinger et al. (2016) and our earlier observation that participants fixate more on the region without a shadow when judging faces (Hermens & Zdravković, 2015). The longer dwell times on shadows during change detection is in line with our current observation that shadow changes were found more often than object changes.
Because we showed all images in the free viewing task, we could also, on an image-by-image basis, compare dwell times during free viewing with change detection. In this comparison, changes that were viewed often during free viewing, were not necessarily more often found during change detection. This suggests that some other mechanism determines performance during change detection than how often changes are fixated during free viewing.
This other mechanism may involve search strategies during change blindness. Whereas during free viewing, participants fixated near the horizontal midline of the images, in line with the central bias (Tatler, 2007), they fixated below the horizontal midline during change detection. Such differential eye movement patterns during different tasks are line with a large number of studies that found task effects on eye movement patterns (e.g., Buswell, 1935; Underwood et al., 2006; Yarbus, 1967). The changes in shadows more frequently occurred in the region below the horizontal midline than changes in objects, which could explain why shadow changes were easier to find.
While eye movements are often found to differ between different tasks (e.g., Greene et al., 2012; Haji-Abolhassani & Clark, 2014; Yarbus, 1967), it is difficult, from the current data, to establish why participants seem to have changed their viewing strategy going from free viewing to change detection. Possibly, participants expected shadows and objects more often in the bottom half of the images. Alternatively, they were influenced by the longer presentation durations in the change detection task, providing more time to inspect details in the images (more commonly found in the bottom half of the images). The latter explanation, however, is less likely, as we did not find a change in the distribution of fixations early and late in the change detection trials (data not shown, but available in our OSF-repository).
These observations indicate that it is important to determine where in the image participants are looking for changes. In their study Ehinger et al. (2016) checked the effects of the distance towards the centre of the image, but the present results suggest that it may be better to separately consider the horizontal and vertical component, and to use a different preferred viewing location for each dimension. Interestingly, with a mixed effects analysis, we could show that even after controlling for the horizontal and vertical preferred search location and the size of the change, shadow changes were easier to locate (although there were also the expected effects of horizontal and vertical distance to the preferred viewing locations and the size of the changes).
We also found that participants do not need to fixate the change directly in order to detect the change (in around half of the trials with a change detection, the target was not fixated). Likewise, the results indicate that it is possible to directly look at the change, but not detect it (around 20% of the trials without finding the change had such a fixation, in line with the idea of “looking without seeing”, Kevin O’Regan et al., 2000). Something similar was observed by Zelinsky (2001), who found that participants sometimes continued scanning the scene after fixating the target. Zelinsky (2001) therefore made the distinction between ‘scanning’ (the target may or may not be fixated, but the change is detected) and ‘confirming’ (the change is fixated to confirm the change). During this strategy, participants may use peripheral vision instead of fixating the target directly. To examine the role of peripheral vision, we examined how closely participants move their gaze towards the change. During free viewing, we found that participants more closely approach objects than shadows (in line with the fixation counts). During change detection, the minimal distance from the target was dominated by whether the change was detected and approached a value of around 2 degrees (towards the centre of the change).
A possible reason why shadow changes may have an advantage over object changes even after compensating for position in the image and size of the change, is that most of the shadow changes lead to images that have something odd about them (see, for example, Figure 1, where after the deletion of the shadow, the horse on the right seems to be floating, or where there are unexpected shadows in the shadow copy and floating shadow conditions). When an object is deleted or its colour changed, the plausibility of the image is not changed (see the object change in Figure 1, for example, unless a supporting object was removed). Such an explanation would agree with the suggestion that it is not low-level saliency that determines change detection performance, but whether the change leads to inconsistencies in the scene (Boyer et al., 2010; Stirk & Underwood, 2007; Wright, 2005). The second experiment by Ehinger et al. (2016) addressed this possible issue by comparing the effects of changing shadows of objects inside the image and shadows of objects outside the image, and found that changes in both types of shadows were equally difficult to detect. The present study did not compare these two types of shadows, and future work may therefore look specifically into gaze patterns towards images with changed shadows of visible and non-visible objects. Likewise, a future study could determine whether detection and gaze patterns are affected when participants have to indicate from a single image whether something is ‘odd’ about the image.
Conclusion
The finding of our study can be summarised as follows: (1) when object and shadow changes are balanced and participants are informed that they are, shadow changes were found more easily, even after compensating for position in the image and size of the change, (2) viewing patterns differ during free viewing and change detection in their vertical preferred viewing position (near the midline during free viewing and below the midline for change detection), (3) objects (that change) are fixated more often than shadows (that change) during free viewing, but both types of changes were fixated infrequently, (4) while detecting the change, participants home in on the change, (5) during change detection, shadow changes were fixated more frequently than object changes, in line with detecting such changes more often. Together these findings stress the importance of instruction and design of the study, and suggest a role for the measurement of eye movements to better understand strategies adopted by participants (Zelinsky, 2001).
Footnotes
Acknowledgements
Declaration of Conflicting Interests
The authors declared no potential conflicts of interest with respect to the research, authorship and/or publication of this article.