
Abstract
The SARS-CoV-2 pandemic required the immediate need to transfer inactivated tissue from biosafety level (BSL)-3 to BSL-1 areas to enable downstream analytical methods. No validated SARS-CoV-2 inactivation protocols were available for either formaldehyde (FA)-fixed or glutaraldehyde (GA)-fixed tissues. Therefore, representative tissue from ferrets and hamsters was spiked with 2.2 × 10⁶ tissue culture infectious dose 50% per ml (TCID50/ml) SARS-CoV-2 or were obtained from mice experimentally infected with SARS-CoV-2. SARS-CoV-2 inactivation was demonstrated with 4% FA or 5% GA at room temperature for 72 hours by a titer reduction of up to 103.8 TCID50/ml in different animal tissues with a maximum protein content of 100 µg/mg and a thickness of up to 10 mm for FA and 8 mm for GA. Our protocols can be easily adapted for validating the inactivation of other pathogens to allow for the transfer of biological samples from BSL-3 areas to BSL-1 laboratories.
Keywords
As of 2019, the coronavirus disease 2019 (COVID-19) pandemic stimulated a fast development of in vivo, ex vivo, and in vitro models for SARS-CoV-2 research. This resulted in a rapid increase in the number of experiments handling animal tissue infected with SARS-CoV-2. In Germany, an approved in-house inactivation method is a prerequisite to allow for the transfer of infectious samples from BSL-3 to lower containment levels.
Unfortunately, validated protocols are often not available or they lack essential details with specific inactivation conditions. 14 An aqueous solution containing 4% formaldehyde (FA; diluted from 37% formaldehyde with 1% methanol; 4% FA ≈ 10.83% formalin) is the most common chemical fixative for histologic analysis that works on the basis of crosslinking. 5 Crosslinkers bind proteins, nucleic acids, and unsaturated fatty acids by creating covalent chemical bonds (e.g., methylene bridges) and form a molecular web-like structure that preserves the tissue and keeps it rigid. 17 FA has a tissue penetration rate ranging from 0.06 mm per 15 minutes 18 up to 1 mm per 1 hour.13,15 Therefore, the penetration time to the center of a 10 mm thick tissue (=5 mm penetration depth) is at least 21 hours.13,15,18
Glutaraldehyde (GA) is an excellent chemical for the preservation of cellular ultrastructure and it has been reported to outperform FA on a molecular basis, 7 as a fixative for EM 16 or even as an inactivating agent for SARS. 3 GA (molecular weight 100.12 g/mol) has a slower tissue penetration rate compared to FA (30.031 g/mol). 7 Hence, a maximum tissue thickness of 1 mm in at least one dimension is recommended for GA fixation.4,15
Currently, there are no other studies describing the inactivation of SARS-CoV-2 with GA in tissue. The objective of our study was to validate protocols for the inactivation of SARS-CoV-2 in different tissues from commonly used small laboratory animal species with 4% FA and 5% GA. Our research extends current knowledge on the specific conditions needed for successful inactivation of SARS-CoV-2.
Fresh lungs, livers, kidneys, and brains were collected from two specific pathogen-free ferrets and one hamster. We selected these four representative tissues since they were previously identified as potential targets of SARS-CoV-2 infection.10,20 Samples were divided into two main and three subgroups (Fig. 1). Organs were cut into pieces up to 10 mm thick for sample inactivation with 10% FA and 8 mm 5% GA. Details about tissue weights and dimensions, measured as two dimensions including the shortest side in millimeters, are listed in Supplemental Tables S1 and S2, respectively. The third dimension was not measured since only the thickness (i.e., the shortest site) is relevant for the diffusion rate of formalin or glutaraldehyde. Two technical approaches regarding sample size and spiking strategies are shown in a flow chart in Fig. 2.
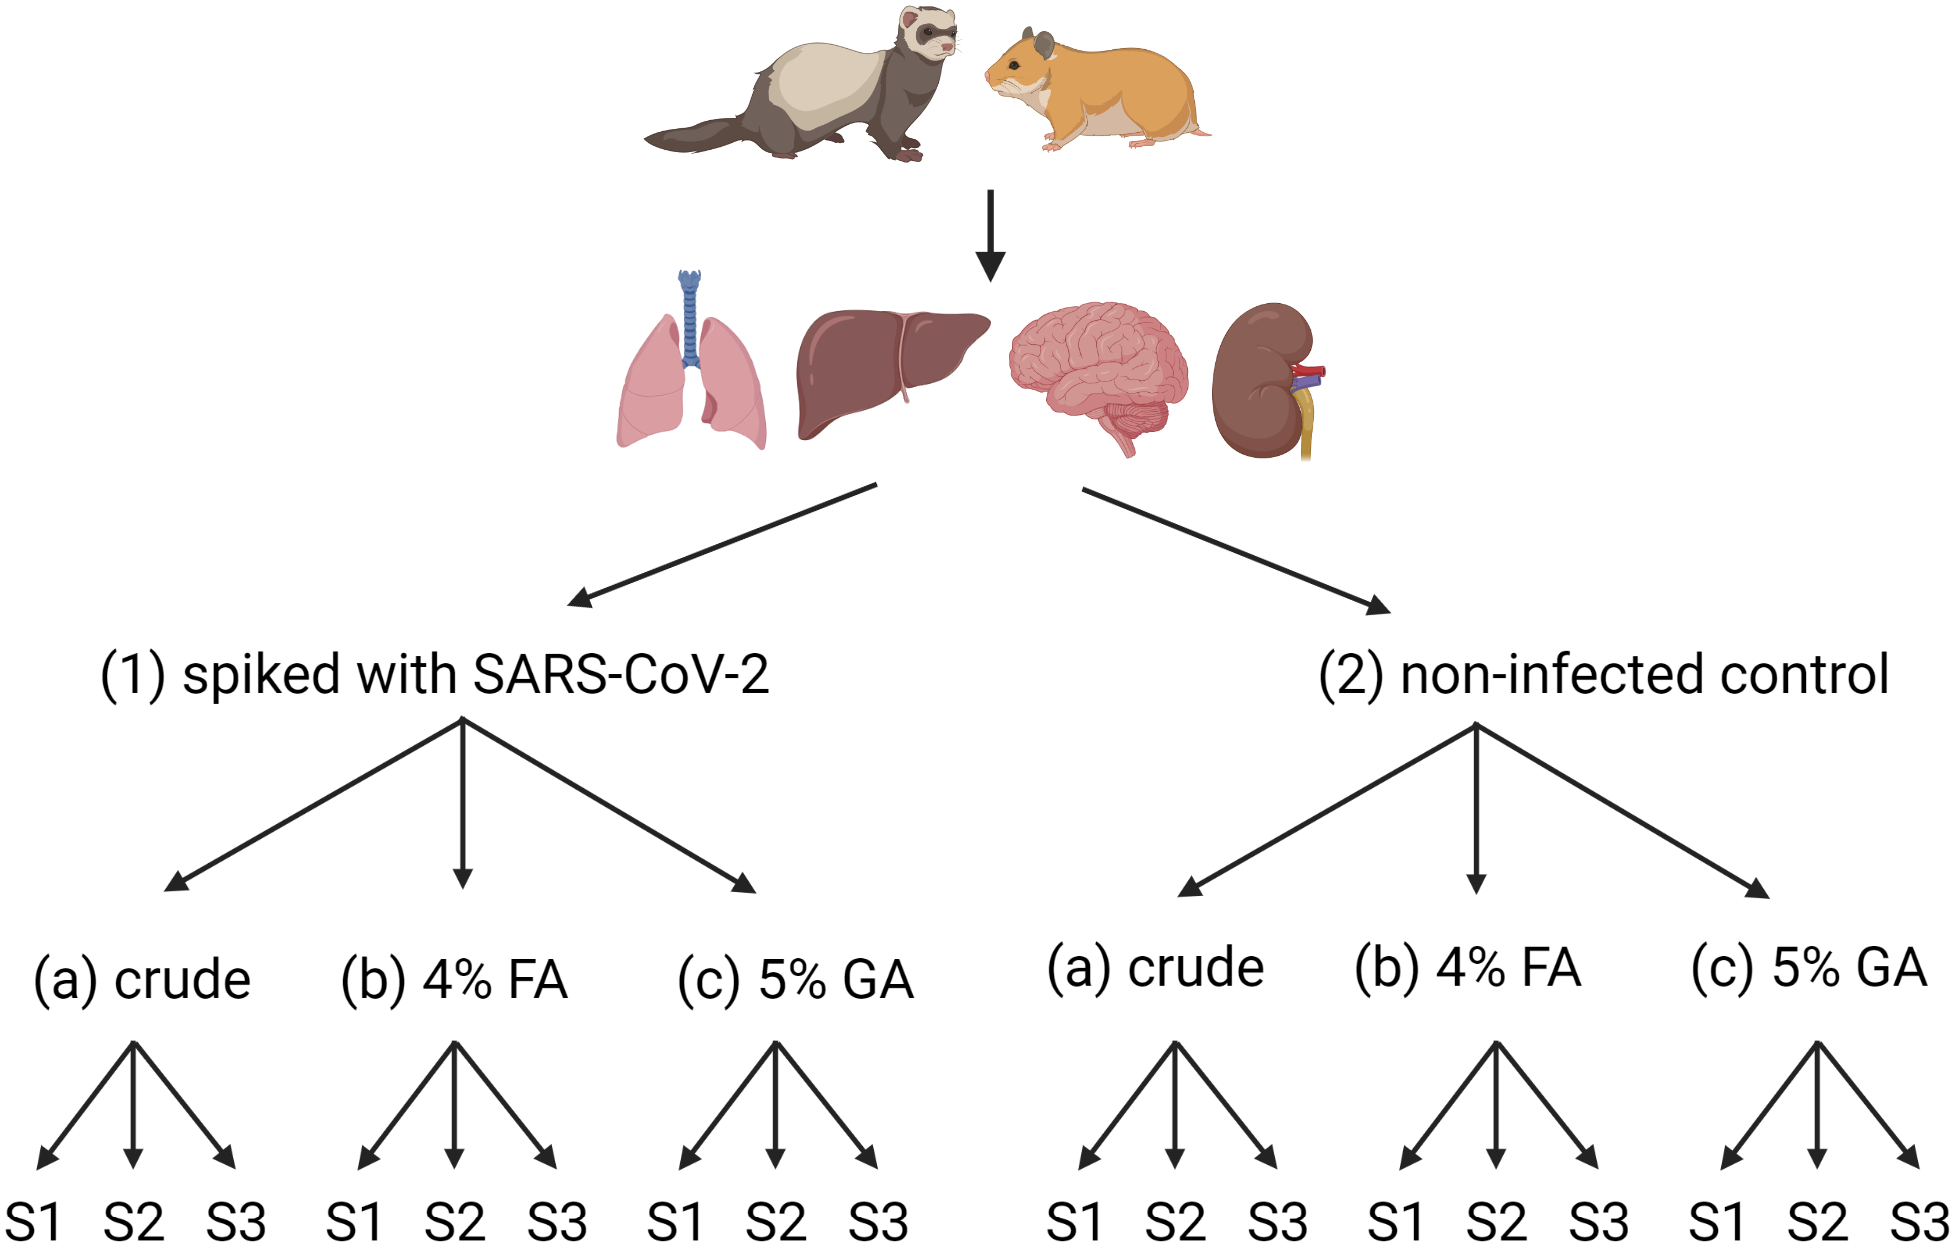
Scheme representing groups of tissue samples used for spiking experiments with SARS-CoV-2. The lung, liver, kidney, and brain were selected, and each tissue was divided into two groups: (1) tissue samples spiked with SARS-CoV-2 (strain BavPat1/2020, titer of 2.2 × 10⁶ TCID50/ml) and (2) tissue samples used as noninfected controls. Each group was divided into three subgroups: (A) unfixed tissue samples not treated with chemical reagents, (B) tissue samples treated with 4% neutral buffered formaldehyde (FA), or (C) 5% glutaraldehyde (GA). Three biological replicates (S1 to S3) were obtained from each subgroup directly before titration of the samples; see details of spiking procedures and sample processing in Figure 2, Supplemental Figure S1, and Supplemental Tables S1 and S2. Created with BioRender.com (agreement number DM24HW8QLL).
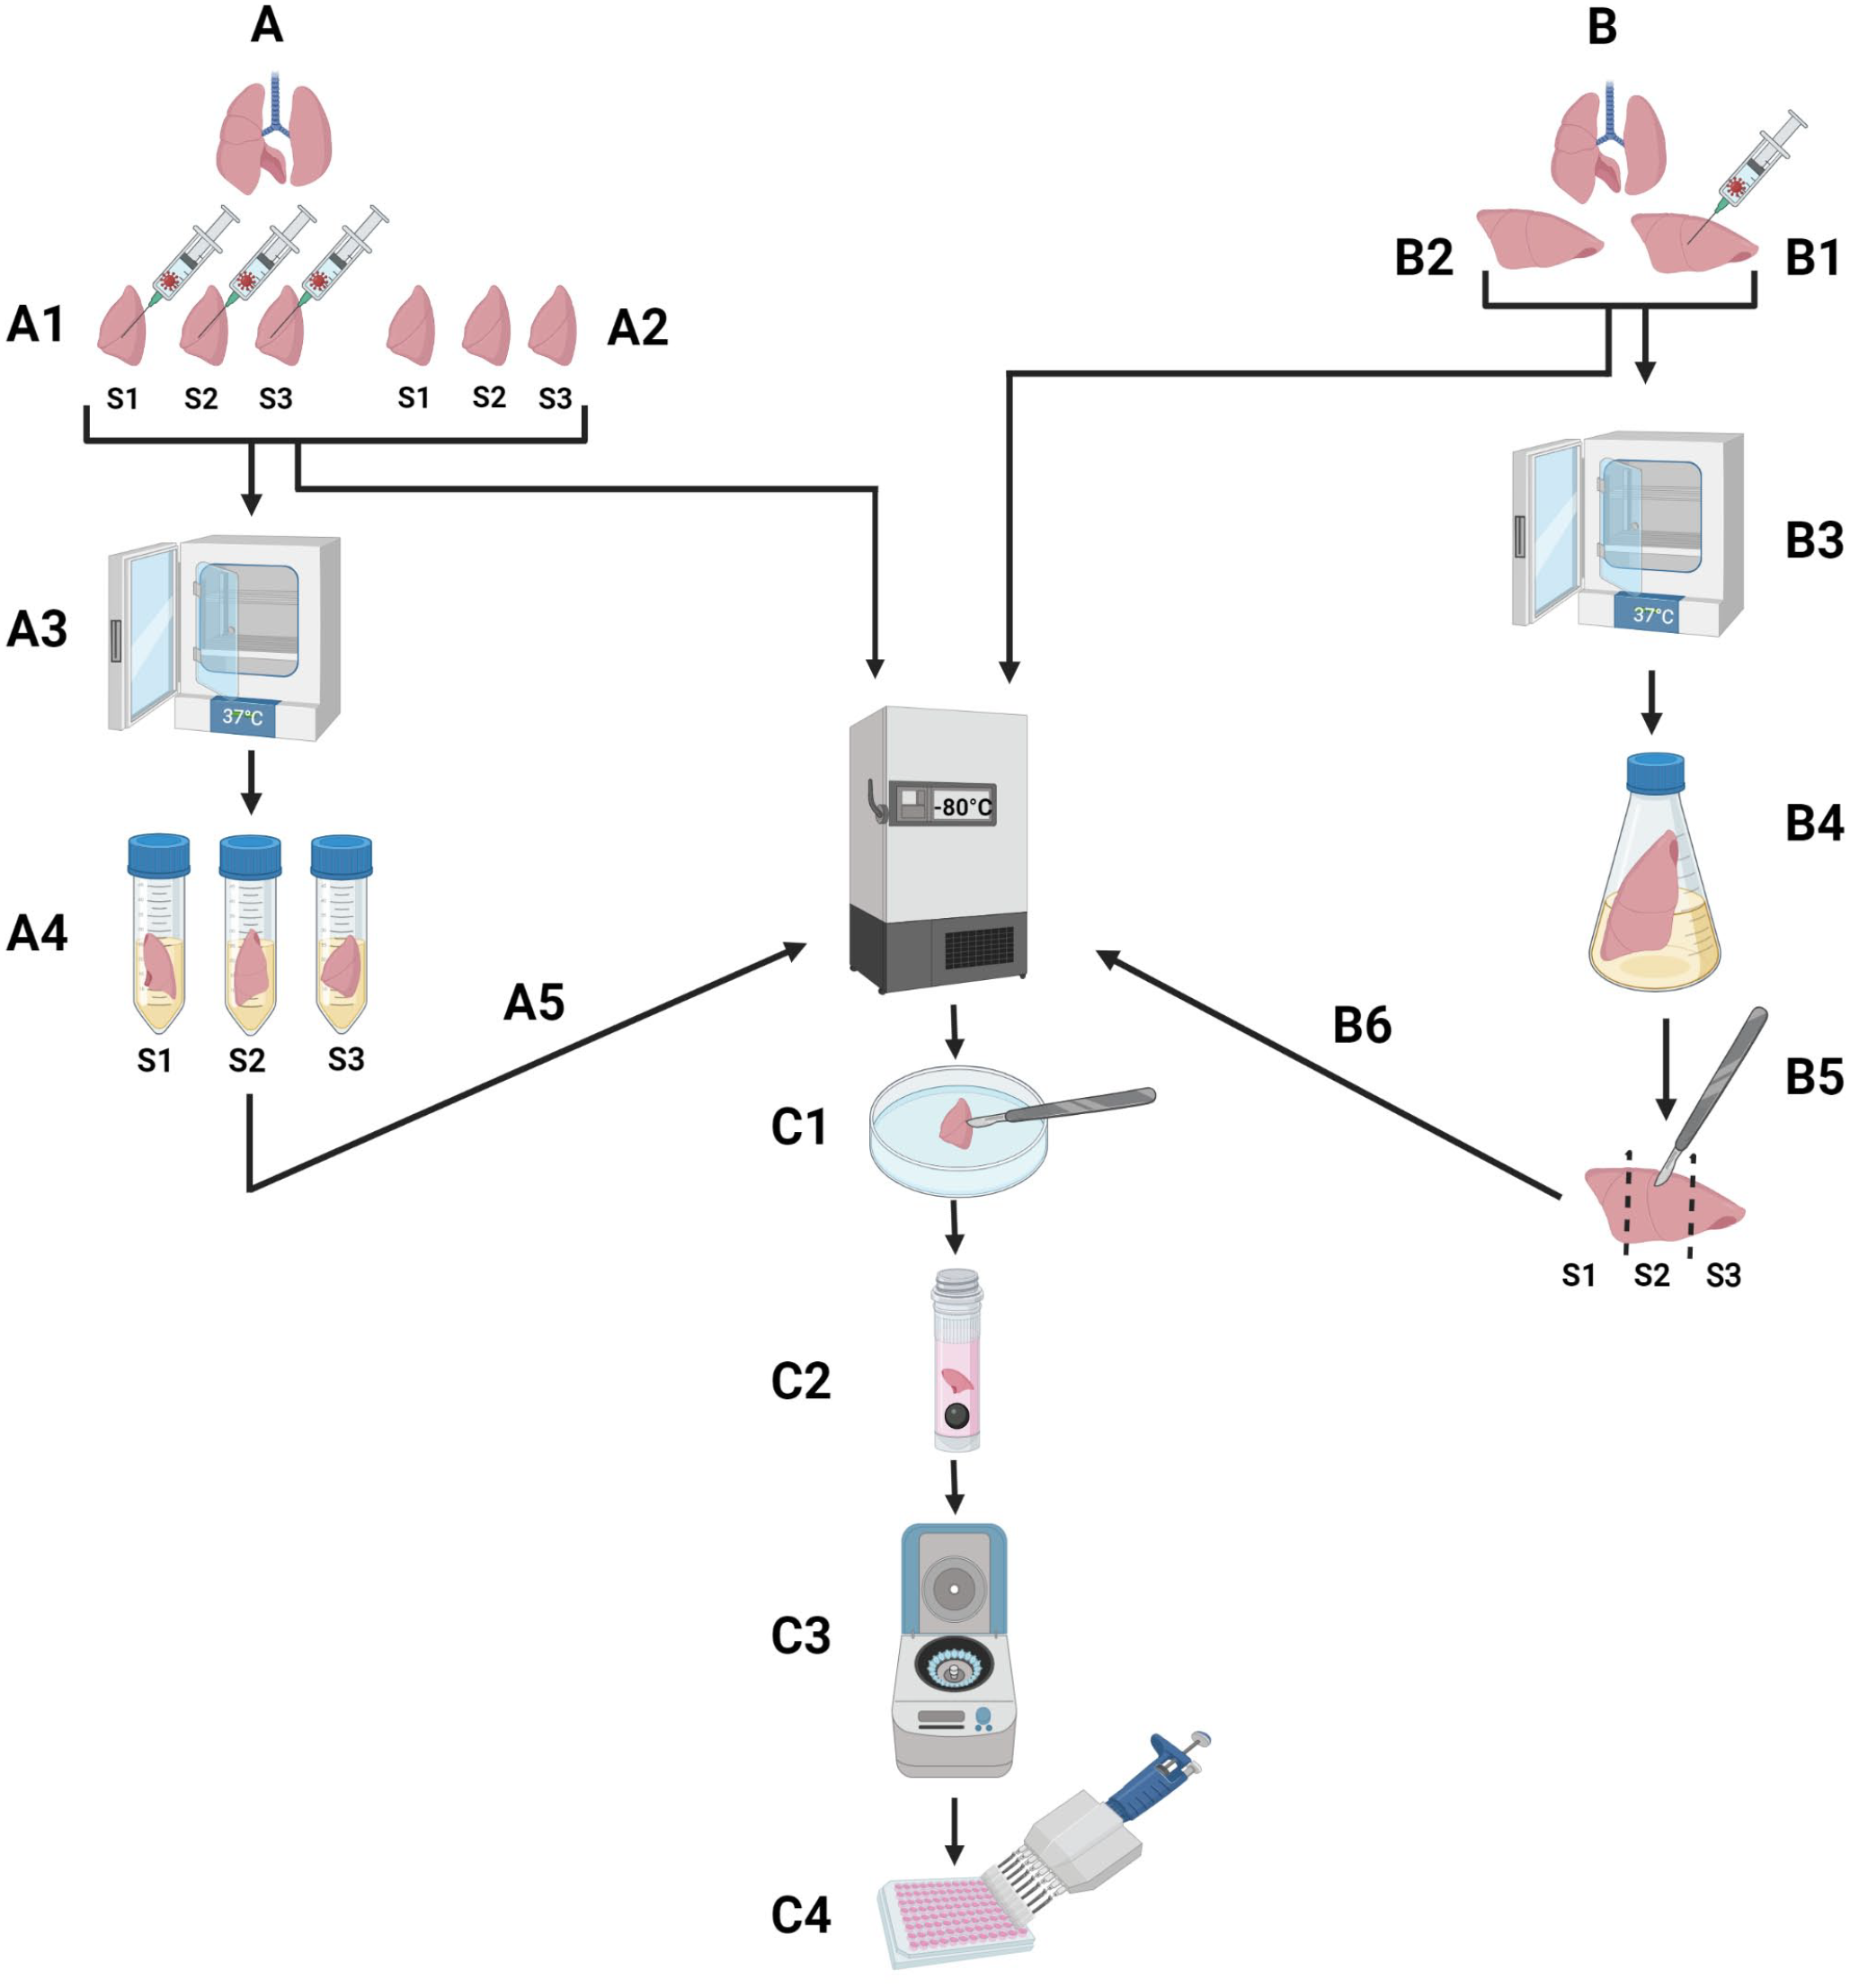
Schematic representation of two different technical approaches used for spiking of tissue samples with SARS-CoV-2. (A) Method variant used in experiments E#1 and E#2 (see also Supplemental Tables S1 and S2): (A1) Cutting of fresh pieces of tissues into three smaller pieces (S1, S2, and S3) and spiking with SARS-CoV-2 virus stock, (A2) freezing of uninfected, unfixed (naïve) and infected, unfixed samples at −80°C, (A3) incubation of spiked samples at 37°C and 5% CO2 for 1 hour, (A4) fixation with 4% formaldehyde or 5% glutaraldehyde for 72 hours at room temperature, (A5) freezing of treated samples at −80°C without fixative, (C1) washing of thawed sample with phosphate-buffered saline (PBS) and cutting of samples into the size of a rice grain, (C2) tissue homogenization with 500 µl medium and steal bead with Tissue Lyser II at 24 Hz for 1–2 minutes, (C3) centrifugation for 1 minute at 17,000 × g, and (C4) titration of the supernatant on Vero E6 cells. (B) Method variant used in experiment E#3: (B1) Cutting and spiking of larger tissue pieces, (B2) freezing of naïve and unfixed samples at −80°C, (B3) incubation of spiked samples at 37°C and 5% CO2 for 1 hour, (B4) tissue fixation and virus inactivation with 4% formaldehyde or 5% glutaraldehyde for 72 hours at room temperature, (B5) creation of three biological replicates (S1, S2, and S3), (B6) freezing of treated samples at −80°C. Steps (C1–C4) are identical to the first method (A). Created with BioRender.com (agreement number ZI24HW8SCF).
The tissue pieces within the main group 1 (Fig. 1) were spiked with 2.2 × 10⁶ TCID50/ml SARS-CoV-2 virus stock. SARS-CoV-2 volumes, ranging from 10 to 50 µl per tissue piece, were equally syringed to a maximum of three “positions” into the tissue with a 27 gauge (G) needle (Sterican) and afterward incubated for 60 minutes at 37°C with 5% CO2. Unfixed tissues spiked with SARS-CoV-2 (group 1, subgroup a) were used as positive controls. Tissue pieces of main group 2 were used as negative controls. Tissues from subgroups b and c of both main groups were immersed at a ratio of 1:20 in 4% FA or 5% GA solution, respectively. After 72 hours at room temperature, the tissues were washed with phosphate-buffered saline (PBS) and frozen at −80°C until further examination.
On the day of analysis, samples were thawed, and three pieces of the size of a rice grain (approximately 1 mm × 1 mm × 5 mm) were cut out from the tissue center to obtain three biological replicates. Tissue pieces were homogenized in 2 ml screw cap micro tubes (72.694.005, Sarstedt) with 500 µl of Dulbecco’s Modified Eagle Medium containing 1% Pen/Strep, 1% GlutaMax, and one 5 mm steel bead (69989, Qiagen) in precooled (4°C) racks with Tissue Lyser II (Qiagen) for 1 to 2 minutes. The homogenized mash was centrifuged at 17,000 × g for 1 minute at 4°C, and supernatants were titrated on Vero E6 cells in duplicate or triplicate (see Supplemental Material “Virus titration”).
For confirmation of SARS-CoV-2 inactivation, seven fresh accessory lung lobes were collected from transgenic K18-hACE2 mice at 3 days postinfection (dpi) after experimental intranasal infection with 2 × 10³ TCID50/10 µl SARS-CoV-2 (Supplemental Figure S1). Three lung lobes from negative control animals injected with PBS (mock-infected mice) were also collected after euthanasia at 3 dpi (see Supplemental Material “Ethical statements”).
From the SARS-CoV-2-infected mouse group, two lungs were used for inactivation with 4% FA, two for inactivation with 5% GA, and three were directly homogenized and frozen at −80°C. Negative controls were treated with FA, GA, or remained unfixed. The unfixed tissues were directly homogenized and frozen at −80°C, while the fixed samples were homogenized after 72 hours and stored at −80°C until analysis.
Since the amount of protein in a sample might influence the course and success of the inactivation reaction,12,19 we compared the protein contents of each tissue by performing a Bradford assay. Methodical details are provided in Supplemental Materials and Supplemental Figure S3.
In the first experiment (E#1), SARS-CoV-2 virus titers in unfixed spiked hamster samples ranged from 102.55 to 104.05 (mean 103.34 and median 103.05 TCID50/ml including two negative sample values of 102.25 TCID50/ml). In the second experiment with ferret tissue (E#2), the virus titer ranged between 102.55 and 104.55 TCID50/ml (mean 103.74 TCID50/ml; median 103.55 TCID50/ml), while in the third experiment with ferret tissue (E#3), the recovery of infectious virus was slightly lower, ranging from 102.55 to 103.55 (mean of 103.07 TCID50/ml and median 102.55 TCID50/ml include two negative samples) (Supplemental Table S3). It may be speculated that the size of the tissue sample affected the final virus load (see Supplemental Table S3). However, the impact of the dissection method and the two different technical approaches of the read-out were considered low since successful virus inactivation was proven at least three times with samples that revealed similar titration results (mean and median titers between 103.07 and 103.74 TCID50/ml, respectively 102.55 and 103.55 TCID50/ml, Supplemental Table S3). Complete virus inactivation in all spiked and inactivated tissues was achieved with 4% FA or 5% GA after 72 hours at room temperature with a tissue-to-fixative ratio of 1:20 since no cytopathic effect (CPE) was observed on Vero E6 cells after 5 to 7 dpi. The virus titer of all negative samples (no CPE) was determined as half of the detection limit (102.25 TCID50/ml). All samples treated with FA or GA showing a cytotoxic effect (CTE) but no virus-specific CPE were evaluated as negative samples (102.25 TCID50/ml). Our results show a virus titer reduction of at least 102.3 TCID50/ml, which was calculated as the highest titer achieved in spiked samples (104.55 TCID50/ml) minus the value for negative samples (102.25 TCID50/ml).
Some of the tissue supernatants, particularly the liver, showed a cell inhibiting effect, which did not affect the sample analysis (Supplemental Table S3). Exemplary microscopic images of cell morphological differences between CPE, CTE, and cell inhibition as well as for negative and positive controls are shown in Supplemental Figure S2 (see also Supplemental Materials section “Evaluation of CTE and structural changes of the tissue”). No CPE was observed in wells with naïve unfixed negative control samples. Schematic representation of results by end-point dilution assay at 5 dpi is shown in Supplemental Figure S4.
SARS-CoV-2-specific CPE with virus titers ranging from 104.05 to 106.05 TCID50/ml was determined in unfixed lung samples from mice experimentally infected with SARS-CoV-2. Inactivated lung samples showed no CPE, indicating a virus titer reduction of up to 103.80 TCID50/ml (Table 1). No CPE was found in samples from mock-infected mice inoculated with PBS.
Weight, size, and virology results obtained by an end-point dilution assay of lung homogenates.
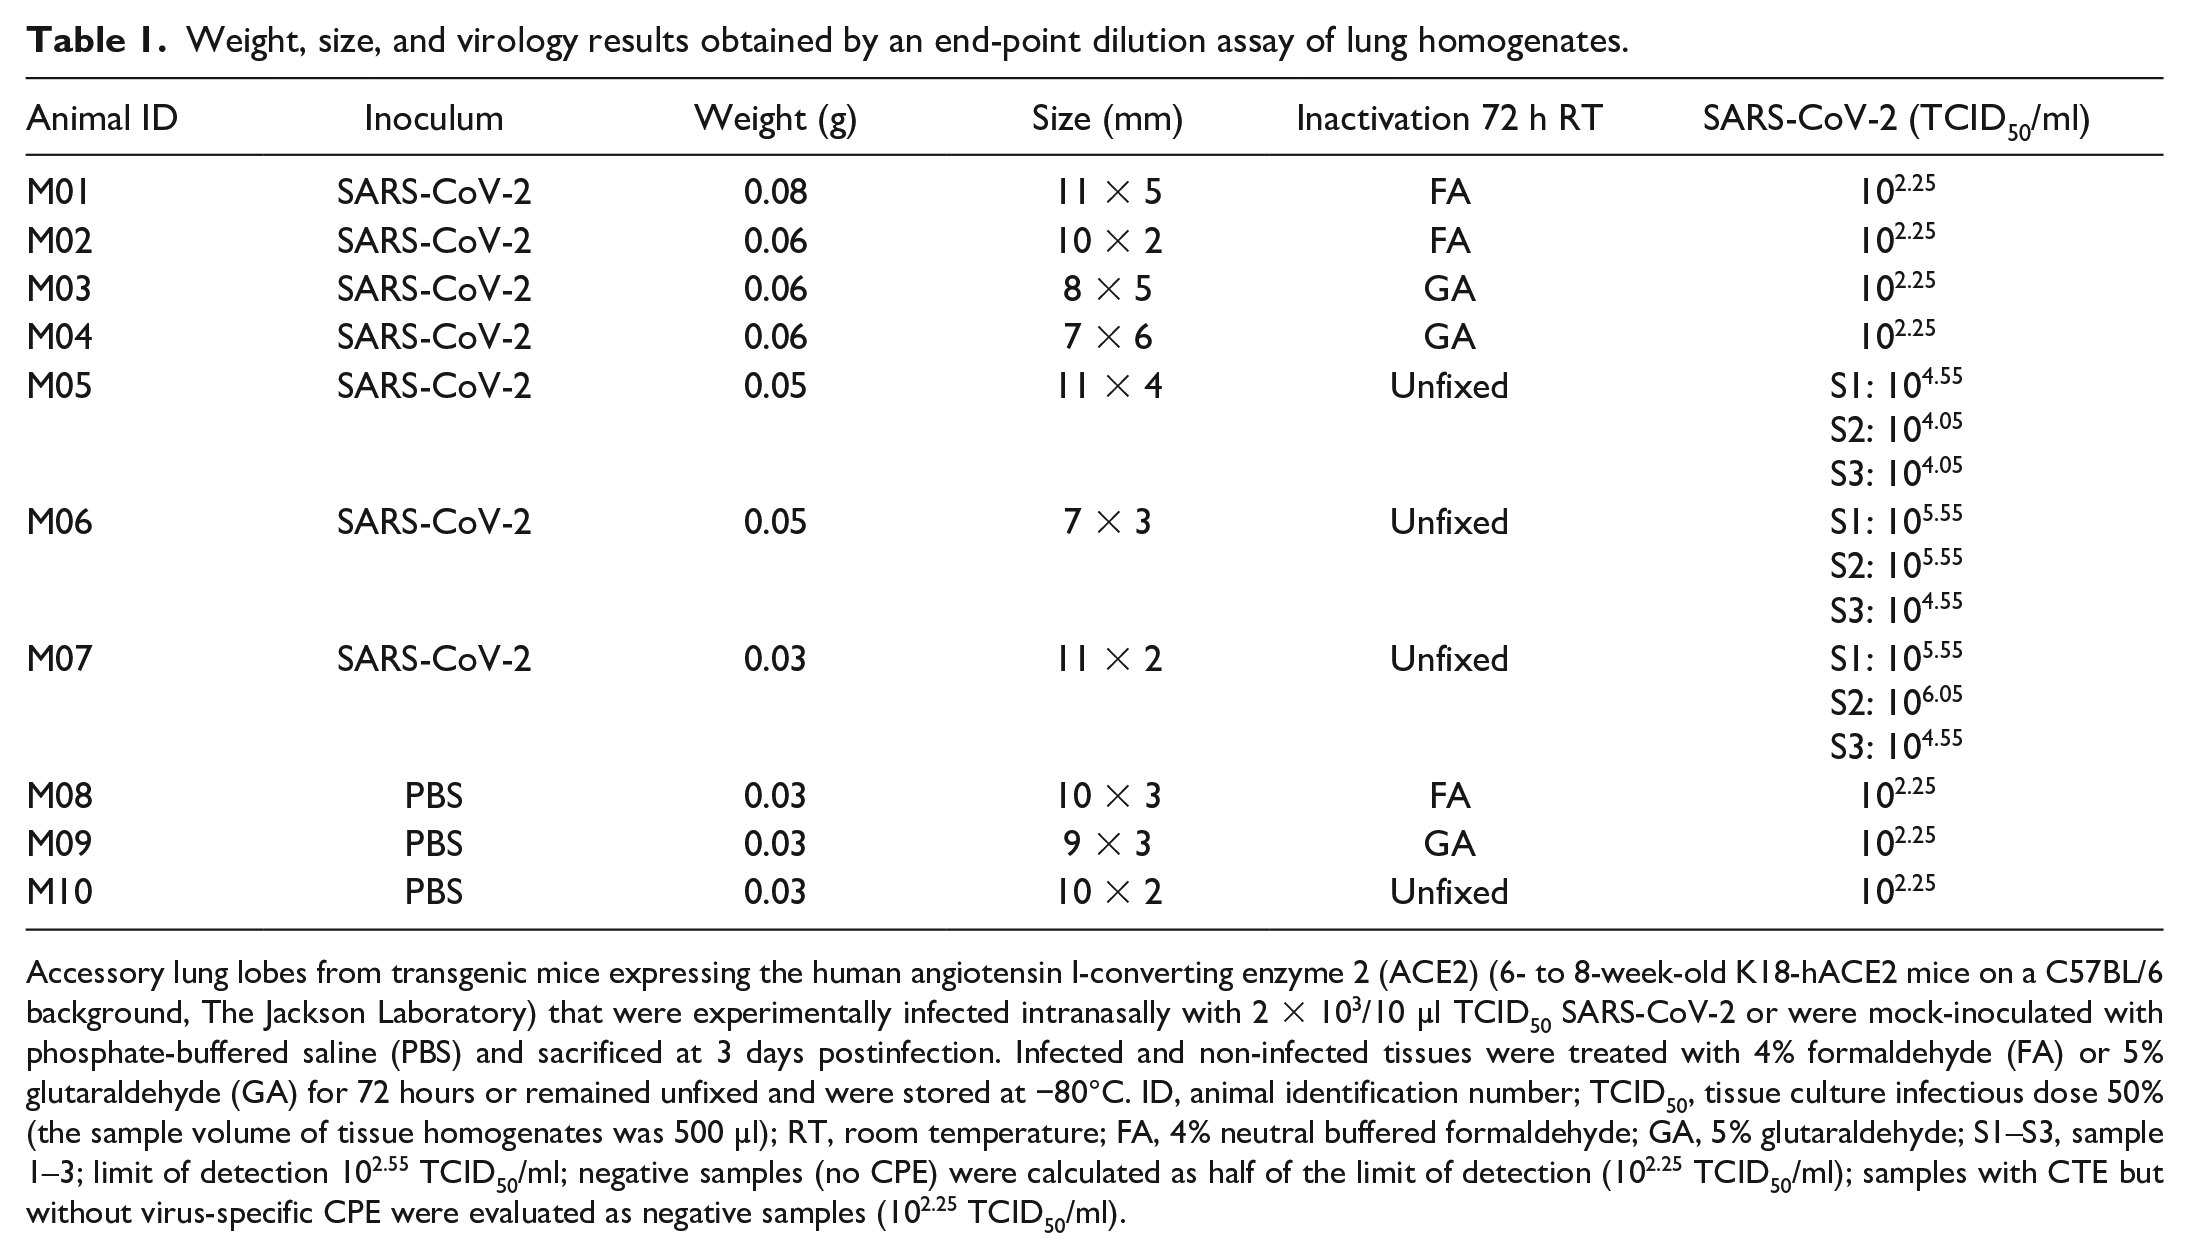
Accessory lung lobes from transgenic mice expressing the human angiotensin I-converting enzyme 2 (ACE2) (6- to 8-week-old K18-hACE2 mice on a C57BL/6 background, The Jackson Laboratory) that were experimentally infected intranasally with 2 × 10³/10 µl TCID50 SARS-CoV-2 or were mock-inoculated with phosphate-buffered saline (PBS) and sacrificed at 3 days postinfection. Infected and non-infected tissues were treated with 4% formaldehyde (FA) or 5% glutaraldehyde (GA) for 72 hours or remained unfixed and were stored at −80°C. ID, animal identification number; TCID50, tissue culture infectious dose 50% (the sample volume of tissue homogenates was 500 µl); RT, room temperature; FA, 4% neutral buffered formaldehyde; GA, 5% glutaraldehyde; S1–S3, sample 1–3; limit of detection 102.55 TCID50/ml; negative samples (no CPE) were calculated as half of the limit of detection (102.25 TCID50/ml); samples with CTE but without virus-specific CPE were evaluated as negative samples (102.25 TCID50/ml).
With the Bradford assay, the highest protein content was found in the liver (36.3 to 98.5 µg/mg; mean: 54.2 µg/mg), followed by the lung (32.1 to 62.7 µg/mg; average 44.0 µg/mg), brain (25.4 to 36.6 µg/mg; mean: 30.5 µg/mg), and kidney (20.3 to 38.4 µg/mg; mean: 29.4 µg/mg). Statistical analysis showed no significant difference between selected organs (p=0.08) (Supplemental Figure S3).
Hamsters, mice, and ferrets are currently the small laboratory animal models of choice for SARS-CoV-2 research. Physiologically heterogeneous sample matrices of varying sizes and protein contents from animals and humans infected with unknown viral loads of unequal distribution pose a particular risk and challenge for the validation of protocols, including virus inactivation.
FA and GA are known for their cytotoxicity, which has an impact on the evaluation of virus inactivation in in vitro assays. 1 GA is described as less toxic than FA, 6 which we confirmed in our study (Supplemental Figures S2d-f). In a previous study, Kumar et al 8 inactivated lung tissues from SARS-CoV-2-infected hamsters with 4% FA for 1 or 7 days. They reported no cytotoxicity on Vero E6 cells, which might be due to different protocols, different virus quantification assays, smaller tissue pieces, and/or extensive washing steps. Additionally, incubation temperature, volume ratio, and positive controls were not described. Therefore, our results cannot be compared in detail. While we recommend tissue pieces to be up to a thickness of 10 mm, other studies recommend these not to exceed 1 mm (GA) or 3 mm in thickness for purposes of electron microscopy (formaldehyde-GA combinations), 11 or 4 mm for FA fixation. 15 In contrast, other research groups report ideal thicknesses of less than or equal to 10 mm for one dimension (10% formalin, GA), 2 or to stay in the range of 6 mm width and 25 mm length (10% formalin). 1 Nevertheless, smaller sample sizes ensure rapid fixation and prevent tissue distortion or poor-quality staining. 15 Therefore, the tissue samples in our study were within the recommended range of thickness and dimensions.
The amount of protein in a sample might influence the course and success of the inactivation reaction. 12 Our Bradford analysis indicated that the respective protein content in the lung, brain, kidney, and liver does not influence the efficiency of virus inactivation, independent of the organ matrix or animal species. Similar protein contents are described for cattle liver and meat of different livestock species, including beef (about 200 µg/g). 9
In conclusion, we demonstrated the inactivation of SARS-CoV-2 by a titer reduction of up to 102.30 TCID50/ml in spiked tissue and 103.80 in tissue from experimentally infected animals up to a thickness of 10 mm or 8 mm with 4% FA and 5% GA, respectively, after a fixation and inactivation time of 72 hours at room temperature independent of the protein content. Our protocols can be easily adapted for the validation of the inactivation of other enveloped viruses or pathogens to allow for the transfer of biological samples from BSL-3 areas to BSL-1 laboratories.
Supplemental Material
sj-pdf-1-vet-10.1177_03009858231197128 – Supplemental material for SARS-CoV-2 inactivation in laboratory animal tissues with 4% formaldehyde or 5% glutaraldehyde for transfer to biosafety level 1 laboratories
Supplemental material, sj-pdf-1-vet-10.1177_03009858231197128 for SARS-CoV-2 inactivation in laboratory animal tissues with 4% formaldehyde or 5% glutaraldehyde for transfer to biosafety level 1 laboratories by Veronika Pilchová, Ahmed Elmontaser Mergani, Sabrina Clever, Malgorzata Ciurkiewicz, Kathrin Becker, Ingo Gerhauser, Wolfgang Baumgärtner, Asisa Volz, Maren von Köckritz-Blickwede and Claudia Schulz in Veterinary Pathology
Footnotes
Acknowledgements
We acknowledge the RIZ management team for their dedicated animal care and excellent technical support in the S3 facility. We would like to thank Christian Drosten, Charité, Berlin, for providing the SARS-CoV-2 human isolate (Human 2019-nCov ex China, BavPat1/2020, Ref-SKU 026V-03883) and Bart Haagmans, Erasmus MC, Netherlands, for providing the Vero E6 cells.
Supplemental Material for this article is available online.
Author Contributions
VP, AEM, MC, KB, IG, WB, MvK-B, and CS contributed to the conception and design of the work. VP, AEM, SC, AV, MvK-B, and CS contributed to the acquisition, analysis, or interpretation of data for the work. VP drafted the work. MvK-B and CS revised the work. All authors agreed to the final approval of the version to be published and agreed to be accountable for all aspects of the work in ensuring that questions related to the accuracy or integrity of any part of the work are appropriately investigated and resolved.
Declaration of Conflicting Interests
The author(s) declared no potential conflicts of interest with respect to the research, authorship, and/or publication of this article.
Funding
The author(s) disclosed receipt of the following financial support for the research, authorship, and/or publication of this article: This study was in part supported by a BMBF (Federal Ministry of Education and Research) project entitled RAPID (Risk assessment in re-pandemic respiratory infectious diseases, 01KI1723G, WB), by the Ministry of Science and Culture of Lower Saxony in Germany (14-76103-184 CORONA-15/20, IG, WB), and by the COVID-19 Research Network of the State of Lower Saxony (COFONI) with funding from the Ministry of Science and Culture of Lower Saxony, Germany (14–76403–184, WB, MC, AV, MvK-B).
References
Supplementary Material
Please find the following supplemental material available below.
For Open Access articles published under a Creative Commons License, all supplemental material carries the same license as the article it is associated with.
For non-Open Access articles published, all supplemental material carries a non-exclusive license, and permission requests for re-use of supplemental material or any part of supplemental material shall be sent directly to the copyright owner as specified in the copyright notice associated with the article.