
Abstract
The kidneys play an important role in blood pressure regulation under normal and pathological conditions. We examined the histological changes and expression patterns of cyclooxygenase-2, renin, and (pro)renin receptor (PRR) in the renal cortex of prehypertensive spontaneously hypertensive rats (SHRs) and Wistar Kyoto rats (WKYs). Moreover, blood pressure and plasma urea, creatinine, angiotensin II, and angiotensin (1–7) levels were measured. The results showed that both strains had similar blood pressure and plasma urea and creatinine levels. The glomerular area, basement membrane thickness, collagen fiber content, and arterial wall thickness were greater in SHRs than in WKYs. By immunohistochemistry, cyclooxygenase-2 was localized in the macula densa and renal tubules of both strains. In SHRs, cyclooxygenase-2 was detected in a larger number of tubules, and the cortical expression of cyclooxygenase-2 was also increased. In both strains, PRR and renin were localized in the tubular epithelium and juxtaglomerular cells, respectively. In SHRs, PRR immunolocalization was increased in the glomerulus. The cortical expression of immature renin was markedly increased in SHRs compared to that in WKYs, while renin was significantly decreased. These changes were associated with higher plasma angiotensin II levels and lower plasma angiotensin (1–7) levels in SHRs. The results indicate that the kidneys of SHRs showed morphological changes and variations in cortical expression patterns of PRR, cyclooxygenase-2, and renin before the development of hypertension.
Primary arterial hypertension is a common disease in humans with a significant impact on public health due to its associated complications, such as stroke, vascular injury, heart failure, and kidney disease. 10 This disorder has been widely studied in animal models of hypertension, such as spontaneously hypertensive rats (SHRs). 48 Several researchers have reported renal structural and functional changes in the prehypertensive stages of SHR, including renal interstitial fibrosis and decreases in glomerular filtration rates. 25,41,58 In addition, the renal weight/body weight ratio was decreased in 4-week-old prehypertensive SHRs, and fewer nephrons were found in the kidneys of SHRs than in Wistar Kyoto rats (WKYs) at birth. 5,41,58
In different hypertension models, one of the most important regulatory pathways is the renin-angiotensin system (RAS). 13,32 Angiotensin II (Ang II) and its receptor AT1 are increased in prehypertensive SHRs. 7,9 In addition, there is evidence that Ang II promotes renal inflammatory processes, since the administration of an AT1 blocker prevents the increase in inflammatory markers in prehypertensive SHRs. 23 In the renovascular hypertension model, a high Ang II level was found in the serum and was related to renal alterations, such as hypertrophic vessels, podocyte effacement, albuminuria, and glomerulus extracellular matrix accumulation. 6
In contrast, the contribution of cyclooxygenase-2 (COX-2) to renal physiology in prehypertensive SHRs has not been well documented. The COX isoforms (COX-1 and COX-2) are responsible for the production of prostanoids that play multiple roles in the kidney, such as vascular tone regulation, glomerular filtration maintenance, and sodium and water regulation. 21 The contribution of COX-2 to renal alterations has been shown in the renovascular hypertension 2-kidney 1-clip model 49 in which COX-2 expression was upregulated in association with interstitial fibrosis, and treatment with the COX-2-specific inhibitor celecoxib reduced this effect. It is unknown whether (pro)renin receptor (PRR), COX-2, and renin are altered prior to blood pressure increase in SHRs, which would suggest the involvement of these pathways in the development of early renal structural changes in SHRs. This study examined renal morphological and functional changes and the cortical expression of PRR, COX-2, and renin in prehypertensive SHRs.
Materials and Methods
Experiments were performed on 6-week-old male SHR/NCrl (SHR) and WKY/NCrl (WKY) rats (70–100 g body weight; Charles River Laboratories) provided by the Instituto de Fisiología Celular, Universidad Nacional Autónoma de México. The rats were housed at a controlled temperature (20 ± 4 °C) and exposed to a daily 12-hour light–dark cycle, with free access to normal rat chow and tap water. The animals were handled in accordance with the Federal Regulations for Animal Experimentation and Care (NOM-062-ZOO-1999, SAGARPA, México), and all experimental procedures were approved by the Institutional Bioethics and Investigation Committee (No. 1022).
Arterial Pressure Measurements
Systolic arterial blood pressure was measured noninvasively in conscious rats using a tail-cuff computer-aided monitoring device (Automatic Blood Pressure Computer, Model LE 5007; Letica Scientific Instruments) according to a previously described procedure. 7 Briefly, the rats were restrained in a plastic container (size-matched), while a sensor and ring containing inflatable latex were placed in the tail. The rats were kept warm in the same device (37 °C). All animals were trained to be inside the container, the cuff was placed on the tail, and the latex ring was inflated and deflated (this step was performed several times a week). The blood pressures of the rats were recorded. The mean of 4 measurements was used to determine the blood pressure of each rat.
Plasma Urea and Creatinine Levels
For plasma urea and creatinine determination, blood was collected on the same day as euthanasia. The rats were anesthetized with sodium pentobarbital (60 mg/kg, intraperitoneally), and blood samples were obtained via aortic puncture and treated with heparin (500 µL/mL; Sigma-Aldrich). The samples were centrifuged (Sovall RT6000D, rotor H1000B; DuPont) at 1879 g for 10 minutes at 4 °C. The urea and creatinine levels in the plasma samples were determined using an automated process on the IL-300 Plus Chemistry Analyzer (Diamond Diagnostics Holliston).
Plasma Ang II and Ang (1–7) Levels
The plasma samples were incubated with a protease inhibitor cocktail (Complete Mini; Roche Diagnostics) to prevent the exogenous generation of angiotensin and then immediately preserved at −70 °C until use. The plasma was deproteinized with methanol (Sigma-Aldrich) at a ratio of 10:1 (v/v) and centrifuged at 16 000g for 10 minutes at 4 °C (Sorvall RC-28S, Rotor F50L; DuPont). The pellet was discarded, and the supernatant was deproteinized by the addition of 5% trichloroacetic acid (Sigma-Aldrich), homogenized, and centrifuged at 16 000g (Sorvall RC-28s, Rotor F50L; DuPont) for 10 minutes at 4 °C. The supernatant was filtered through a 0.22-µm nitrocellulose membrane filter (Millipore) and diluted 1:10 with 0.1 M NaOH (Sigma-Aldrich). The sample (2.0 mL) was passed through a Sep-Pak Classic C-18 cartridge (Waters Corporation), and then 100 µL of the final filtered sample was employed for the analysis. Ang II and Ang (1–7) were detected and quantified simultaneously using capillary zone electrophoresis with ultraviolet detection with a photodiode array at a wavelength of 200 nm, as previously described. 56 The analysis was performed using a P/ACE MDQ system equipped with ultraviolet-photodiode array detection (Beckman Coulter Inc) and controlled by 32 Karat Software version 7.0 (Beckman Coulter Inc). Ang II and Ang (1–7) levels were determined using standard curves.
Histopathological Studies
The kidneys were exposed and prepared for the perfusion. Briefly, after midline laparotomy, the aortic artery was cannulated and both kidneys were removed and perfused with cold phosphate-buffered saline (PBS) at a pH of 7.4 and at a constant flow rate of 10 mL/min at 4 °C to remove the blood cells. All histopathological examinations were performed using standard laboratory procedures. The kidney cortex was fixed in 4% paraformaldehyde for 24 hours, transferred to PBS and 70% ethanol, and then processed with a graded series of ethanol solutions and xylol. The tissues were subsequently embedded in paraffin and serially sectioned (4 µm thick). The sections were stained with hematoxylin and eosin, periodic acid–Schiff stain (PAS), Masson trichrome stain, and reticular fiber silver stain for histological examination. The sections were evaluated in a double-blind manner by a histopathologist using the image analysis software ZEN 2.1 Lite (Carl Zeiss Microscopy). The microphotographs were captured at 63× magnification.
Electron Microscopy
Pieces of the kidney cortex were fixed in 2.5% glutaraldehyde–4% formaldehyde in PBS at pH 7.2 for 2 hours and then postfixed in 1% osmium tetroxide in PBS buffer for 1 hour. Tissues were dehydrated using a graded series of ethanol and embedded in EPON (Embed 812, Electron Microscopy Sciences). The areas used for thin sections were selected from the semi-thin sections stained with toluidine blue. The grids were counterstained with uranyl acetate and lead citrate. Ultrathin sections were evaluated at various magnifications in 3 randomly selected animals per group. The thickness of the glomerular basement membrane (GBM) was measured in electron micrographs obtained at 12 000× and 25 000× magnification under a JEOL 1010 electron microscope operated at 60 kV and the image analysis software ZEN 2.1 Lite (Carl Zeiss Microscopy).
Immunohistochemistry Studies
Immunohistological staining using antibodies against renin, COX-2, and PRR was performed on the renal cortex. Briefly, after the kidney sections were mounted on poly L-lysine-coated glass slides, they were deparaffinized in xylene and rehydrated. Antigen unmasking was performed by microwaving the tissue sections in 0.1 M citrate buffer at pH 6 (BioGenex). After cooling, the tissue sections were washed in PBS and then incubated with the following primary antibodies: rabbit monoclonal anti-COX-2 51 (1:100 in PBS dilution; CRM 306 A) or goat polyclonal anti-renin 55 (1:100 in PBS dilution; sc-27318 [E-17]; Biocare Medical and Santa Cruz Biotechnology, respectively). A negative control was performed by adding PBS instead of the primary antibody. After washing, the sections were incubated with anti-goat (1:100 in PBS dilution) or anti-rabbit (1:100 in PBS dilution) immunoglobulin conjugated to fluorescein isothiocyanate (Jackson Immunoresearch) for 2 hours in the dark at room temperature. The sections were covered with mounting medium for fluorescence microscopy (Vectashield Mounting Medium). Immunolabeling of the PRR protein was performed by immunohistochemistry with horseradish peroxidase-diaminobenzidine detection. The sections were rehydrated, and antigenic retrieval was performed as previously described. Sections were incubated with primary anti-PRR antibody (1:200 in PBS dilution; Ab40790, Abcam) or PBS for control and detection was performed with Histostain-SP Kits Invitrogen LAB-SA Detection System; Ref. 95-9943 (Invitrogen Corporation) according to the supplier’s instructions. After the sections were washed 3 times with PBS, they were incubated with diaminobenzidine Substrate Kit, Peroxidase, Ref. SK-4100 (Vector Laboratories) for 1 minutes. Cell nuclei were stained with hematoxylin. The number of renal tubules sections and zones of juxtaglomerular cells positive for COX-2 and renin were quantified in 50 fields of renal cortex per animal. The microphotographs were captured at 40× magnification for PRR and 63× magnification for renin and COX-2.
Western Blot Analysis
This analysis was performed to quantitatively evaluate the expression of COX-2 and renin. Renal cortex tissue samples (25 mg) were lysed in radioimmunoprecipitation assay buffer (1 mL) containing 50 mM Tris-HCl, 150 mM NaCl, 1 mM EDTA, 1% (v/v) Triton X-100, 0.1% (w/v) sodium dodecyl sulfate, 0.5% (w/v) sodium deoxycholate, and a protease inhibitor cocktail (Complete Mini Roche) and centrifuged at 9520g for 10 minutes at 4 °C. The supernatant was collected, and the protein was quantified using the Lowry protein assay (Thermo Fisher). Samples of the supernatants containing 100 µg of proteins were heated for 5 minutes in Laemmli buffer, separated by sodium dodecyl sulfate–polyacrylamide gel electrophoresis with a 10% gel in a Bio-Rad Mini Protean tetra vertical, and then electroblotted onto Immobilon-FL polyvinylidene difluoride membrane for western blotting (Sigma) using a mini trans-blot (Bio-Rad Laboratories). The membrane was blocked with Tris-buffered saline (TBS) buffer containing 6% non-fat dry milk. For immunodetection, the blots were incubated overnight at 4 °C with the following antibodies diluted in TBS: mouse monoclonal anti-renin 1:1500 (sc-137252 (A-1); Santa Cruz Biotechnology, Inc), mouse monoclonal anti-COX-2, 1:1500 (sc-376861 (H-3); Santa Cruz Biotechnology, Inc), and β-actin rabbit mAb 1:5000 (D6A8; Cell Signaling Technology). Then, the blots were incubated for 1 hour at 4 °C with fluorescently labeled secondary antibodies (LI-COR Biosciences) diluted 1:5000 in TBS. Immunoblots were digitalized with an Odyssey CLx Imaging System (LI-COR Biosciences), and densitometric analysis of the bands was performed using ImageJ software (NIH). Quantification of the bands was performed by measuring the mean optical density of a square area. The results of the optical density measurements for the 7 samples were expressed as the mean ± standard error.
Statistical Analysis
All parameters determined in this study are presented as mean ± standard error of the mean. The means for all assays were compared using Student’s t test, and P values <.05 were considered statistically significant. The analysis was performed using Sigmaplot 12.5 software. The data analyzed in this study are available upon request from the corresponding author.
Results
Determination of the Systolic Arterial Pressure and Plasma Ang II, Ang (1–7), Plasma Urea, and Creatinine Levels
As expected, both strains exhibited normal blood pressure levels without significant differences between WKY (107.8 ± 3.8 mm Hg) and SHR groups (111.8 ± 3.4 mm Hg; Fig. 1). In contrast, the heart rate was significantly higher in prehypertensive SHRs (458.0 ± 8.0 beats/min; P < .05) than in WKYs (416.0 ± 6.1 beats/min). To evaluate RAS activity, we determined the plasma Ang II and Ang (1–7) levels in SHRs and WKYs. Plasma Ang II levels were significantly higher in prehypertensive SHRs than in WKYs (Fig. 2), whereas the plasma Ang (1–7) levels were significantly lower in SHRs (Fig. 3). To evaluate renal function, we determined the plasma urea and creatinine levels in both groups. The prehypertensive SHRs exhibited similar values of plasma urea (12.4 ± 1.07 mg/dL) compared to age-matched WKYs (13.6 ± 1.46 mg/dL), and similar values for plasma creatinine were observed in SHRs (0.232 ± 0.029 mg/dL) and WKYs (0.308 ± 0.55 mg/dL).
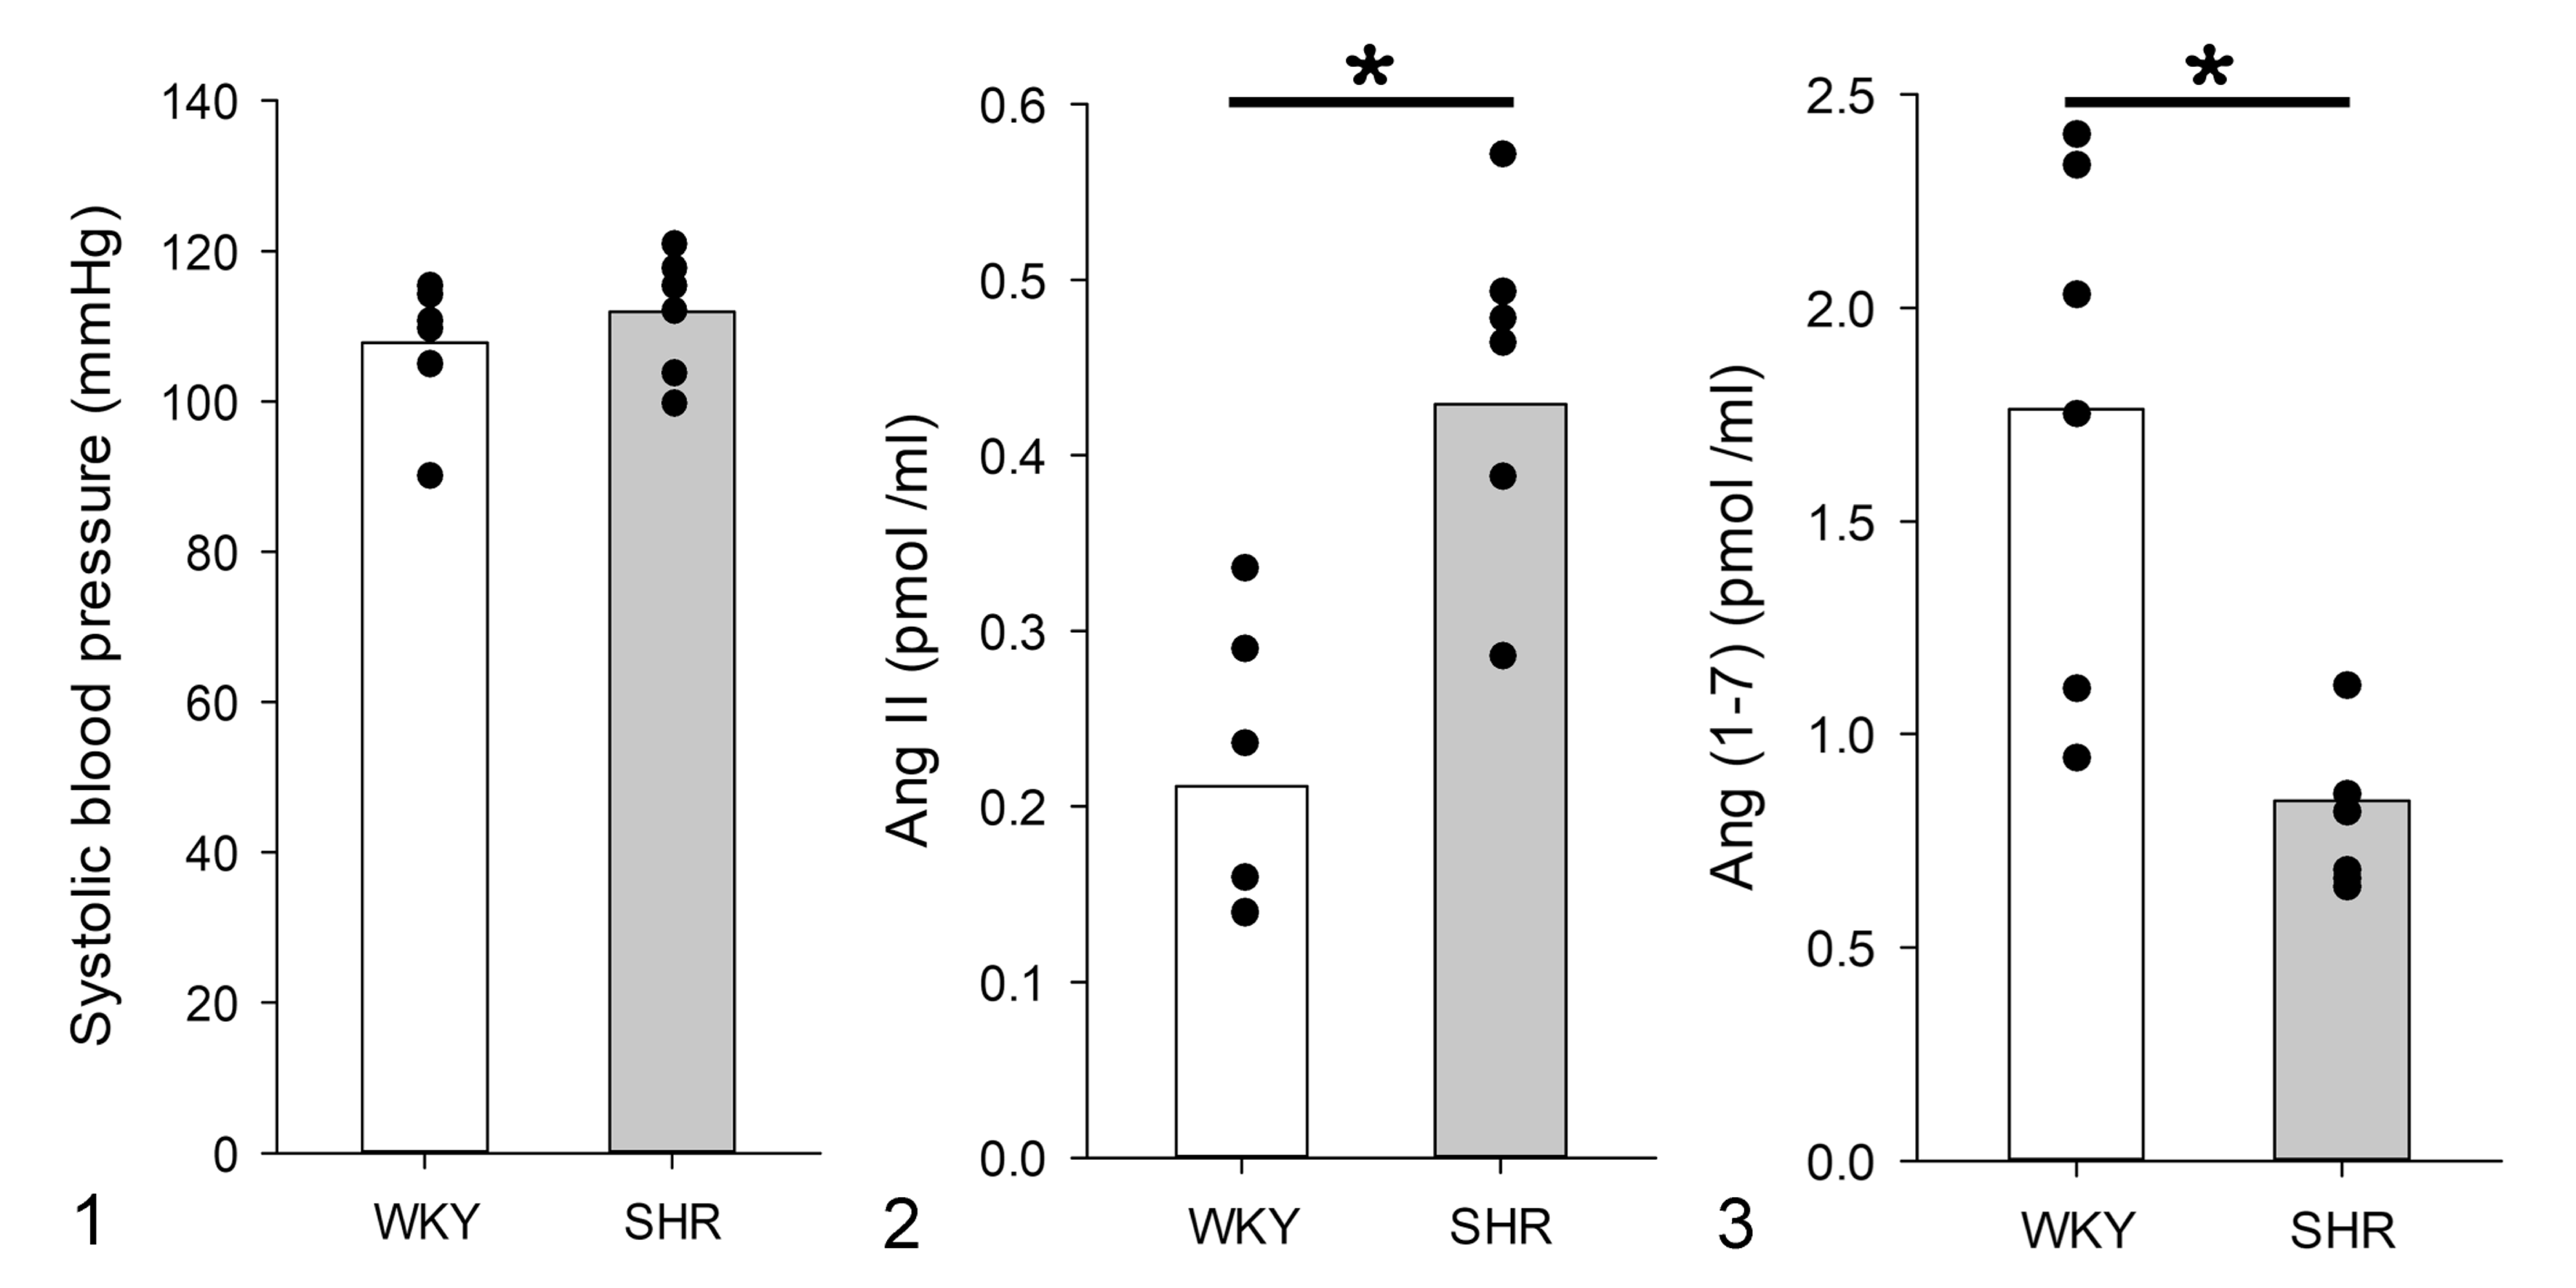
Systolic blood pressure and plasma angiotensin II (Ang II) and angiotensin (1–7) (Ang (1–7)) levels in Wistar Kyoto rats (WKYs; white bars) and spontaneously hypertensive rats (SHR; gray bars).
Renal Histopathology
Histologically, in comparison to WKYs (Fig. 4), there was an increase in the glomerular size in the kidney cortex of SHRs (Fig. 5). In contrast to WKYs (Fig. 6), in SHRs there was diffuse sclerosis in glomerular capillaries, including greater accumulation of PAS-positive extracellular matrix (Fig. 7). In addition, SHRs had renal tubular hypertrophy, higher intratubular protein levels, increased mesangial cell proliferation, and GBM thickening compared to WKYs (Figs. 6, 7). In comparison to WKYs (Fig. 8), SHRs had greater glomerular collagen deposition (based on Masson trichrome stain; Fig. 9). Furthermore, the glomerular area was significantly increased in SHR compared to WKY (Fig. 10).
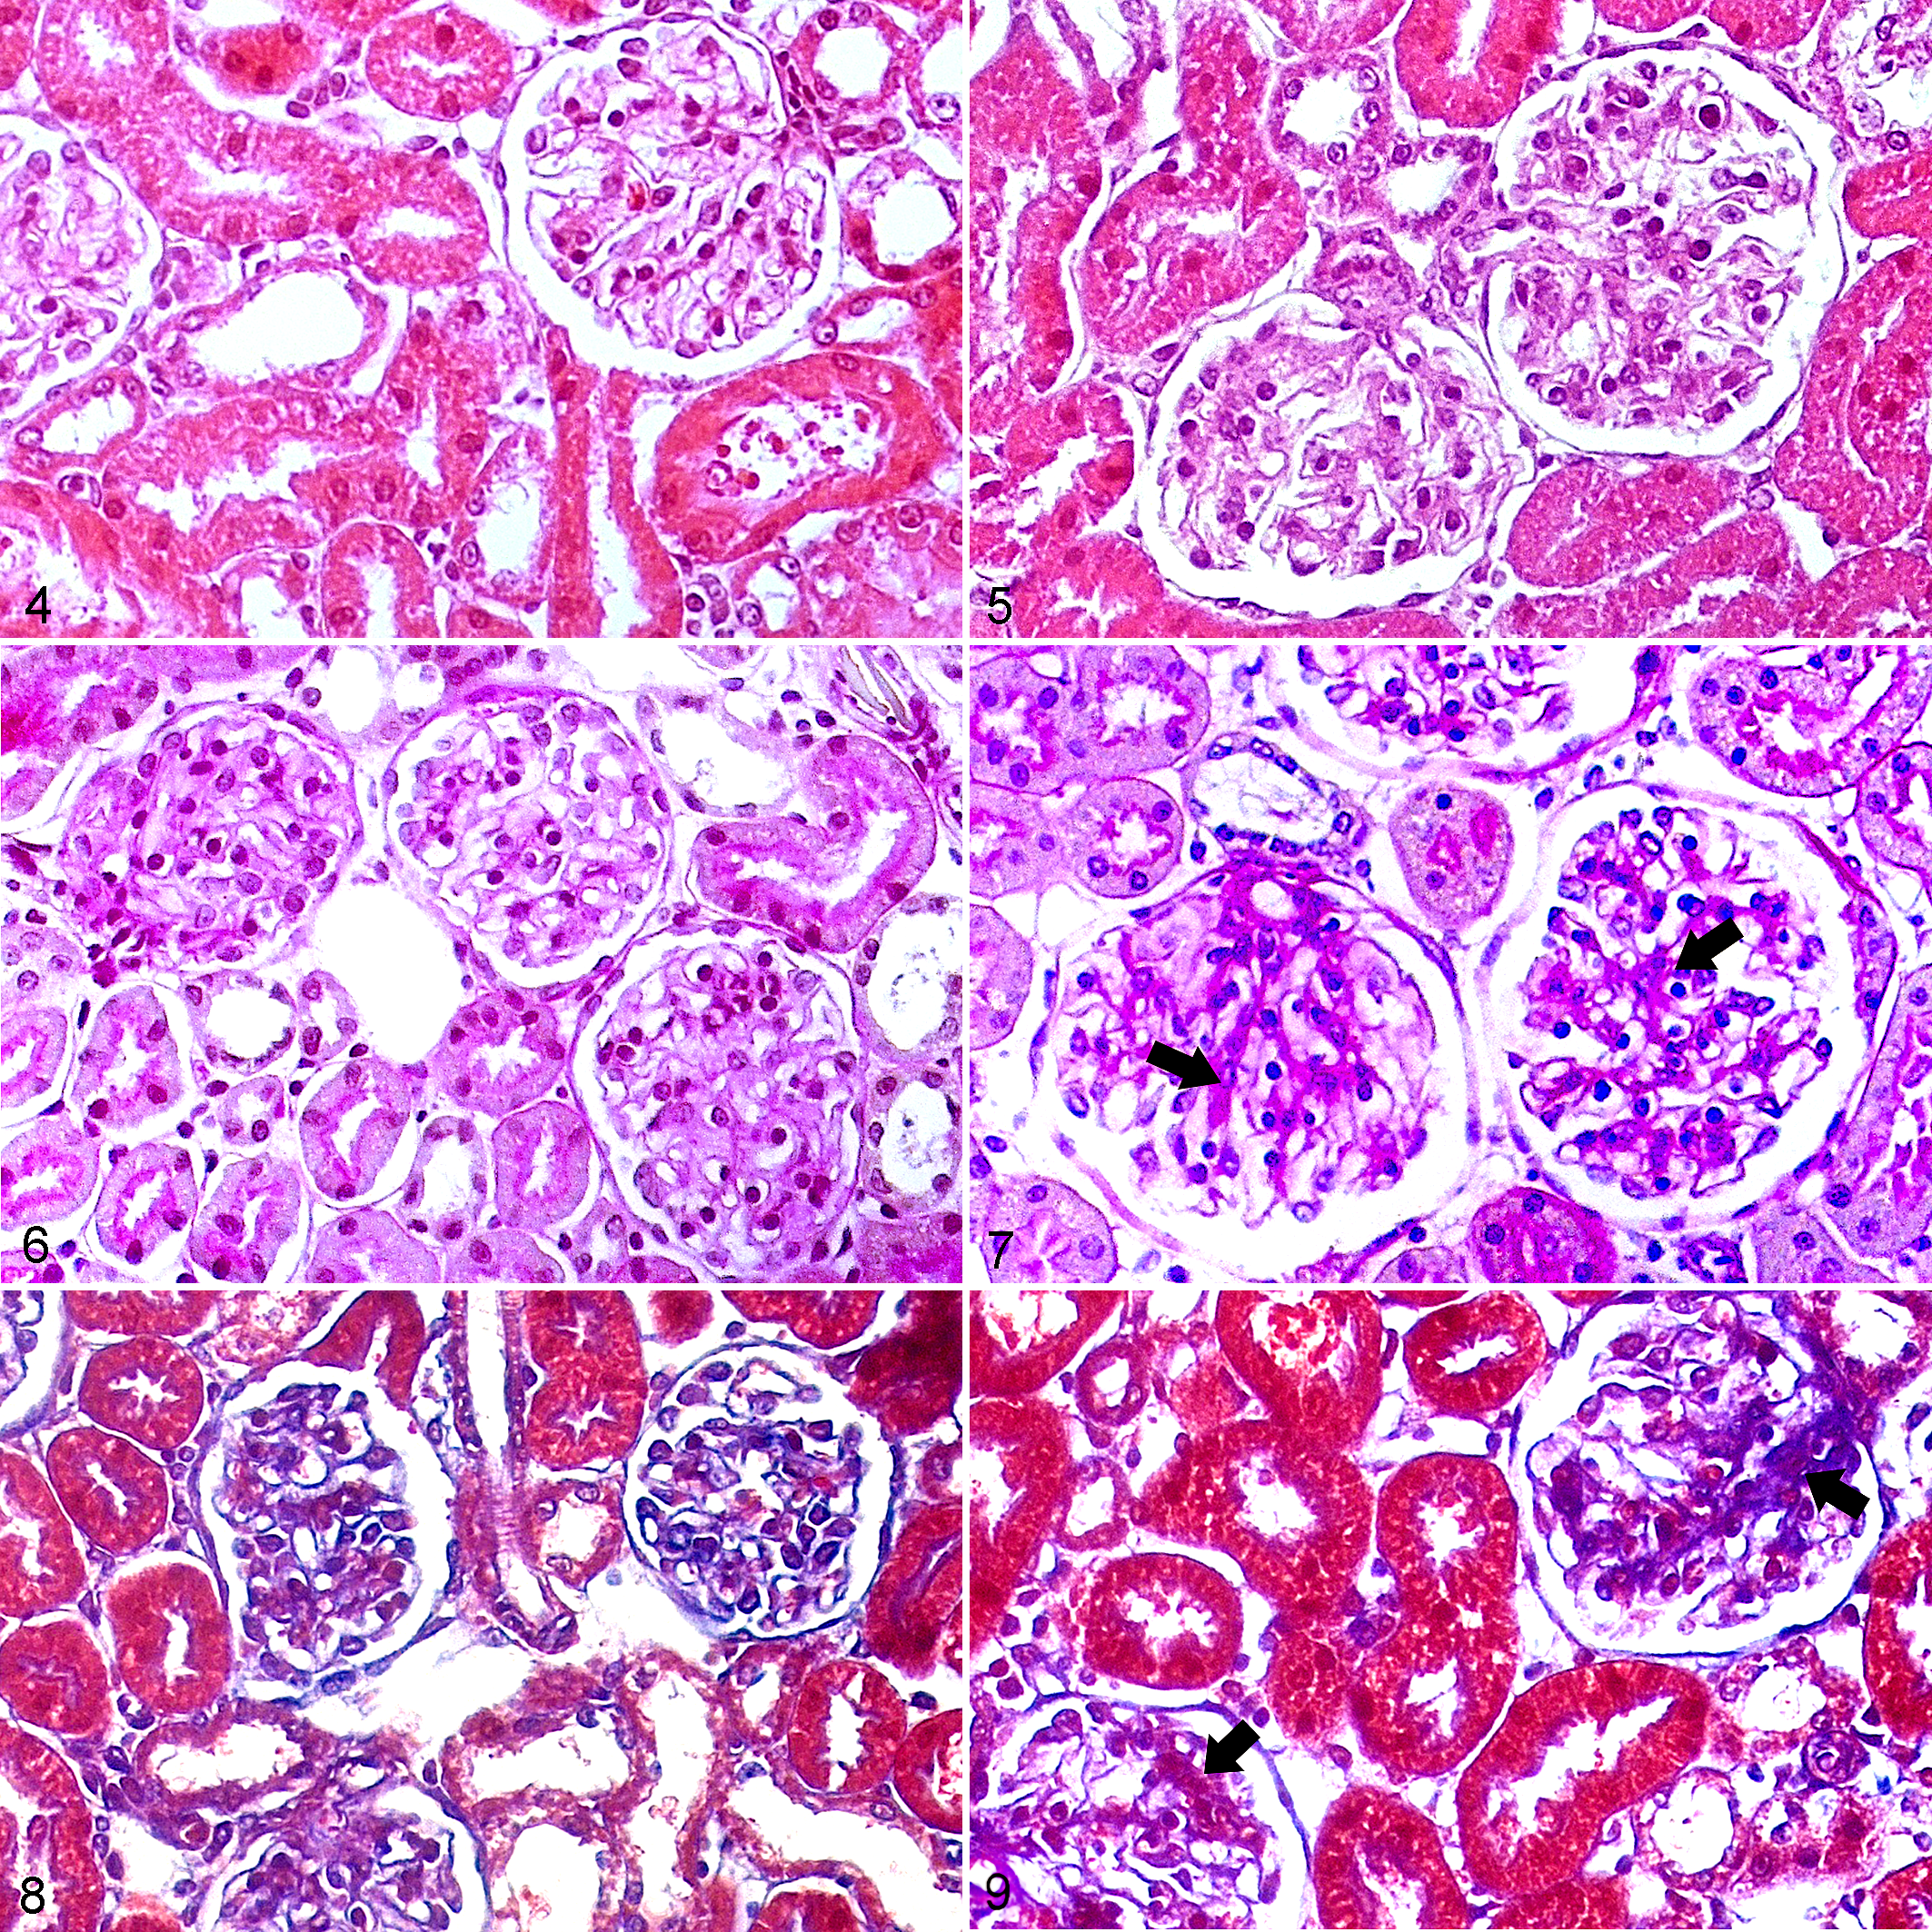
Kidney, Wistar Kyoto rats (WKY; Figs. 4, 6, 8) and spontaneously hypertensive rats (SHR; Figs. 5, 7, 9).
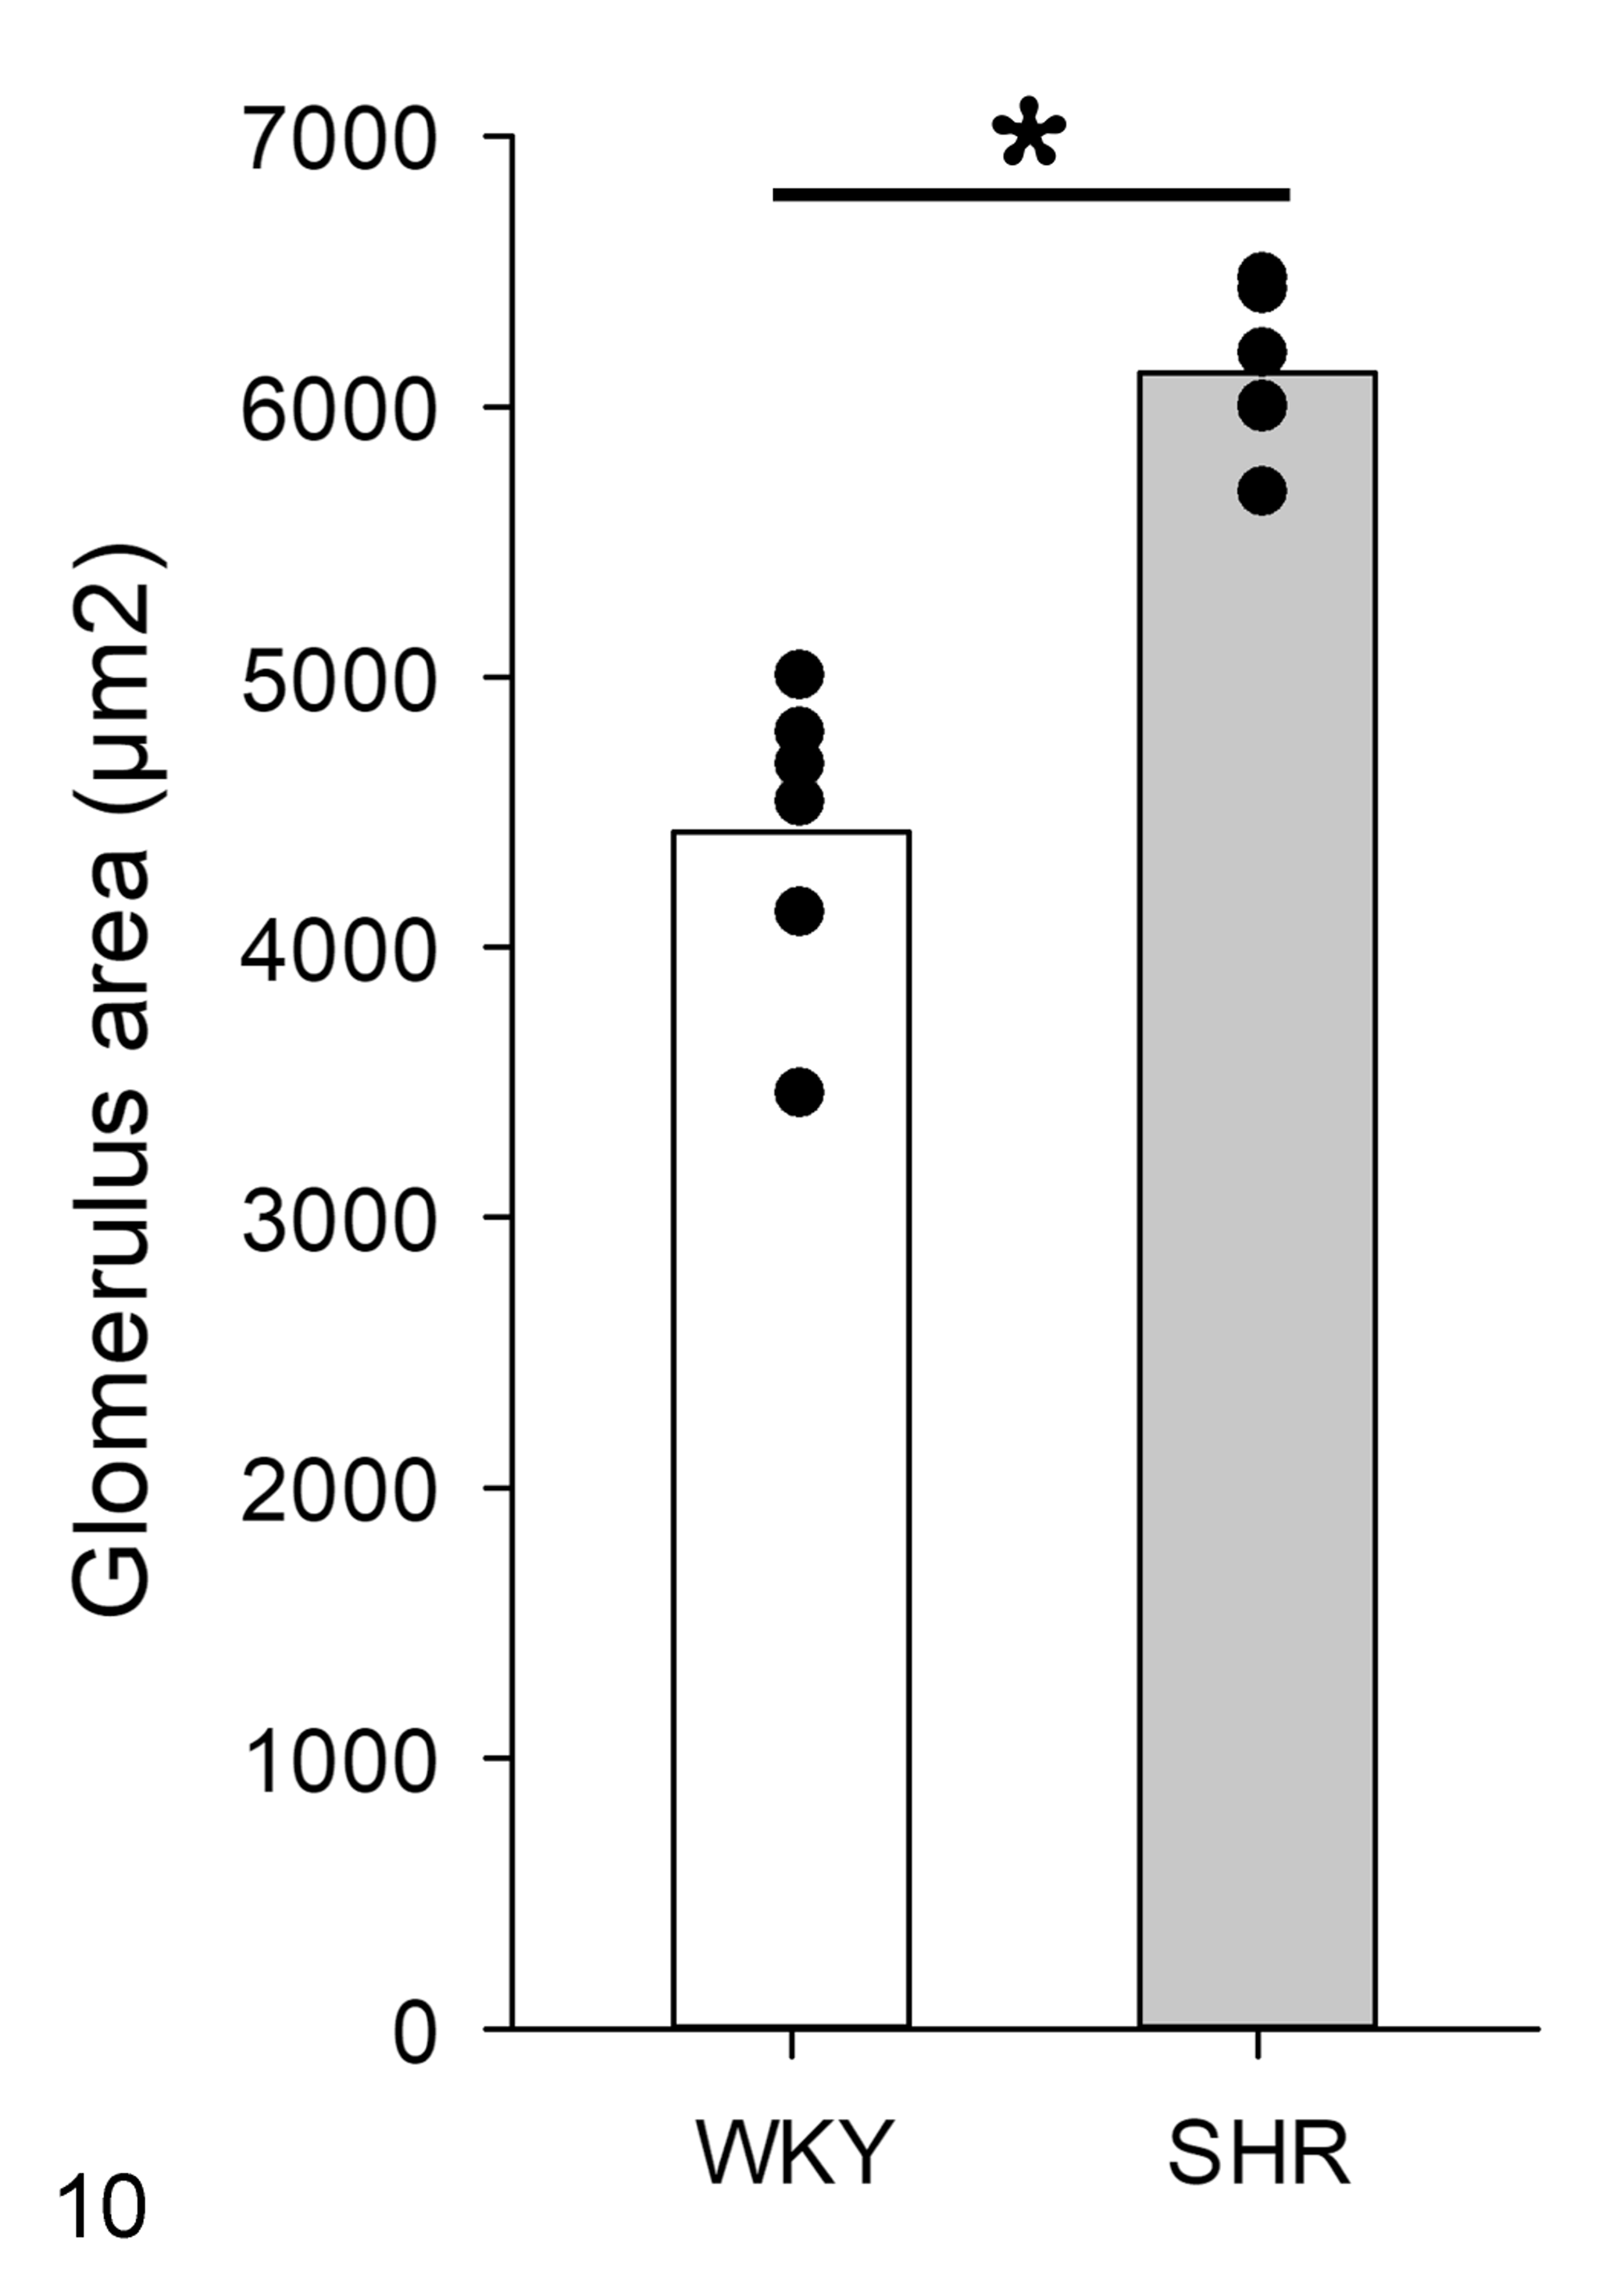
Based on morpholometric evaluation, there is an increased glomerular area in spontaneously hypertensive rats (SHR) compared to that in Wistar Kyoto rats (WKY). Means and individual data points. N = 6, *P < .05.
No morphological modifications were observed in arteries in WKYs (Fig. 11), while in SHRs luminal narrowing was present along with hypertrophy of the tunica media (Fig. 12). In addition, arteries of SHRs had elastin remodeling and new deposition in the wall (Fig. 12). The vascular alterations were not present in WKYs (Fig. 13), whereas SHRs had an increase in collagen III that was indicated by the presence of reticular fibers in the walls of arteries (Fig. 14). Thus, the vessel wall thickness was significantly increased in SHR compared to WKY (Fig. 15).
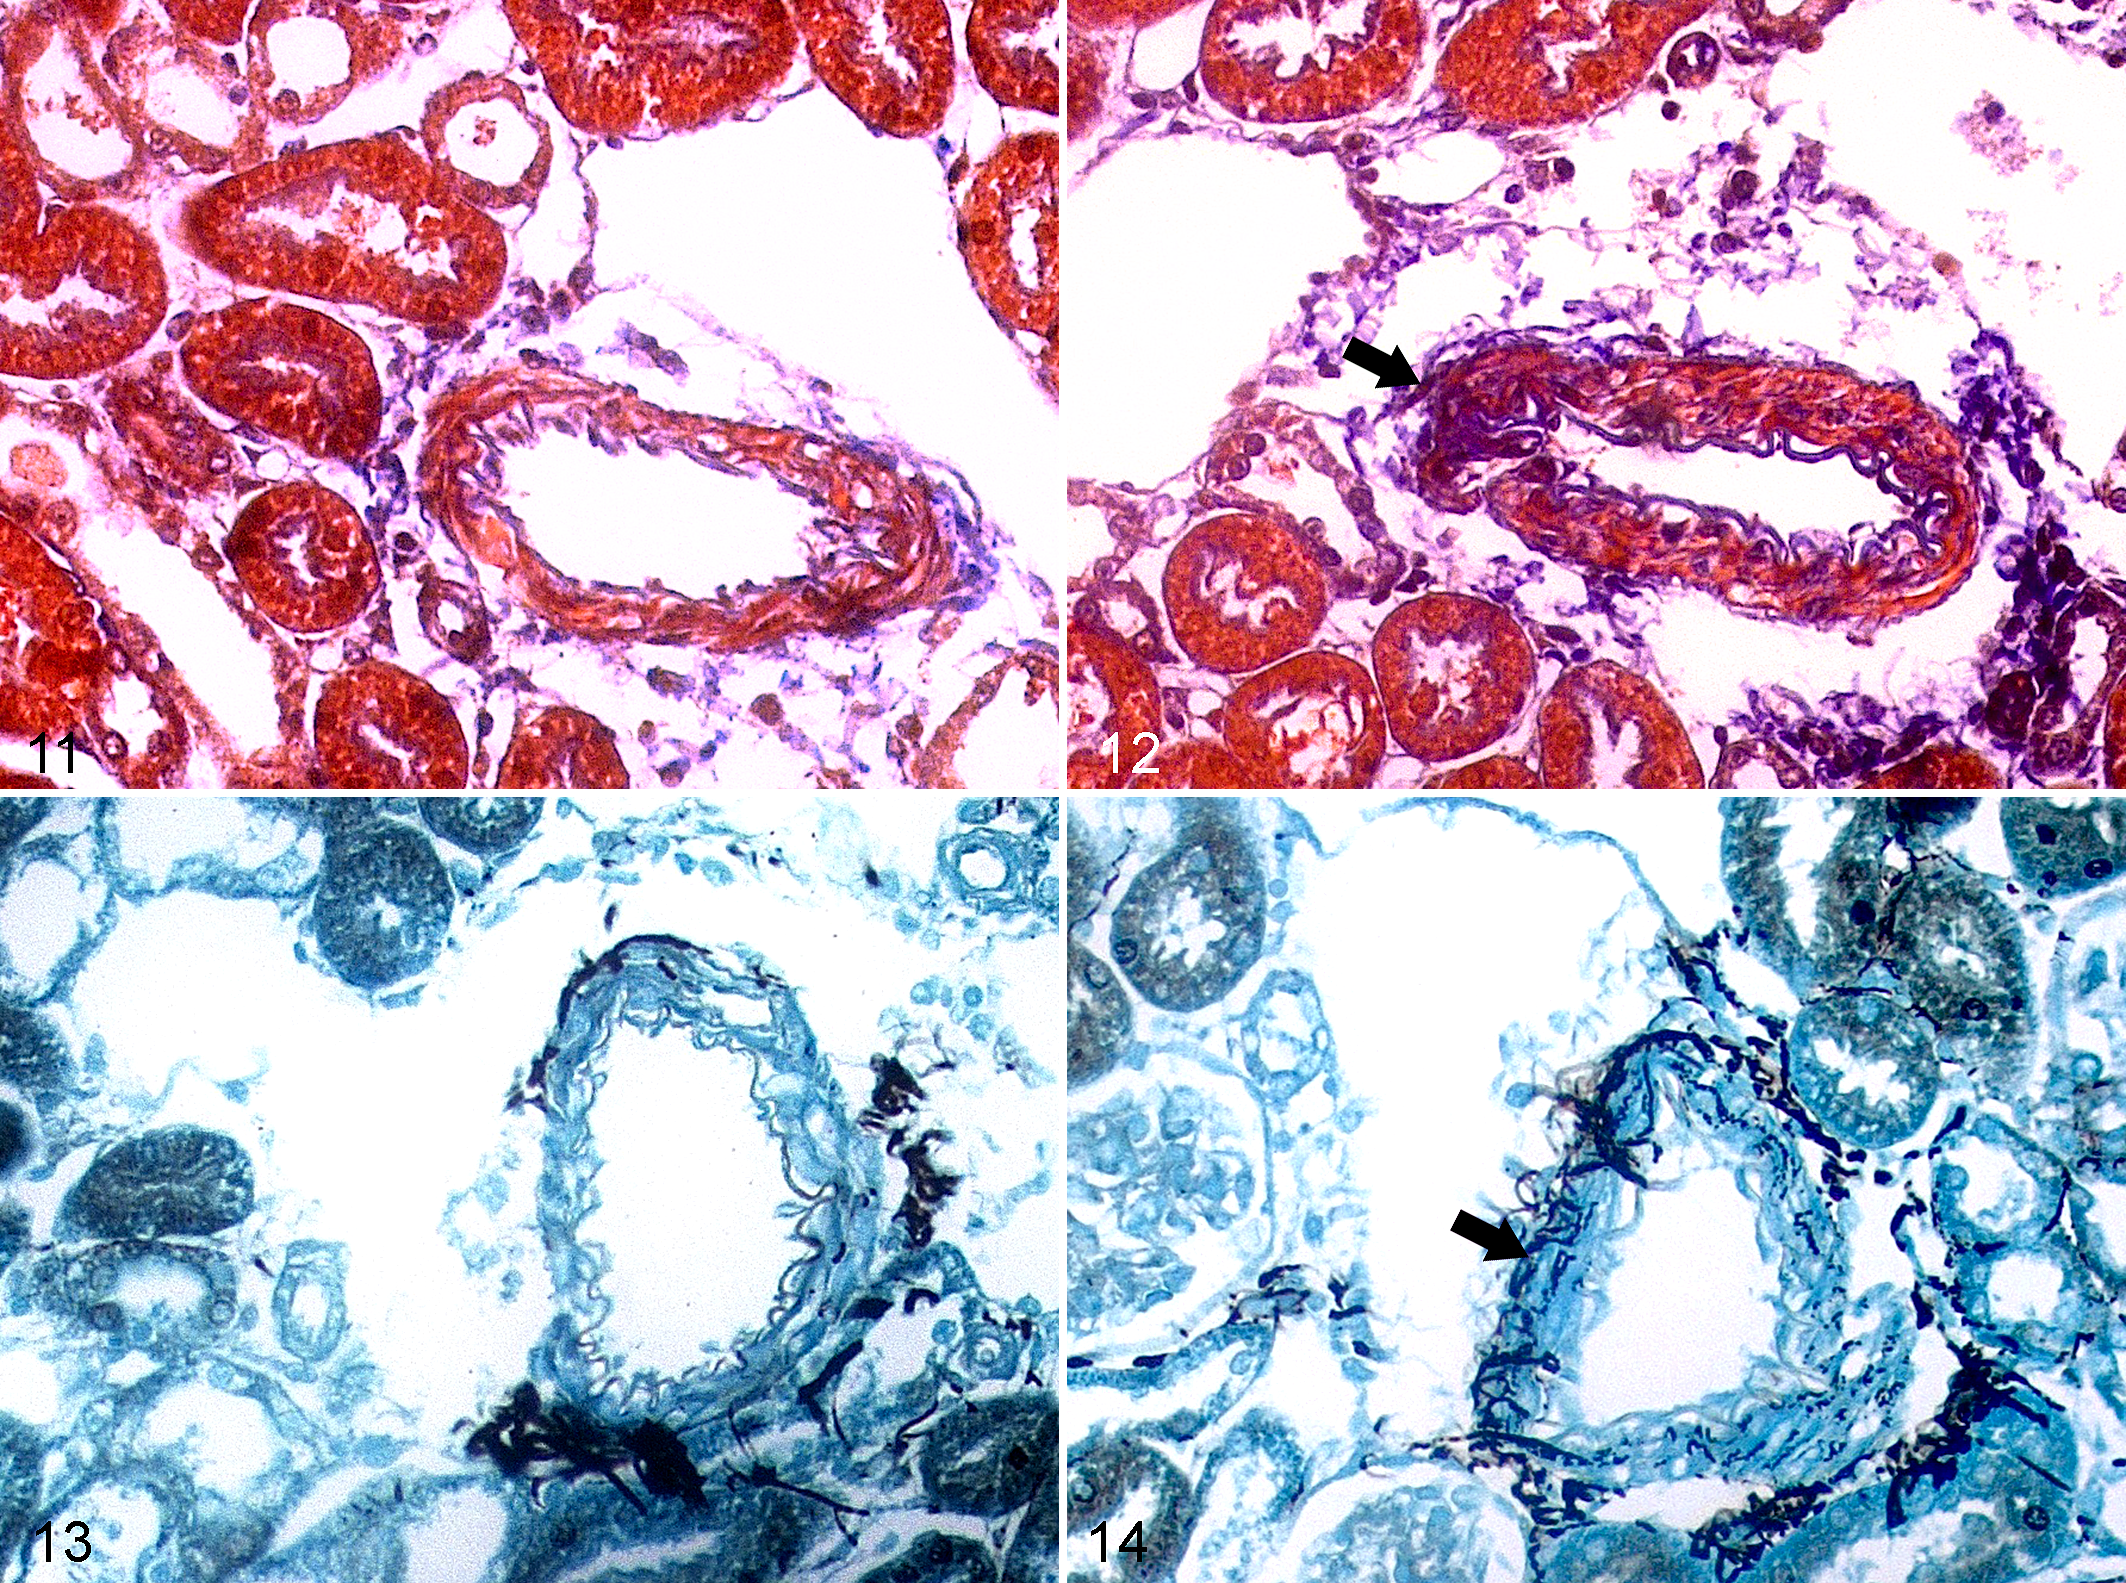
Kidney, Wistar Kyoto rats (WKY; Figs. 11, 13) and spontaneously hypertensive rats (SHR; Figs. 12, 14).
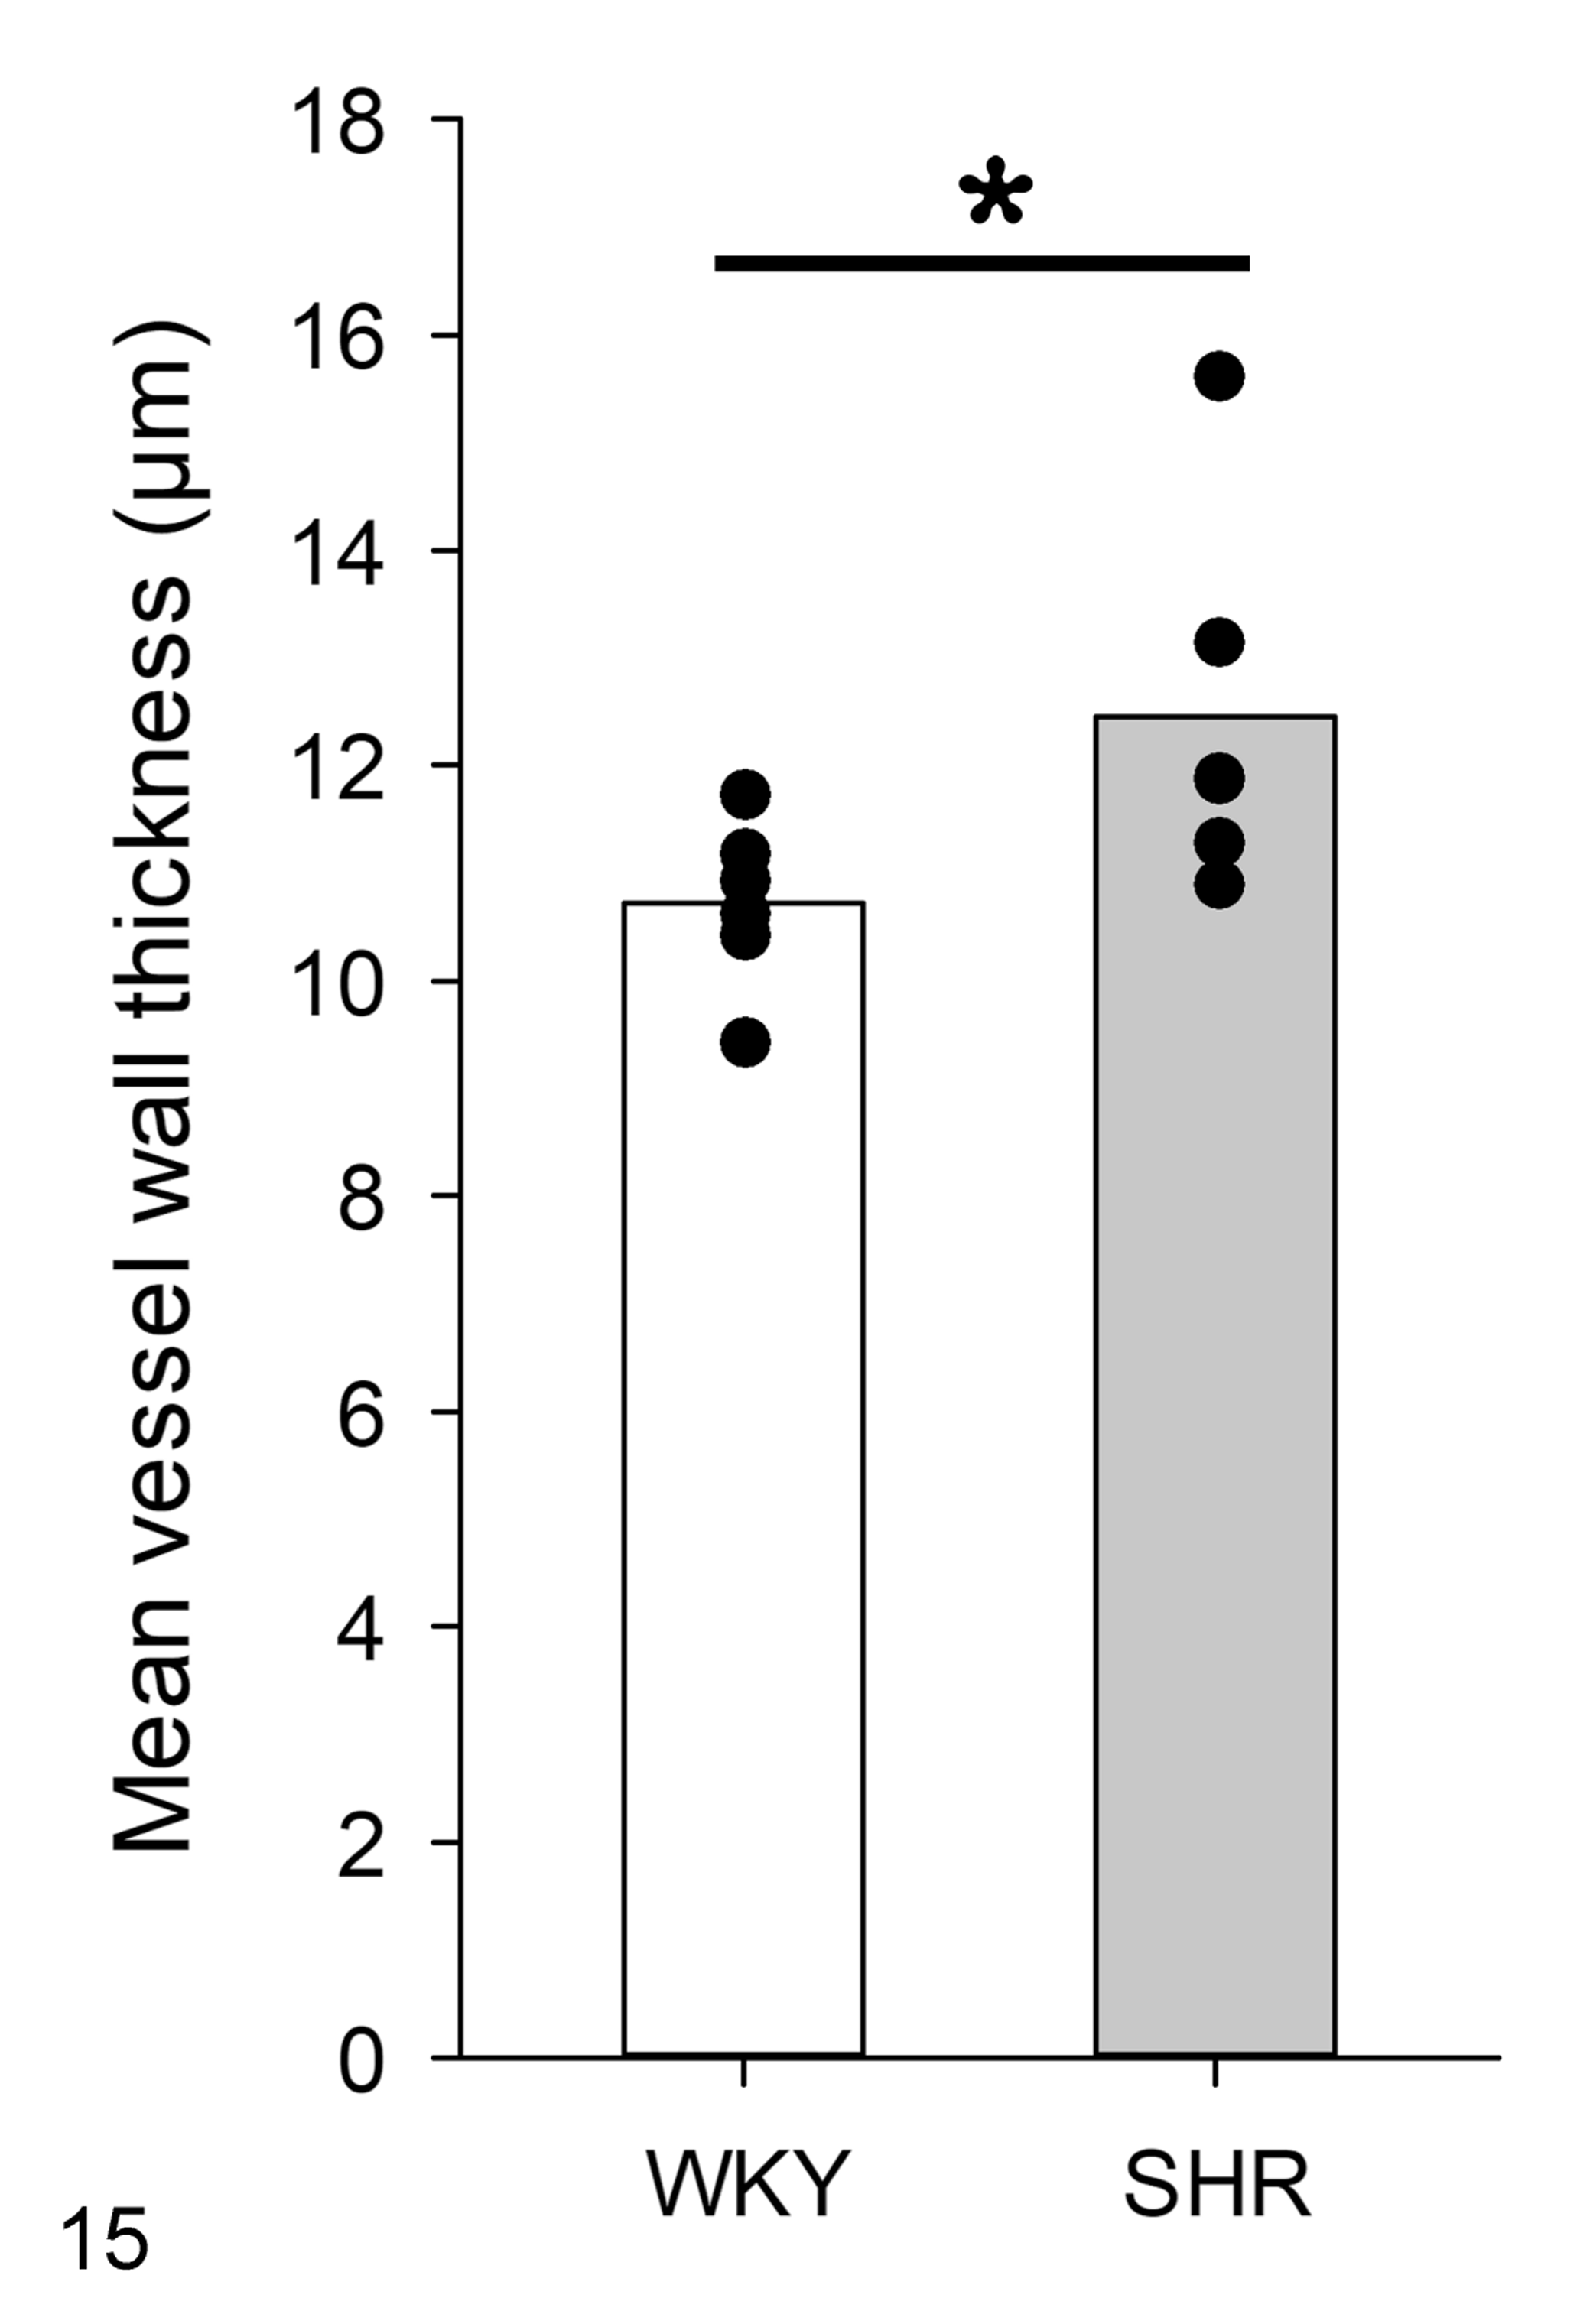
Based on morphometric evaluation, there is increased thickness of vessel walls in spontaneously hypertensive rats (SHR) versus Wistar Kyoto rats (WKY). Means and individual data points. N = 6, *P < .05.
Electron Microscopy
In WKYs, the 3-layer structure of the glomerular filtration membrane was normal, with normal morphology of podocytes, clear fenestra in endothelial cells, and absence of GBM thickening (Figs. 16 –18). However, the GBM of the SHR group was thickened (Figs. 19 –21) and there were regions with multilamination, minimal podocyte foot process effacement (fusion), and decreased endothelial fenestrations (Fig. 21). The thickness of the GBM was 115.4 ± 2.7 nm in WKYs and 160.4 ± 6.1 nm (P < .05) in SHRs (Fig. 22).
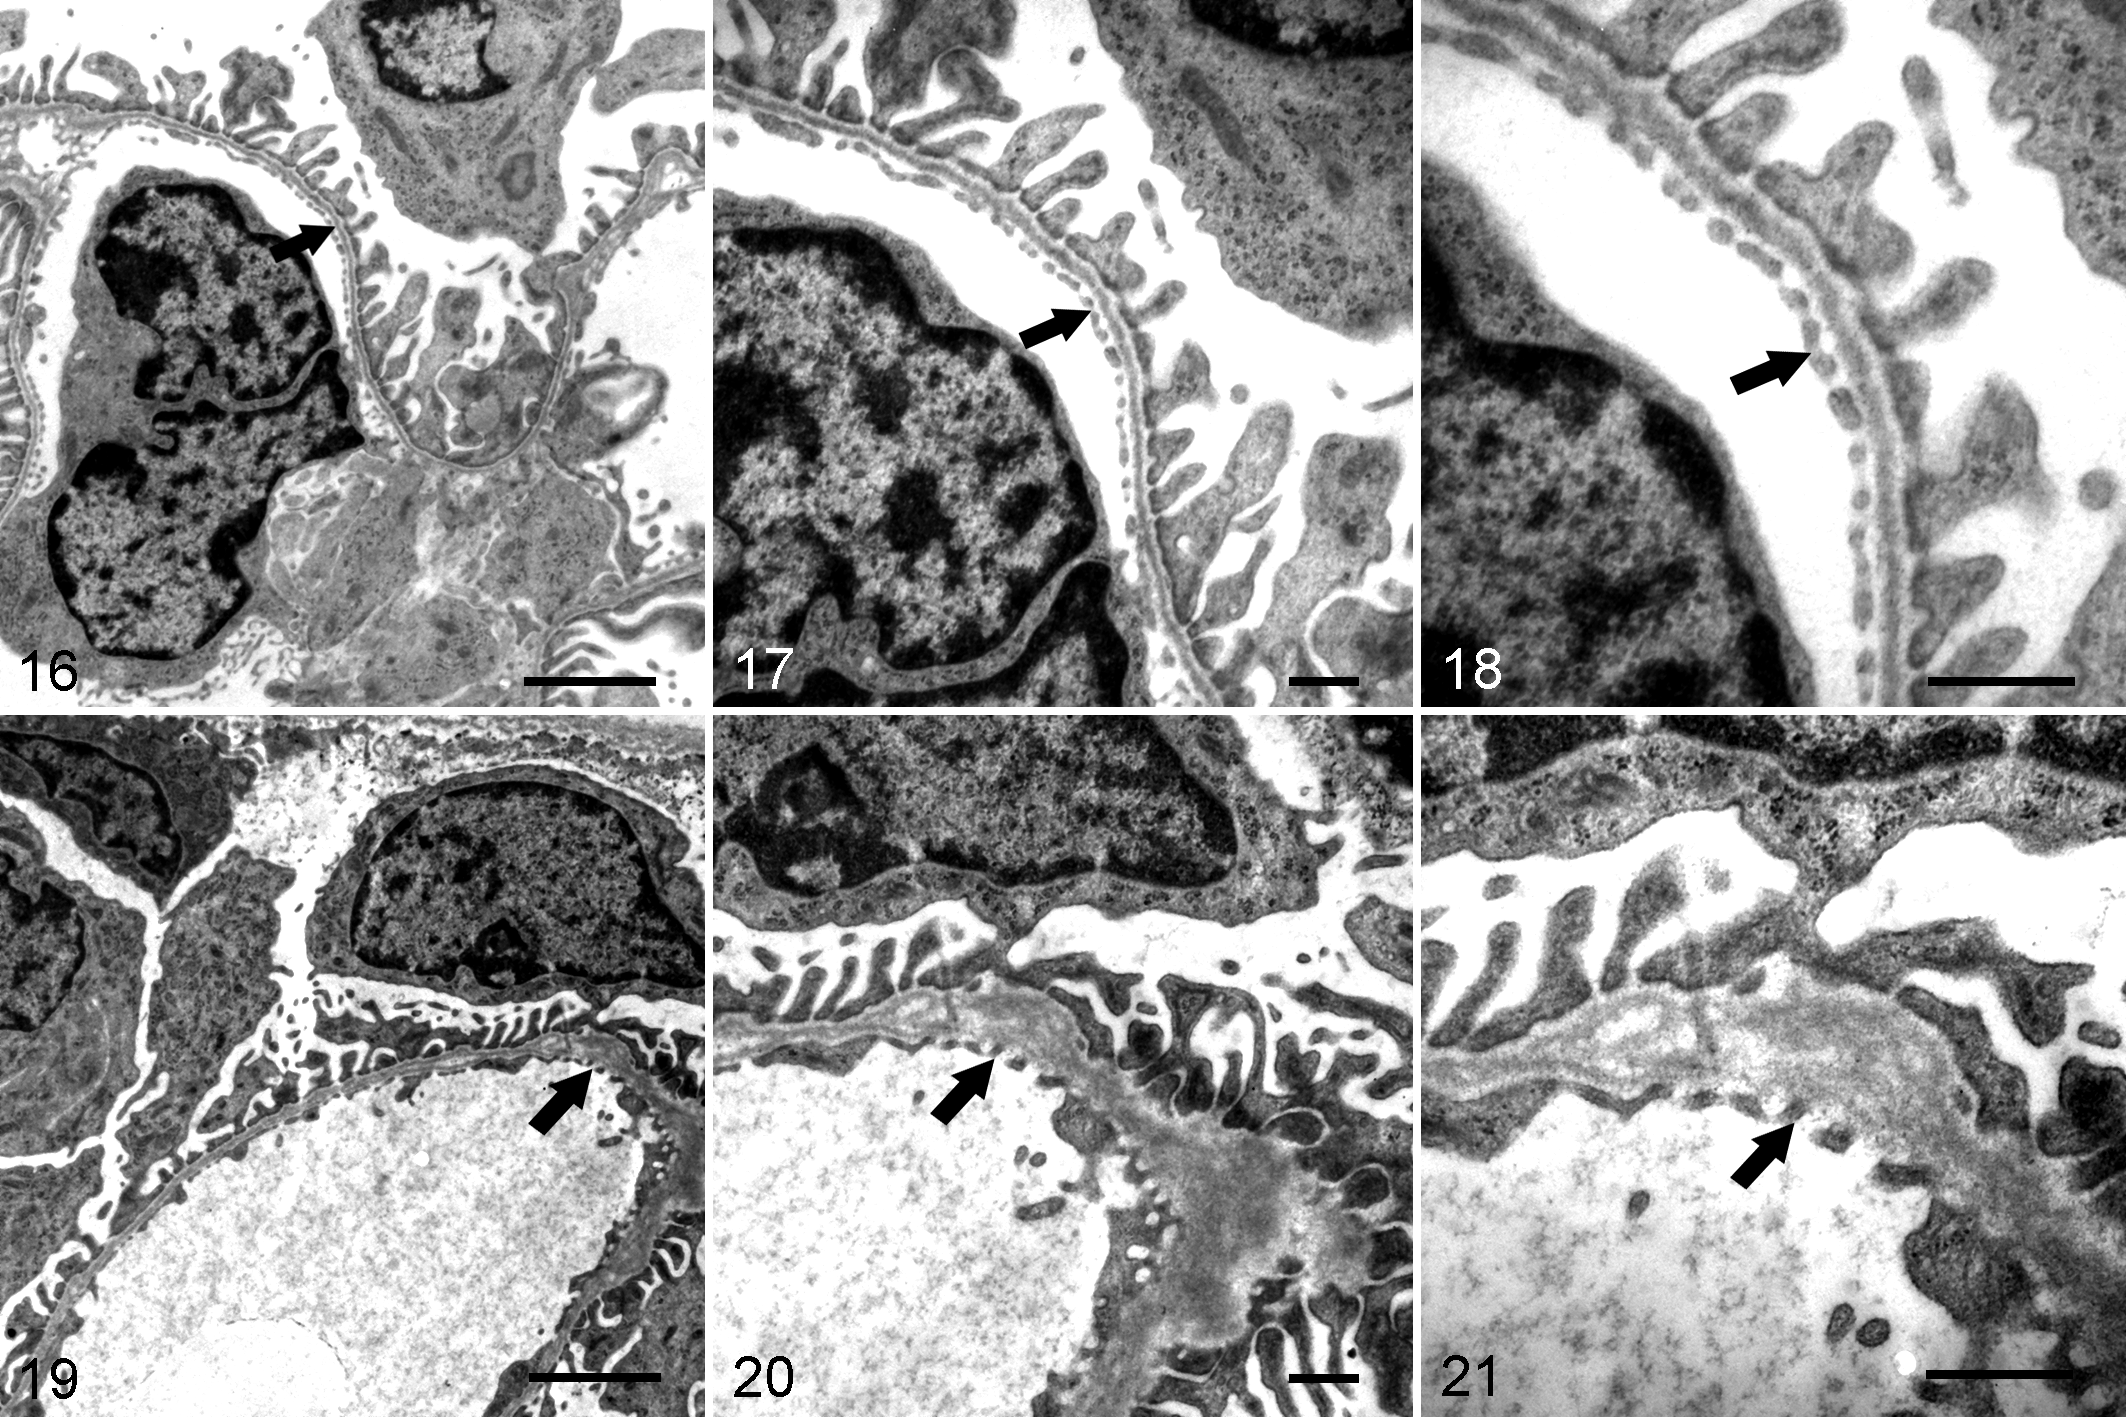
Kidney, Wistar Kyoto rats (WKY; Figs. 16, 17, 18) and spontaneously hypertensive rats (SHR; Figs. 19, 20, 21). Transmission electron microscopy.
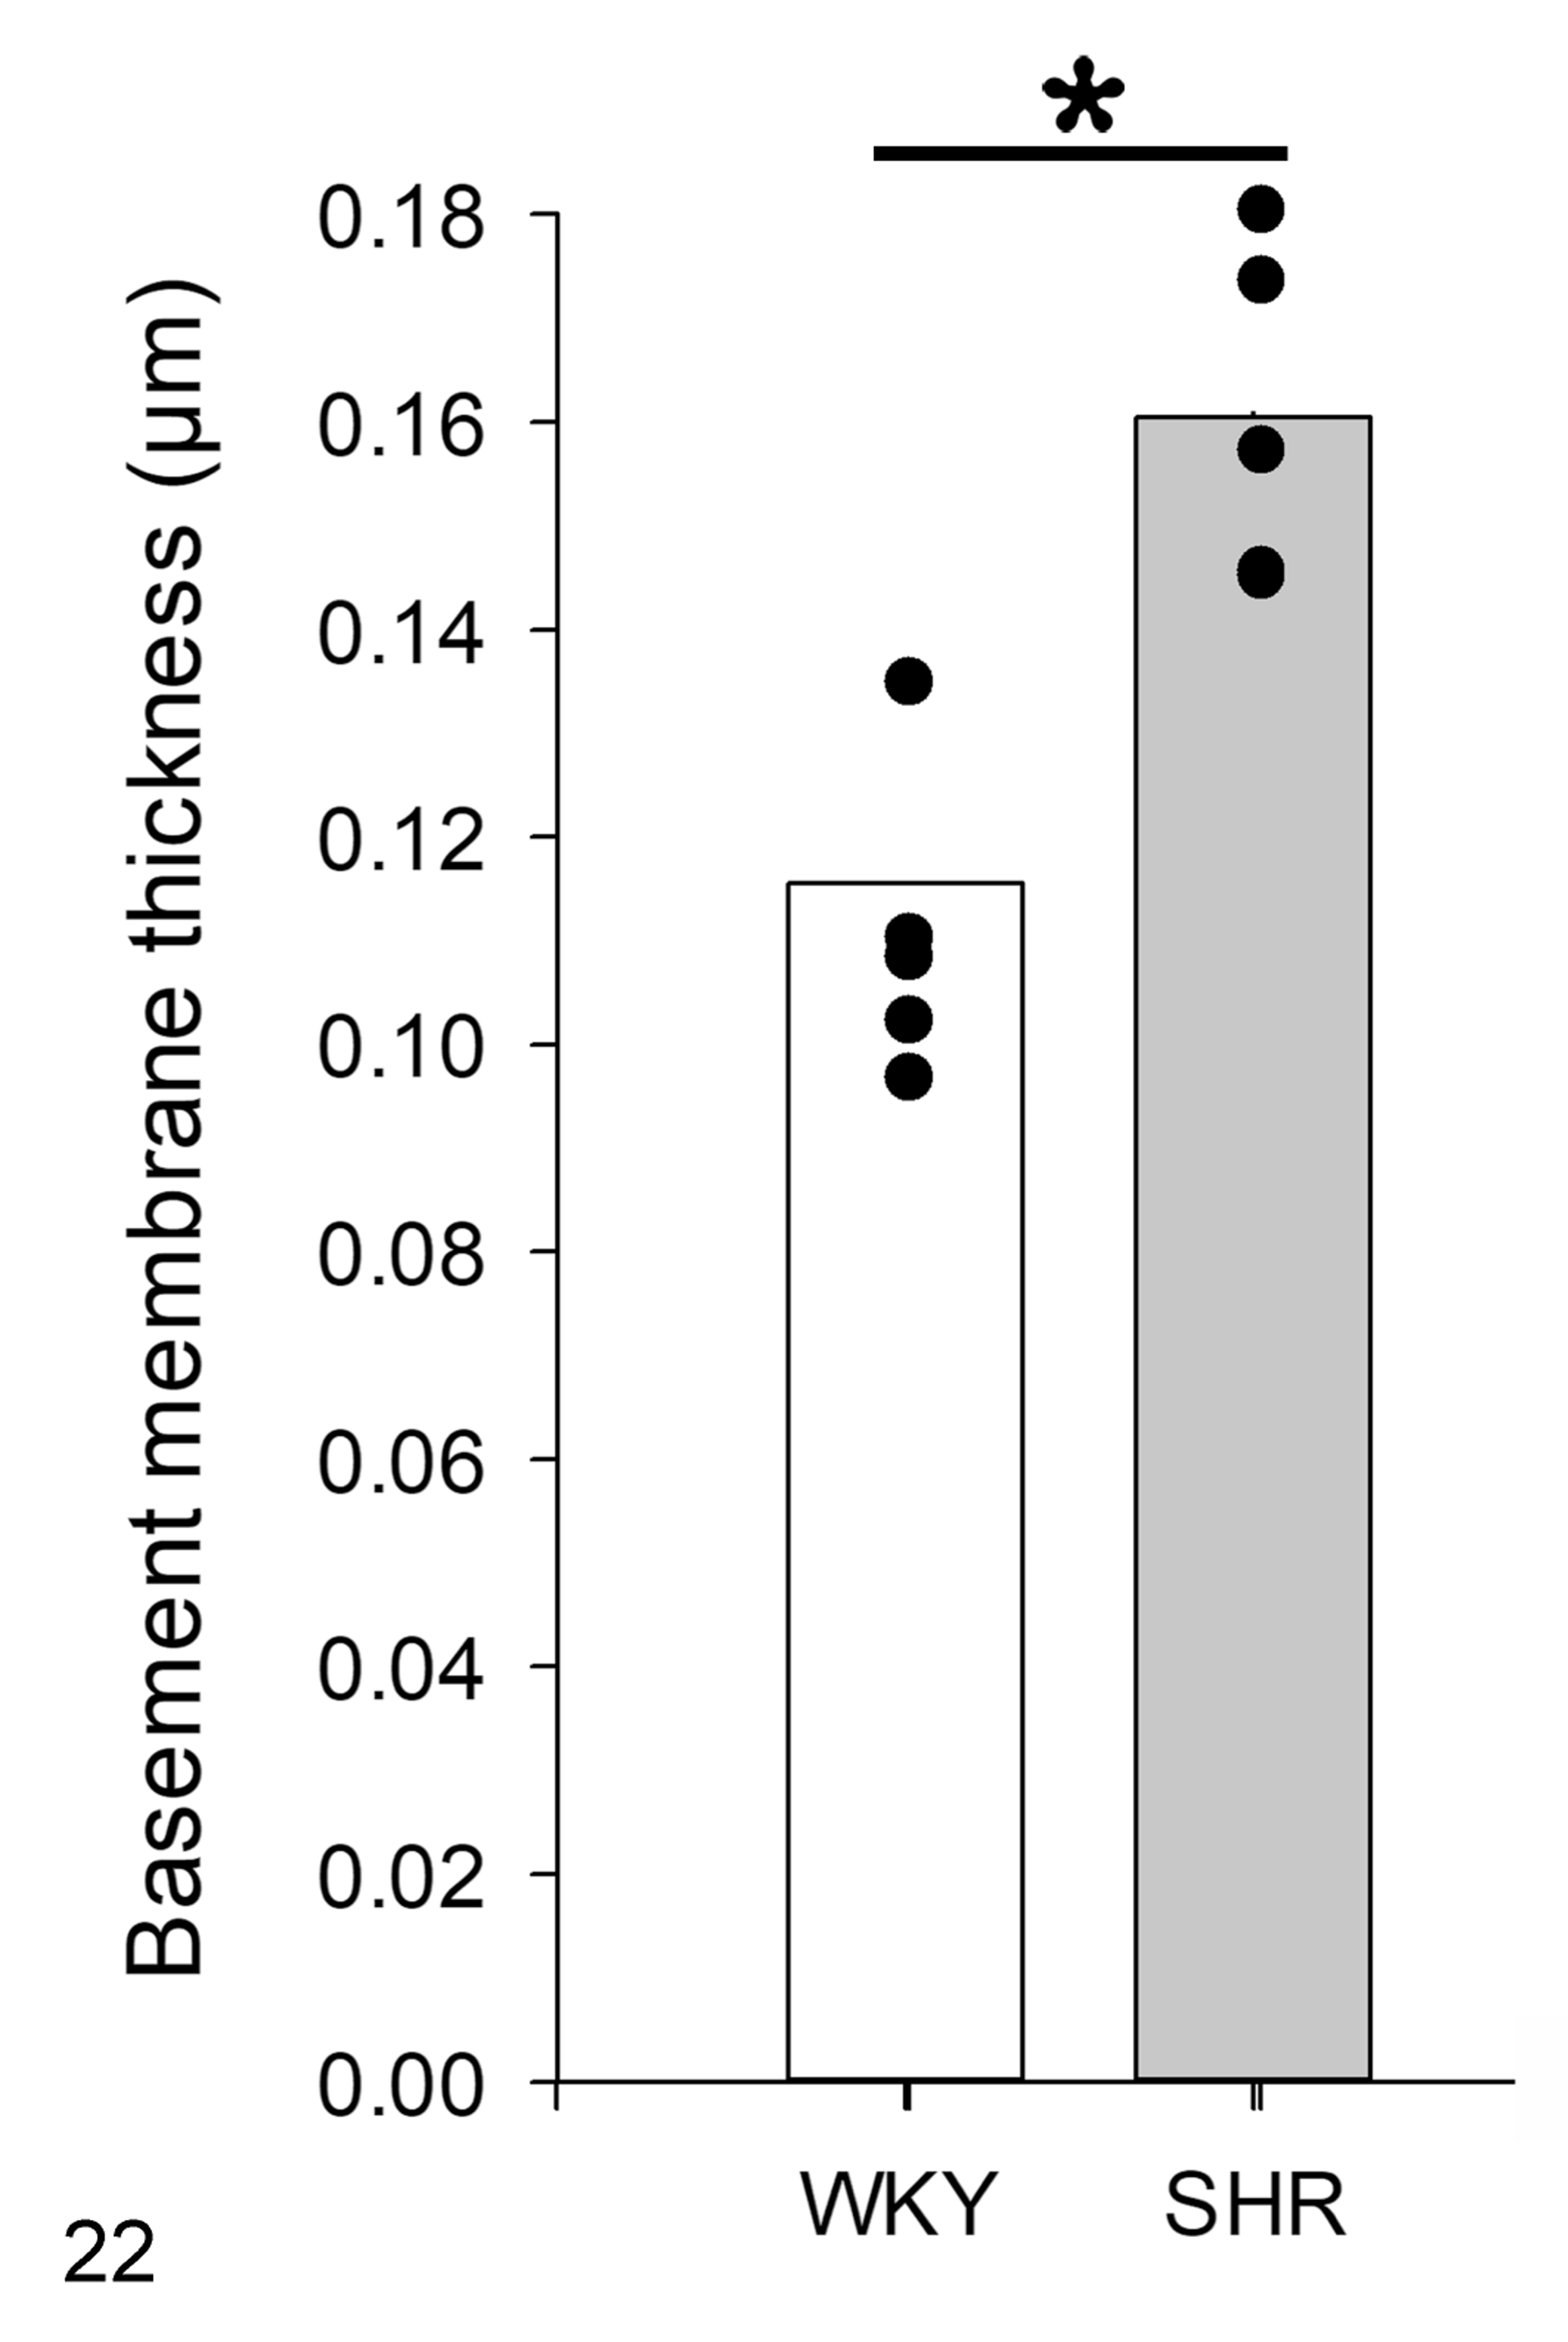
Based on morphometric evaluation, the glomerular basement membrane is thicker in spontaneously hypertensive rats (SHR) versus Wistar Kyoto rats (WKY). Means and individual data points. N = 6, *P < .05.
Immunolocalization of PRR, Renin, and COX-2
By immunohistochemistry, PRR was immunolocalized in the apical membrane of renal tubular epithelial cells of WKYs (Fig. 23) and SHRs (Fig. 24). This receptor was also detected in the glomerulus of both strains; however, it was more abundant in the SHR group than in the WKY group (Figs. 23, 24). PRR labeling was not present in the negative controls (Figs. 25, 26).
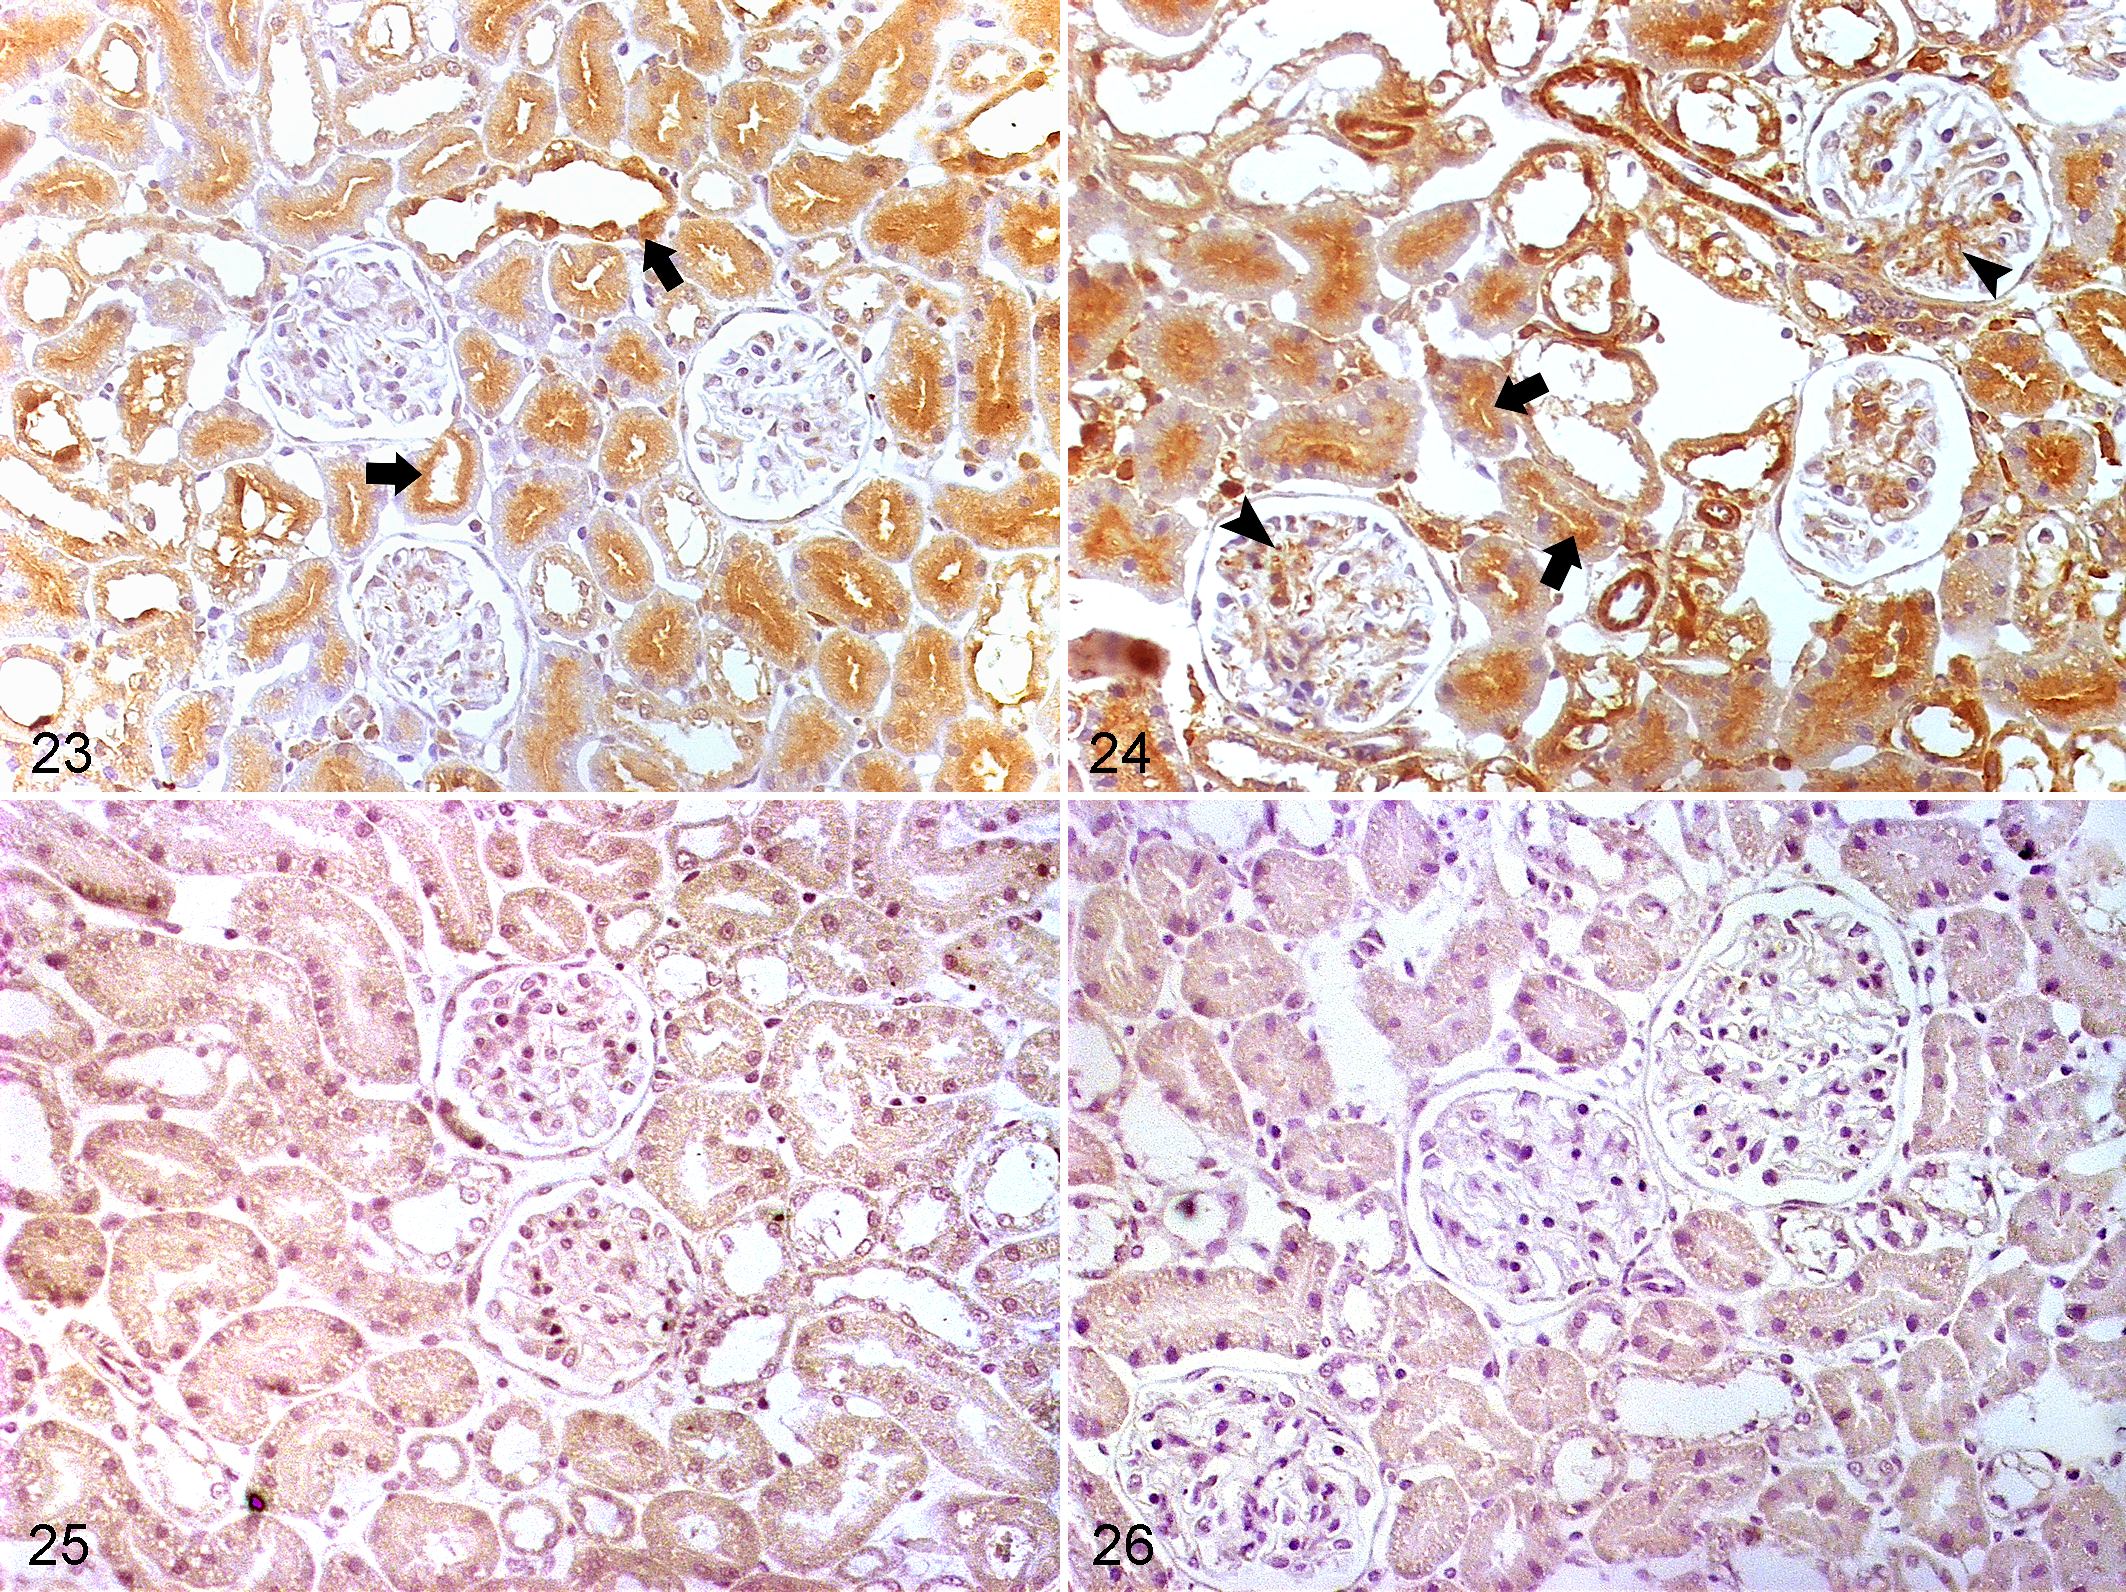
Kidney, Wistar Kyoto rats (WKY; Figs. 23, 25) and spontaneously hypertensive rats (SHR; Figs. 24, 26). Immunohistochemistry for (pro)renin receptor (PRR).
COX-2 protein was primarily detected in the macula densa cells in WKYs (Fig. 27a, b, c) and SHRs (Fig. 28a, b, c). COX-2 was more frequently detected in SHRs than in WKYs (0.948 ± 0.063 compared to 0.750 ± 0.008 tubule sections per microscopic field, respectively; P < .05).
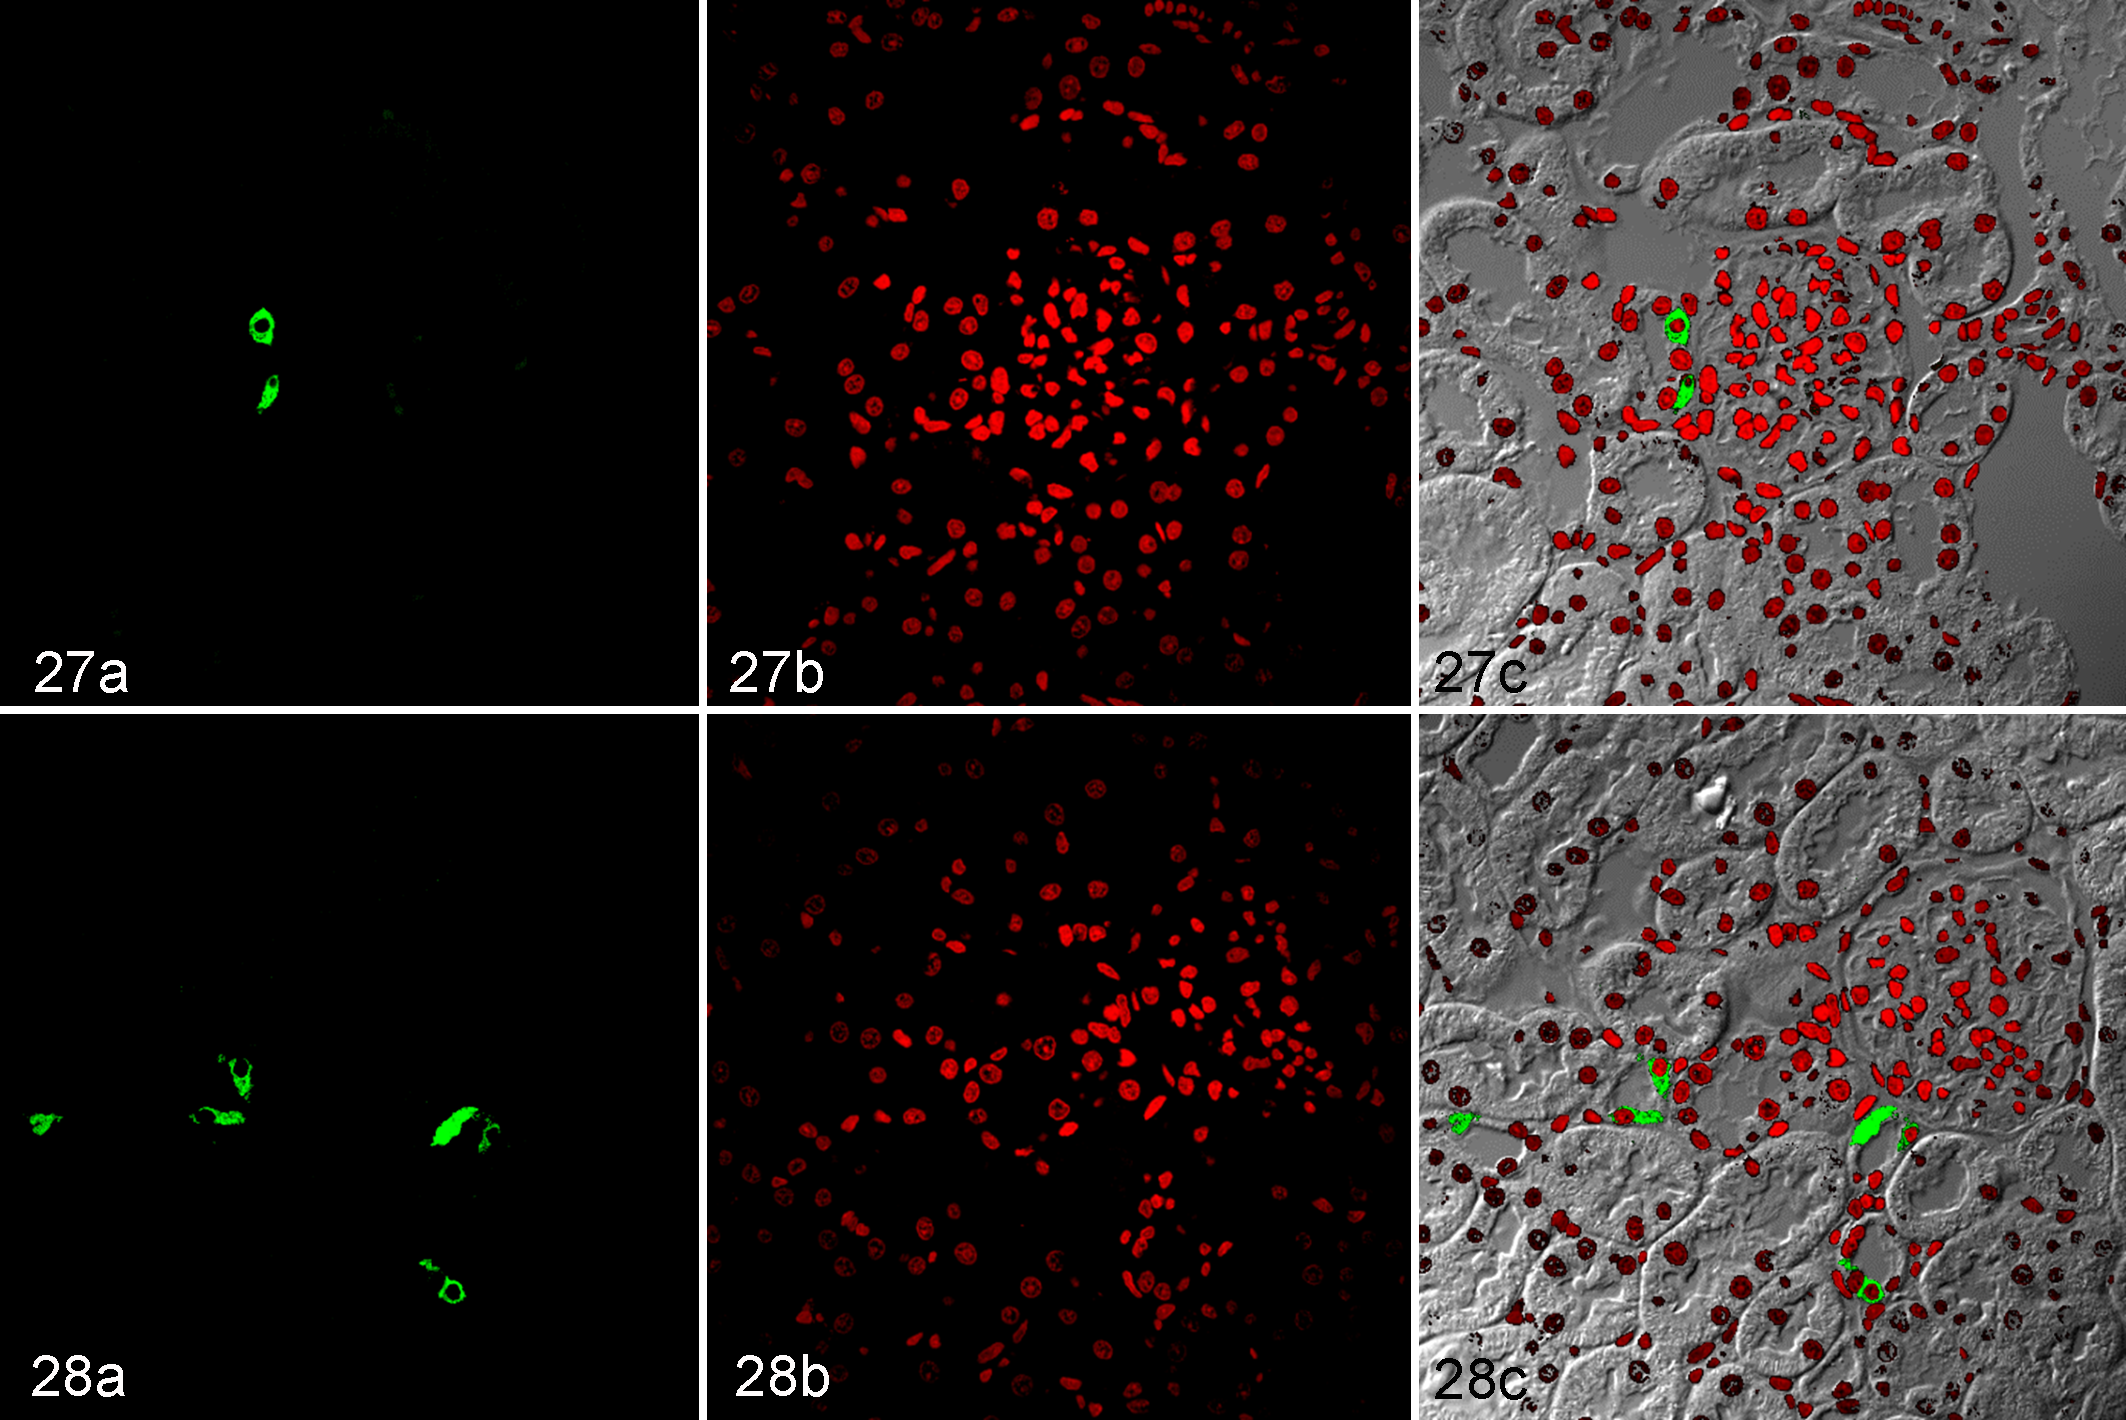
Kidney, Wistar Kyoto rats (WKY; Fig. 27a, b, c) and spontaneously hypertensive rats (SHR; Fig. 28a, b, c). Immunofluorescence for cyclooxygenase-2 (COX-2). (a) Immunolabeling of COX-2; fluorescein isothiocyanate, green signal. (b) Nuclei; propidium iodide, red. (c) Combined, viewed with phase-contrast microscopy.
Renin protein was detected only in the juxtaglomerular cells of both strains (Figs. 29, 30). The number of glomeruli with renin-positive juxtaglomerular cells was similar in SHRs and age-matched WKYs (0.73 ± 0.08 vs 0.87 ± 0.05 glomeruli with renin-positive juxtaglomerular cells per field).
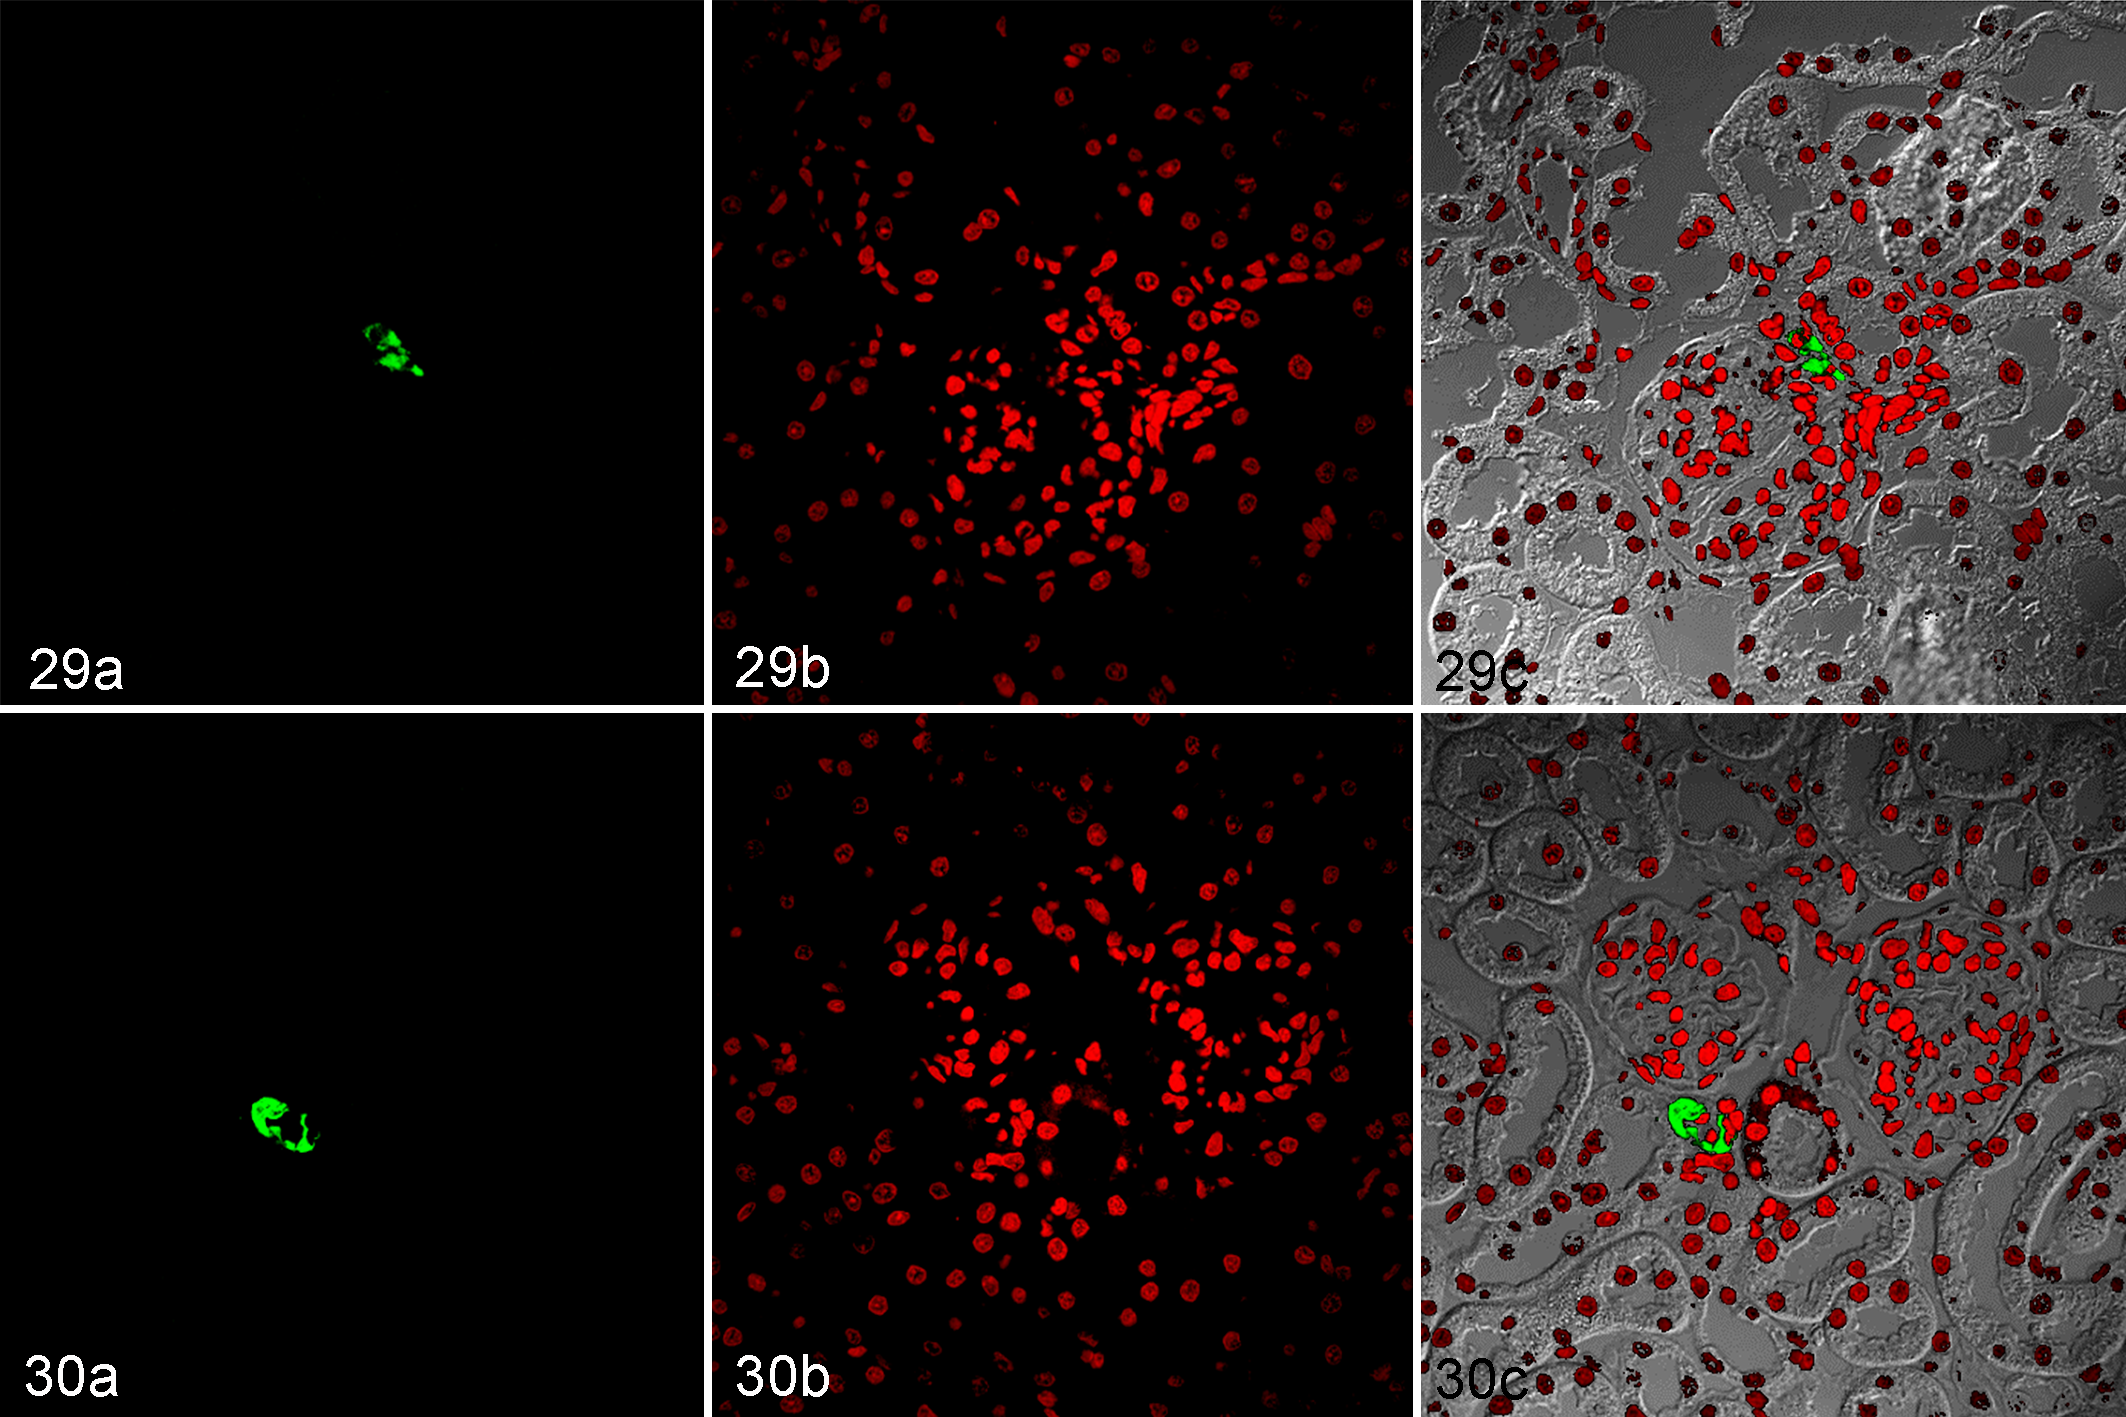
Kidney, Wistar Kyoto rats (WKY; Fig. 29a, b, c) and spontaneously hypertensive rats (SHR; Fig. 30a, b, c). Immunofluorescence for renin. (a) Immunolabeling of renin; fluorescein isothiocyanate, green signal. (b) Nuclei; propidium iodide, red. (c) Combined, viewed with phase-contrast microscopy.
Cortical Expression of Renin and COX-2
The expression profile of COX-2 and renin in the renal cortex was evaluated by sodium dodecyl sulfate–polyacrylamide gel electrophoresis (Figs. 31 –34). Two bands were detected in both strains, one corresponding to COX-2 (MW ≈ 72 kDa) and another band (MW ≈ 140 kDa) suggesting a dimer of COX-2 (Fig. 31a). Regarding renin, 2 bands were detected in the renal cortex of SHRs: immature renin (MW ≈ 54 kDa) and renin (MW ≈ 37 kDa); while only the 37 kDa band was observed in WKYs (Fig. 31b). By densitometric analysis, COX-2 protein expression was slightly elevated in SHRs compared to that in WKYs (Fig. 32). The amount of renin was significantly decreased in SHRs (Fig. 33), while the cortical expression of immature renin was markedly increased in SHRs compared with that in WKYs (Fig. 34).
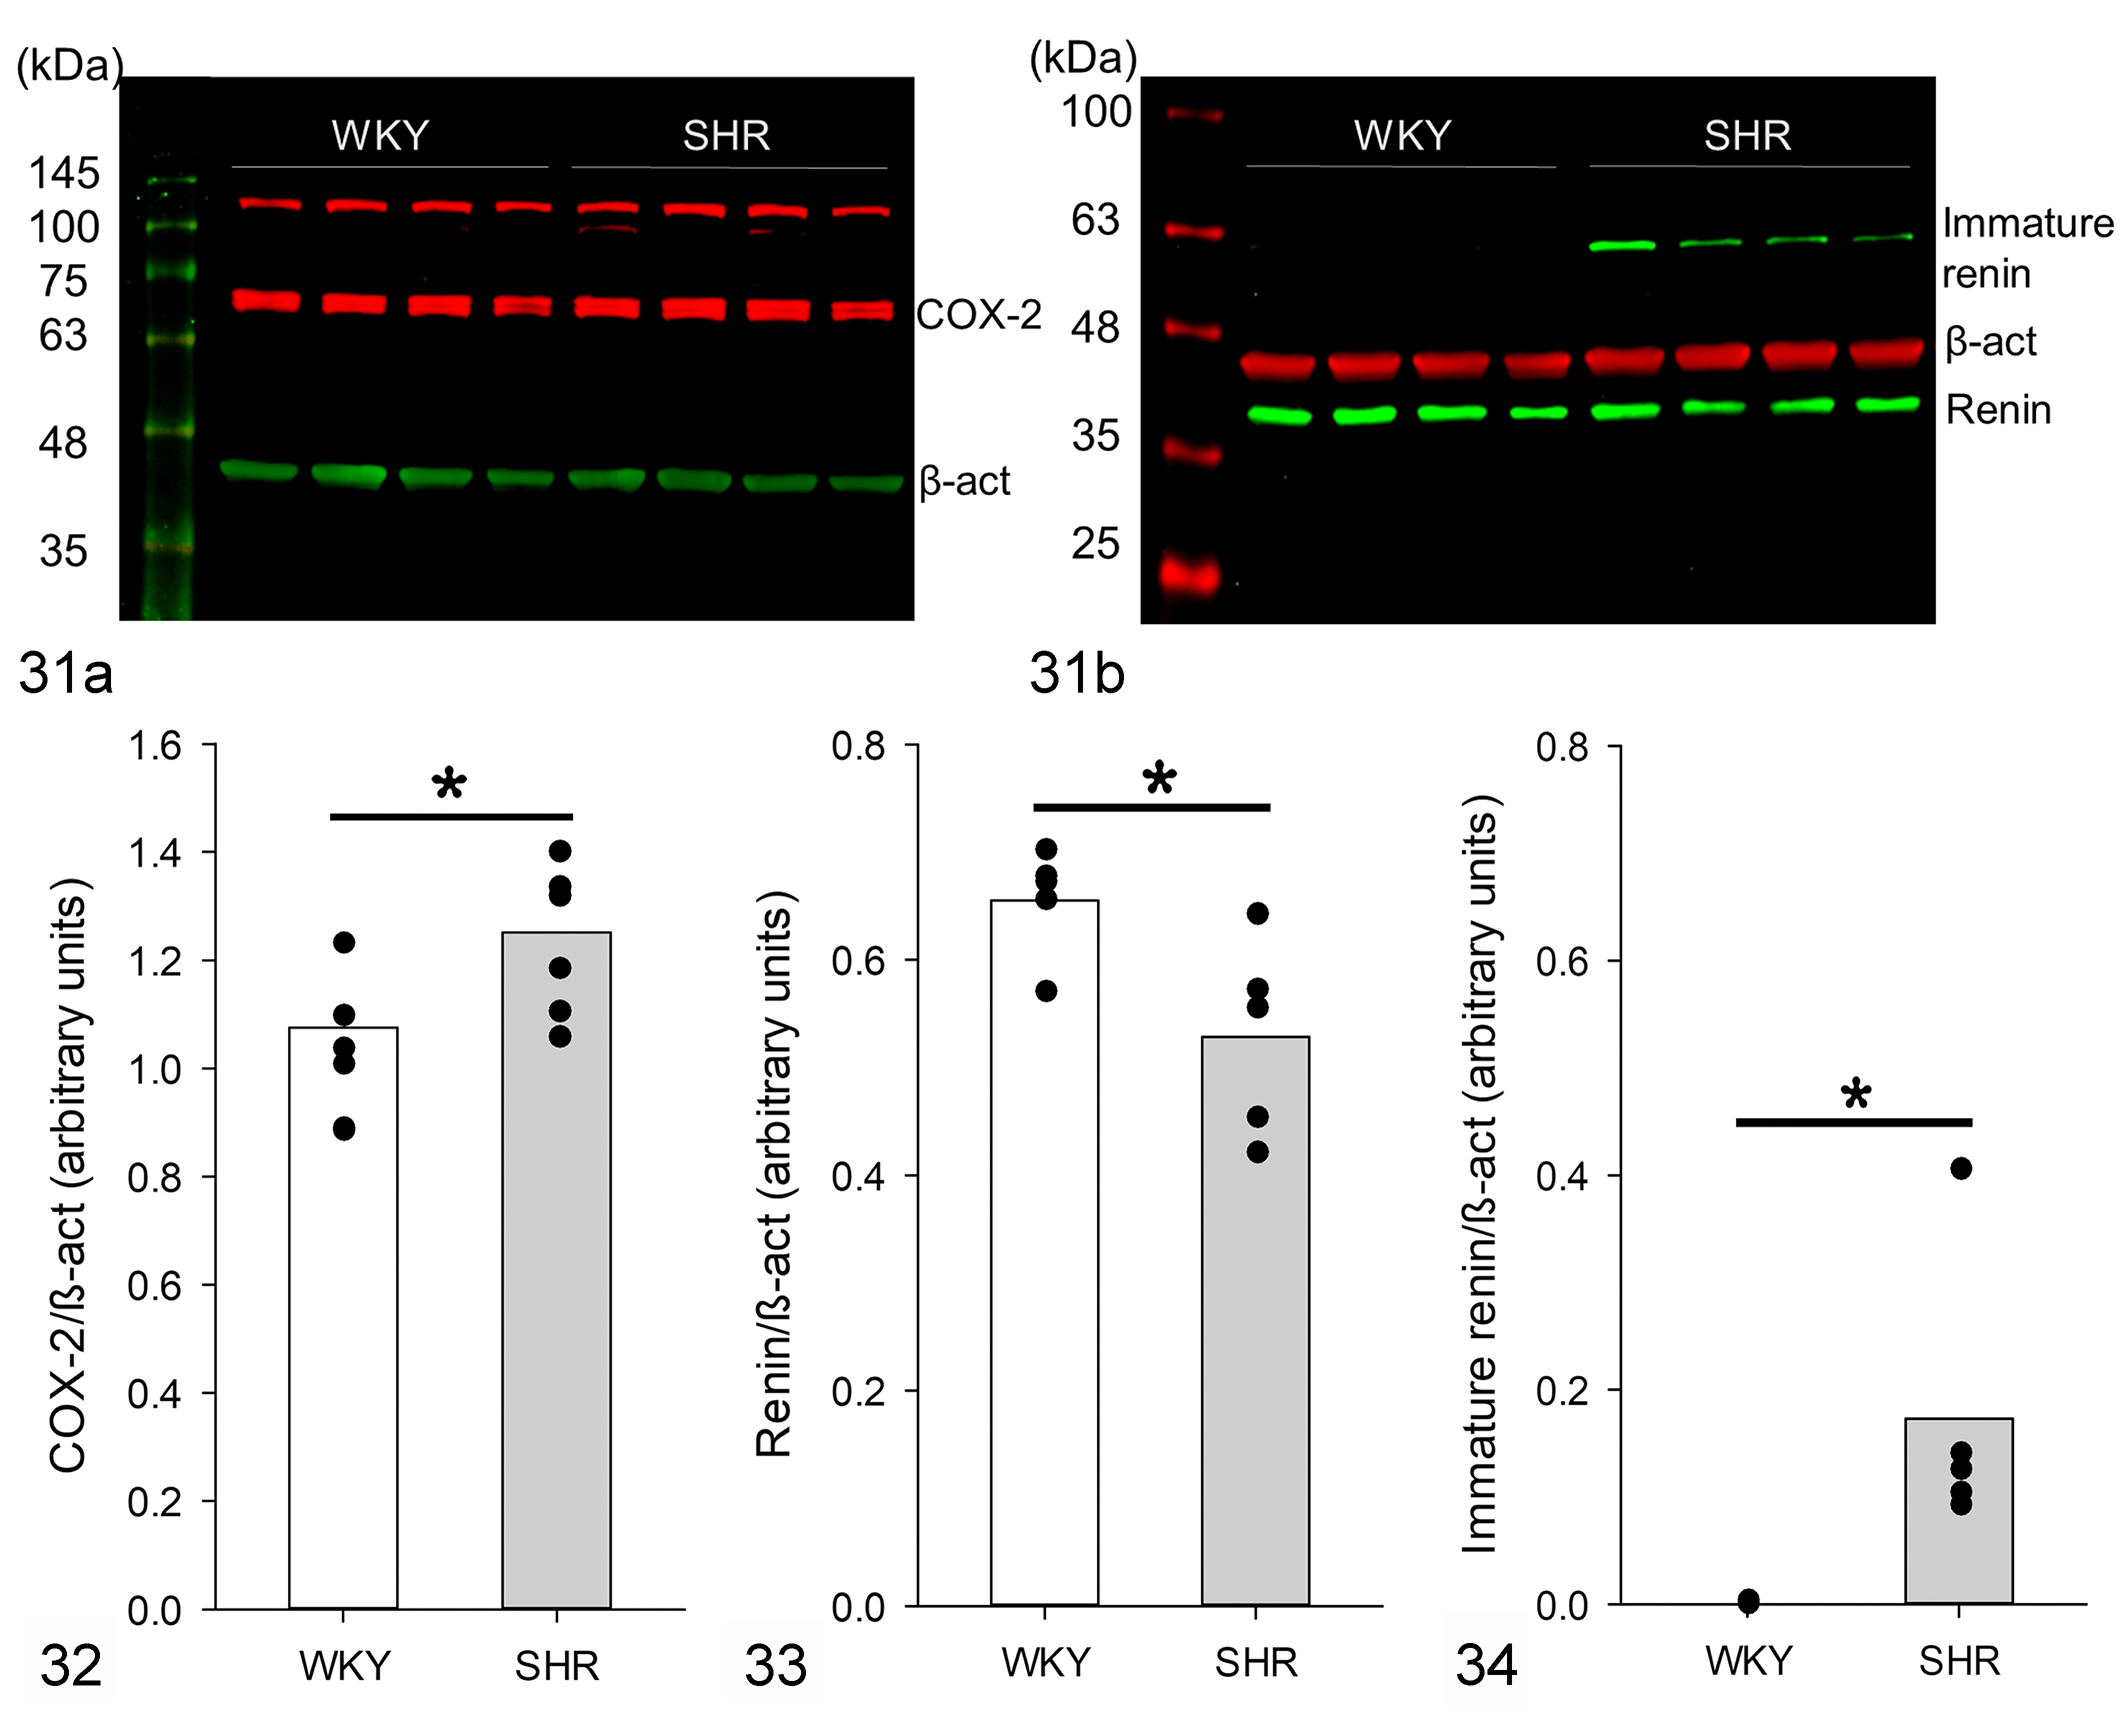
Western blot analysis of renin and cyclooxygenase-2 (COX-2) protein in renal cortex.
Discussion
In this study, 6-week-old SHRs showed glomerular morphological changes, including an increase in the glomerular area, an increase in extracellular matrix accumulation, mesangial and tubular epithelial cell hyperplasia, GBM thickening, and vascular hypertrophy. Additionally, there was greater immunolabeling and expression of COX-2 in the renal cortex of SHRs. There were no changes in immunolabeling of renin; however, the expression of immature renin markedly increased, while the amount of renin decreased in the renal cortex of SHRs. PRR was detected in tubular structures (mainly in epithelial cells) in both WKYs and SHRs, but PRR immunolabeling seemed to increase in the glomeruli in SHRs. These changes were associated with higher plasma Ang II levels. Thus, our study provides relevant information on renal morphological changes and the expression patterns of PRR, COX-2, and renin in the renal cortex prior to the increase in blood pressure in SHRs.
Our data showed an increase in the area of the glomerulus in prehypertensive SHRs compared to that in WKYs, suggesting the presence of glomerular hypertrophy in young SHRs. One possible cause of this alteration is mesangial cell hyperplasia, as observed in this study. In vitro, mesangial cells from SHRs showed a significantly higher growth rate than those from WKYs. 38 In response to different stimuli, mesangial cells acquire an activated phenotype and exhibit hypertrophy, proliferation, and excessive production of matrix proteins, growth factors, and cytokines. 1 Thus, in the 6-week-old SHRs, glomerular mesangial cells may respond to autocrine or paracrine stimuli that induce their activation and an early inflammatory state that contributes to glomerular hypertrophy.
In addition to the histological changes mentioned above, the GBM thickening exhibited diverse regions with a multilaminar appearance. Although this phenomenon was not observed in most glomerular capillaries of 6-week-old SHRs, mutations in collagen IV chain genes, which is a feature of Alport syndrome, must be ruled out. 37
SHRs are prehypertensive for the first 6 weeks of life with systolic blood pressure of approximately 100 to 120 mm Hg, 2,12,50 and blood pressure in these rats reaches values between 180 and 200 mm Hg in adults. 48 Although other authors have reported an increase in blood pressure in SHRs before 6 weeks of age with systolic blood pressures >140 mm Hg, 15,35,57 we used 6-week-old SHRs because this represents the time point before the development of hypertension in our colony of SHRs. 7 Since no significant difference in blood pressure was detected, the morphological changes observed in the kidney of young SHRs are independent of hypertension and seemed be related to neuroendocrine mechanisms. In this study, we demonstrated an increase in COX-2 protein expression in the renal cortex of prehypertensive SHRs. Others showed that COX-2 overexpression is involved in progressive renal injury in a model of nephropathy induced by renal ablation in rats, since the chronic inhibition of COX-2 attenuates the damage, reducing glomerular hypertension, and renal inflammation. 14 Similarly, treatment with celecoxib, a selective COX-2 inhibitor, prevented the increase in the cellular area in proximal tubules and renal protein/DNA ratio in diabetic rats, 59 indicating that COX-2 is involved in the development of renal hypertrophy in diabetes. Additionally, it was reported that COX-2 promotes mesangial cell proliferation in culture under stress conditions. 36 Thus, our results suggest that COX-2-derived prostanoids could be associated with morphological alterations in the kidney of prehypertensive SHRs. However, the relationship between increased COX-2 expression and glomerular hypertrophy has not yet been proven.
In this study, COX-2-positive tubular cells were not identified. In rats, COX-2 is present in the macula densa region and a subset of thick ascending limb (TAL) epithelial cells located in the cortex and outer medulla. 22,60 Regarding the functional significance of COX-2 in TAL cells, this isoform participates in tubular reabsorption of Na+ and renin release. 19,22,47 Moreover, COX-2 also participates in the regulation of tubuloglomerular feedback and the modulation of afferent arteriolar responses to increase in pressure. 28,29 It is possible that COX-2 expression in the renal cortex, as observed in this study, may contribute to RAS overactivation via an increase in renin production in prehypertensive SHRs. In support of this, we found a greater amount of immature renin in the SHR renal cortex, and although our results showed that the amount of renin in the renal cortex of SHRs is decreased, this contradictory result can be explained by a greater basal renin release in 6-week-old SHRs than in WKYs. 24 Consistent with the above-mentioned data, our results showed a higher concentration of plasma Ang II in prehypertensive SHRs compared with that in WKYs. Taken together, this information suggests that a feedback mechanism operates between COX-2 and renin in prehypertensive SHRs, as has been demonstrated in other hypertension models. 20 However, we cannot rule out the participation of other systems in the activation of RAS in prehypertensive SHRs, since it has been reported that sympathetic nervous system activity is increased in prehypertensive SHRs. 8,12,34 It is well known that the sympathetic nervous system increases renin release through β1-adrenoceptor stimulation in juxtaglomerular cells. In this study, prehypertensive SHRs showed a higher cardiac rate (a marker of sympathetic nervous system activity) than WKYs. 54 Thus, the sympathetic nervous system may also be involved in RAS stimulation in prehypertensive SHRs. Additionally, the sympathetic nervous system and RAS overactivation may be related to arteriolar hypertrophy and increases in vascular collagen levels, since the infusion of Ang II promotes aortic hypertrophy through AT1 receptors and α1D-adrenoceptors in rats. 16
We observed an increase in PAS-positive extracellular matrix in the glomeruli of SHRs compared to that in WKYs and an increase in collagen as detected by Masson trichrome stain. These data indicate that an increase in the extracellular matrix may contribute to renal morphological alterations in prehypertensive SHRs. Thickening of the GBM and increase in extracellular matrix production have been linked to glomerular hypertrophy. 40,43 The COX-2 pathway and RAS are among the pathways involved in the stimulation of extracellular matrix production. Renal interstitial fibrosis decreased after the inhibition of COX-2 in a model of renovascular hypertension. 49 Moreover, evidence suggests that RAS components, such as Ang II, Ang III, and aldosterone, are critical promoters of fibrogenesis, which act by activating the signaling of growth factors such as transforming growth factor-β, which regulates extracellular matrix production. 39,42,61 Other studies have shown that the overactivity of RAS and COX-2 is related to podocyte damage. 4,27,44 In the glomerulus, the cell type involved in modifying GBM is the podocyte, which synthesizes and assembles matrix components and produces matrix metalloproteinases in both physiological and pathological states. 53 Thus, these enzymatic pathways may contribute to the alterations observed in GBM and renal fibrosis.
Other components of RAS may also be involved in renal structural changes in prehypertensive rats; for instance, Ang (1–7) has renoprotective physiological activity and counteracts the deleterious effects of Ang II in pathological conditions, such as diabetes and hypertension. 45,46 The decrease in plasma Ang (1–7) levels observed in this study could contribute to renal alterations in prehypertensive SHRs. Recently, it has been shown that (pro)renin activates PRR. In the kidney, PRR has been localized to the mesangium, podocytes, the macula densa, proximal tubule, distal convoluted tubule, and, in the greatest amounts, the luminal membrane of intercalated cells. 3,26 In this study, PRR protein was detected in the apical membrane of different tubules in the renal cortex of WKYs and SHRs but we did not characterize if they were the proximal, distal, or collecting tubules. PRR was also localized in glomeruli in both strains, but it was more abundant in the SHR than in WKY glomeruli. PRR activates the mitogen-activated protein kinase and extracellular signal-regulated kinase 1/2 in several cell types, including mesangial cells and collecting duct cells. 3,26 The activation of extracellular signal-regulated kinase 1/2 increases cell proliferation and stimulates the production of transforming growth factor-β and upregulation of profibrotic factors, such as plasminogen-activator inhibitor-1, fibronectin, and collagen. 33 PRR activation is also related to vascular damage in the kidney. 52 Moreover, PRR has been reported to directly or indirectly contribute to the regulation of renal cortical COX-2 expression. 18,31 The increase in immature renin observed in the renal cortex could also be involved in renal alterations through PRR activation in prehypertensive SHRs.
To evaluate whether the morphological changes observed in this study were related to functional alterations in the kidney, plasma urea and creatinine levels were measured. We did not find changes in these parameters in prehypertensive SHRs, indicating that renal function was not yet altered or a compensatory adaptation of the residual kidney mass masked the loss of function. 11 Our results are consistent with previous studies that demonstrated that the urinary excretion of biomarkers of early kidney damage, such as albumin, osteopontin, and Kim-1 were not modified in 6- and 8-week-old SHRs. 17,23,30
Finally, our results raise the need for further studies of other components of RAS and COXs and the use of pharmacological treatments with enzyme inhibitors to understand the role of these enzymatic pathways in early renal morphological changes, such as glomerulosclerosis and glomerular or vascular hypertrophy and in the development of hypertension in SHRs. Thus, SHR is an attractive model for studying early renal and vascular damage and neurohormonal disorders that could influence in the pathophysiology of primary arterial hypertension.
Footnotes
Acknowledgements
The authors are grateful for the excellent technical assistance provided by Damaris Ilhuicatzi Alvarado. This manuscript is a requirement for Carmen G. Mondragón-Huerta to obtain her PhD in Biología Experimental in Posgrado en Ciencias Biológicas UNAM.
Declaration of Conflicting Interests
The author(s) declared no potential conflicts of interest with respect to the research, authorship, and/or publication of this article.
Funding
The author(s) disclosed receipt of the following financial support for the research, authorship, and/or publication of this article: This work was supported by the Consejo Nacional de Ciencia y Tecnología (CONACyT; Grant No. 102022); the Programa de Apoyo a Proyectos de Investigación e Innovación Tecnológica (PAPIIT), Dirección General de Asuntos del Personal Académico (DGAPA), Universidad Nacional Autónoma de México (UNAM) (Grant No. IN221615); the Programa de Apoyo a los Profesores de Carrera (PAPCA), Facultad de Estudios Superiores Iztacala (FES-Iztacala, UNAM) (Grant FESI-DIP-PAPCA 2014-37); and CGMH was supported by a doctoral fellowship from CONACyT (Grant No. 202693) and the Posgrado en Ciencias Biológicas, UNAM.