
Abstract
Mammalian transmissible spongiform encephalopathies (TSEs) display marked activation of astrocytes and microglia that precedes neuronal loss. Investigation of clinical parallels between TSEs and other neurodegenerative protein misfolding diseases, such as Alzheimer’s disease, has revealed similar patterns of neuroinflammatory responses to the accumulation of self-propagating amyloids. The contribution of glial activation to the progression of protein misfolding diseases is incompletely understood, with evidence for mediation of both protective and deleterious effects. Glial populations are heterogeneously distributed throughout the brain and capable of dynamic transitions along a spectrum of functional activation states between pro- and antiinflammatory polarization extremes. Using a murine model of Rocky Mountain Laboratory scrapie, the neuroinflammatory response to prion infection was characterized by evaluating glial activation across 15 brain regions over time and correlating it to traditional markers of prion neuropathology, including vacuolation and PrPSc deposition. Quantitative immunohistochemistry was used to evaluate glial expression of iNOS and Arg1, markers of classical and alternative glial activation, respectively. The results indicate progressive upregulation of iNOS in microglia and a mixed astrocytic profile featuring iNOS expression in white matter tracts and detection of Arg1-positive populations throughout the brain. These data establish a temporospatial lesion profile for this prion infection model and demonstrate evidence of multiple glial activation states.
Transmissible spongiform encephalopathies are a progressive, invariably fatal group of neurodegenerative diseases known to affect a variety of mammalian species, including humans (kuru, Creutzfeldt-Jakob disease, Gerstmann-Sträussler-Scheinker disease), cattle (bovine spongiform encephalopathy), small ruminants (scrapie), and cervids (chronic wasting disease). Disease is mediated by PrPSc, a misfolded isoform of native prion protein, PrPC. 56,66 Misfolded PrPSc particles stimulate and stabilize a conformational shift in PrPC, initiating a polymerization chain to form insoluble amyloidogenic fibrils. 16 These fibrils can undergo sporadic fragmentation into a mix of oligomeric species that subsequently seed further PrPC conversion. 16 Elements of templated protein misfolding are increasingly recognized in other classes of human neurodegenerative diseases, 1,22 such as Alzheimer’s (AD), 47,75 Parkinson’s (PD), 70,83 and Huntington’s (HD) 43,60 diseases and amyotrophic lateral sclerosis (ALS). 42
Microglia, yolk-sac-derived resident neural phagocytes,
26
undergo activation and proliferation in response to misfolded oligomers in human neurodegenerative protein misfolding diseases and classical prion disease alike.
25,32,47,60,83
The contribution of microgliosis to neuroinflammation is incompletely understood. There is evidence for mediation of both deleterious effects, such as through generation of reactive oxygen species and inappropriate neuronal phagoptosis,
8,31
as well as neuroprotective mechanisms, including neurogenesis
20
and synaptic stripping.
13
The study of neuroinflammation is further complicated by the apparent physiologic fluidity of microglial populations that can undergo dynamic transition between activation states. Phenotypic polarity can be induced in cultured microglia resulting in manifestation of proinflammatory “M1” or anti-inflammatory “M2” activation states characterized by divergent secretory and phagocytic profiles.
55
M1-polarized microglia that can be experimentally stimulated by IFN
Studies characterizing the inflammatory profiles of microglia in experimental prion infections have yielded contradictory results, with earlier evidence suggesting a paradoxical M2 microglial profile despite an activated morphology, 6,18,33,77 while more recent transcriptomic and cytokine array analyses support a neurotoxic microglial profile and a proinflammatory cytokine milieu associated with M1 activation. 10,11,27,51,53,64,72,74 These discrepancies are likely attributable, at least in part, to variation of strain, host, and collection timepoint between these studies. Additionally, sampling technique may have been a confounding factor as authors used homogenates of whole or partially dissected brains to analyze mRNA transcript and cytokine levels. Microglial distribution is nonhomogeneous throughout the brain, with marked variation in population density, 40 transcriptomes, 28 surface activation markers, 67 and physiologic parameters. 19 Microglial subsets are highly localized and can be resolved to a substructural level with sharp lines of border demarcation, 19 suggesting that microglial response to neurodegenerative disease could vary markedly on a regional level.
Astrocytosis is one of the earliest changes observed in prion infection, 11 and astrocytes have been implicated in PrPSc accumulation and transmission to neurons. 21,39,61,73 Activated astrocytes can secrete either neuroprotective molecules or proinflammatory cytokines, depending on the inciting stimulus. 4,63,82 An activation scheme similar to M1/M2 differentiation has been proposed for astrocytes, with “A1” phenotypes associated with neurotoxicity and “A2” phenotypes with neuroprotection. 45,46 Experimental astrocytic polarization into “classical” and “alternative” activation patterns with differential expression of iNOS and Arg1 has been demonstrated in culture. 34 Astrocyte subclasses have not been investigated in prion disease.
The aim of this study was to characterize the glial response to prion infection using a mouse model of scrapie (RML, the Rocky Mountain Laboratory strain of mouse-adapted scrapie) by evaluating glial activation over time and correlating it to classical markers of prion neuropathology, including vacuolation, and PrPSc deposition. Although gliosis is a well-documented phenomenon in prion infection, 11,25,59 this study represents a comprehensive time course investigation across 15 brain regions with in situ expression analysis for iNOS and Arg1, canonical markers of glial polarization. 57,69 We found that microgliosis late in the clinical time course is associated with proinflammatory upregulation of iNOS and minimal Arg1 expression. Colocalization analysis revealed predominantly astrocytic Arg1 expression in the cerebellum and medulla, with isolated iNOS-positive astrocyte populations in the cerebellar peduncles and internal capsule. This was an unexpected finding indicating the possible existence of multiple astrocytic inflammatory phenotypes. These data provide a detailed temporospatial characterization of neuropathology and gliosis in the RML scrapie infection model, contributing insight into glial activation dynamics and evidence for multiple activation states.
Materials and Methods
Animals and Tissue Preparation
This experiment was performed in accordance with the Guide for the Care and Use of Laboratory Animals and approved by the Institutional Animal Care and Use Committee at the National Animal Disease Center (protocol No. 3985).
C57BL/6 mice aged 6 to 8 weeks from an inbred colony maintained at the USDA National Animal Disease Center, which was derived from a colony of C57BL/6 mice bred as a line for approximately 50 years, 23 were inoculated intracranially, under isoflurane anesthesia, into the right cerebral hemisphere with 20 μL of 10% w/v brain homogenate in PBS pooled from C57BL/6 mice terminally ill with the mouse-adapted RML strain of the scrapie agent. Groups of mice were euthanized at predetermined timepoints of 30 (n = 4), 60 (n = 4), 90 (n = 4), and 120 (n = 5) days postinoculation (DPI), along with a group of animals that was allowed to survive until clinical signs necessitated euthanasia at 155 DPI (n = 5). Age-matched C57BL/6 controls were mock-inoculated with 10% w/v normal brain homogenate in PBS and included at each timepoint (30, 90, 120 DPI n = 2; 60 DPI n = 4; 155 DPI n = 2). Brains were collected into 10% neutral buffered formalin. After 24 hours of fixation, brains were transversely sectioned at 4 levels: midcerebellum, rostral colliculus, thalamus and hypothalamus, and rostral cerebrum at level of septal nuclei. Tissues were processed by routine histologic methods, embedded in paraffin, sectioned at 5 μm, and mounted on glass slides for hematoxylin and eosin staining or immunohistochemistry.
Vacuolation Scoring
Brain sections from 4 infected and 2 mock-inoculated animals from each timepoint (30, 60, 90, 120, 155 DPI) were mounted and stained with hematoxylin and eosin. Fifteen regions of interest, 12 grey matter and 3 white matter, were evaluated per animal and scored on a scale of 0 (no vacuoles) to 5 (maximal vacuolation) for grey matter and 0 to 3 for white matter. 23 Scores were averaged among tim point cohorts, and mean values ≥2 (grey matter) and ≥1 (white matter) were considered definitive for spongiform change. Regions of interest analyzed for this and subsequent immunohistochemistry studies included the following, from caudal to rostral: vestibular nuclei (VestNuc), cerebellar peduncles (CerPed), cerebellar nuclei (CerNuc), superior colliculus (Coll), medial longitudinal fasciculus (MLF), midbrain reticular nucleus (MRN), lateral thalamus (LatThal), medial thalamus (MedThal), hypothalamus (Hypothal), dentate gyrus of hippocampus (HDG), CA1 of hippocampus (HCA1), internal capsule (IntCap), cerebral cortex at level of thalamus (Cthal), septal nuclei (SepNuc), and cerebral cortex at level of septal nuclei (Csep).
Immunohistochemistry
Brain sections were immunolabeled to detect PrPSc as previously described 79 using mouse anti-PrP primary antibody 6C2 (CVI-WUR, Lelystad). Sequential multiple immunolabeling was performed on 2 sets of serial tissue sections using primary antibodies against Arg1 (rabbit anti-Arg1, ab91279, Abcam), iNOS (rabbit anti-iNOS, ab15323, Abcam), Iba1 (rabbit anti-Iba1, ab178847, Abcam), and GFAP (rabbit anti-GFAP, Z022429, Dako). Each set was labeled first with either Arg1 or iNOS, followed by Iba1 and GFAP. For each set, slides were baked for 1 hour in a 60°C oven and rehydrated. Antigen retrieval was performed in a rice cooker using citrate-EDTA-10% w/v sucrose buffer (pH 6) for 15 minutes, followed by Tris-EDTA –10% w/v sucrose buffer (pH 9) for 20 minutes. Next, sections were incubated for 10 minutes in a 3% hydrogen peroxide solution, followed by a 30-minute incubation in 5% bovine serum albumin in Tris-buffered saline. iNOS and Arg1 primary antibodies were each applied at a dilution of 1:250 and incubated overnight at 4°C. Tissues were then washed with TBST-10% w/v sucrose buffer and incubated at 37°C with an HRP-conjugated goat anti-rabbit secondary antibody (ImmPRESS, MP-7500, Vector Laboratories) diluted 1:3 in TBST. After washing, slides were developed with ImmPACT AEC Peroxidase (HRP) Substrate (SK-4205, Vector Laboratories) according to kit instructions. Tissues were counterstained with 1:1 deionized water:Gill’s No. 2 hematoxylin (Sigma-Aldrich) for 2 minutes and stored in TBS buffer at 4°C through the duration of image acquisition. On completing image capture for each staining round, as described in the following, slides were stripped of chromogen and antibody by adapting a beta-mercaptoethanol buffer incubation protocol described by Gendusa et al 24 as follows: doubling the concentration of beta-mercaptoethanol (1.8 ml/100 ml buffer) and extending elution buffer incubation to 90 minutes. Efficacy of the elution protocol is demonstrated in Supplemental Figures S1 through S3 (see online version for Supplemental Material). After removing bound iNOS or Arg1 antibody complexes, tissues were reblocked by incubating for 1 hour with 5% BSA in TBS and then relabeled with rabbit anti-Iba1 primary (1:5000), as described previously. Following image acquisition of Iba1 immunoreactivity, tissues were again stripped of chromogen and antibody complexes and submitted to a final round of immunolabeling for GFAP (1:5000). On completing image capture, GFAP-stained slides were coverslipped with aqueous permanent mounting medium for long-term storage (VectaMount AQ, H-5501, Vector Laboratories).
Image Analysis
Immunohistochemical staining was imaged using an Olympus DP73 camera mounted on an Olympus BX53 microscope, operated with cellSens imaging software (v1.15, Olympus Corporation). TBST-wetted slides were coverslipped, and 4800 × 3600 ppi brightfield images of one 200× field of the medial thalamus and one 400× field of the remaining 14 regions of interest were captured. Following image capture, coverslips were gently floated off tissue sections, and slides were returned to storage in TBST at 4°C in anticipation of the next IHC round. Images of successive IHC rounds were acquired from the same subanatomic location by visually aligning nuclei. Captured images were processed using the Area Quantification module v1.0 within the HALO image analysis platform (v2.0.1145.19, Indica Labs). Briefly, hematoxylin nuclear stain and AEC chromogen were selected as stain Nos. 1 and 2, respectively, and adequate deconvolution was confirmed visually. A base threshold intensity value was assigned to image sets and manually adjusted, as needed, for each image to accurately reflect chromogen distribution in the regions of interest. Total chromogen deposition in the region of interest was quantified by the module algorithm as percentage stain No. 2 positive tissue, referring to the percentage of analyzed area positive for staining. Colocalization of enzymatic and glial staining was achieved by assigning an opaque red and yellow pseudocolor to thresholded regions in HALO’s Area Quantification module, respectively, and importing the resulting .tif images into Photoshop CC (Adobe). The Layer Auto-Align command was used to overlay paired images from each region of interest. An opacity value of 50% was assigned to the glial stain image, generating an orange zone in regions of colocalization. Layers were flattened, and the exported image was reanalyzed in HALO’s Area Quantification module v1.0 to obtain a percentage stain-positive tissue for the orange colocalization zone.
Statistical Analysis
Data were analyzed using a generalized linear model to detect significant differences in quantified immunoreactivity between mock-inoculated and RML-infected animal groups. DPI, brain location, and treatment condition were included as fixed effects in the model. Simple effect comparisons between the least squares (LS) means of mock-inoculated and infected animal groups were conducted at each DPI within all brain regions to determine the degree of significance. In instances where a brain region of interest was not present in the mock-inoculated sections for a particular timepoint, data from infected mice were compared to data from the preceding mock-inoculated DPI timepoint (eg, hippocampal CA1 was not present in sections from 155 DPI mock-inoculated mice, so 155 DPI infection data was compared to 120 DPI mock-inoculated data). The SepNuc were not present in 30 DPI control sections, thus the 30 DPI infected cohort was excluded from statistical analysis due to lack of either a control or an earlier infection timepoint to use for comparison. Results were considered statistically significant if P < .05. The software for conducting statistical analysis was SAS version 9.4.
Results
PrPSc Deposition and Spongiform Change
Infected animals developed classic neuropathologic changes of PrPSc accumulation and vacuolation (Figs. 1–5). Definitive spongiform change (Fig. 6) was first observed at 120 DPI in the 3 evaluated white matter regions (cerebellar peduncles, MLF, internal capsule), the lateral and medial thalamus, CA1 of the hippocampus, and septal nuclei. By 155 DPI (clinical disease), spongiform change was additionally present in the vestibular nuclei and the dentate gyrus of the hippocampus. Definitive vacuolation was not observed in other brain regions evaluated in infected or mock-inoculated animals.
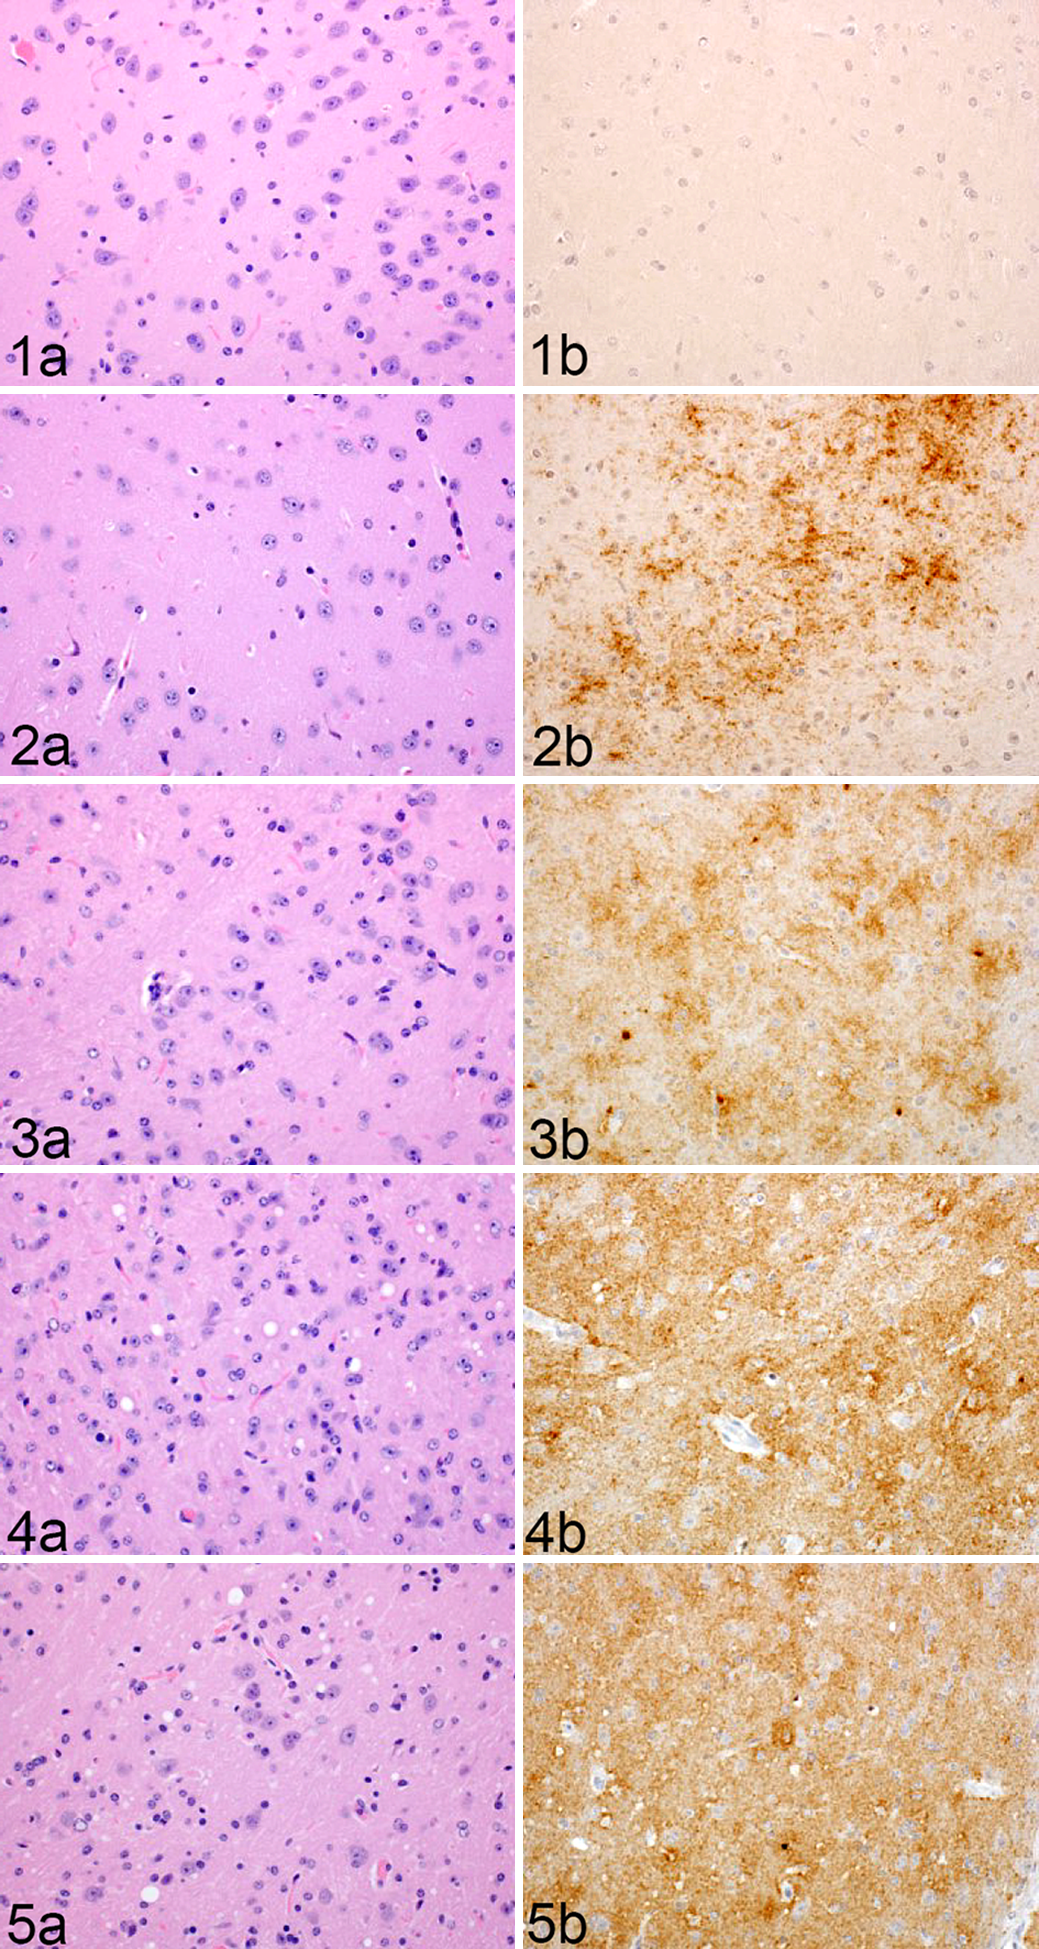
Rocky Mountain Laboratory (RML) scrapie infection, thalamus, mouse. Representative images of thalamic vacuolation and PrPSc immunoreactivity in RML-infected murine brain at (Fig. 1) 30, (Fig. 2) 60, (Fig. 3) 90, (Fig. 4) 120, and (Fig. 5) 155 days postinoculation (DPI).
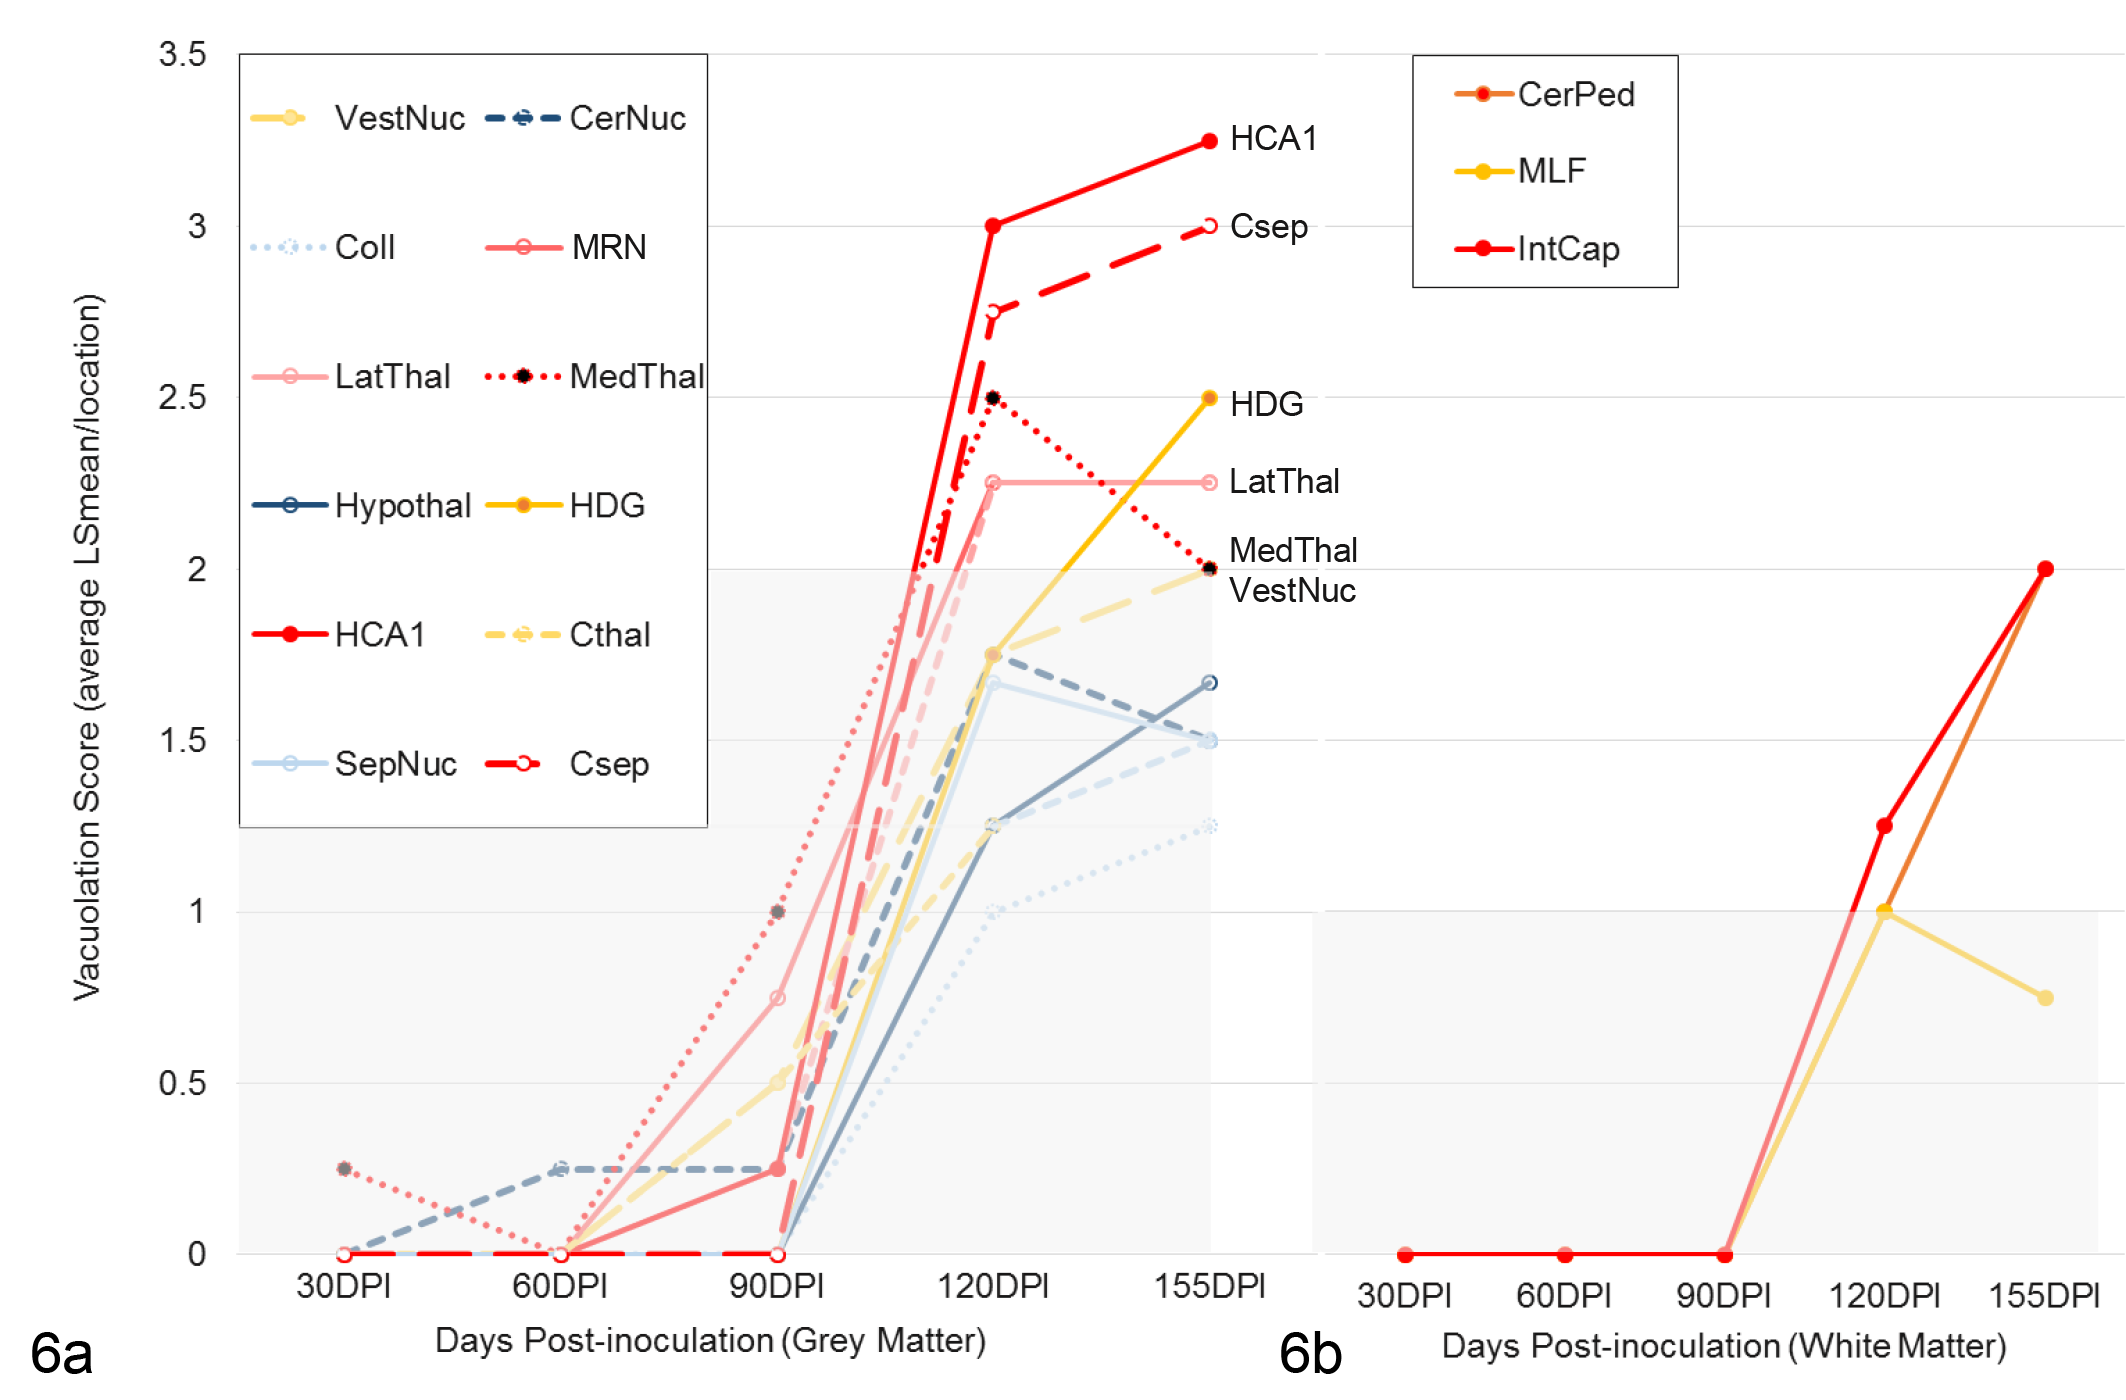
Neuronal vacuolation scores of Rocky Mountain Laboratory (RML) scrapie–infected mice in (a) grey and (b) white matter regions over time. Data points for each brain region represent simple means for integer scores assigned to RML-infected cohorts at each timepoint.
Quantitative immunohistochemistry was used to determine changes in PrPSc immunoreactivity over time. Significant increases between RML-infected and mock-inoculated groups were determined by 1-tailed Student’s t-tests of simple effects comparisons between group least squares means. PrPSc immunoreactivity (Fig. 7) was first significantly increased over mock-inoculated controls at 60 DPI in the cerebellar nuclei (P < .05), MRN (P < .01), lateral thalamus (P < .05), septal nuclei (P < .05), and cortex at the level of the septal nuclei (P < .01). PrPSc remained progressively elevated through clinical disease in the cerebellar nuclei, MRN, and lateral thalamus (P < .001). A significant and sustained increase in PrPSc immunoreactivity was first detected at 90 days in the vestibular nuclei (P < .01) and medial thalamus (P < .001), and a transient increase was detected in the hypothalamus (P < .01). Significant PrPSc immunoreactivity was ubiquitous in all grey matter regions by 155 DPI (P < .001 for all brain regions, except hypothalamus P < .05). PrPSc deposition in white matter tracts was minimal, only achieving significance above controls at 155 DPI in the MLF (P < .05)
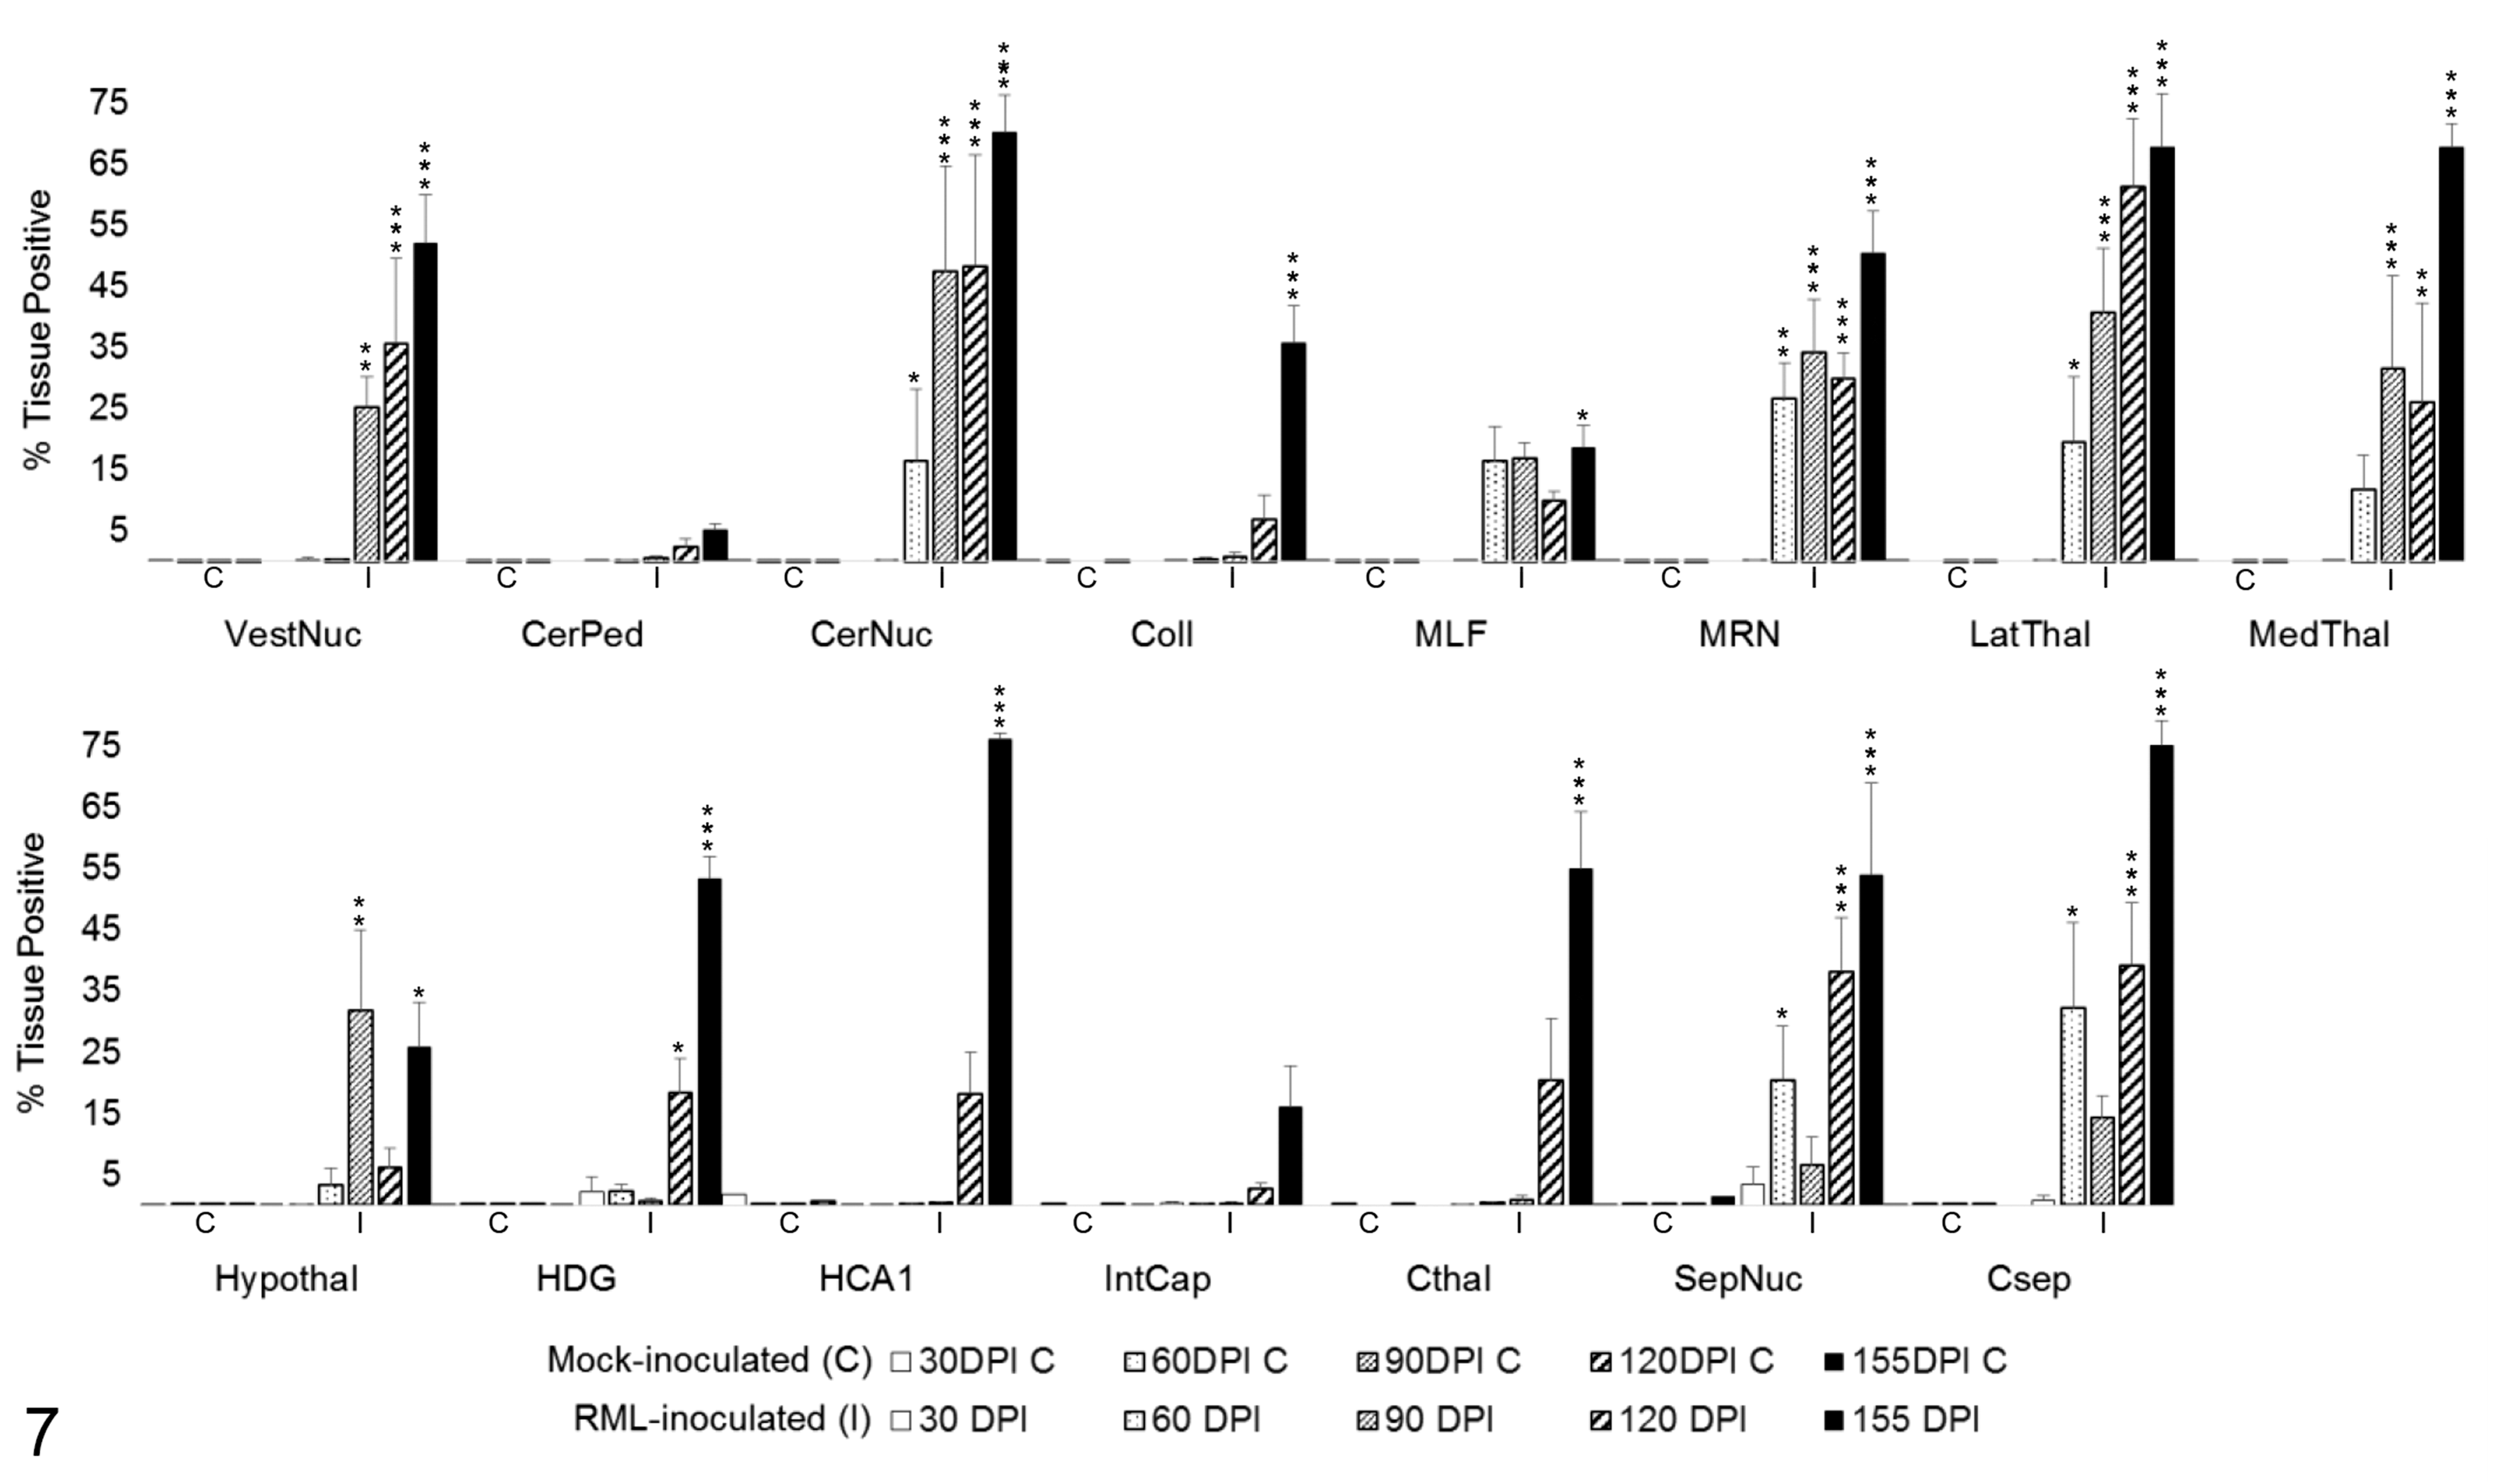
PrPSc immunoreactivity in 15 brain regions over the time course of Rocky Mountain Laboratory (RML) scrapie infection. Bars represent mean ± SEM values for mock- (C) and RML-inoculated (I) animal cohorts at each timepoint (30, 60, 90, 120, 155 days postinoculation). Significant differences compared with mock-inoculated animals: *P < .05. **P < .01. ***P < .001. CerNuc, cerebellar nuclei; CerPed, cerebellar peduncles; Coll, superior colliculus; Csep, cerebral cortex at level of septal nuclei; Cthal, cerebral cortex at level of thalamus; HCA1, CA1 of hippocampus; HDG, dentate gyrus of hippocampus; Hypothal, hypothalamus; IntCap, internal capsule; LatThal, lateral thalamus; MedThal, medial thalamus; MLF, medial longitudinal fasciculus; MRN, midbrain reticular nucleus; SepNuc, septal nuclei; VestNuc, vestibular nuclei.
Gliosis
RML-inoculated animals developed microgliosis and astrocytosis over the course of infection. (Figs. 8–12) Qualitative changes in microglial morphology were observed over the course of infection (Fig. 13, Table 1). Quiescent ramified microglia were gradually replaced by hypertrophied phenotypes with thick processes, a change first observed in the MLF and, to a lesser degree, thalamus at 60 DPI. By 120 DPI, all examined regions contained a preponderance of hypertrophied microglia. Retraction of processes and a marked increase in somal volume (“amoeboid” microglia) were first observed at 120 DPI and sustained through clinical infection, where present. This morphology did not appear until 155 DPI in the hippocampus and never manifested in examined sections of the colliculus, hypothalamus, cortex, or septal nuclei.
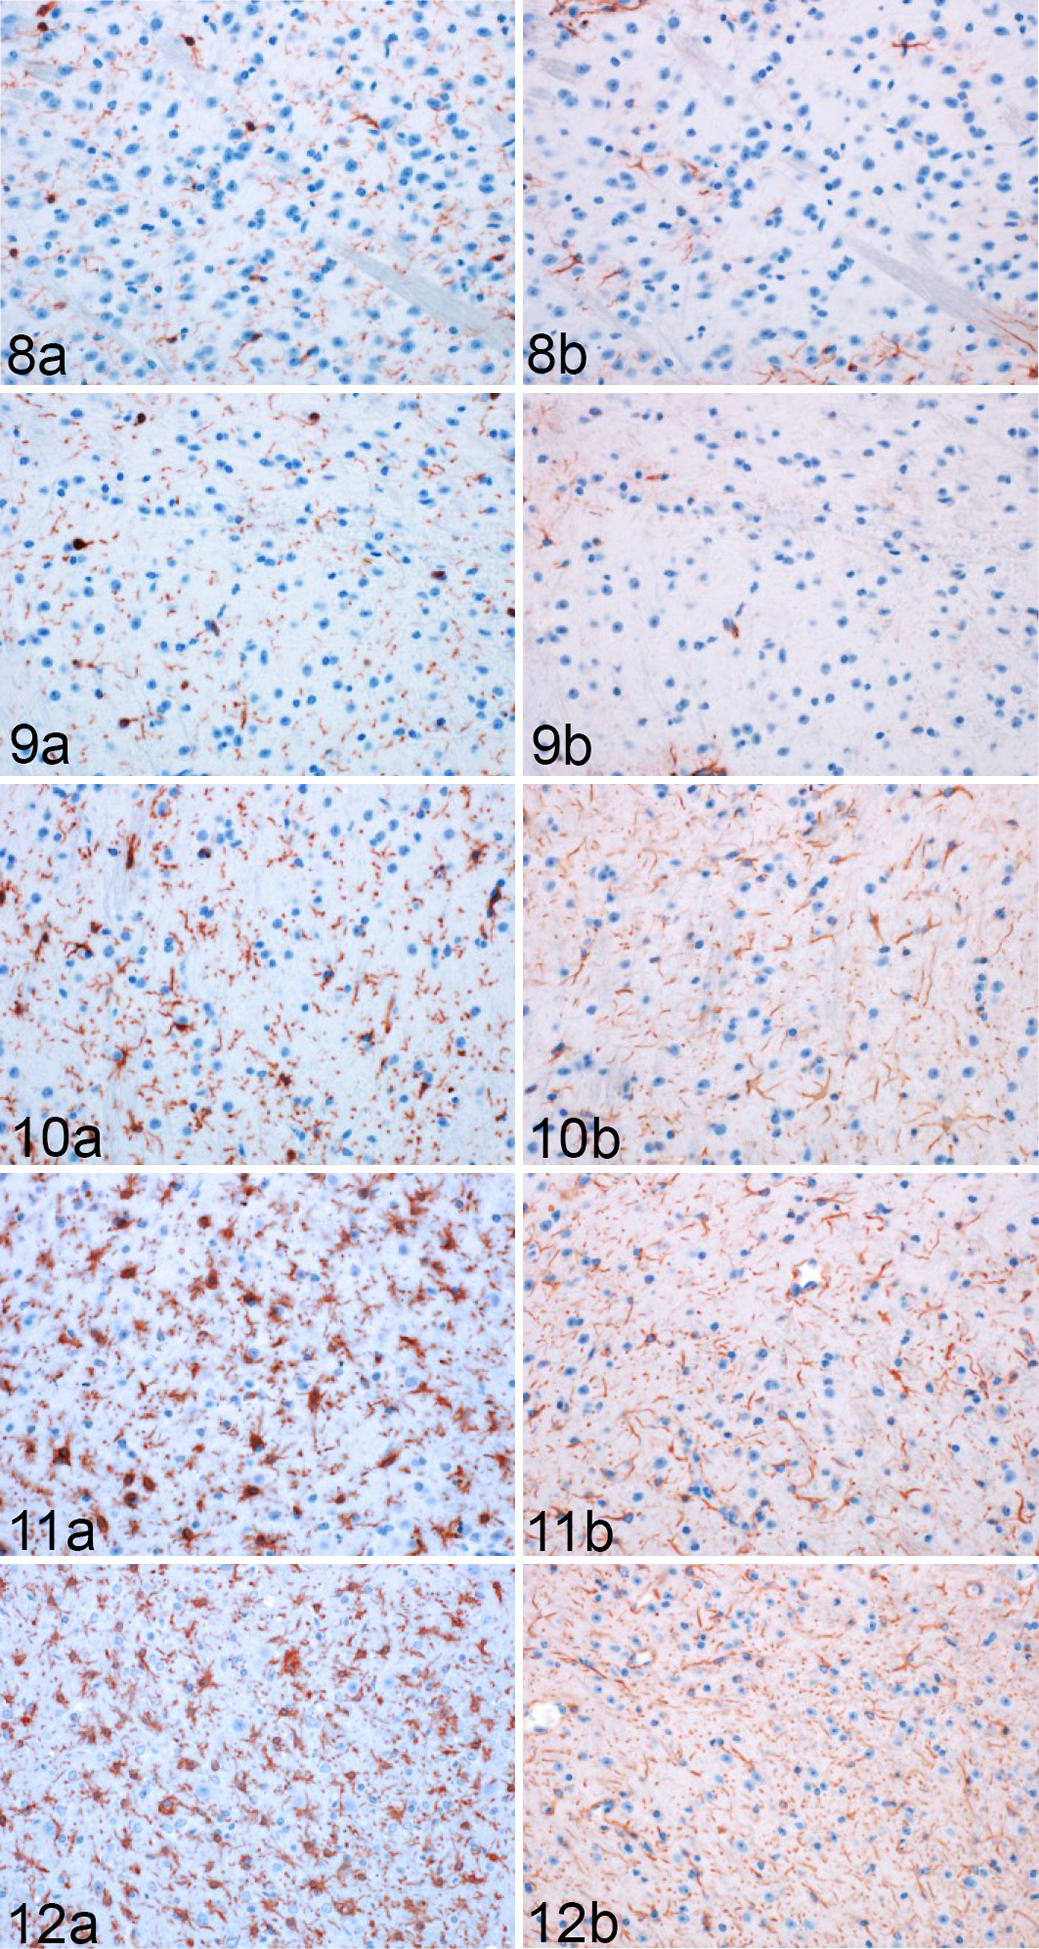
Rocky Mountain Laboratory (RML) scrapie infection, lateral thalamus, mouse. Representative images of Iba1 and GFAP immunoreactivity in the thalamus of infected mice (Fig. 8) 30, (Fig. 9) 60, (Fig. 10) 90, (Fig. 11) 120, and (Fig. 12) 155 days postinoculation (DPI).
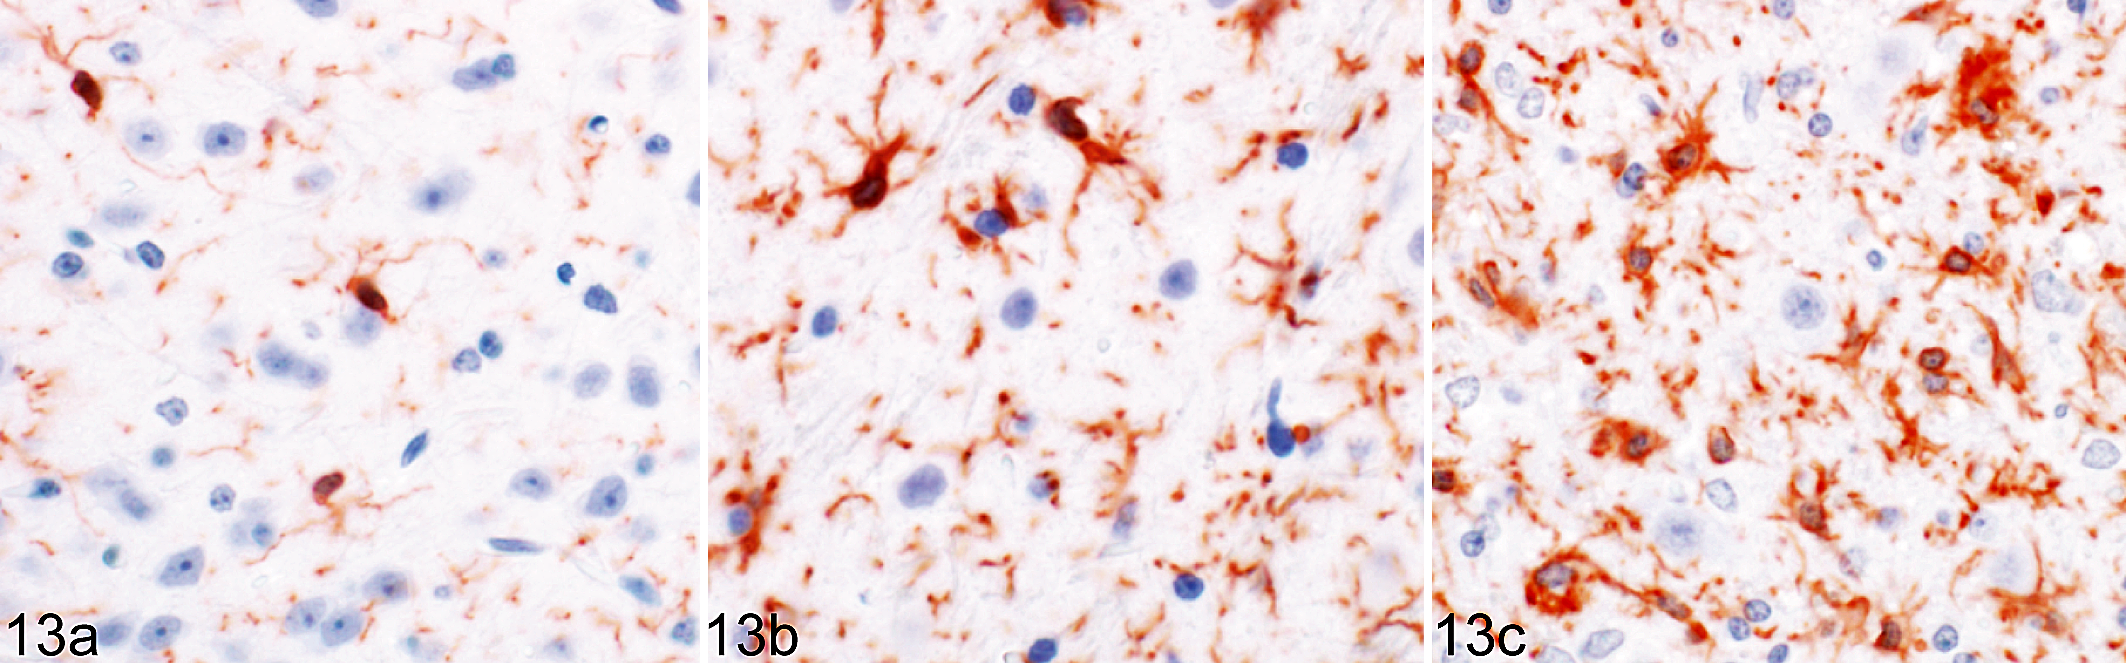
Rocky Mountain Laboratory (RML) scrapie infection, lateral thalamus, mouse. Temporal changes in microglial morphology in response to prion infection. Representative images of ramified quiescent microglia (
Temporal Changes in Microglial Morphology in Response to Prion Infection.
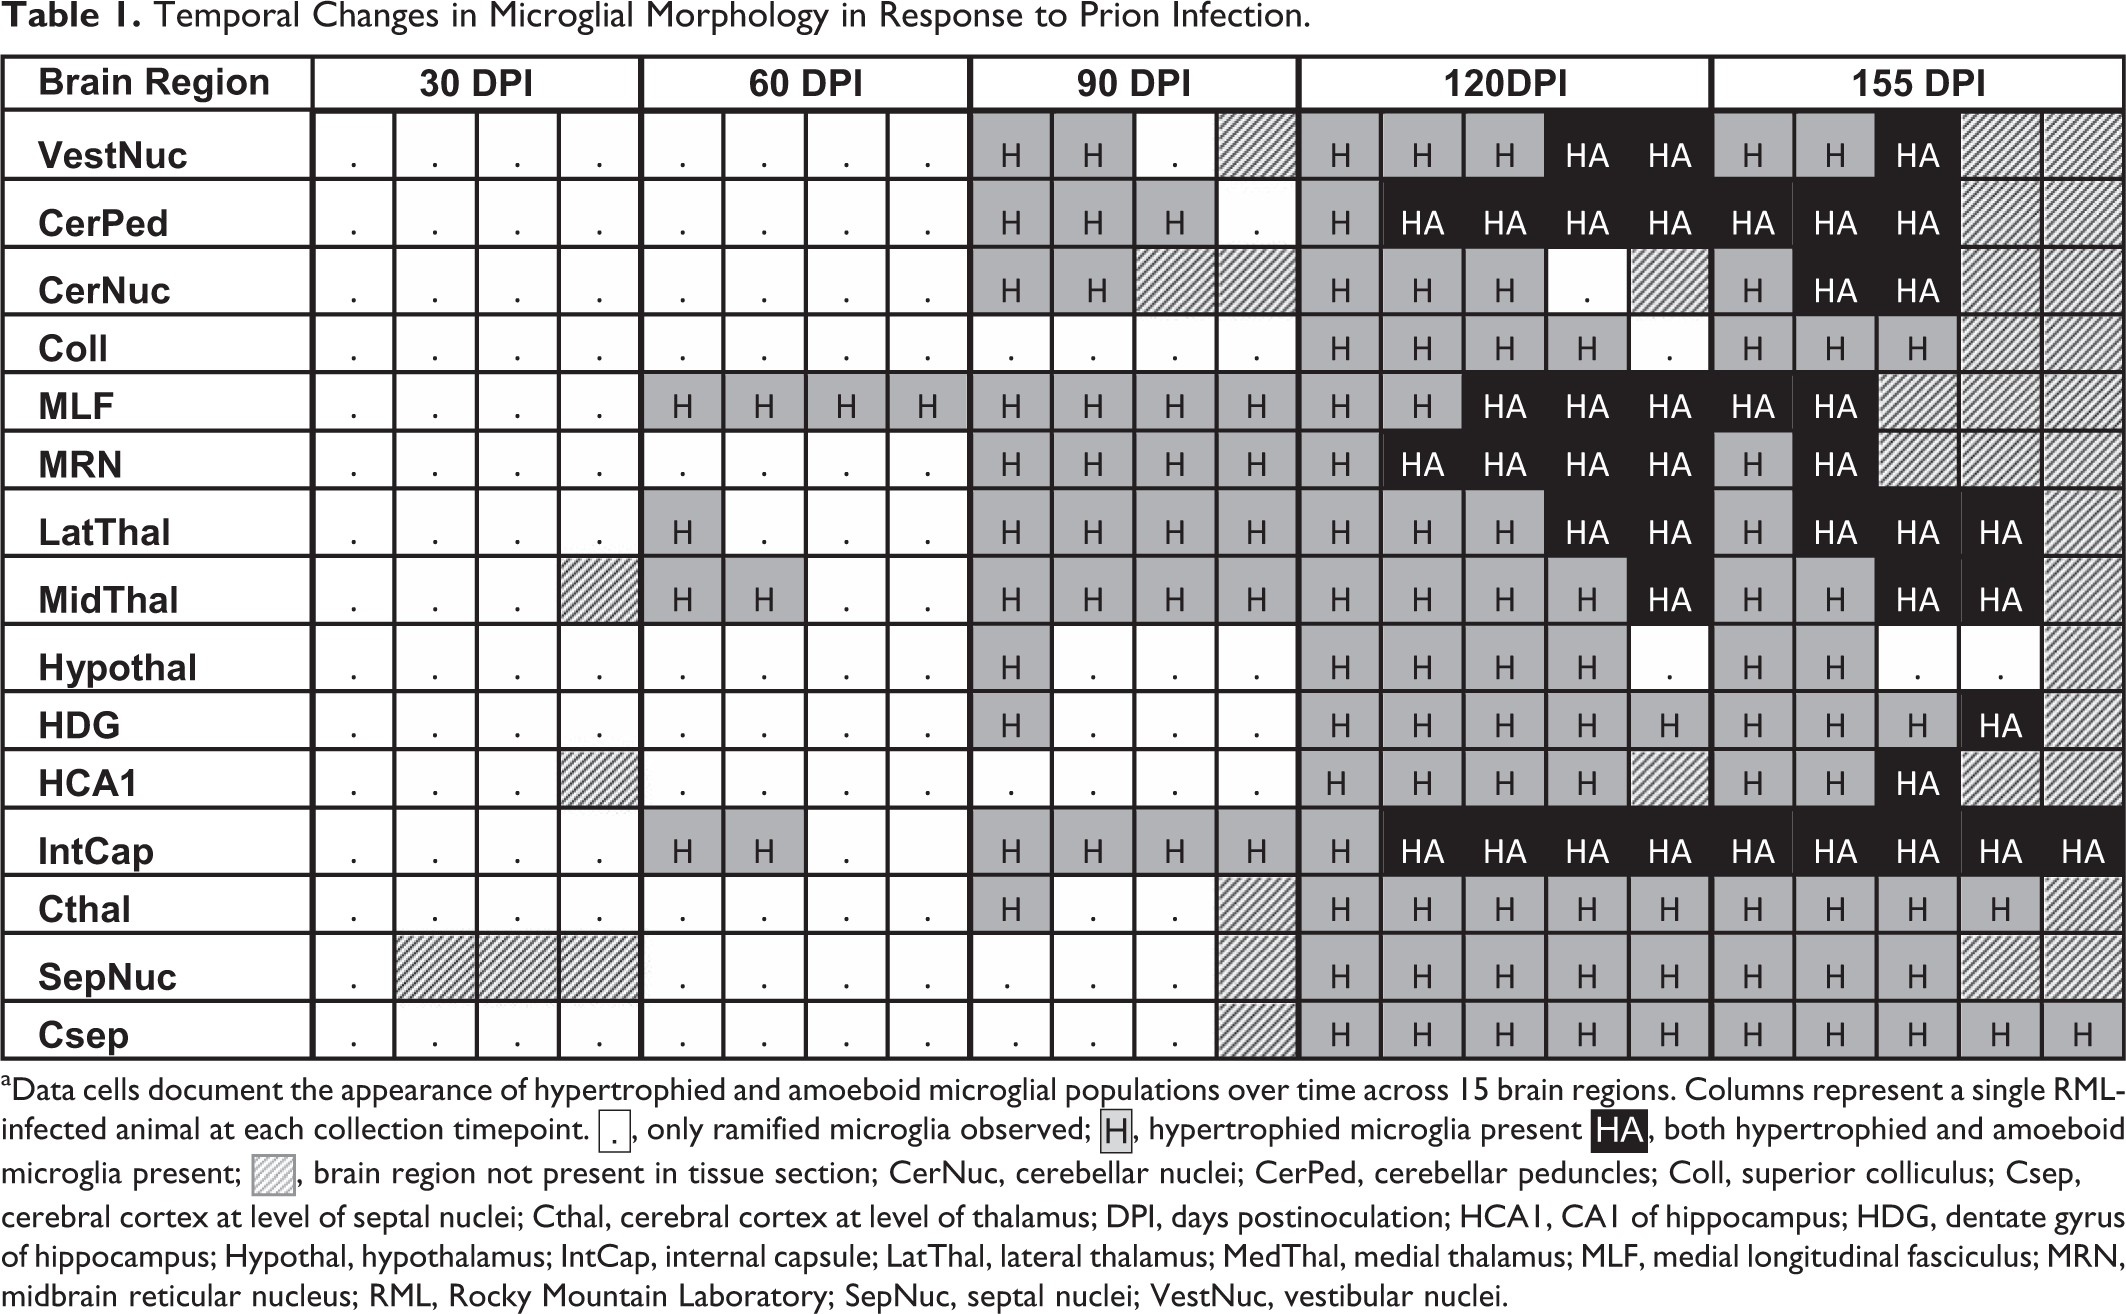
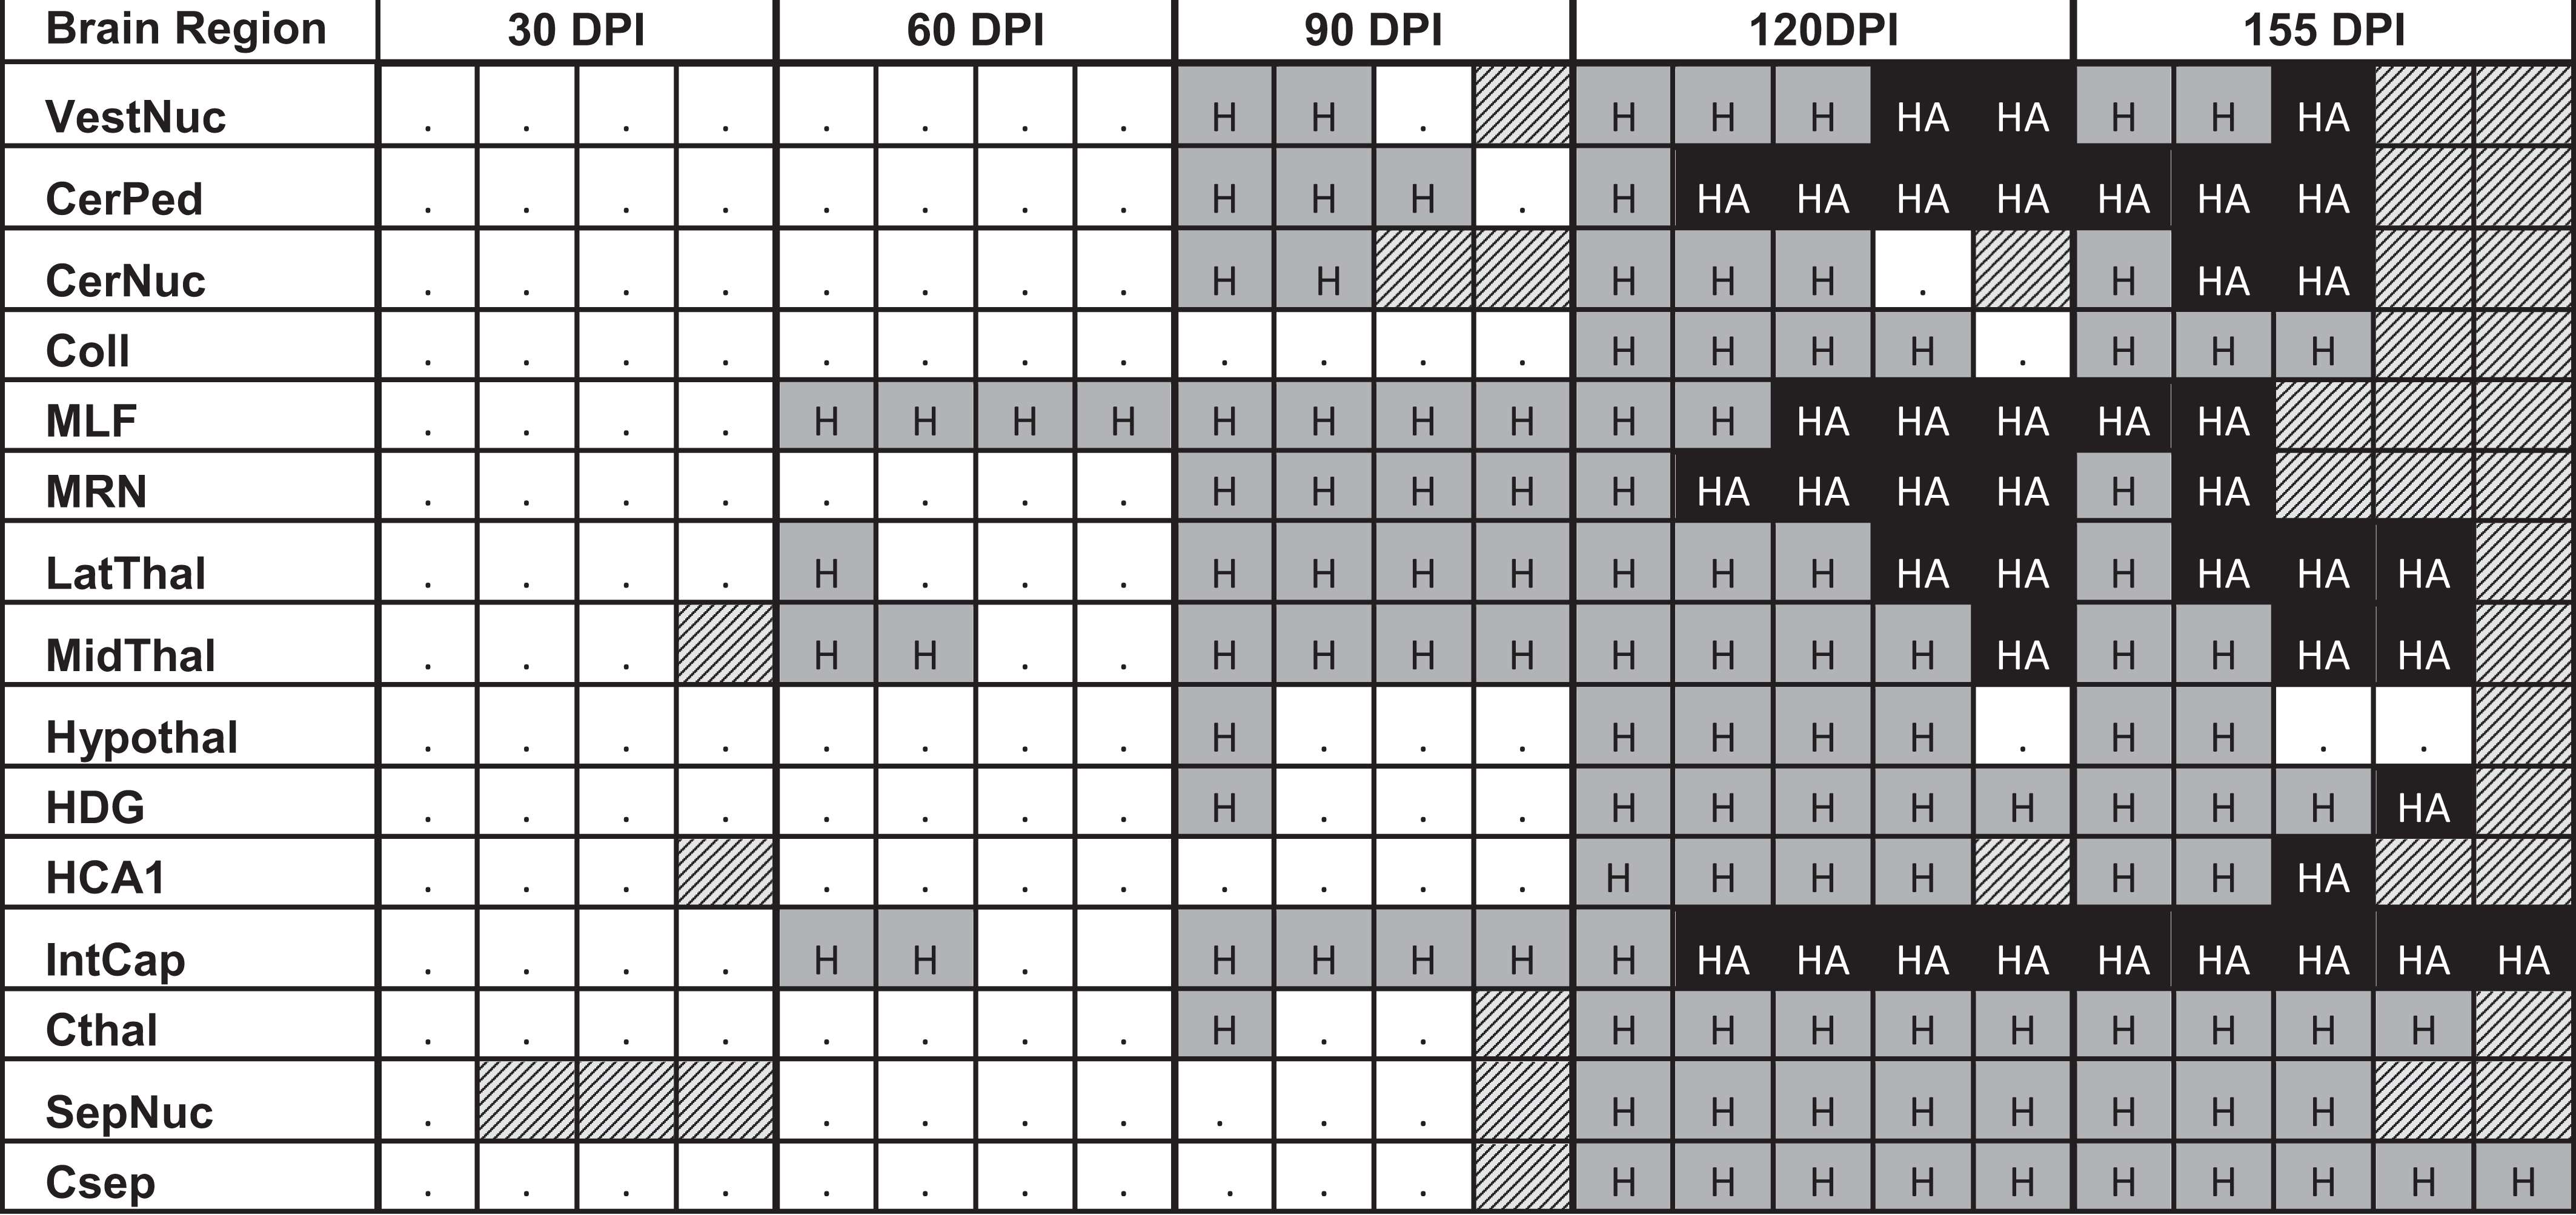
aData cells document the appearance of hypertrophied and amoeboid microglial populations over time across 15 brain regions. Columns represent a single RML-infected animal at each collection timepoint.  , only ramified microglia observed;
  , hypertrophied microglia present
  , both hypertrophied and amoeboid microglia present;
  , brain region not present in tissue section; CerNuc, cerebellar nuclei; CerPed, cerebellar peduncles; Coll, superior colliculus; Csep, cerebral cortex at level of septal nuclei; Cthal, cerebral cortex at level of thalamus; DPI, days postinoculation; HCA1, CA1 of hippocampus; HDG, dentate gyrus of hippocampus; Hypothal, hypothalamus; IntCap, internal capsule; LatThal, lateral thalamus; MedThal, medial thalamus; MLF, medial longitudinal fasciculus; MRN, midbrain reticular nucleus; RML, Rocky Mountain Laboratory; SepNuc, septal nuclei; VestNuc, vestibular nuclei.
Significant increases in Iba1 and GFAP immunoreactivity between infected and control animals were determined by 1-tailed Student’s t-tests of simple effects comparisons between group least squares means. In the absence of HCA1 representation in mock-inoculated slides at 155 DPI, RML-inoculated animals were instead compared to the 120 DPI mock-inoculated cohort.
Iba1 immunoreactivity (Fig. 14) was significantly increased in infected brains as early as 30 DPI in the cortex at the level of the thalamus (P < .05) and 60 DPI in the MLF (P < .05). By 90 DPI, significant upregulation was detected in the vestibular nuclei (P < .01), MLF (P < .001), MRN (P < .001), medial and lateral thalamus (P < .001), hypothalamus (P < .001), and cortex at the level of the thalamus (P < .05). With exception of septal nuclei that failed to maintain significance at clinical disease (P = .0631), microgliosis was diffusely distributed through all brain regions by 155 DPI (P < .001 for all brain regions, excepting P < .05 for hypothalamus).
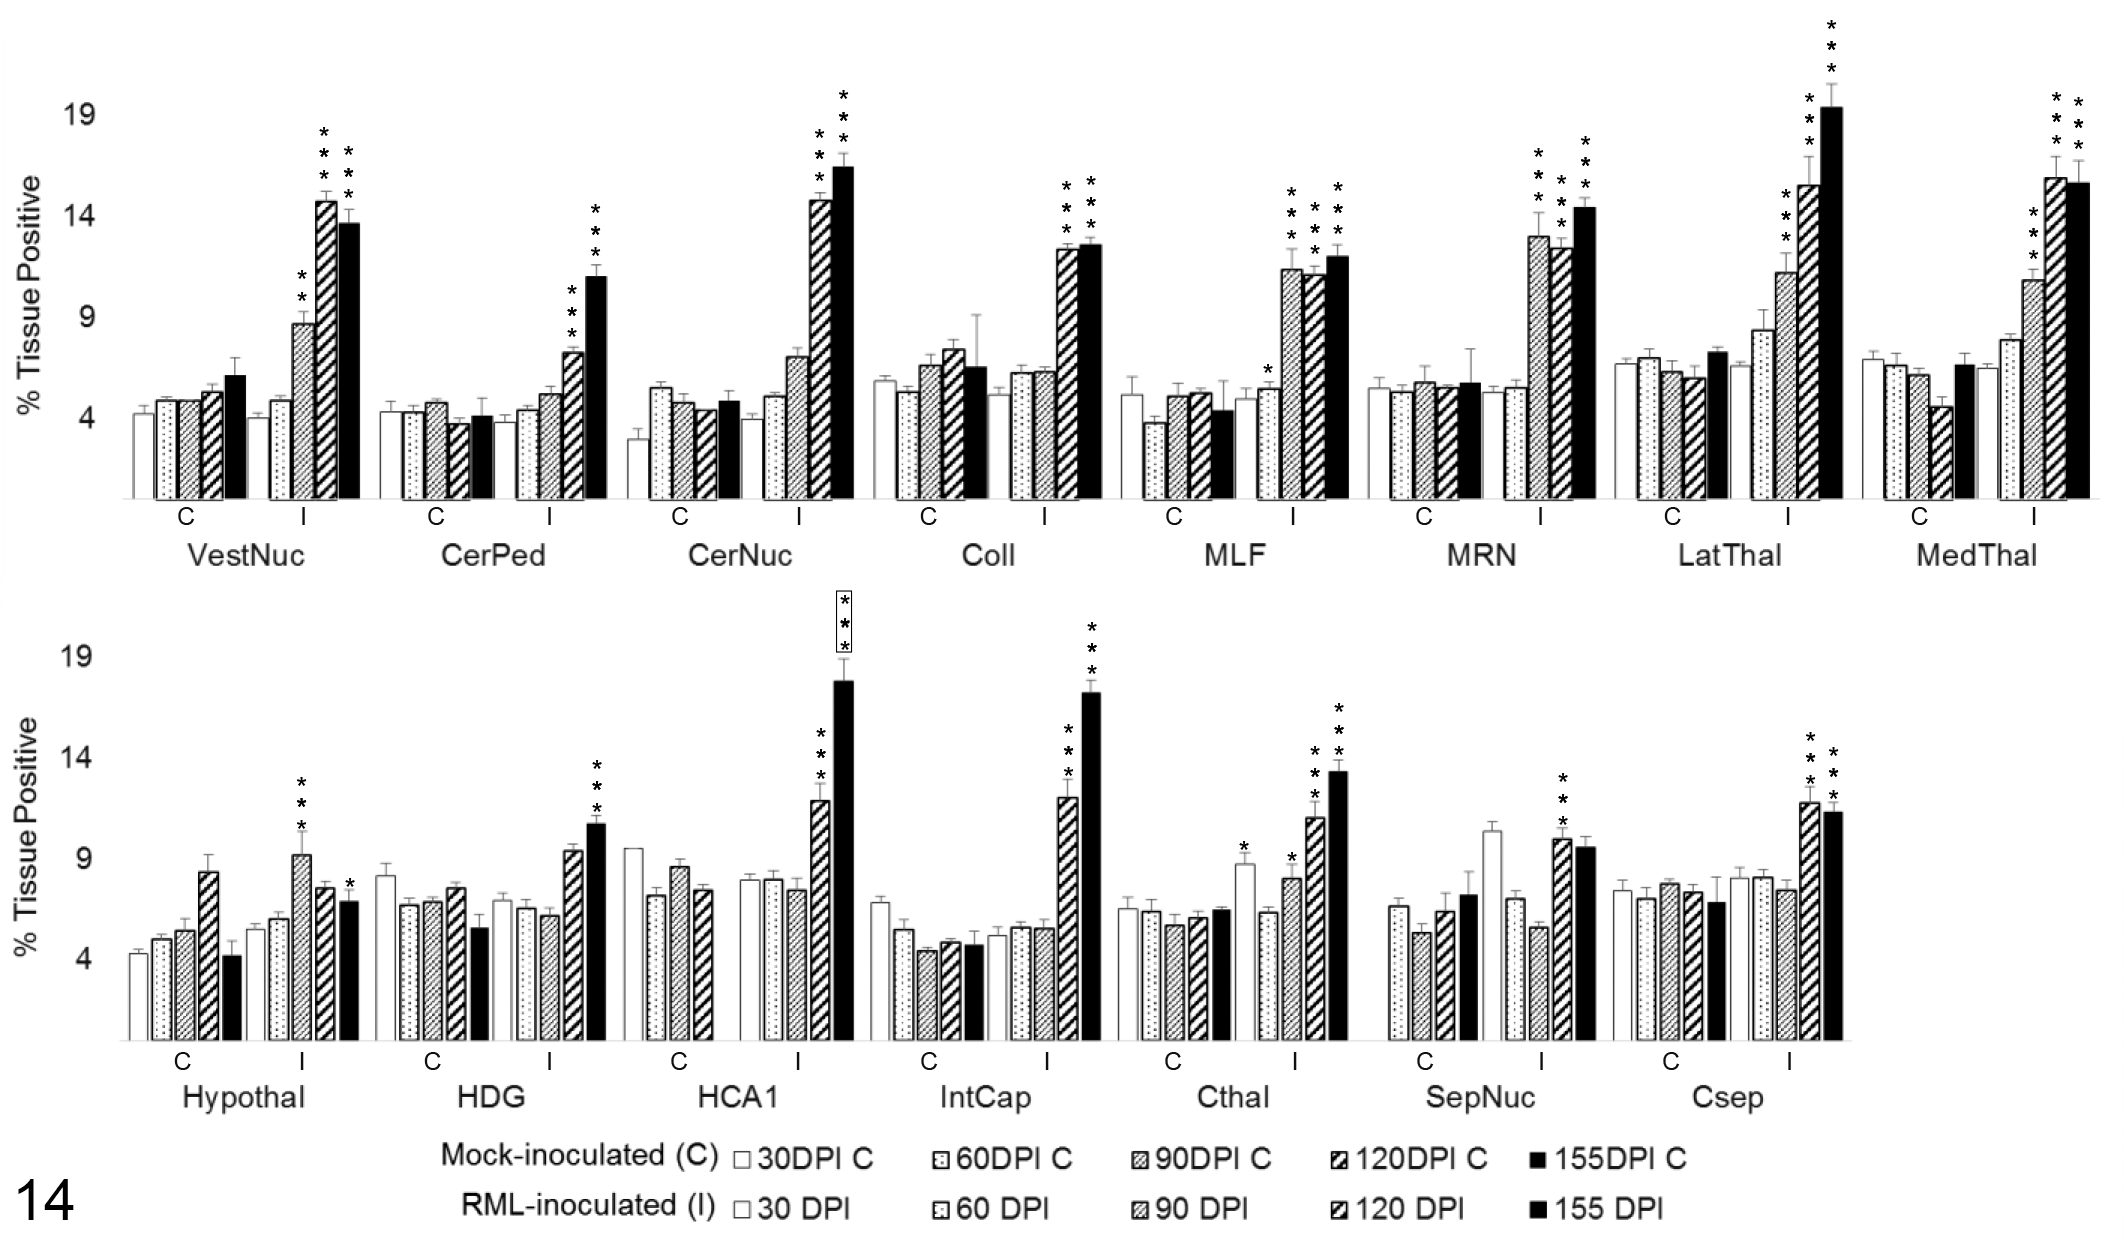
Iba1 immunoreactivity in 15 brain regions over the time course of Rocky Mountain Laboratory (RML) scrapie infection. Iba1 labeling quantified in brain regions as percentage of the tissue positive for Iba1 immunoreactivity. Bars represent mean ± SEM values for mock- (C) and RML-inoculated (I) animal cohorts at each sacrifice timepoint. Significant differences compared with mock-inoculated animals: *P < .05. **P < .01. ***P < .001. Significant difference compared to 120 days postinoculation mock-inoculated animals: ***P < .001. CerNuc, cerebellar nuclei; CerPed, cerebellar peduncles; Coll, superior colliculus; Csep, cerebral cortex at level of septal nuclei; Cthal, cerebral cortex at level of thalamus; HCA1, CA1 of hippocampus; HDG, dentate gyrus of hippocampus; Hypothal, hypothalamus; IntCap, internal capsule; LatThal, lateral thalamus; MedThal, medial thalamus; MLF, medial longitudinal fasciculus; MRN, midbrain reticular nucleus; SepNuc, septal nuclei; VestNuc, vestibular nuclei.
Astrocytic GFAP expression (Fig. 15) underwent a transient increase above mock-inoculated controls at 60 DPI in the cerebellar peduncles (P < .05), HCA1 of the hippocampus (P < .01), and septal nuclei (P < .001). Sustained upregulation was not observed until 90 DPI in the MLF (P < .001), MRN (P < .001), and medial and lateral thalamus (P < .001). A significant increase in GFAP immunoreactivity was first detected at 120 DPI in the vestibular nuclei (P < .001), cerebellar nuclei (P < .001), colliculus (P < .001), cortex at the level of the thalamus (P < .001), and the cortex at the level of the septal nuclei (P < .05). Increased labeling was not measured at any point in the dentate gyrus, internal capsule, or hypothalamus. The cerebellar peduncles, hippocampus, hypothalamus, and internal capsule in control animals demonstrated elevated GFAP immunoreactivity at all timepoints relative to other brain regions.
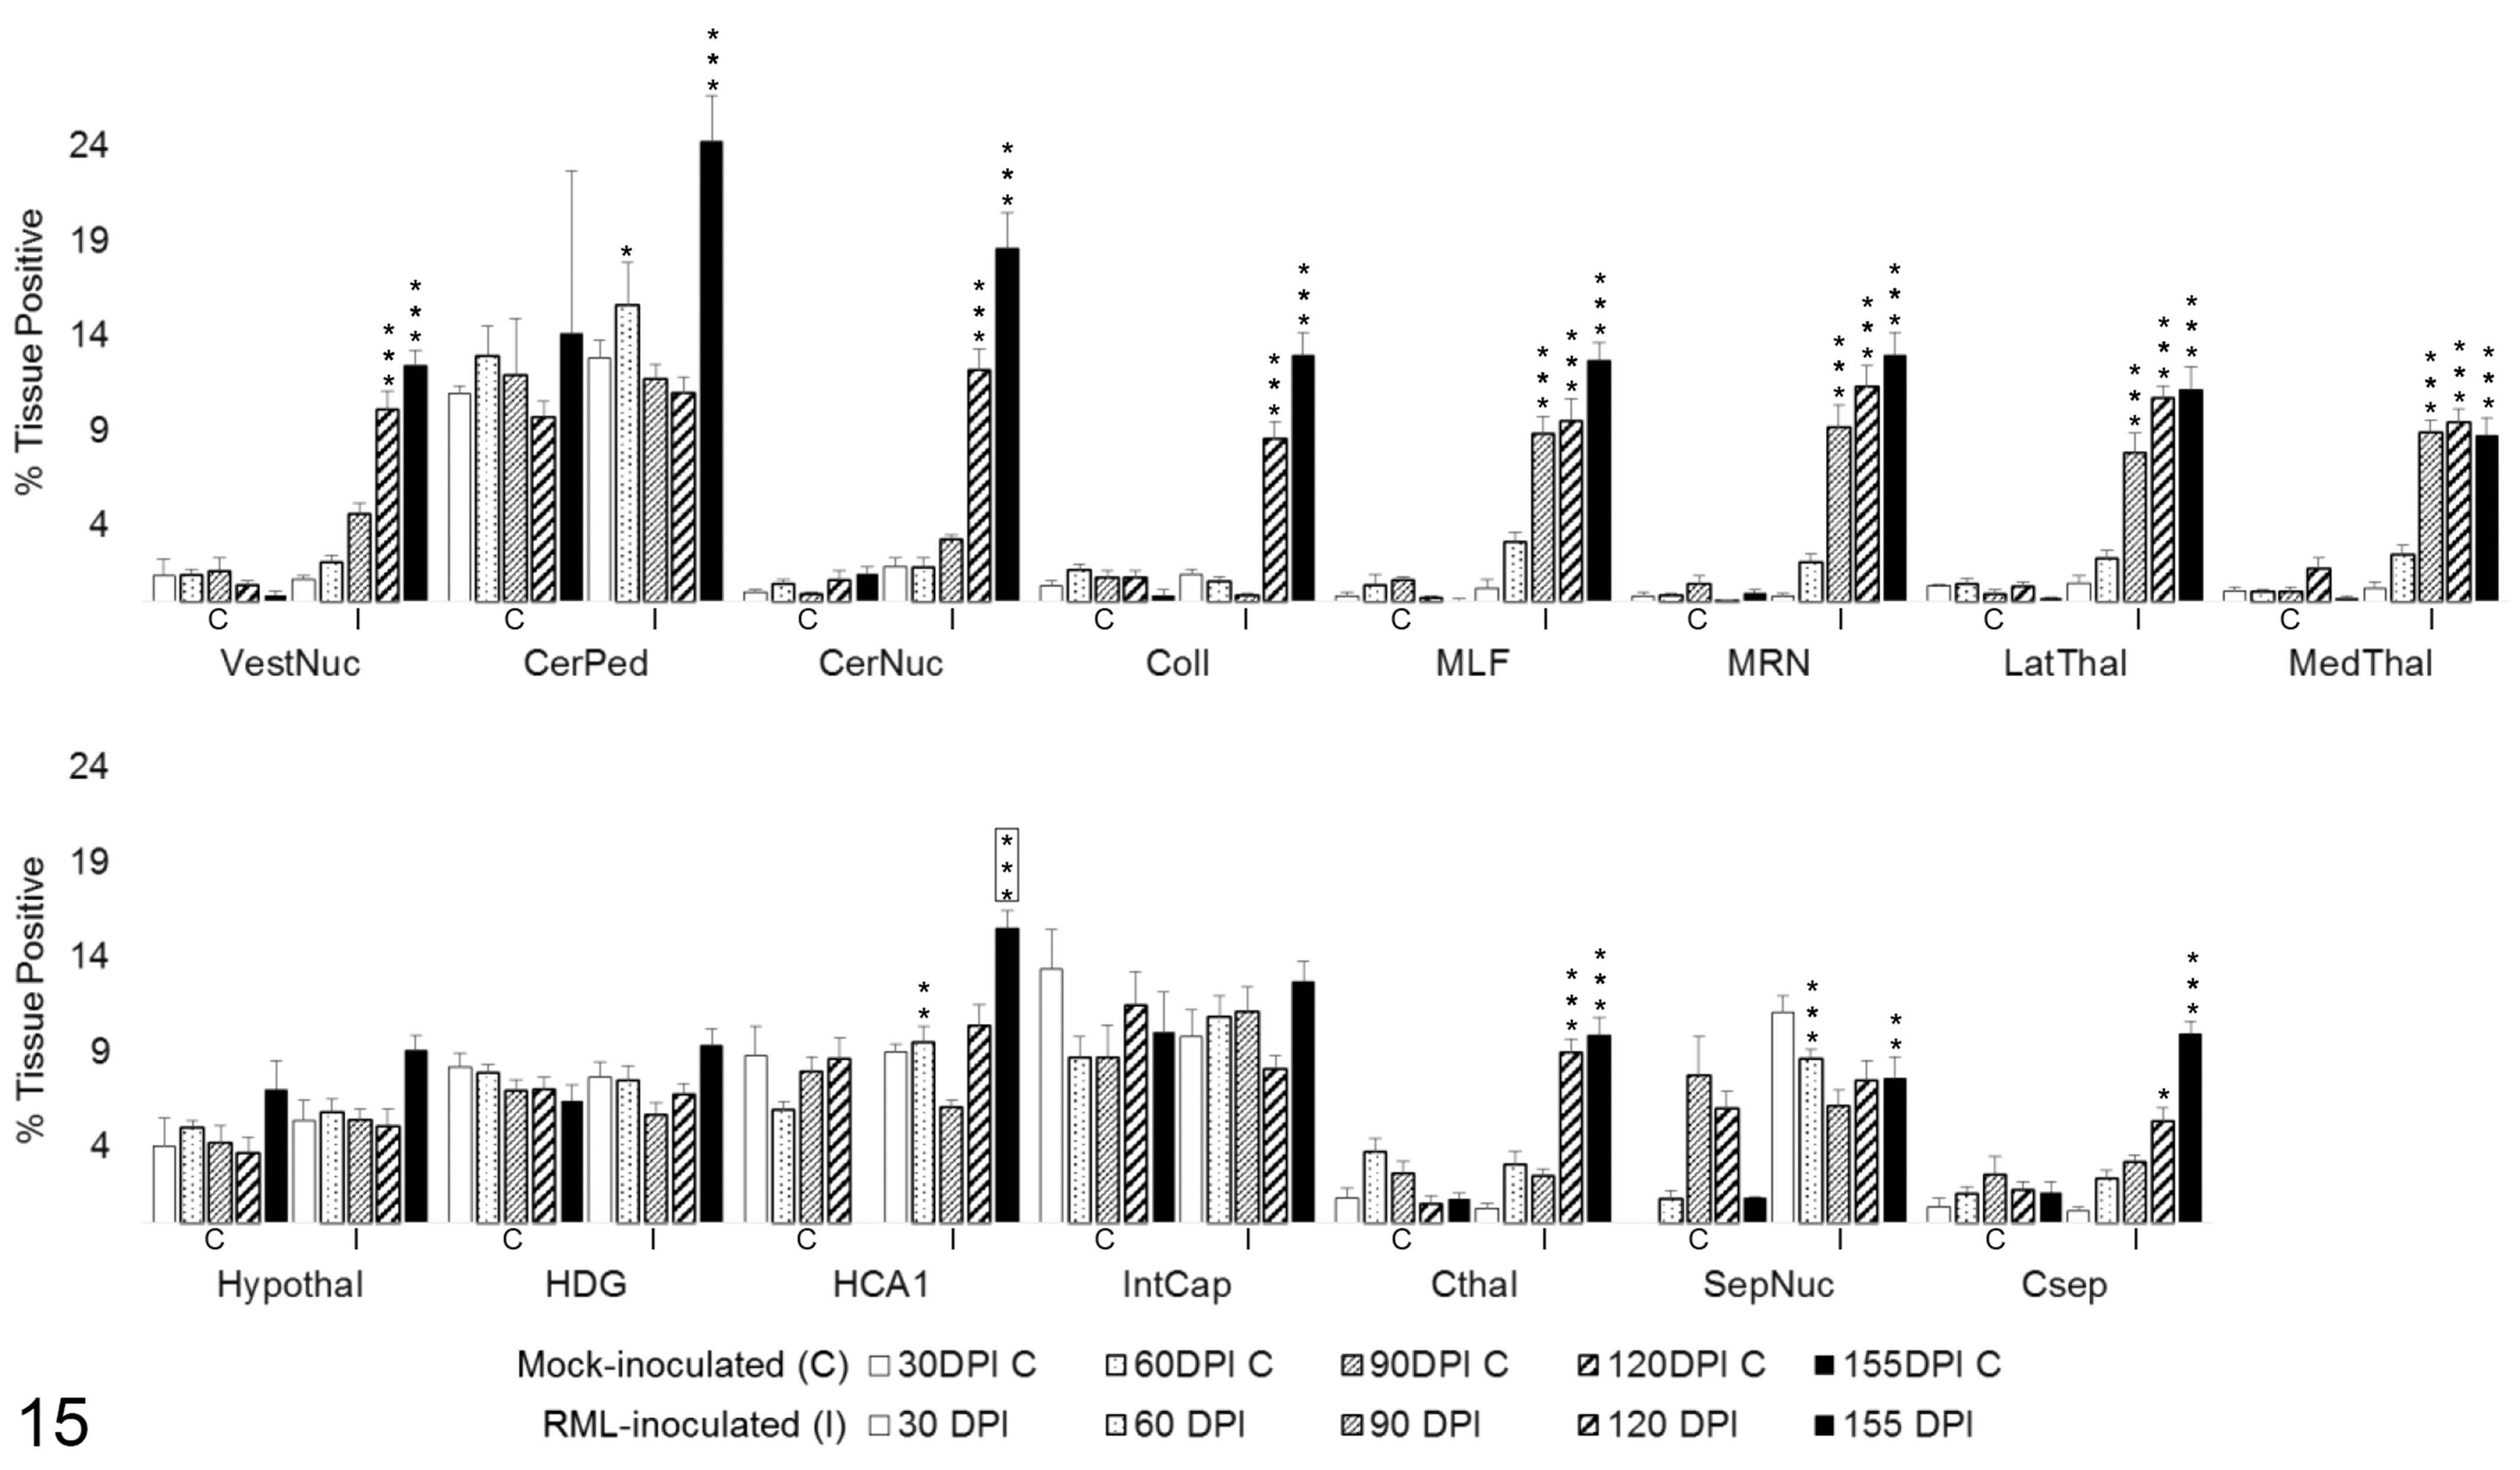
GFAP immunoreactivity in 15 brain regions over the time course of Rocky Mountain Laboratory (RML) scrapie infection. GFAP labeling quantified in brain regions as percentage tissue positive for AEC chromogen deposition. Bars represent mean ± SEM values for mock- (C) and RML-inoculated (I) animal cohorts at each sacrifice timepoint. Significant differences compared with mock-inoculated animals: *P < .05. **P < .01. ***P < .001. Significant difference compared to 120 days postinoculation mock-inoculated animals: ***P < .001. CerNuc, cerebellar nuclei; CerPed, cerebellar peduncles; Coll, superior colliculus; Csep, cerebral cortex at level of septal nuclei; Cthal, cerebral cortex at level of thalamus; HCA1, CA1 of hippocampus; HDG, dentate gyrus of hippocampus; Hypothal, hypothalamus; IntCap, internal capsule; LatThal, lateral thalamus; MedThal, medial thalamus; MLF, medial longitudinal fasciculus; MRN, midbrain reticular nucleus; SepNuc, septal nuclei; VestNuc, vestibular nuclei.
Temporospatial Distribution of iNOS and Arg1
Quantitative IHC was similarly used to evaluate total iNOS and Arg1 immunoreactivity (Figs. 16–20) and the degree of colocalization with Iba1 and GFAP within each brain region. Significant differences in iNOS and Arg1 immunoreactivity between infected and mock-inoculated mice were determined by 2-tailed Student’s t-tests of simple effects comparisons between group least squares means for total enzyme. One-tailed Student’s t-tests were used to compare increases in colocalized enzyme expression between group least squares means. In the absence of HCA1 representation in mock-inoculated slides at 155DPI, RML-inoculated animals were compared to the 120 DPI mock-inoculated cohort.
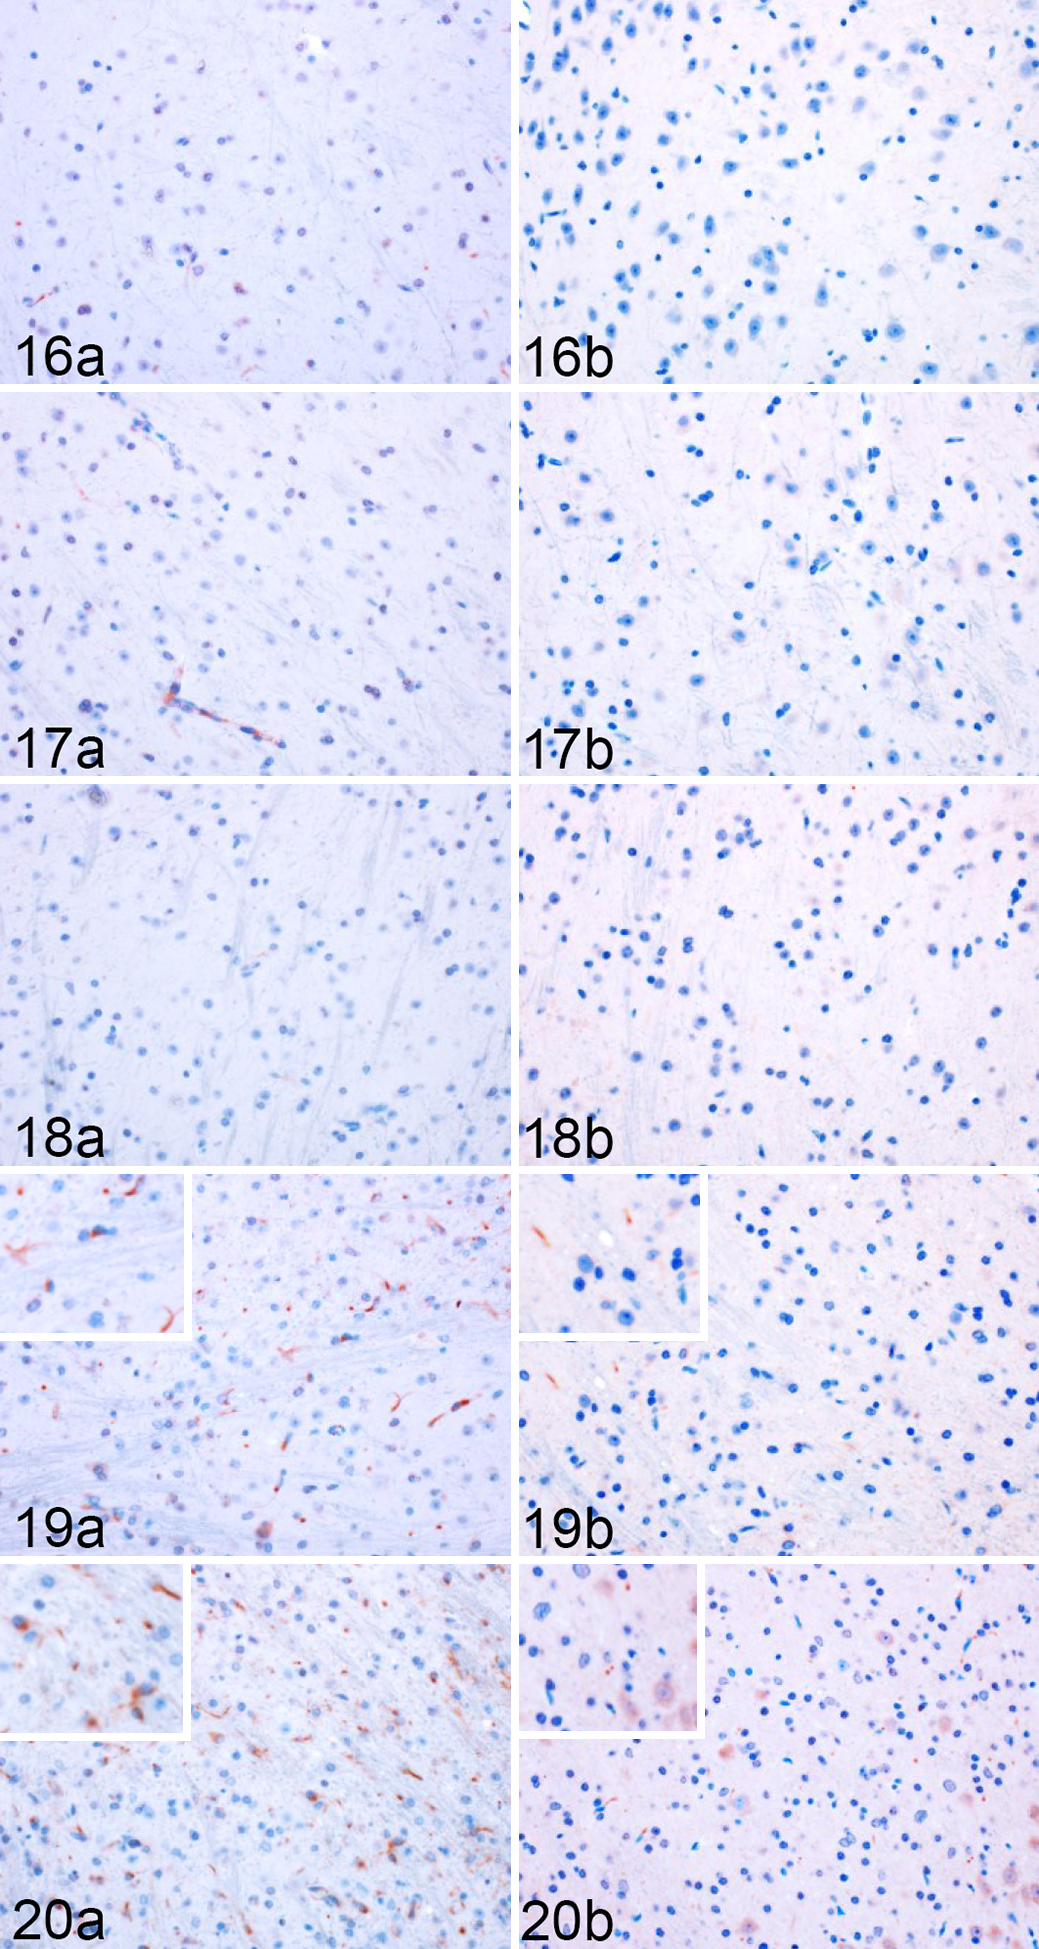
Rocky Mountain Laboratory (RML) scrapie infection, lateral thalamus, mouse. Representative images of iNOS and Arg1 immunoreactivity in the thalamus of infected mice (Fig. 16) 30, (Fig. 17) 60, (Fig. 18) 90, (Fig. 19) 120, and (Fig. 20) 155 days postinoculation.
Total iNOS expression was varied across the brain regions, with no significant change in infected mice in 7 of 15 regions (Fig. 21). A transient increase in total iNOS was observed at 60 DPI in the vestibular nuclei (P < .01) and cerebellar nuclei (P < .01). From 60 to 155 DPI, there was a sustained and progressive increase in iNOS in the cerebellar peduncles (P < .05). Expression was not significantly elevated until 120 DPI in the MLF (P < .01), MRN (P < .01), and lateral thalamus (P < .05). Late increases in iNOS immunoreactivity were first observed at 155 DPI in CA1 of the hippocampus (P < .05, compared to 120 DPI mock-inoculated cohort) and internal capsule (P < .001).
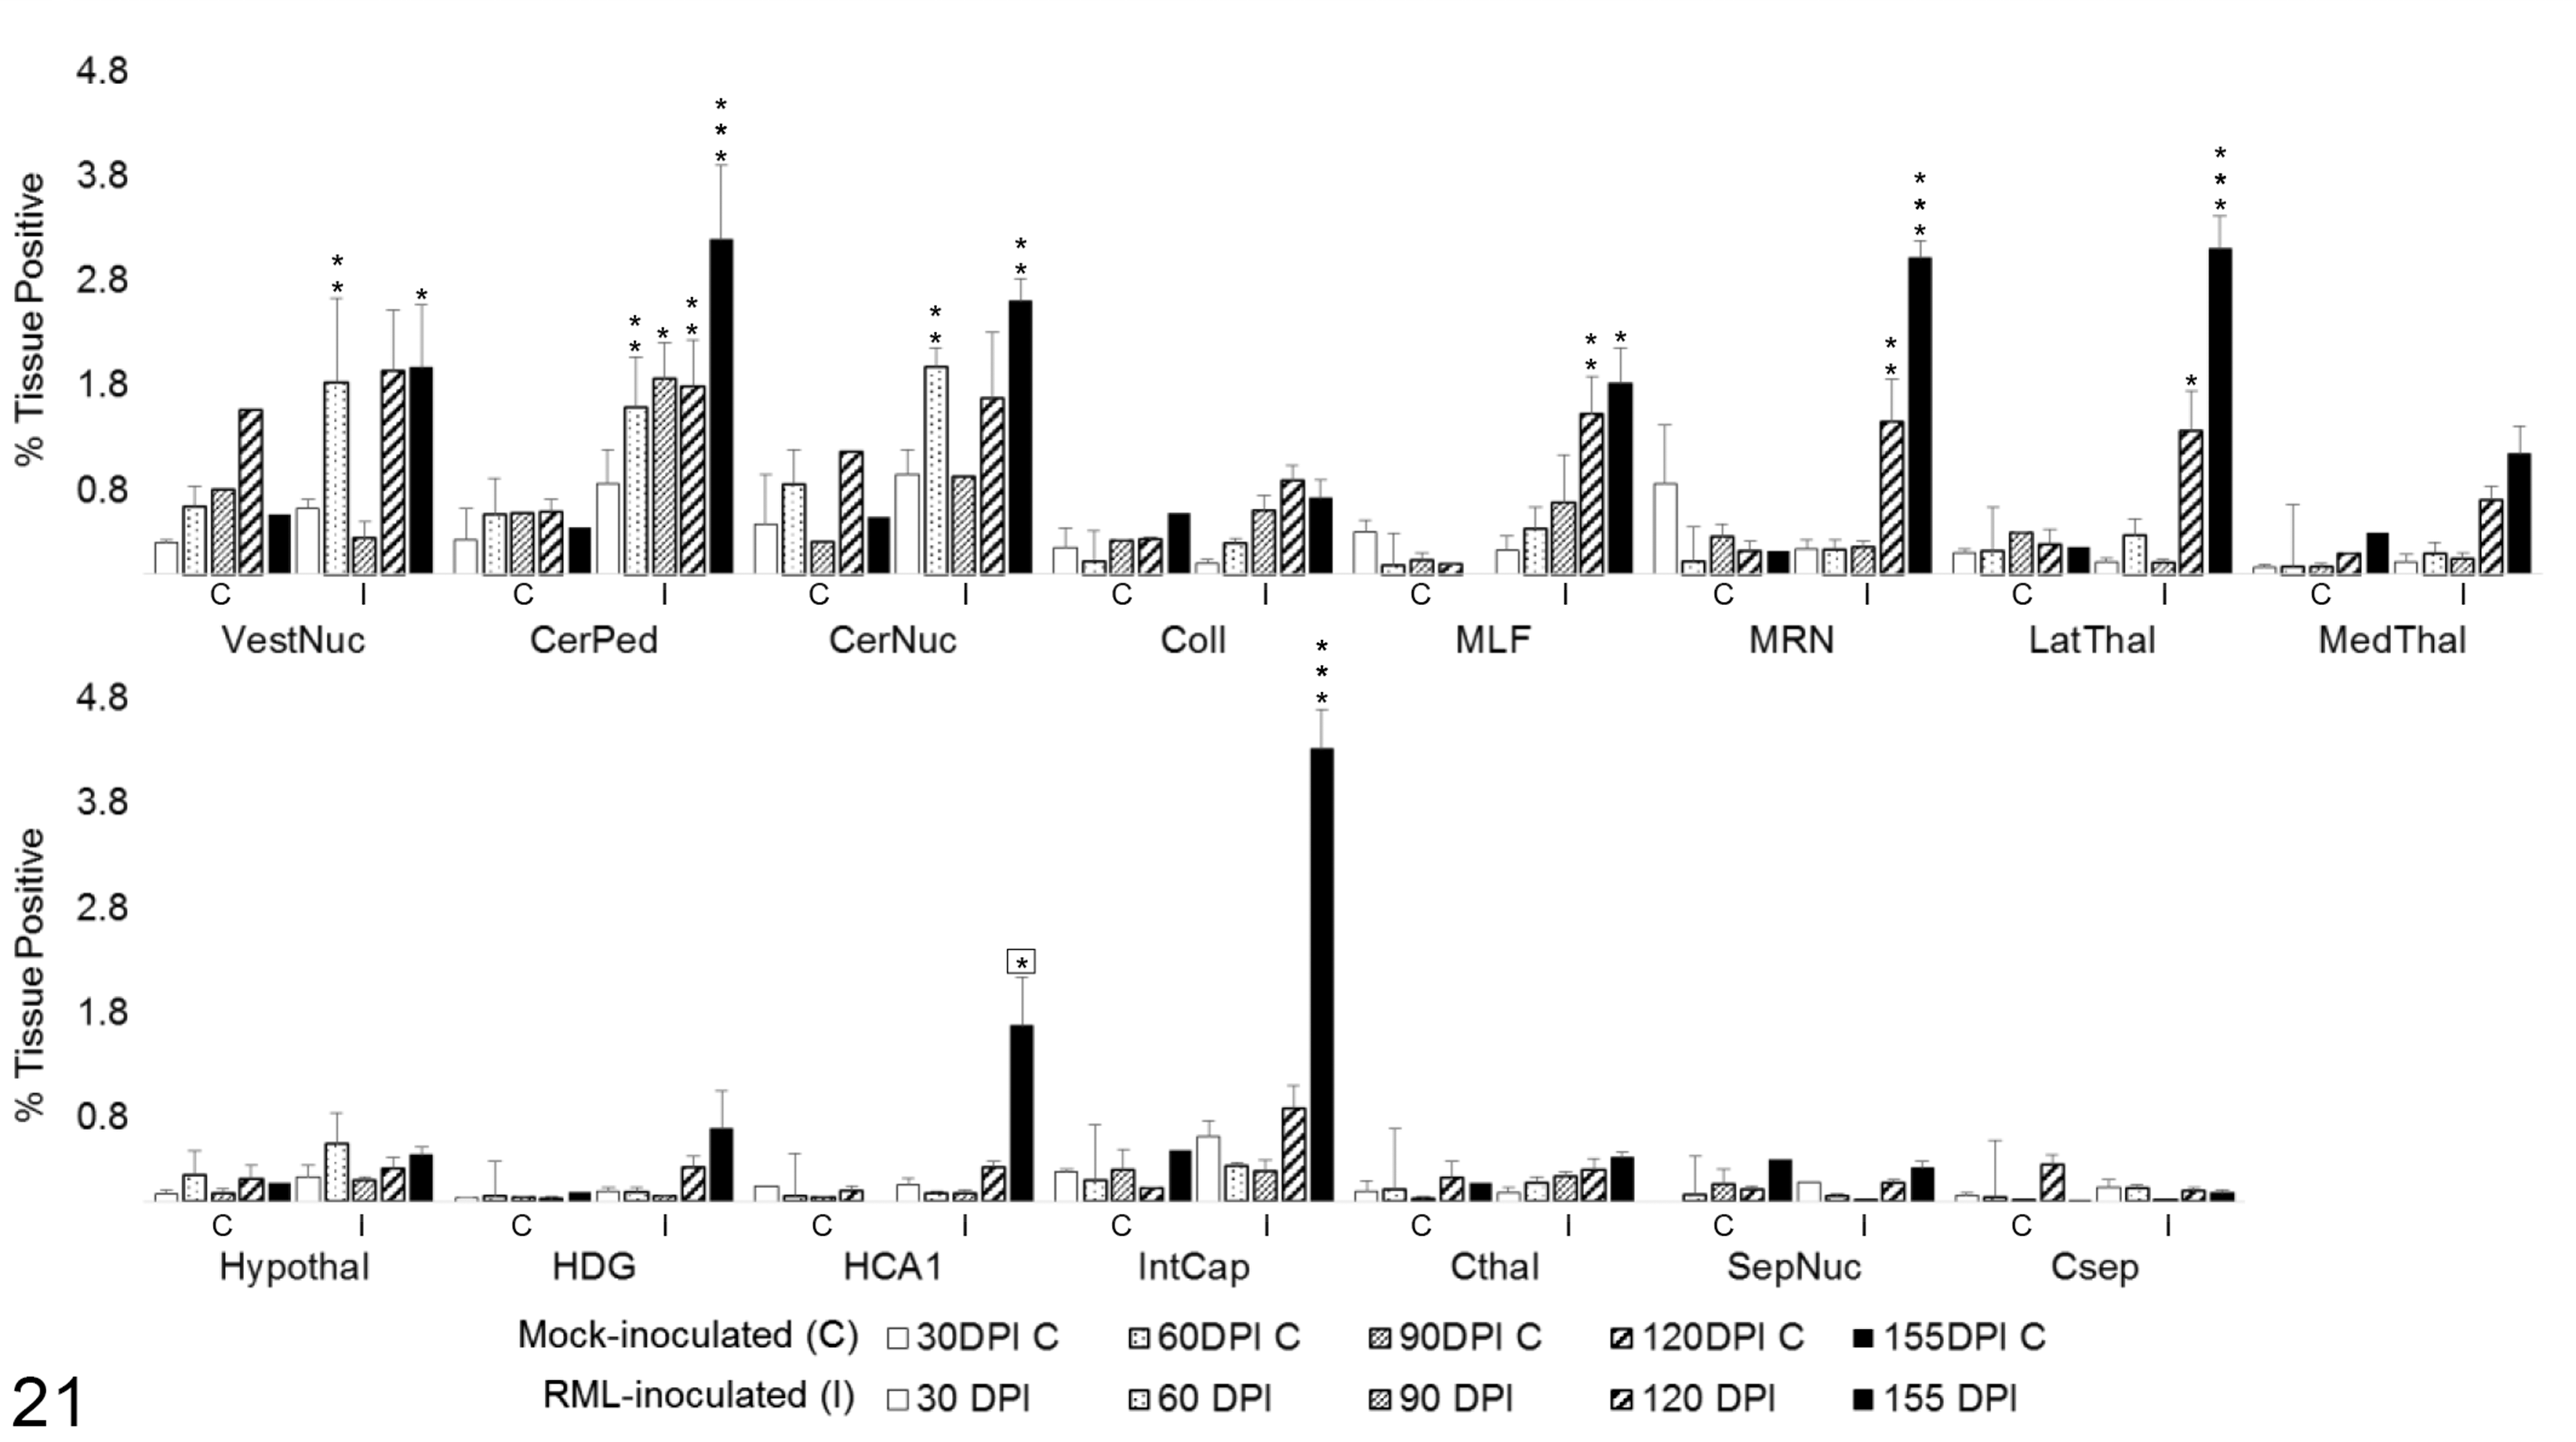
Total iNOS immunoreactivity in 15 brain regions over the time course of Rocky Mountain Laboratory (RML) scrapie infection. Bars represent mean ± SEM values for mock- (C) and RML-inoculated (I) animal cohorts at each sacrifice timepoint. Significant differences compared with mock-inoculated animals: *P < .05. **P < .01. ***P < .001. Significant difference compared to 120 days postinoculation mock-inoculated animals: *P < .05. CerNuc, cerebellar nuclei; CerPed, cerebellar peduncles; Coll, superior colliculus; Csep, cerebral cortex at level of septal nuclei; Cthal, cerebral cortex at level of thalamus; HCA1, CA1 of hippocampus; HDG, dentate gyrus of hippocampus; Hypothal, hypothalamus; IntCap, internal capsule; LatThal, lateral thalamus; MedThal, medial thalamus; MLF, medial longitudinal fasciculus; MRN, midbrain reticular nucleus; SepNuc, septal nuclei; VestNuc, vestibular nuclei.
To determine the degree of microglial and astrocytic expression of iNOS, colocalization of iNOS with Iba1 and GFAP was quantified (Fig. 22). iNOS colocalized primarily with microglial Iba1 (Fig. 23). A significant increase in colocalization of Iba1 with iNOS was first observed at 120 DPI in the vestibular nuclei (P < .05), MLF (P < .001), MRN (P < .001), and internal capsule (P < .01). By 155 DPI, microglial iNOS was upregulated in 8 of 15 brain regions, including the vestibular nuclei (P < .001), cerebellar peduncles (P < .001), cerebellar nuclei (P < .001), MLF (P < .001), MRN (P < .001), lateral thalamus (P < .001), and medial thalamus (P < .05). A significant increase in colocalization of iNOS and GFAP was present only at 155 DPI in the white matter tracts of the cerebellar peduncles (P < .001) and the internal capsule (P < .001), with a modest elevation in HCA1 (P < .01). A transient increase was observed at 120 DPI in the lateral thalamus (P < .05; Fig. 24). iNOS immunoreactivity that did not colocalize with either Iba1 or GFAP was primarily observed along vascular endothelium and forming halos around small nuclei of uncertain cellular identity.
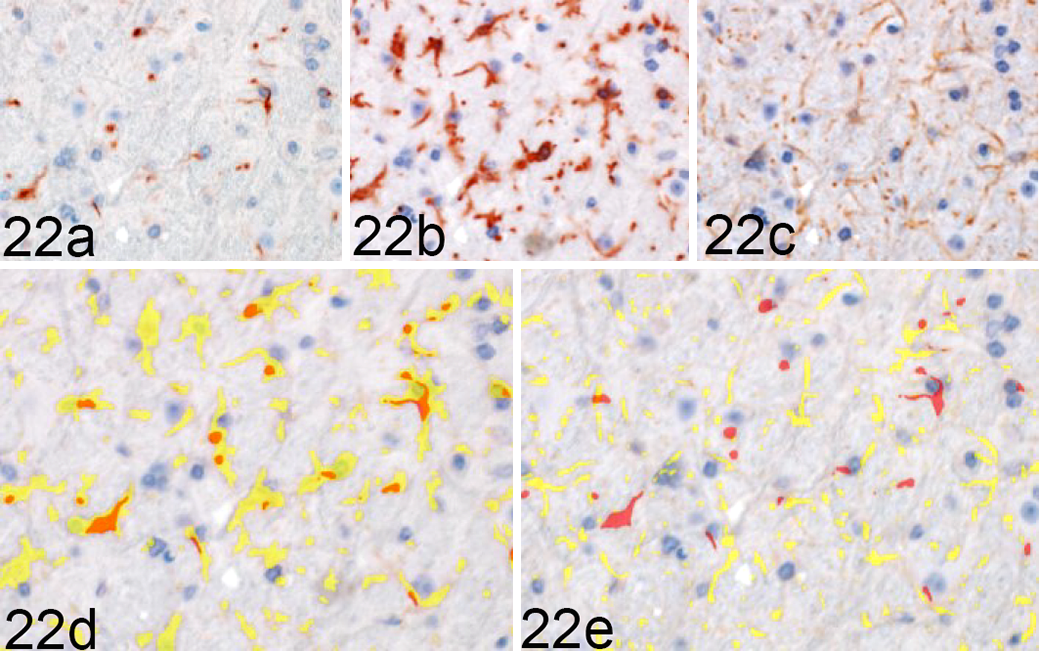
Rocky Mountain Laboratory (RML) scrapie infection, midbrain reticular nucleus, mouse. iNOS colocalization with Iba1 and GFAP in a clinical RML-infected mouse, representative image. Sequential immunohistochemical (IHC) labeling for (a) iNOS, (b) Iba1, and (c) GFAP was performed on the same section of brain. (d) Red = iNOS; yellow = Iba1. (e) GFAP; orange - colocalization of iNOS and glial labeling. iNOS colocalizes with (d) Iba1 but (e) fails to demonstrate overlap with GFAP expression in this section. Sequential IHC for iNOS, Iba1 and GFAP.
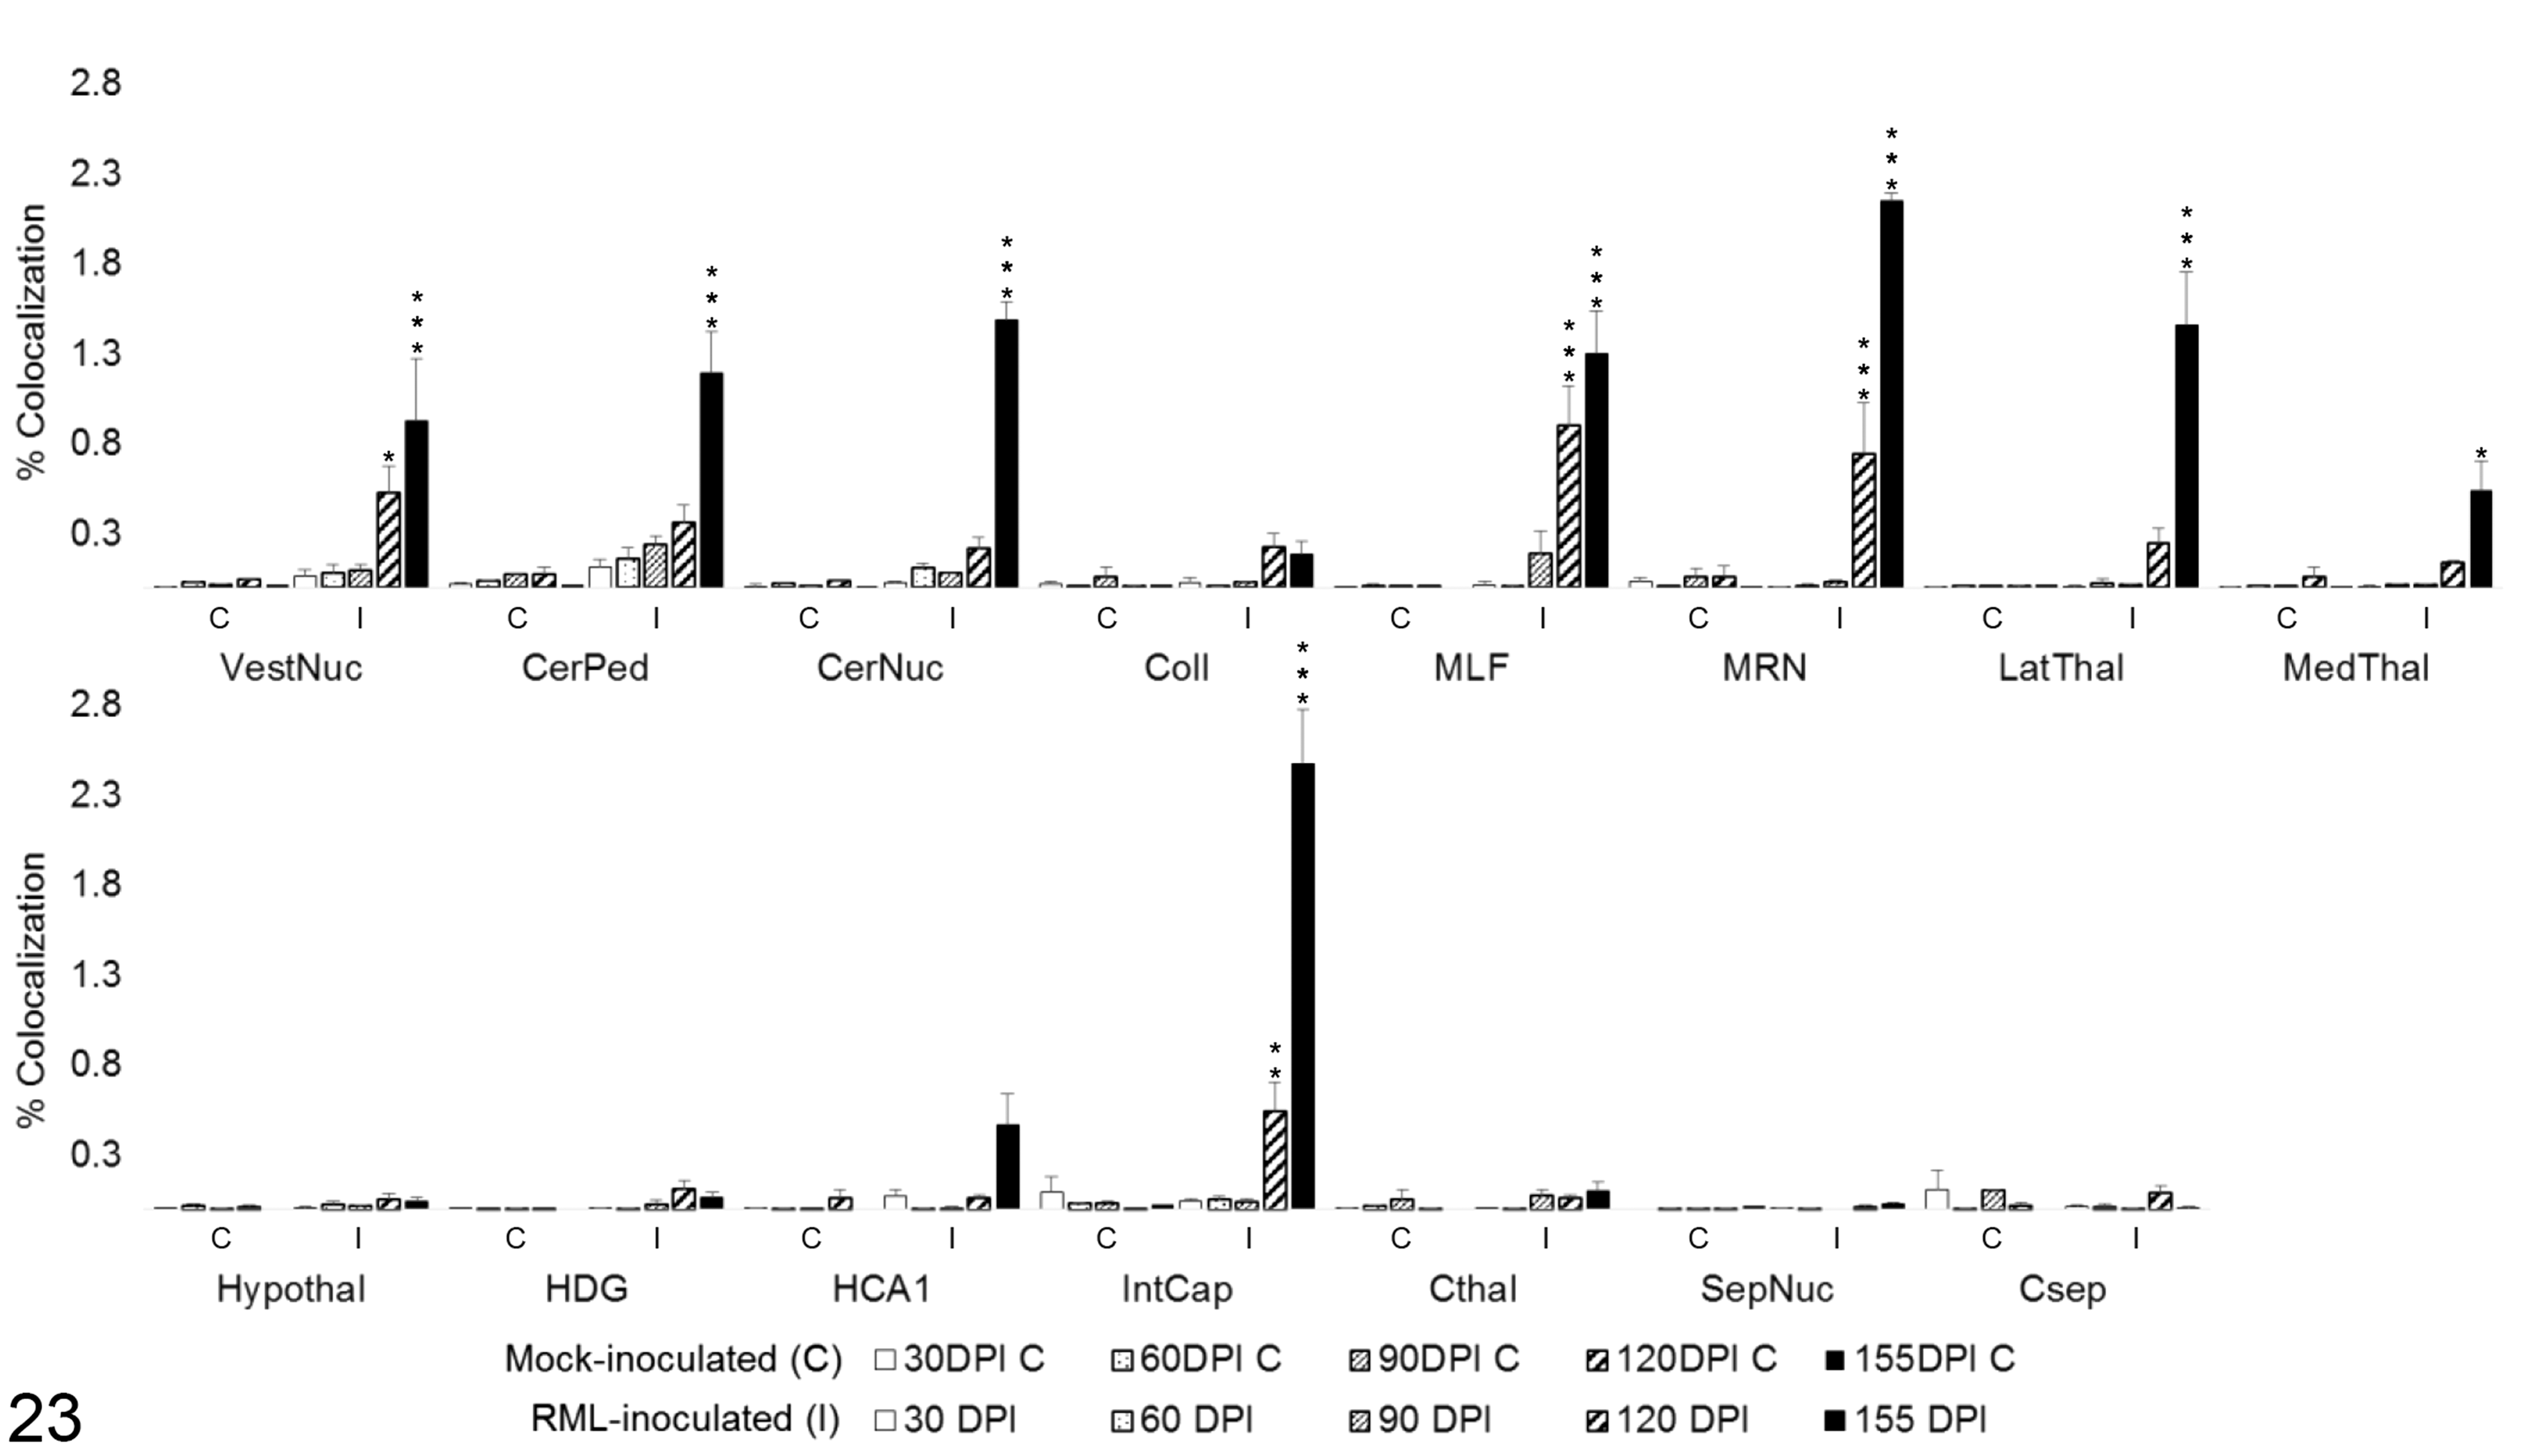
iNOS colocalization with Iba1 in 15 brain regions over the time course of Rocky Mountain Laboratory (RML) scrapie infection. Colocalization was quantified in brain regions as percentage tissue positive for both iNOS and Iba1 immunoreactivity in composite images. Bars represent mean ± SEM values for mock- (C) and RML-inoculated (I) animal cohorts at each sacrifice timepoint. Significant differences compared with mock-inoculated animals: *P < .05. **P < .01. ***P < .001. CerNuc, cerebellar nuclei; CerPed, cerebellar peduncles; Coll, superior colliculus; Csep, cerebral cortex at level of septal nuclei; Cthal, cerebral cortex at level of thalamus; HCA1, CA1 of hippocampus; HDG, dentate gyrus of hippocampus; Hypothal, hypothalamus; IntCap, internal capsule; LatThal, lateral thalamus; MedThal, medial thalamus; MLF, medial longitudinal fasciculus; MRN, midbrain reticular nucleus; SepNuc, septal nuclei; VestNuc, vestibular nuclei.
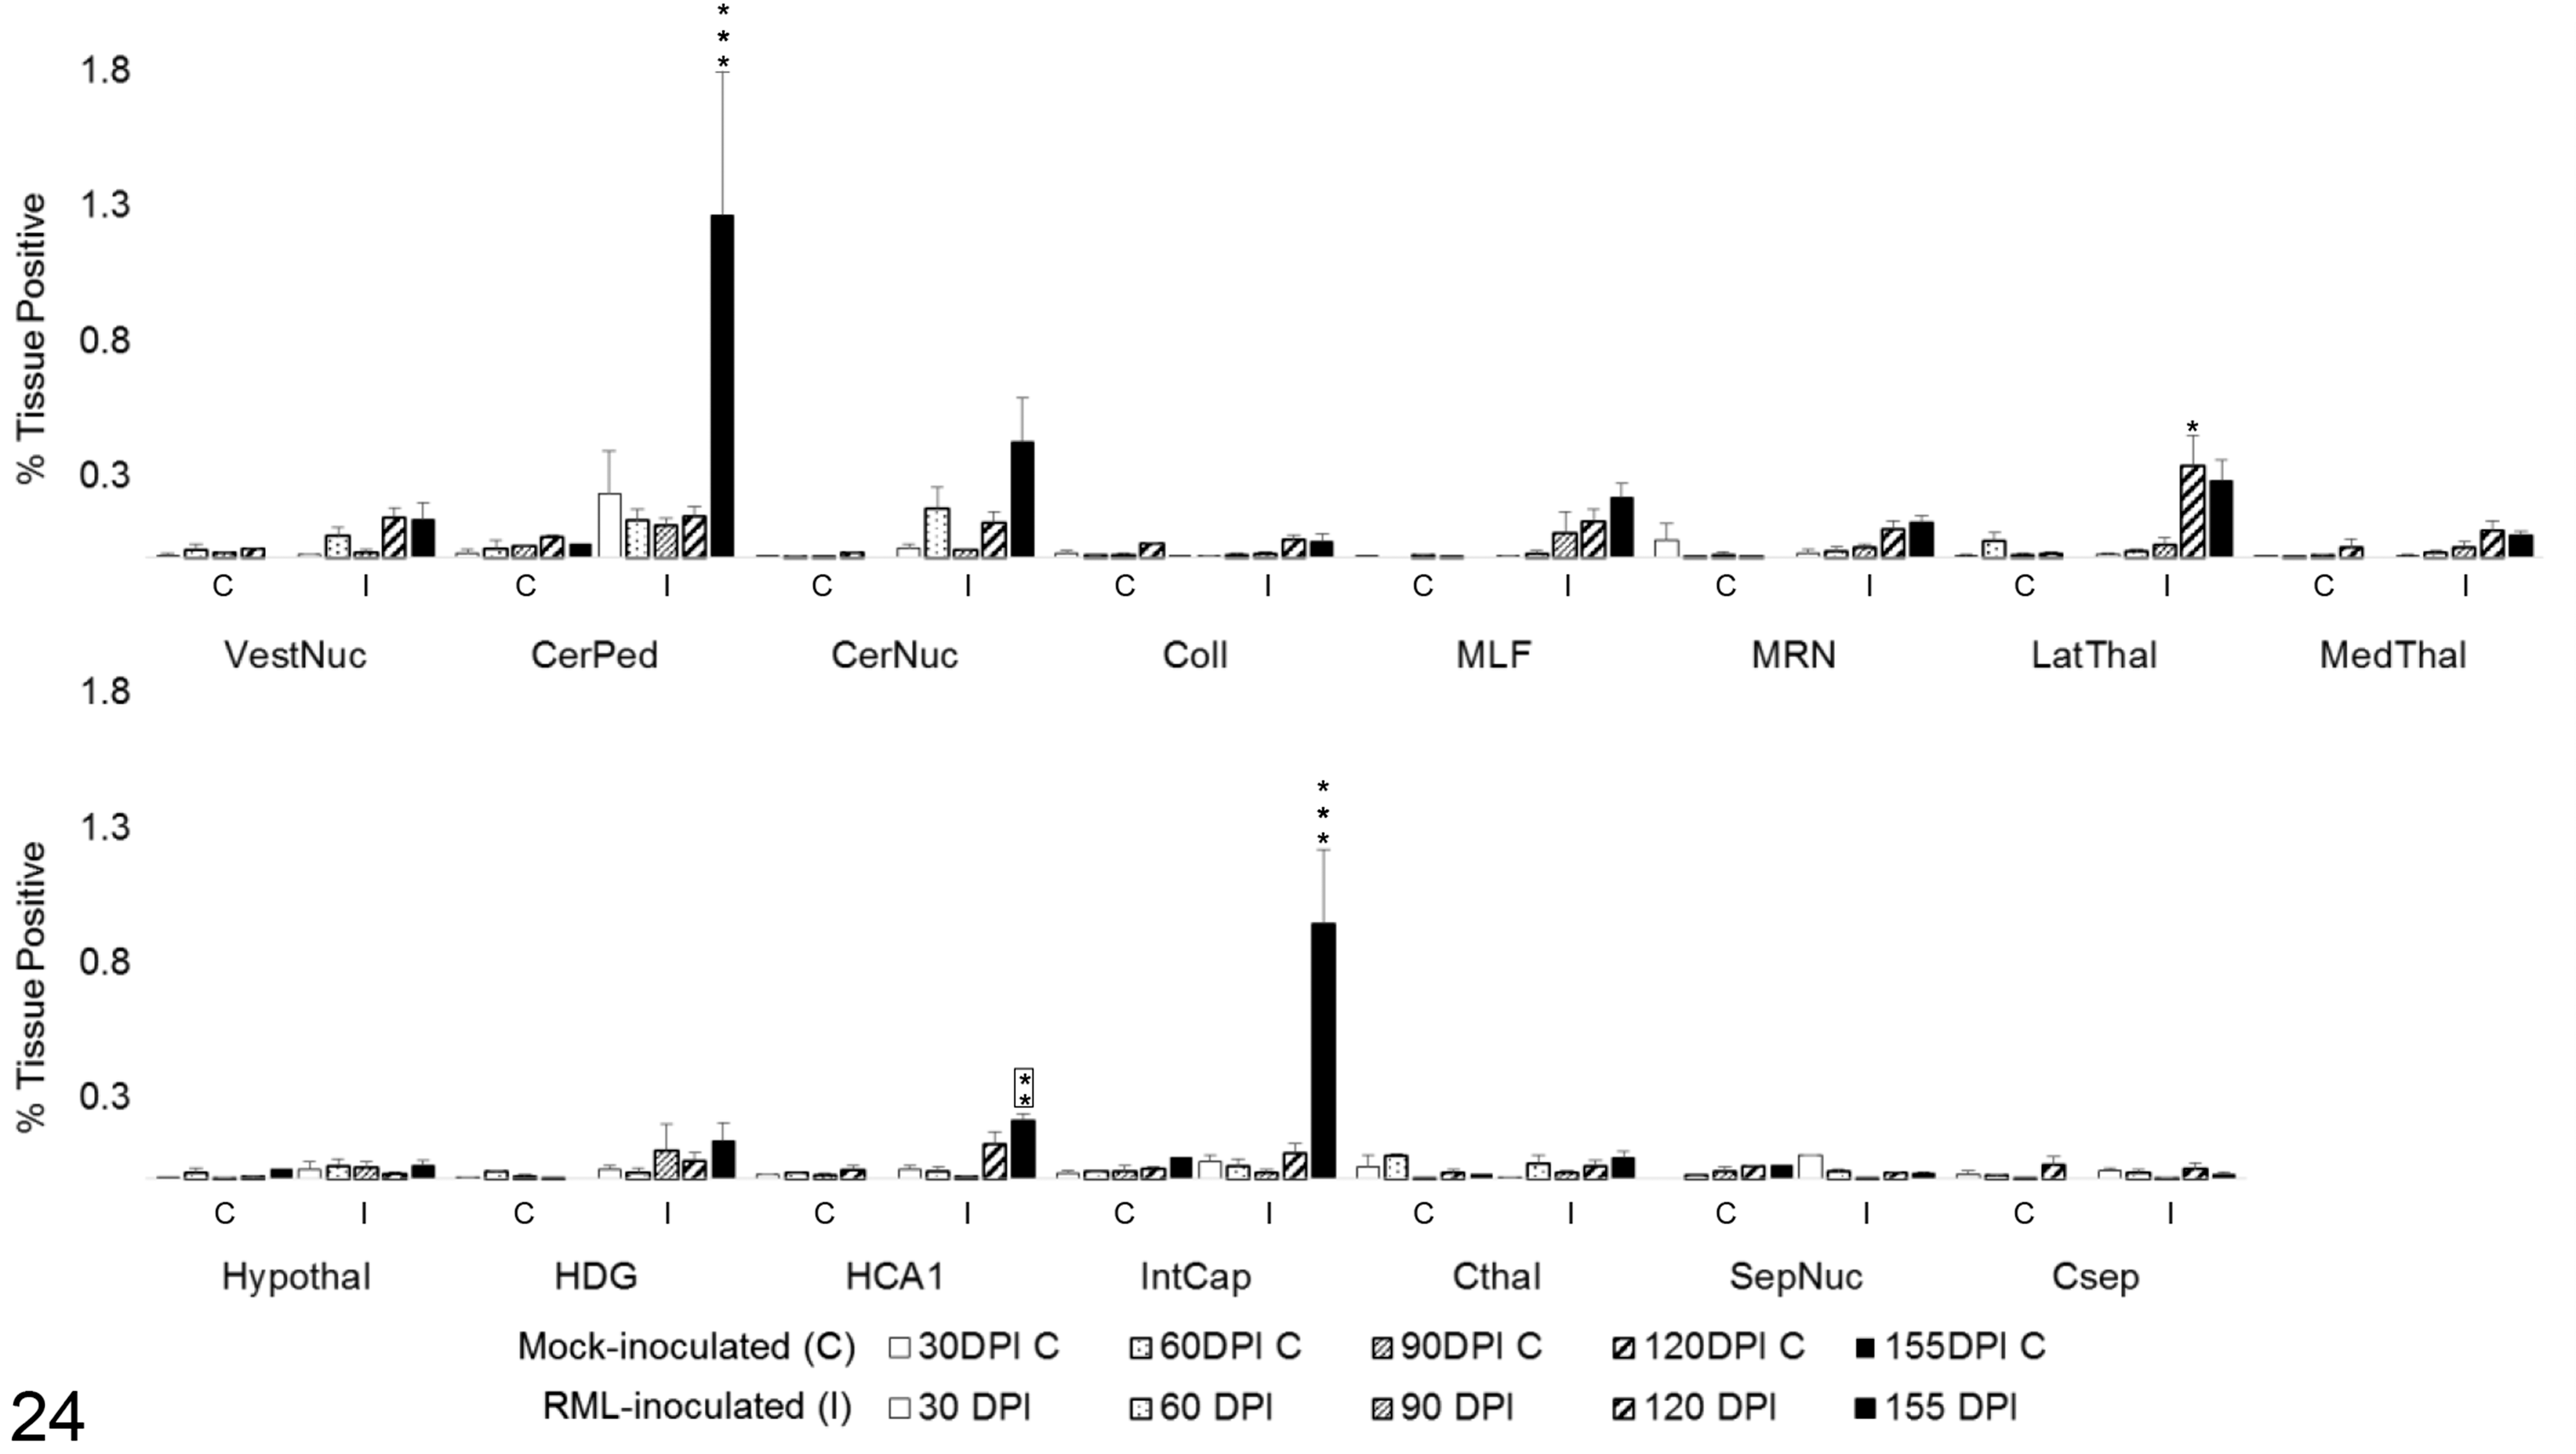
iNOS colocalization with GFAP in 15 brain regions over the time course of Rocky Mountain Laboratory (RML) scrapie infection. Colocalization was quantified in brain regions as percentage tissue positive for both iNOS and GFAP immunoreactivity in composite images. Bars represent mean ± SEM values for mock- (C) and RML-inoculated (I) animal cohorts at each sacrifice timepoint. Significant differences compared with mock-inoculated animals: *P < .05. **P < .01. ***P < .001. Significant difference compared to 120 days postinoculation mock-inoculated animals: **P < .01. CerNuc, cerebellar nuclei; CerPed, cerebellar peduncles; Coll, superior colliculus; Csep, cerebral cortex at level of septal nuclei; Cthal, cerebral cortex at level of thalamus; HCA1, CA1 of hippocampus; HDG, dentate gyrus of hippocampus; Hypothal, hypothalamus; IntCap, internal capsule; LatThal, lateral thalamus; MedThal, medial thalamus; MLF, medial longitudinal fasciculus; MRN, midbrain reticular nucleus; SepNuc, septal nuclei; VestNuc, vestibular nuclei.
Total Arg1 expression demonstrated no statistically significant change over time in the majority (13/15) of evaluated brain regions (Fig. 25). Vestibular nuclei displayed increased Arg1 immunoreactivity over controls at 30 DPI (P < .05). A significant decrease in Arg1 was detected in this region at 120 DPI (P < .001); however, this was likely due to one outlying control value that contained a concentration of strongly Arg1-immunoreactive neurons. Cerebellar nuclei displayed a similar transient increase in Arg1 expression at 30 DPI (P < .05) and another significant increase at 155 DPI (P < .001).
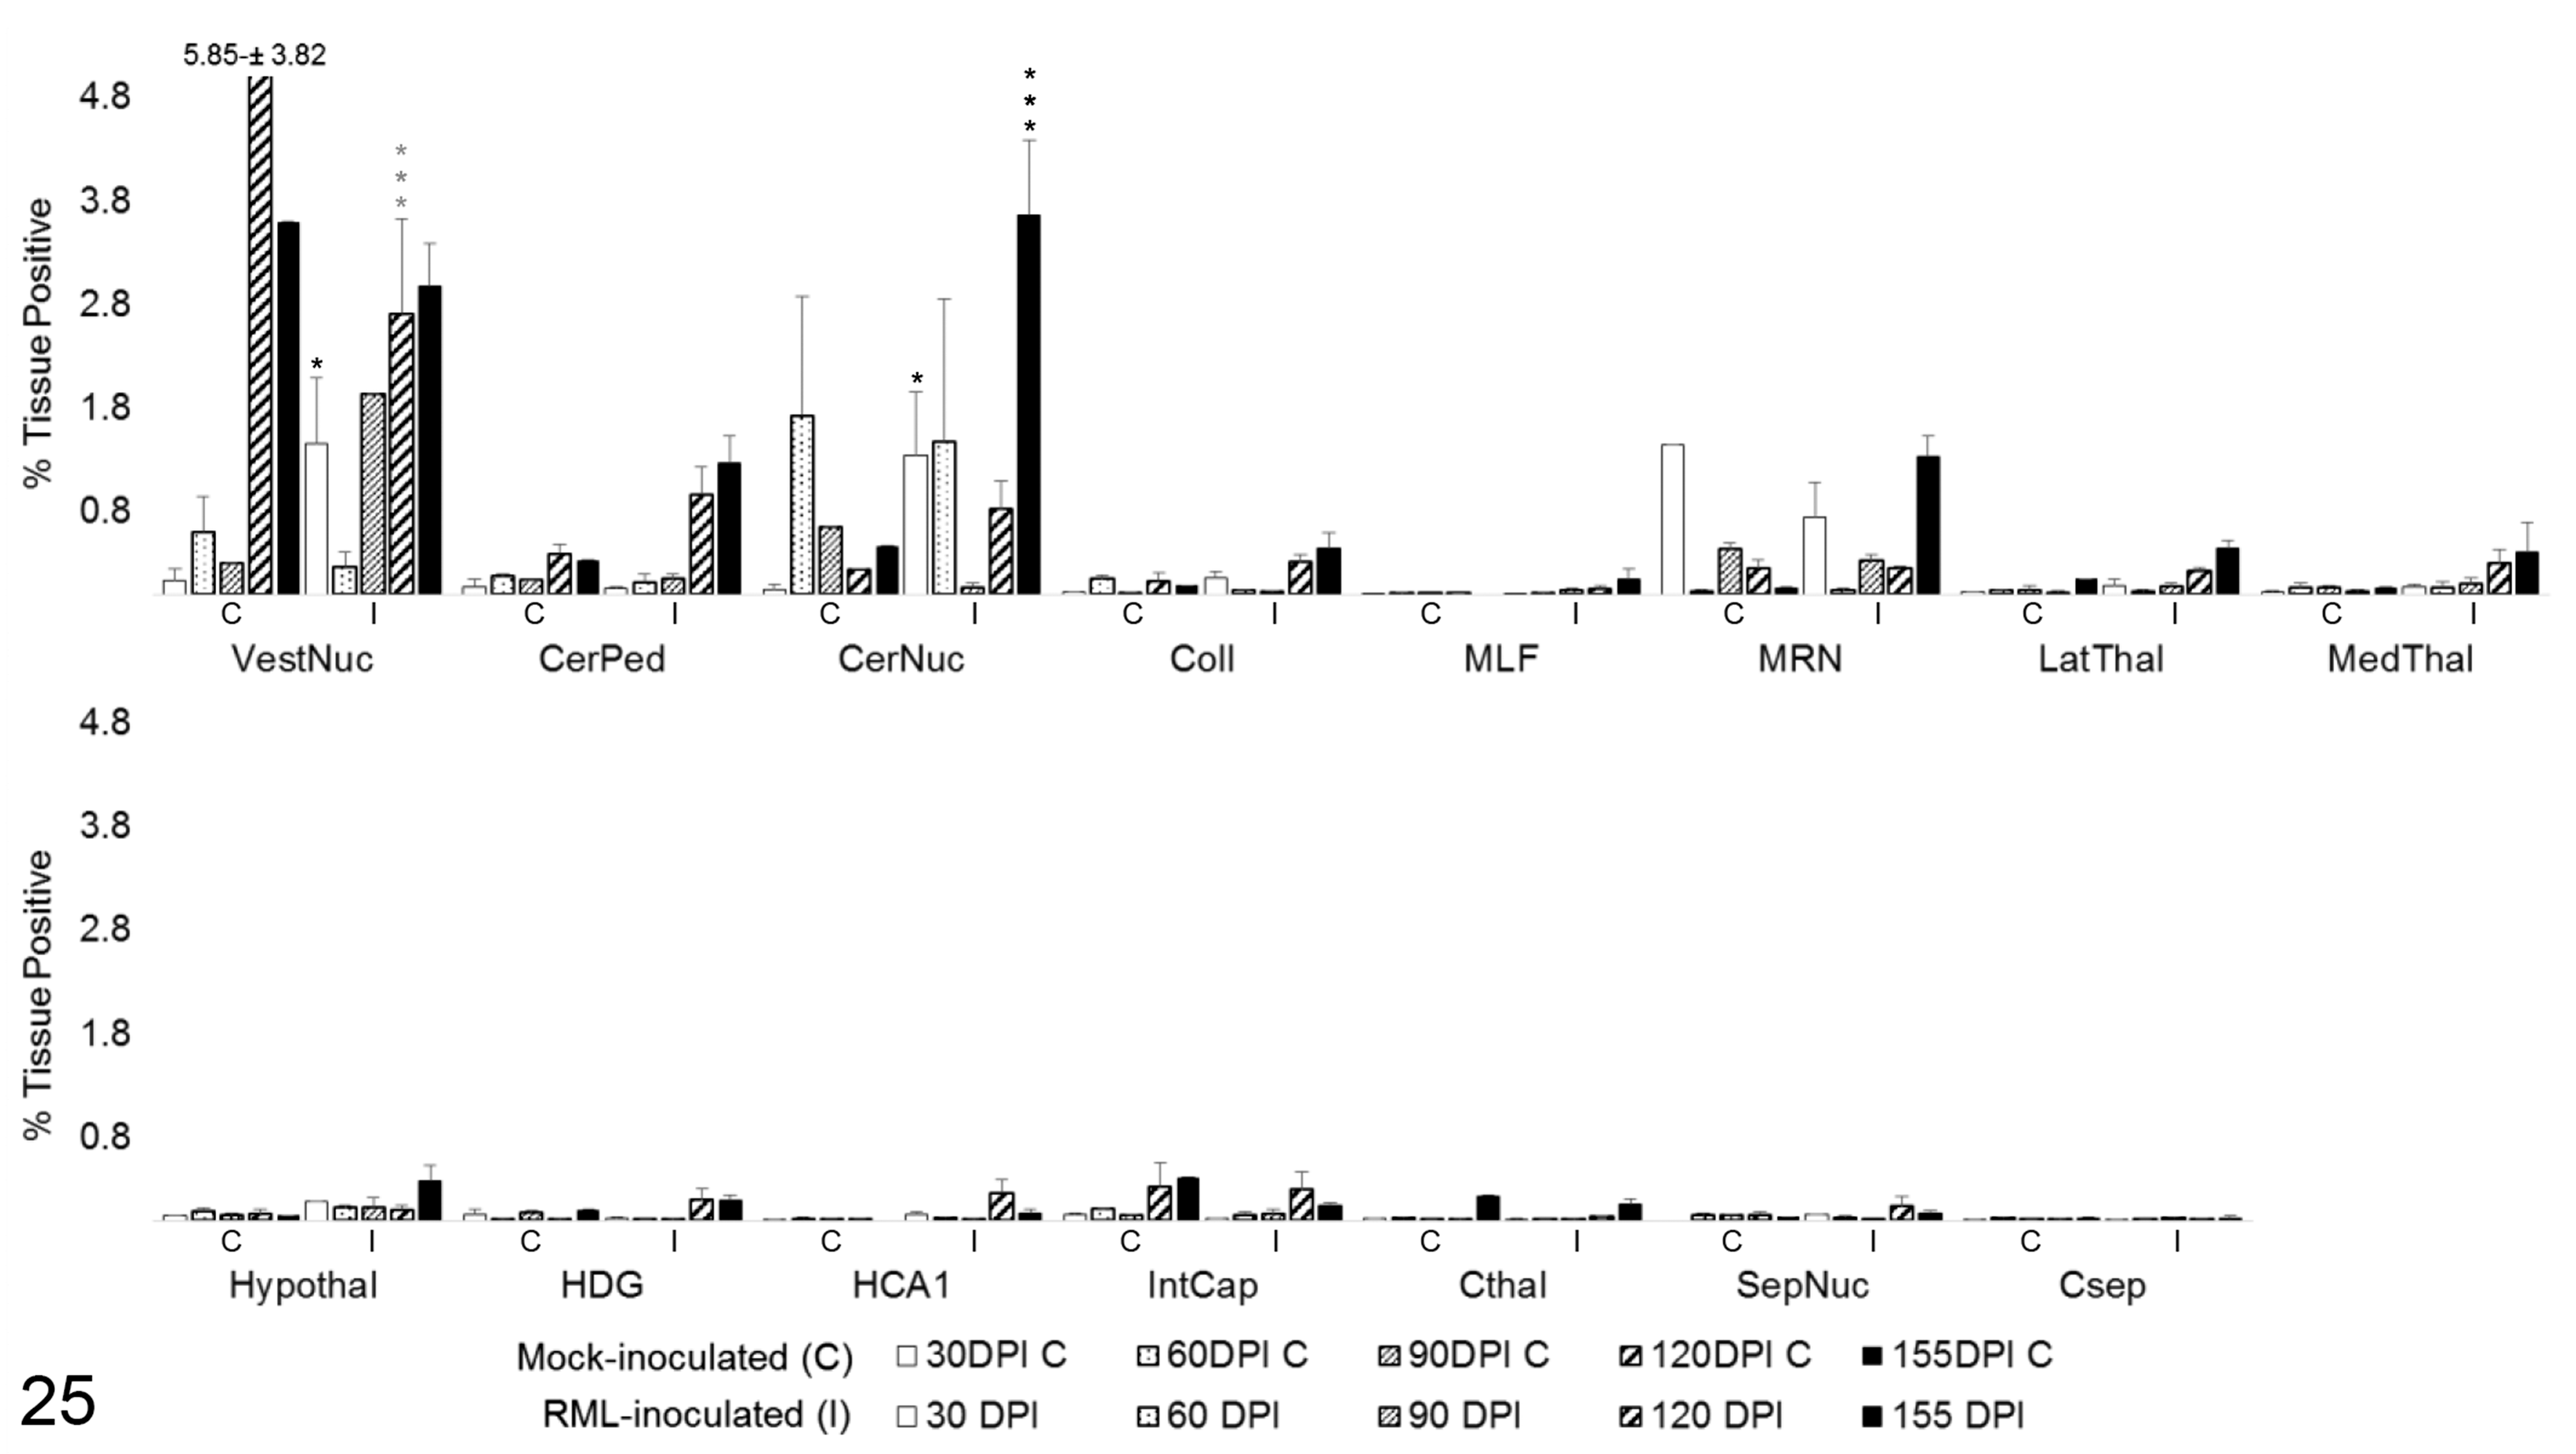
Total Arg1 immunoreactivity in 15 brain regions over the time course of Rocky Mountain Laboratory (RML) scrapie infection. Bars represent mean ± SEM values for mock- (C) and RML-inoculated (I) animal cohorts at each sacrifice timepoint. Significant differences compared with mock-inoculated animals: *P < .05. **P < .01. ***P < .001. Grey***P < .001 represents negative difference between C and I means due to outlier in control brains. CerNuc, cerebellar nuclei; CerPed, cerebellar peduncles; Coll, superior colliculus; Csep, cerebral cortex at level of septal nuclei; Cthal, cerebral cortex at level of thalamus; HCA1, CA1 of hippocampus; HDG, dentate gyrus of hippocampus; Hypothal, hypothalamus; IntCap, internal capsule; LatThal, lateral thalamus; MedThal, medial thalamus; MLF, medial longitudinal fasciculus; MRN, midbrain reticular nucleus; SepNuc, septal nuclei; VestNuc, vestibular nuclei.
To determine the degree of microglial and astrocytic expression of Arg1, colocalization of Arg1 with Iba1 and GFAP was quantified. In areas of highest Arg1 expression, such as the medulla oblongata and cerebellum, neuronal and vascular Arg1 expression accounted for the majority of immunoreactivity (Fig. 26). Overall, the amount of glial Arg1 expression was low, but Arg1 colocalized to a greater extent with astrocytic GFAP than microglial Iba1. Low quantities of Arg1 colocalization with Iba1 were detected at significant levels over controls in the vestibular nuclei at 90 (P < .01) and 120 DPI (P < .05; Fig. 28). A similar increase in Iba1-colocalized Arg1 at 120 DPI (P < .05) with concurrent increases in mock-inoculated and clinical animals at 155 DPI was observed in the cerebellar peduncles. Iba1-colocalized Arg1 expression was significantly increased at 120 (P < .05) and 155 DPI (P < .001) in the cerebellar nuclei. Microglial Iba1 colocalization represented a fraction of total glial Arg1. At such low levels of quantified coreactivity, incidental overlap (eg, overlap of neuronal cytoplasm and microglial process) could be a confounding factor for meaningful interpretation. GFAP colocalization with Arg1 represented the majority of glial coimmunoreactivity (Fig. 27). A significant increase in astrocytic expression of Arg1, beginning at 120 DPI and sustained through clinical disease, was observed in the vestibular nuclei (P < .01), cerebellar peduncles (P < .05), and cerebellar nuclei (P < .05; Fig. 29). Astrocytic Arg1 was transiently upregulated at 120 DPI in the medial thalamus (P < .01), dentate gyrus (P < .05), and CA1 (P < .01). Although trends toward sustained upregulation of astrocytic Arg1 at 120 DPI were observed in the colliculus and MRN and suggestions of a transient elevation at 120 DPI were present in the lateral thalamus, internal capsule, and septal nuclei, the quantified signal did not achieve statistical significance over mock-inoculated controls.
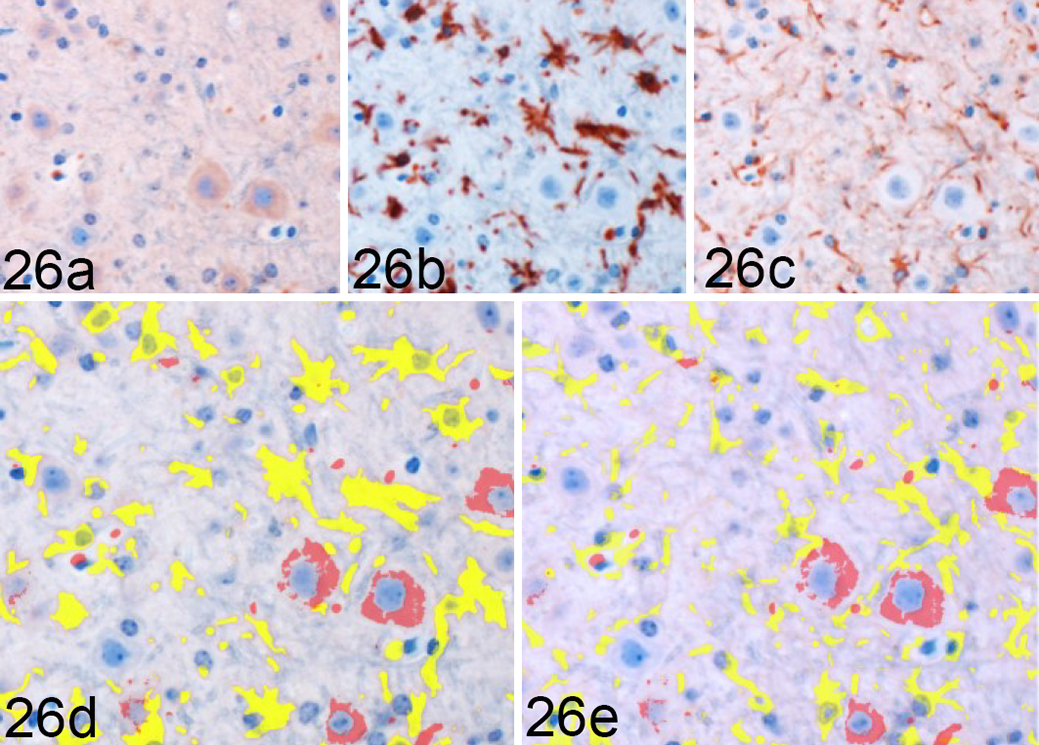
Rocky Mountain Laboratory (RML) scrapie infection, vestibular nucleus, mouse. Arg1 colocalization with Iba1 and GFAP in the vestibular nucleus from a clinical RML-infected mouse, representative image. Sequential immunohistochemical (IHC) labeling for (a) Arg1, (b) Iba1, and (c) GFAP was performed on the same section of RML-infected murine brain. Red = Arg1 labeling. Yellow = glial cytoplasmic protein labeling, (d) Iba1 and (e) GFAP. Orange = colocalization of Arg1 and glial labeling. Arg1 is largely expressed in neuronal cytoplasm and fails to demonstrate significant overlap with either (d) Iba1 or (e) GFAP labeling in this section. Sequential IHC for Arg1, Iba1, and GFAP.
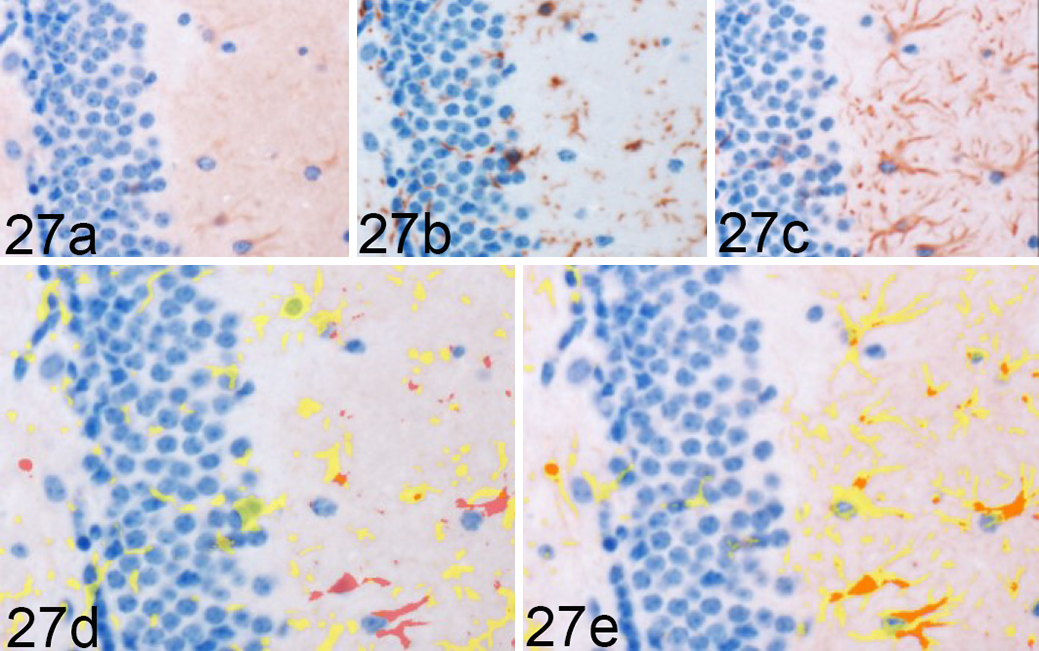
Rocky Mountain Laboratory (RML) scrapie infection, CA1 region of hippocampus, mouse. Arg1 colocalization with Iba1 and GFAP in a single hippocampal section from a 120 days postinoculation RML-infected mouse, representative image. Sequential immunohistochemical (IHC) labeling for (a) Arg1, (b) Iba1, and (c) GFAP was performed on the same section of RML-infected murine brain. Red = Arg1 labeling. Yellow = glial cytoplasmic protein labeling, (d) Iba1) and (e) GFAP. Orange = colocalization of Arg1 and glial labeling (here, only in e). Here, Arg1 fails to demonstrate overlap with (d) Iba1 labeling but displays (e) colocalization with GFAP expression. Sequential IHC for Arg1, Iba1 and GFAP.
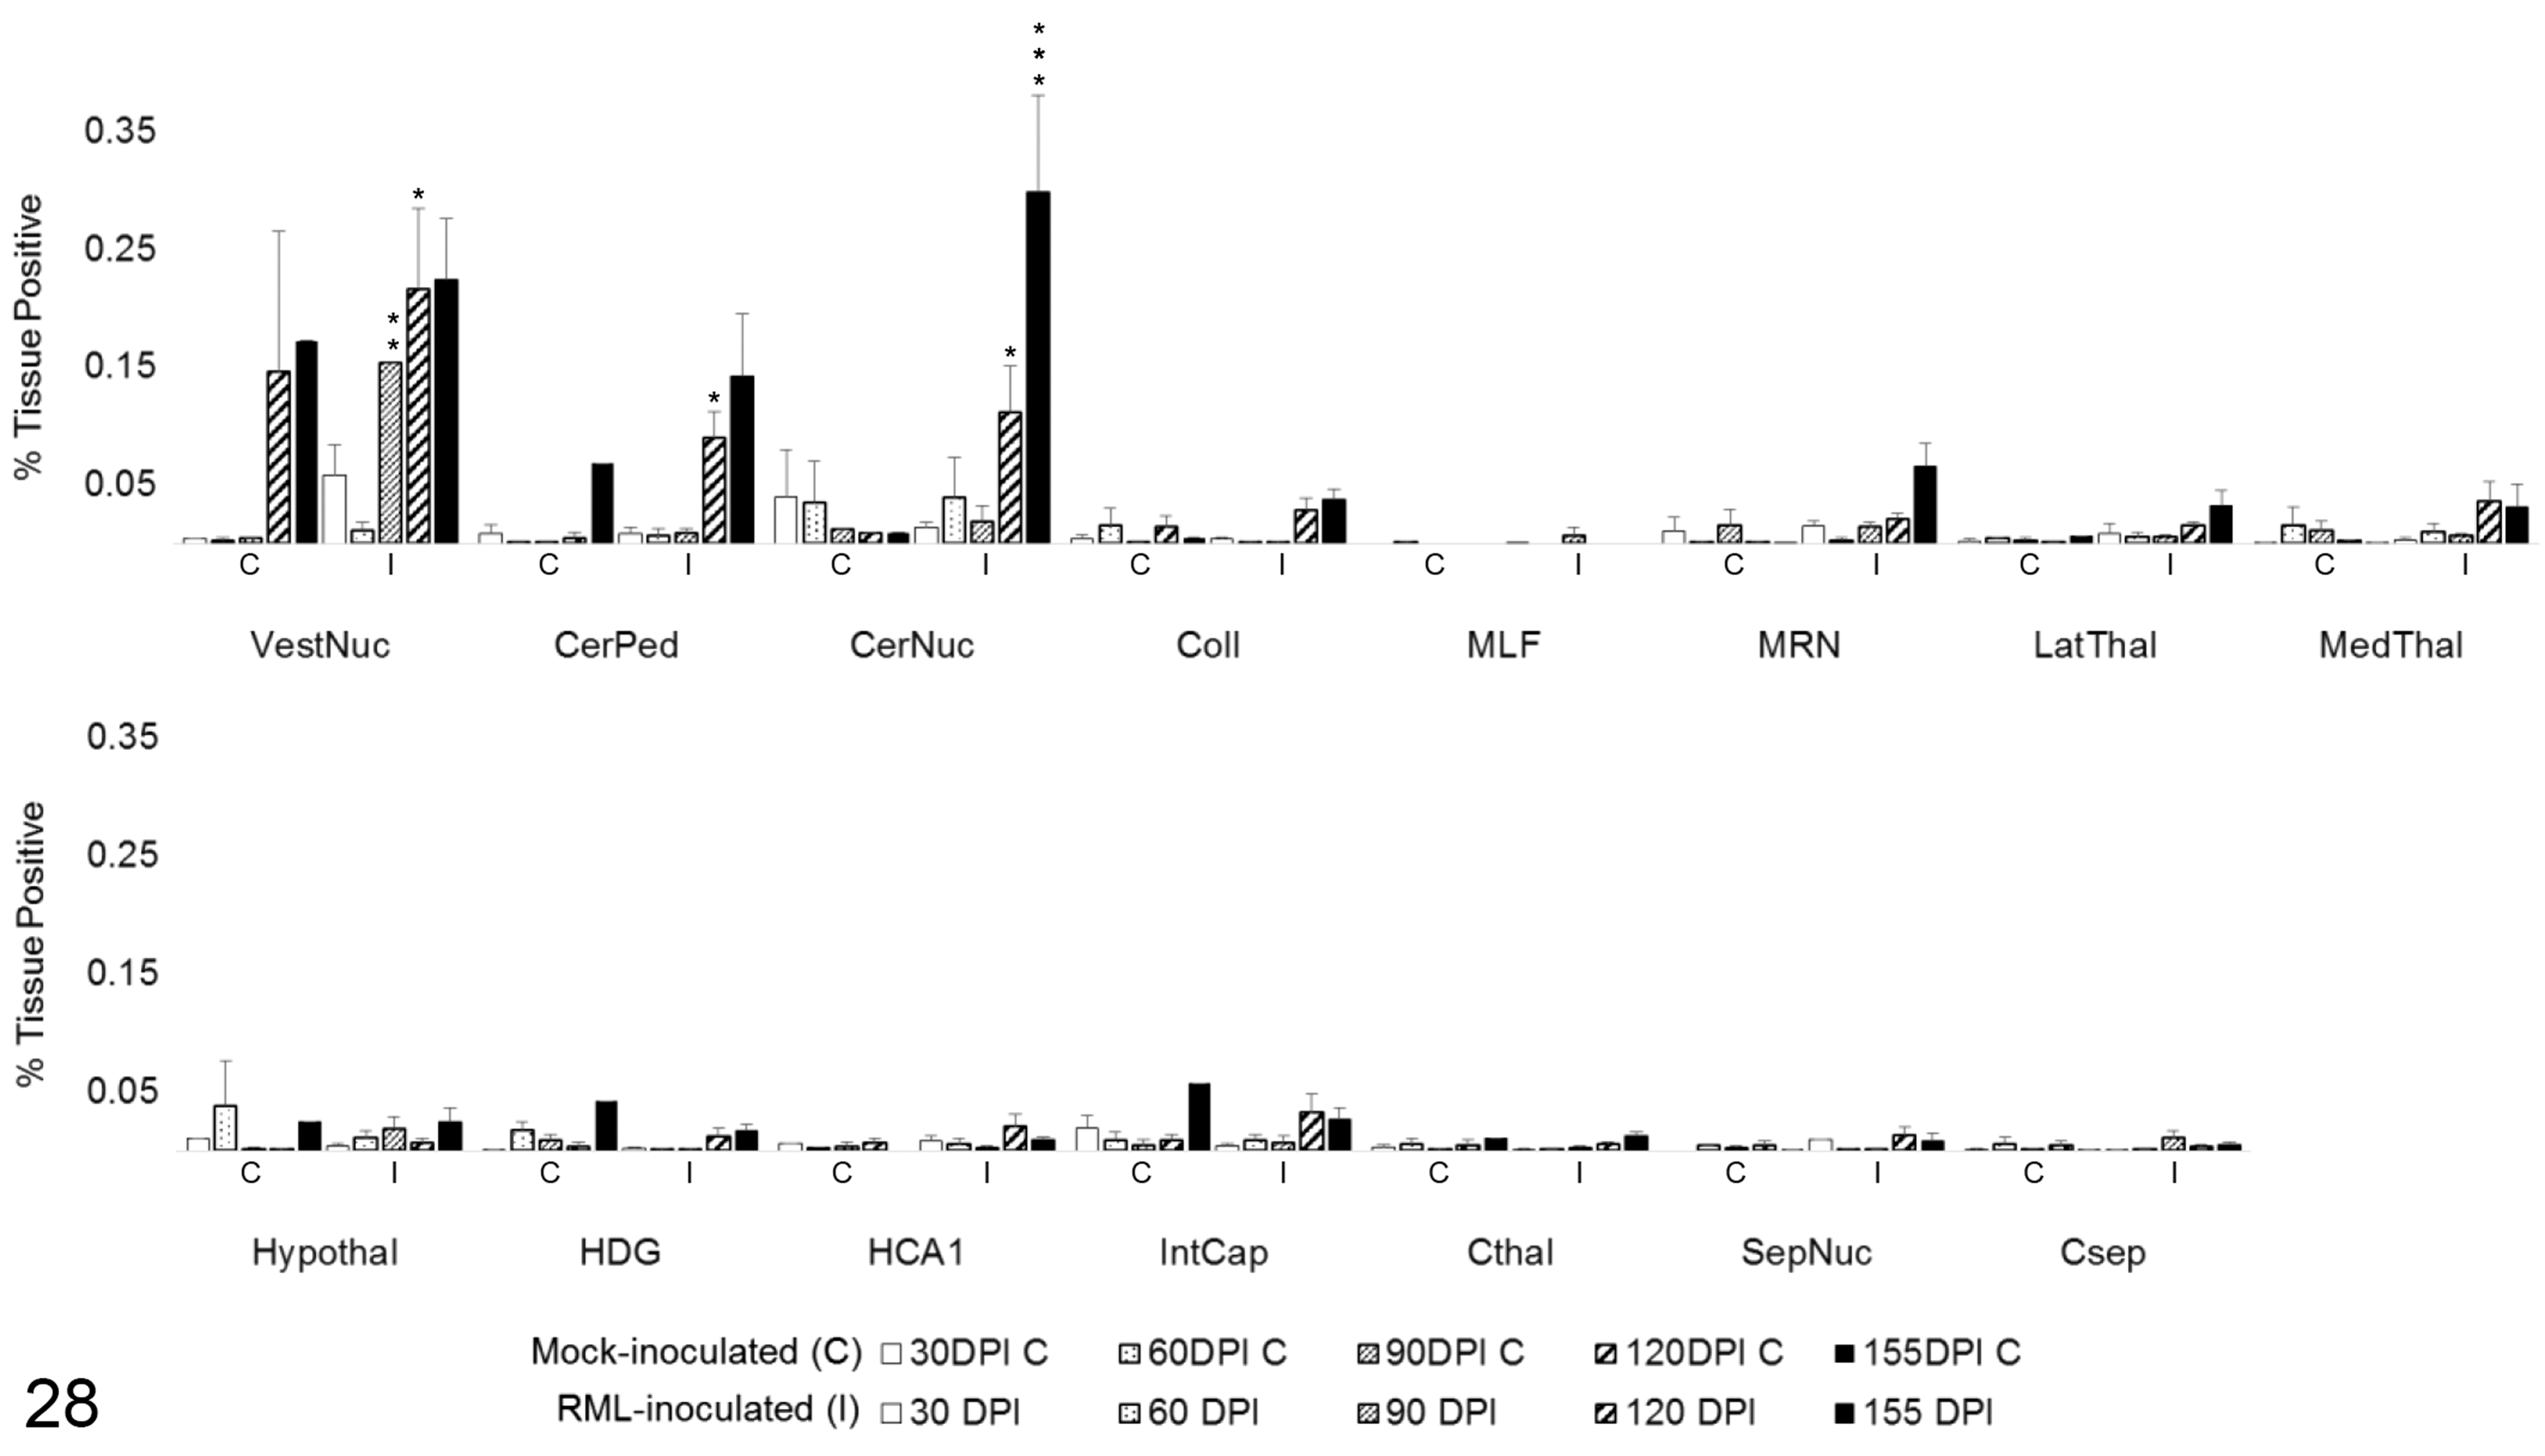
Arg1 colocalization with Iba1 in 15 brain regions over the time course of Rocky Mountain Laboratory (RML) scrapie infection. Colocalization was quantified in brain regions as percentage tissue positive for both Arg1 and Iba1 immunoreactivity in composite images. Bars represent mean ± SEM values for mock- (C) and RML-inoculated (I) animal cohorts at each sacrifice timepoint. Significant differences compared with mock-inoculated animals: *P < .05. **P < .01. ***P < .001. CerNuc, cerebellar nuclei; CerPed, cerebellar peduncles; Coll, superior colliculus; Csep, cerebral cortex at level of septal nuclei; Cthal, cerebral cortex at level of thalamus; HCA1, CA1 of hippocampus; HDG, dentate gyrus of hippocampus; Hypothal, hypothalamus; IntCap, internal capsule; LatThal, lateral thalamus; MedThal, medial thalamus; MLF, medial longitudinal fasciculus; MRN, midbrain reticular nucleus; SepNuc, septal nuclei; VestNuc, vestibular nuclei.
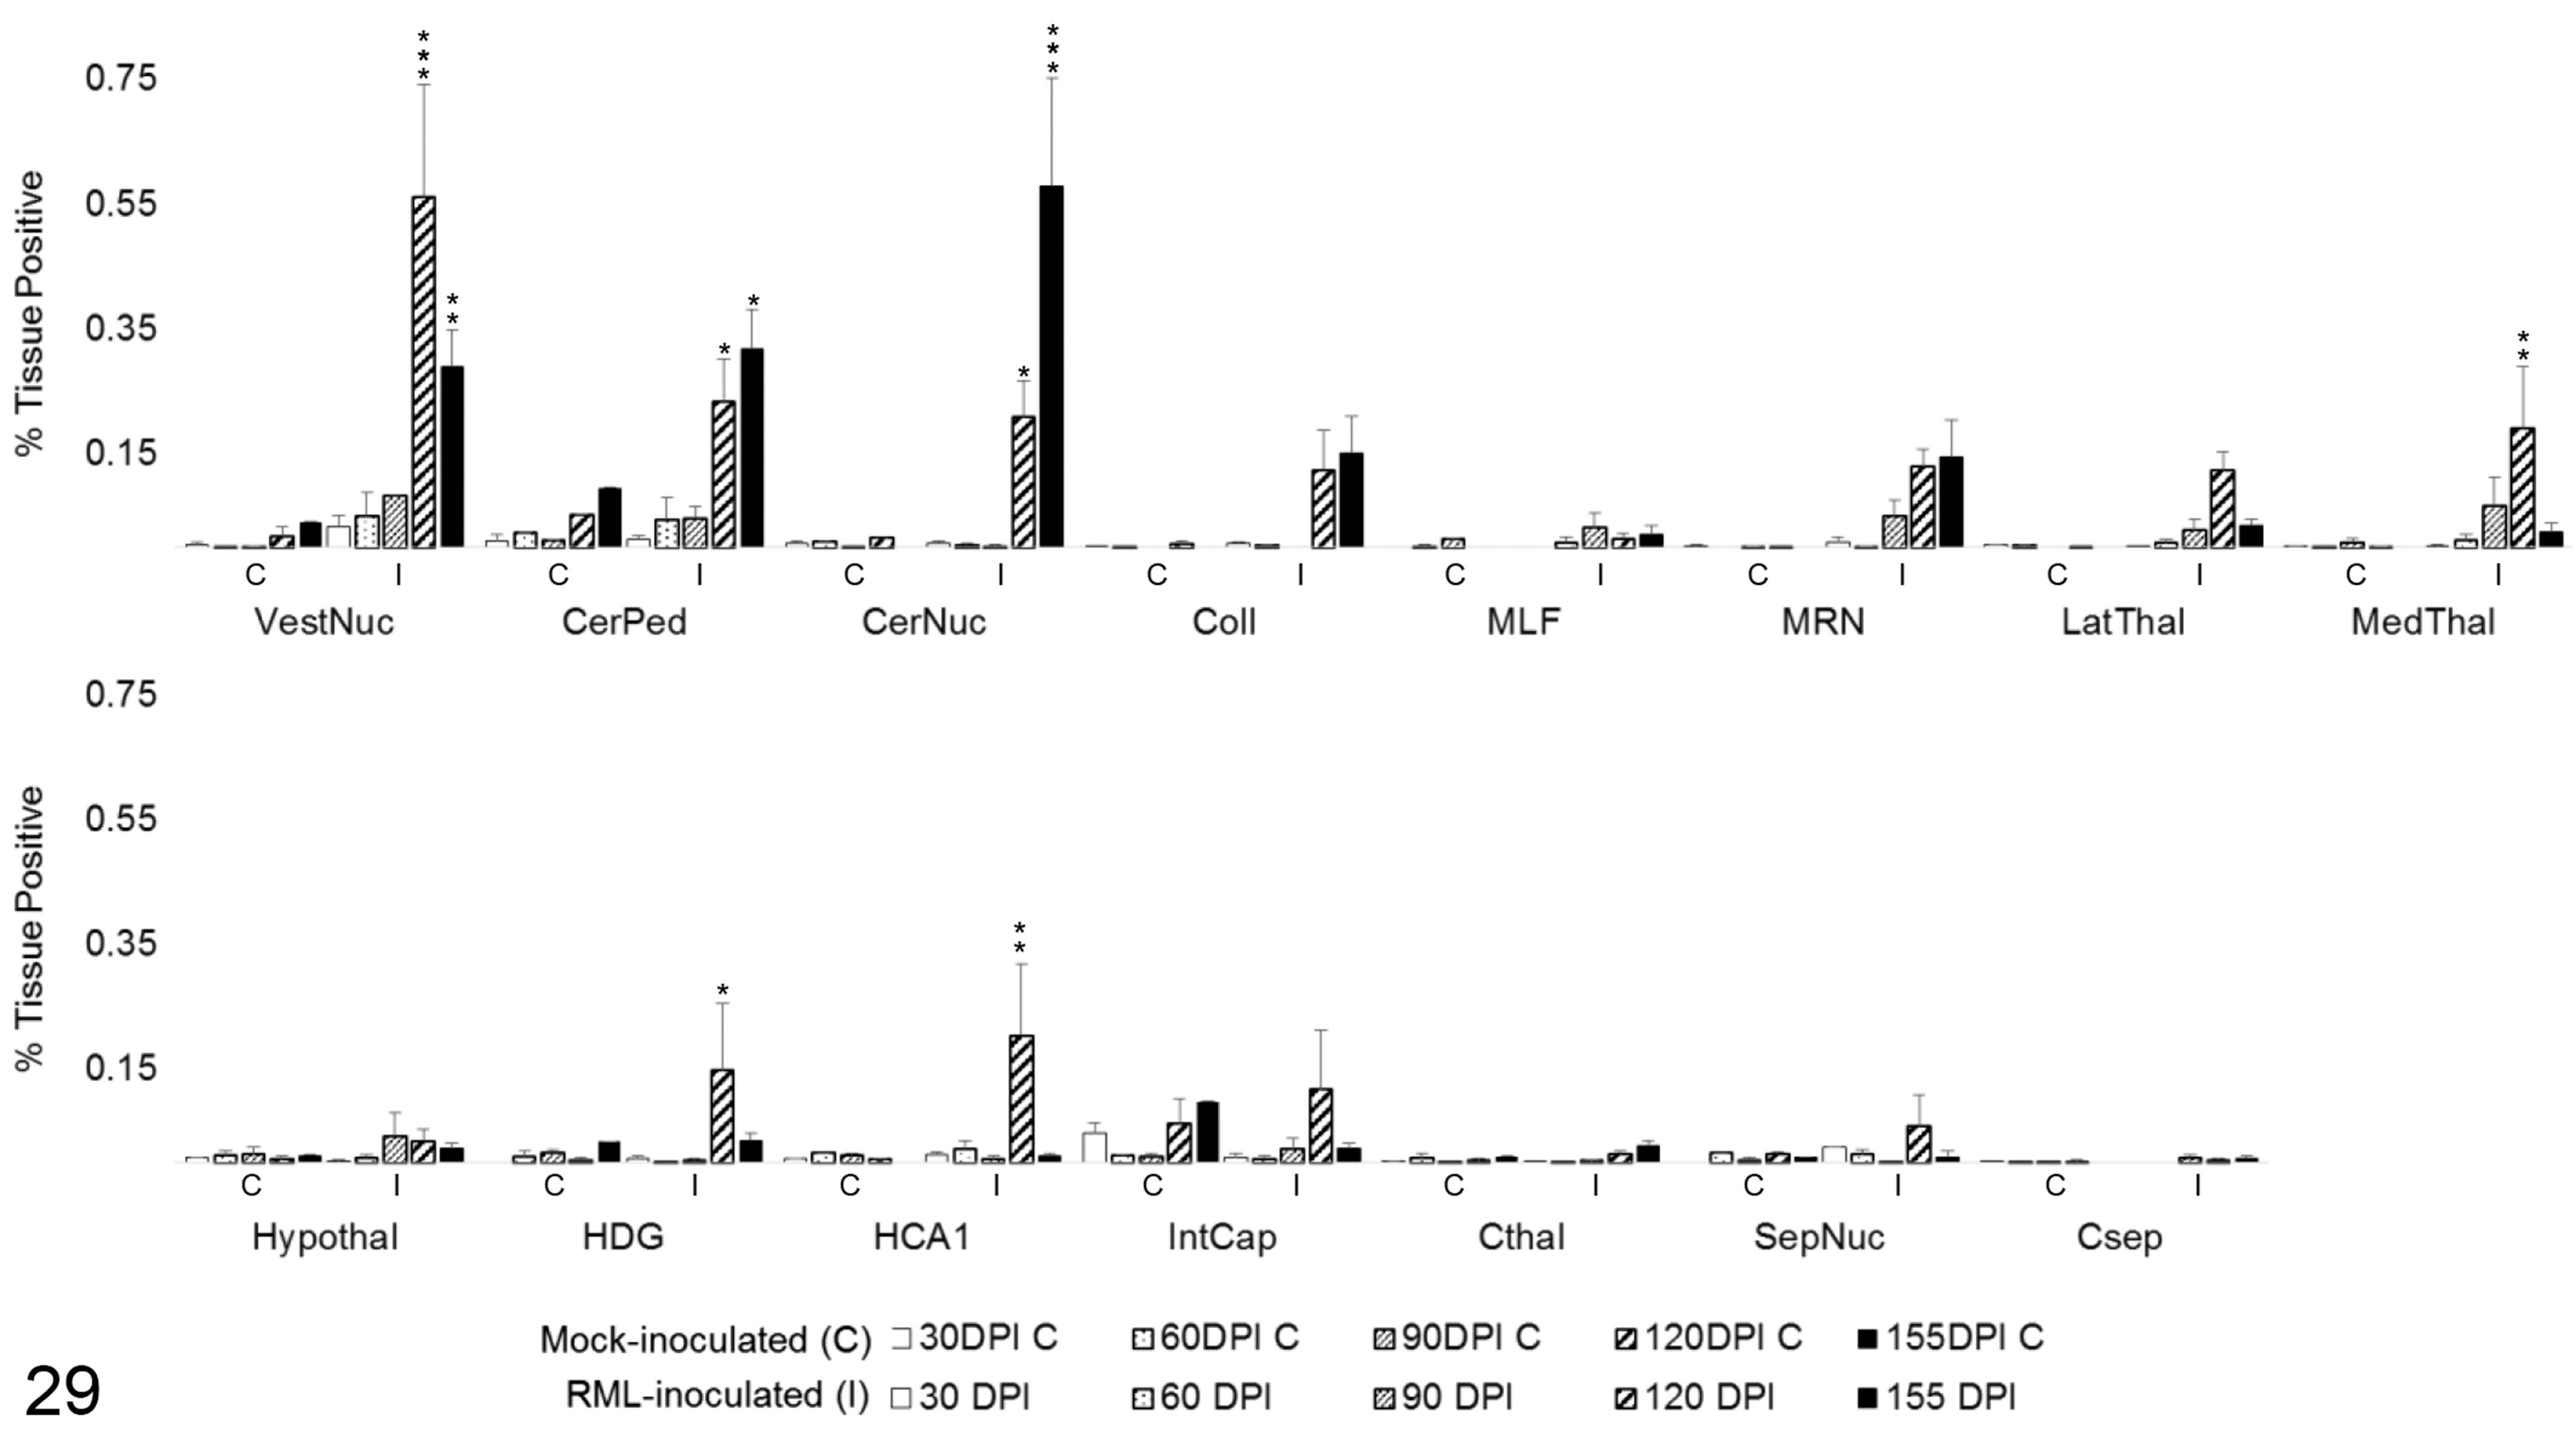
Arg1 colocalization with GFAP in 15 brain regions over the time course of Rocky Mountain Laboratory (RML) scrapie infection. Colocalization was quantified in brain regions as percentage tissue positive for both Arg1 and GFAP immunoreactivity in composite images. Bars represent mean ± SEM values for mock- (C) and RML-inoculated (I) animal cohorts at each sacrifice timepoint. *P < .05. **P < .01. ***P < .001. CerNuc, cerebellar nuclei; CerPed, cerebellar peduncles; Coll, superior colliculus; Csep, cerebral cortex at level of septal nuclei; Cthal, cerebral cortex at level of thalamus; HCA1, CA1 of hippocampus; HDG, dentate gyrus of hippocampus; Hypothal, hypothalamus; IntCap, internal capsule; LatThal, lateral thalamus; MedThal, medial thalamus; MLF, medial longitudinal fasciculus; MRN, midbrain reticular nucleus; SepNuc, septal nuclei; VestNuc, vestibular nuclei.
Discussion
The purpose of this study was to characterize the temporospatial distribution of prion neuropathology in an intracranial infection model of murine scrapie and correlate changes to markers of glial polarization.
Prion infection is known to induce a patterned progression of neuropathology in the brain, wherein PrPSc accumulation is followed by glial activation and finally by spongiform change and neuronal and synaptic loss. 11,68,80 While this infection model reproduced histologic changes classically associated with scrapie infection, the order of lesion development deviated somewhat from previous reports.
In the present work, PrPSc deposition preceded gliosis in 4 of 15 regions and was the first pathologic change observed at 60 DPI in the cerebellar nuclei, lateral thalamus, and rostral cortex, with delayed detection at 120 DPI in the dentate gyrus. In the remaining regions, gliosis was detected either in advance of or contemporaneously with the first significant increases in PrPSc immunoreactivity between 60 and 90 DPI.
Astrocytic accumulation of PrPSc has been demonstrated early in disease progression, 21,73 and previous works have detected an upregulation of GFAP as early as 40 DPI, 11 well in advance of microgliosis. 11 Astrocytosis was detected at 60 DPI prior to microgliosis in only 4 of 15 of the evaluated brain regions, including the cerebellar peduncles, MRN, CA1, and septal nuclei. In remaining regions, microgliosis either preceded or was detected at the same time as the first appreciable increase in GFAP immunoreactivity. Notably, in the vestibular nuclei, MLF, internal capsule, and cortex at the level of the thalamus, microgliosis was quantifiably increased before upregulation of either GFAP or PrPSc immunoreactivity. Spongiform change, where detected, occurred subsequent to PrPSc deposition and gliosis, consistent with RML progression in other models. Overall, neuropathology was most pronounced in the dorsal medulla, sensory midbrain, and the thalamus. These regions demonstrated marked PrPSc accumulation and gliosis by 90 DPI, with the MRN exhibiting PrPSc accumulation and astrocytosis by 60 DPI. Of the 15 evaluated brain regions, the hypothalamus exhibited the least pathology, with only a transient increase in PrPSc and Iba1 at 90 DPI and a second, smaller peak for both at 155 DPI.
The timing and distribution of prion-associated neurodegenerative changes are dictated by incompletely understood strain-host interactions but are highly conserved within an infection model. 23 Our demonstration of an altered lesion development pattern and precocious microglial response relative to other studies that employed RML scrapie agent in C57BL/6 mice 11 may be attributed to variations in tissue sampling timepoints or locations or genetic polymorphisms arising from the long-term (>20 generations) inbreeding of the originating colony. 49
The neuroinflammatory profile of prion disease has been a subject of continued debate, and published results vary with infection model. 54 Several studies have reported that prion infection incites a marked upregulation of genes mediating cell motility, proliferation, homeostatic mechanisms, and inflammatory responses that are primarily attributed to microglia. 3,65 Furthermore, 2 patterns of upregulation were detected: Nonlesioned areas were associated with a homeostasis-mediating cluster, while lesioned brain regions overexpressed genes related to proteolysis, cell stress, and activation of innate immunity. 3,74 This apparent dichotomy in microglial activation profiles lends support for the potential benefits of localized in situ analysis. Infected brains in recent comprehensive transcriptomic and cytokine array analyses demonstrated a definitively proinflammatory signature, with upregulation of IL1β, TNFα, Csf1, IFNγ, caspase 4, TIMP1, and MMP12. 10,51,53,64,72,74 Such an inflammatory milieu would be anticipated to promote proinflammatory polarization of microglia and induce iNOS expression. 58 Indeed, microglia have been shown to elaborate nitric oxide in response to PrPSc. 30 However, phagocytosis of apoptotic neurons in late disease 38 could bias microglia toward alternative activation, which is associated with Arg1 expression. 69 Mixed populations of microglia mediating pro- and antiinflammatory effects have been demonstrated in Alzheimer’s disease 14,48 and ALS. 44 We used quantitative immunohistochemistry to spatiotemporally characterize iNOS and Arg1 labeling through the infection time course and correlate expression to lesion patterns. Colocalization analysis of enzyme immunoreactivity with Iba1 and GFAP was furthermore used to differentiate between microglial and astrocytic expression.
iNOS induction in the brain results in elaboration of neuronotoxic nitric oxide (NO). 7 iNOS expression is associated with classically activated proinflammatory glia 15,34 and has been demonstrated in AD, 48,76 PD, 37,71 and ALS. 62 Total iNOS expression was upregulated late in disease incubation with significantly increased expression detected by 120 DPI in 4 of 15 regions and in an additional 4 locations at terminal disease, representing the dorsal medulla, cerebellum, midbrain, lateral thalamus, HCA1, and internal capsule. No iNOS upregulation was observed in the colliculus, medial thalamus, hypothalamus, dentate gyrus, septal nuclei, or cerebral cortex. It is notable that closely apposed regions, such as the dentate gyrus and CA1 of the hippocampus, and the medial and lateral thalamus had statistically significant variation in iNOS expression. Neither total nor microglial iNOS upregulation was detected in brain regions that failed to demonstrate a transition to amoeboid microglial morphology by clinical disease. These included the colliculus, hypothalamus, dentate gyrus, septal nuclei, and both cortical locations. iNOS detection in this model contrasts with previous reports detailing lack of iNOS upregulation 77 or transient upregulation followed by descending expression in terminal disease. 12 However, these studies used ME7 scrapie, which has been associated with a dampened inflammatory profile, 6,18 and analyzed signal from whole or partially dissected brain homogenate. Significant but anatomically limited changes in expression may not be detected with statistical significance in homogenized whole brain samples owing to dilution. The spatial distribution of iNOS expression in our model supports the possibility of signal dilution as a confounding factor in these previous study designs.
iNOS immunoreactivity colocalized with both Iba1 and GFAP. Significant increases in microglial iNOS expression were observed by 155 DPI in all regions of global iNOS upregulation, with the addition of medial thalamus. Increased astrocytic iNOS expression was only observed in white matter of the cerebellar peduncles, internal capsule, and slightly in CA1. Curiously, a concomitant increase in total GFAP immunoreactivity was not observed in the internal capsule at 155 DPI. Inversely, there is a lack of significant astrocytic iNOS at 155 DPI in the MLF despite marked GFAP upregulation as early as 90 DPI. Combined, these findings indicate that astrocytic iNOS induction is not directly associated with the density of activated fibrous astrocytes and is driven by unknown location-dependent factors. Sporadic iNOS immunoreactivity was also observed in GFAP- and Iba1-negative cells with filamentous processes that strongly resembled astrocytes. GFAP has been demonstrated to underestimate astrocyte densitiy 36 as it can fail to label up to 40% of cells 78 and only associates with an estimated 15% of total cell volume. 9 Thus, the colocalization results may not fully reflect astrocytic contribution to iNOS expression. Taken together, our results support the existence of a proinflammatory iNOS-high environment primarily generated by microglia at clinical disease. This is consistent with an M1 “classically activated” microglial phenotype.
Expression of Arg1, used to identify M2 microglia, 15 is associated with extracellular matrix repair and suppression of inflammation and has been demonstrated in both astrocytes and monocytes during the reparative phase of spinal cord injury. 2,52,69 Arginase-1 expression did not reflect the same widespread distribution as iNOS and displayed markedly different cell association. Global Arg1 expression was unremarkable rostral to cerebellum. The highest immunoreactivity levels in mock-inoculated control and infected mice were noted in the grey matter regions of the dorsal medulla and cerebellum. Here, Arg1 immunoreactivity was primarily observed in neuronal cytoplasm with variable expression in vascular endothelium. This finding coincides with Yu et al’s 81 report of high basal arginase expression in the grey matter of the cerebellum and dorsal medulla; however, hippocampal and cerebral cortical immunoreactivity was not recapitulated in the present time course. In both the previous and current studies, Arg1 was primarily expressed by neurons. 81
In areas with significant Arg1 upregulation, glial expression colocalized predominantly with GFAP. In situ colocalization permitted detection of a small but statistically significant transient rise in astrocytic Arg1 at 120 DPI in the medial thalamus, dentate gyrus, and CA1 of the hippocampus, areas where there was no concurrent increase in total or microglial Arg1 and no hippocampal GFAP upregulation. Activated astrocytes can elaborate either neurotrophic factors promoting repair or proinflammatory synaptolytic compounds, depending on the nature of the activating stimulus. 34,63,82 An activation spectrum similar to the M1/M2 paradigm has been advanced for astrocytes, broadly characterizing neurotoxic A1 and neuroprotective A2 phenotypes. 45 Arg1 production has been demonstrated in healthy and reactive astrocytes in a model of spinal cord trauma 2 and can be induced in experimental polarization of cultured astrocytes. 34 Analysis of tissues from patients with protein misfolding neurodegenerative diseases including AD, HD, PD, and ALS demonstrated presence of proinflammatory A1 astrocytes in lesioned brain regions. 46 Previous reports of astrocytic response to prion infection have similarly demonstrated a proinflammatory phenotype with secretion of IL1β, IL6, IL12, and TNFα 64,72 ; thus, our finding of predominantly astrocytic Arg1 expression associated with an antiinflammatory profile is unexpected.
Iba1-Arg1 colocalization represented an exceedingly small fraction of total Arg1 expression. On retrospective image analysis of regions with increased calculated Iba1-Arg1, colocalization frequently corresponded to areas of high neuronal density and could be attributed to coincidental overlap of cell processes and neurons rather than true colocalization within a single glial cell type. Study design did not accommodate case-by-case exclusion of incidental colocalization. Thus, the Iba1-Arg1 colocalization data may not present significant evidence of an M2-polarized population.
Arg1 and iNOS rely on arginine metabolism and are mutually inhibitory through both substrate competition and suppressive effects of downstream metabolites. 57 In the present study, an inverse temporal relationship between total NOS and Arg1 was not observed at any location. Furthermore, immunoreactivity was largely segregated by cell type, with significant coexpression of both Arg1 and iNOS in 1 glial population limited to astrocytes in the cerebellar peduncles. Although transient upregulation of astrocytic Arg1 at 120 DPI was detected in several locations, these observations were not paired with a reciprocal rise in astrocytic iNOS at 155 DPI. Thus, there is no evidence that suppression of astrocytic Arg1 in clinical disease is mediated by iNOS.
Conclusions
In summary, our data support strong spatiotemporal associations between lesion development and proliferation of microglia demonstrating an iNOS-high phenotype. In contrast, astrocytic iNOS expression appears mostly limited to cerebellar and diencephalic white matter, with trends toward antiinflammatory Arg1 production in medullary and cerebellar regions and transient upregulation in the diencephalon in late incubation. To our knowledge, this time course represents the first in situ characterization of glial immunophenotypes in RML scrapie infection using sequential chromogenic immunohistochemistry. Our findings support previous reports of a predominantly proinflammatory microglial profile in prion infection and contribute new evidence of location-dependent mixed astrocytic activation; however, the complexity of glial immunophenotypes and minimal Arg1 expression by microglia in this study warrant further investigation using additional M1/M2 markers.
Supplemental Material
Supplemental Material, DS1_VET_10.1177_0300985819861708 - In Situ Temporospatial Characterization of the Glial Response to Prion Infection
Supplemental Material, DS1_VET_10.1177_0300985819861708 for In Situ Temporospatial Characterization of the Glial Response to Prion Infection by Alyona V. Michael, Justin J. Greenlee, Tyler A. Harm, S. Jo Moore, Min Zhang, Melissa S. Lind, M. Heather West Greenlee and Jodi D. Smith in Veterinary Pathology
Supplemental Material
Supplemental Material, DS2_VET_10.1177_0300985819861708 - In Situ Temporospatial Characterization of the Glial Response to Prion Infection
Supplemental Material, DS2_VET_10.1177_0300985819861708 for In Situ Temporospatial Characterization of the Glial Response to Prion Infection by Alyona V. Michael, Justin J. Greenlee, Tyler A. Harm, S. Jo Moore, Min Zhang, Melissa S. Lind, M. Heather West Greenlee and Jodi D. Smith in Veterinary Pathology
Footnotes
Declaration of Conflicting Interests
The author(s) declared no potential conflicts of interest with respect to the research, authorship, and/or publication of this article.
Funding
The author(s) received the following financial support for the research, authorship, and/or publication of this article: This research was funded by congressionally appropriated funds to the United States Department of Agriculture, Agricultural Research Service, and by Iowa State University.
Supplemental material for this article is available online.
References
Supplementary Material
Please find the following supplemental material available below.
For Open Access articles published under a Creative Commons License, all supplemental material carries the same license as the article it is associated with.
For non-Open Access articles published, all supplemental material carries a non-exclusive license, and permission requests for re-use of supplemental material or any part of supplemental material shall be sent directly to the copyright owner as specified in the copyright notice associated with the article.