
Abstract
The predictive value of different urinary and transcriptional biomarkers was evaluated in a proof-of-principle toxicology study in rats using aristolochic acid (AA), a known nephrotoxic agent. Male Wistar rats were orally dosed with 0.1, 1, or 10 mg/kg for 12 days. Urine was collected on days 1, 5, and 12 over 24 hours. Gene expression analysis was also conducted using quantitative real-time polymerase chain reaction and Illumina whole-genome chips. Protein biomarkers (Kim-1, Timp-1, vascular endothelial growth factor, osteopontin, clusterin, cystatin C, calbindin D-28K, β2-microglobulin, α–glutathione S-transferase, GSTY1b, RPA-1, and neutrophil gelatinase-associated lipocalin) were measured in these urine samples. Treatment with AA resulted in a slight dose- and/or time-dependent increase in urinary β2-microglobulin, lipocalin 2, and osteopontin before an increase in serum creatinine or serum urea nitrogen was observed. A strong decrease in urinary calbindin D-28K was also detected. The Compugen Ltd. prediction model scored both the 1- and 10-mg/kg AA dose groups as positive for nephrotoxicity despite the absence of renal histopathological changes. In addition, several previously described transcriptional biomarkers were identified as early predictors of renal toxicity as they were detected before morphological alterations had occurred. Altogether, these findings demonstrated the predictive values of renal biomarkers approved by the Food and Drug Administration, European Medicines Agency, and Pharmaceuticals & Medical Devices Agency in AA-induced renal injury in rats and confirmed the utility of renal transcriptional biomarkers for detecting progression of compound-induced renal injury in rats. In addition, several transcriptional biomarkers identified in this exploratory study could present early predictors of renal tubular epithelium injury in rats.
Keywords
The early detection of renal damage has been an important challenge in pharmaceutical drug development. Serum creatinine or serum urea nitrogen (SUN), the major clinicopathological markers currently employed to identify changes in kidney function, are not suitable for the early detection of acute kidney injury (AKI). Due to the functional reserve of the kidney, changes in these clinical markers appear late, when as much as two-thirds of the renal biomass has been lost. 33
In the past few decades, intensive research has been conducted to identify additional more accurate biomarkers for clinical and preclinical safety assessment. 8,12 This whole process has been driven by the Predictive Safety Testing Consortium and the International Life Science Institute/Health and Environmental Sciences Institute. In the study reported here, our objective was to evaluate the predictive (observation of adverse events on a molecular basis before morphological and/or physiological alterations are established) performance of several novel urinary and transcriptionally relevant kidney biomarkers.
Aristolochic acid (AA) is a mixture of structurally related nitrophenanthrene carboxylic acid derivatives, primarily AAI and AAII, which occur as secondary metabolites in plants of the genus Aristolochia. AA is a rodent carcinogen and a highly nephrotoxic compound. 27,28 Based on the striking similarities to Chinese herb nephropathy, including association with increased risk for the development of urothelial malignancies, AA has also been suspected to be a causative agent for Balkan endemic nephropathy, a chronic tubulointerstitial kidney disease that occurs in geographically limited areas of the Balkan region, presumably through contamination of flower with seeds of Aristolochia clematitis growing on the fields. 4,13,45 AA-mediated nephrotoxicity in rodents is characterized by progressive loss of the proximal tubule brush border and necrosis of the renal tubule epithelium within the outer stripe of the outer medulla and the medullary rays. 16,18 The mechanism of AA nephrotoxicity and carcinogenicity is not fully understood but is thought to involve metabolic activation to a cyclic N-acylnitrenium ion that forms covalent DNA adducts. 3,19,42,50
Subchronic treatment of rats with 10 mg/kg body weight (BW) AA given as a mixture of AAI (77%) and AAII (21%) was shown to cause tumors in the forestomach, kidney, and the urinary bladder. 27 In a 28-day study, AA given at doses ≥5 mg/kg BW resulted in clear toxicity, whereas mild renal changes were seen at 1 mg/kg BW. A single oral dose of 10 mg/kg BW AA was also reported to induce signs of tubular regeneration, presumably in response to discrete damage to the renal epithelium. 28 Based on these findings, the doses in this study (ie, 0.1, 1.0, and 10 mg/kg AA [27% AAII and 65% AAI]) were chosen to induce no or only slight histopathological changes in the rat kidney. It was hypothesized that prior to the development of morphological and functional alterations, mechanistic changes at the messenger RNA (mRNA) and protein levels take place, which are indicative of the developing toxicity. 6 Therefore, this study would help to determine the utility of the molecular technologies and biomarkers applied in this study to predict AA-induced renal tubular insult in male rats.
Materials and Methods
Animal Studies
All animal experiments were performed according to national animal welfare regulations after authorization by the local authorities. Male Wistar rats (6–8 weeks old) weighing approximately 200 g were purchased from Harlan-Winkelmann (Borchen, Germany). The rats were randomly divided into control, low-dose, mid-dose, and high-dose groups of 5 animals each. Animals were kept in Makrolon cages (5 animals per cage) on a 12-hour light/dark cycle and allowed free access to standard laboratory chow (SSniff, Soest, Germany) and tap water. The dosing was performed with AA solution (27% AAII and 65% AAI; Sigma, Taufkirchen, Germany) prepared in tap water at dose levels of 0.1 (26.7 μg/mL), 1 (267 μg/mL), and 10 mg/kg BW per day (2.67 mg/mL). The administration of AA was by gavage, 5 days per week, followed by a 2-day treatment interruption over 2 weeks. Control animals received an equal volume of tap water. The animals were housed in individual metabolic cages during the study. Urine was collected for 24 hours after the first dose and on days 5 and 12 starting directly after dosing. During urine collection, which was performed under cooled conditions, the animals were fasted with free access to water. Blood collection was performed 24 hours after the last dosing. Blood samples were taken from the retro-orbital plexus under light isoflurane anesthesia on days 1 and 5 for clinical chemistry. The animals were sacrificed on day 12 by CO2 asphyxiation, and blood was collected by cardiac puncture 24 hours after administration of the final dose (Fig. 1).
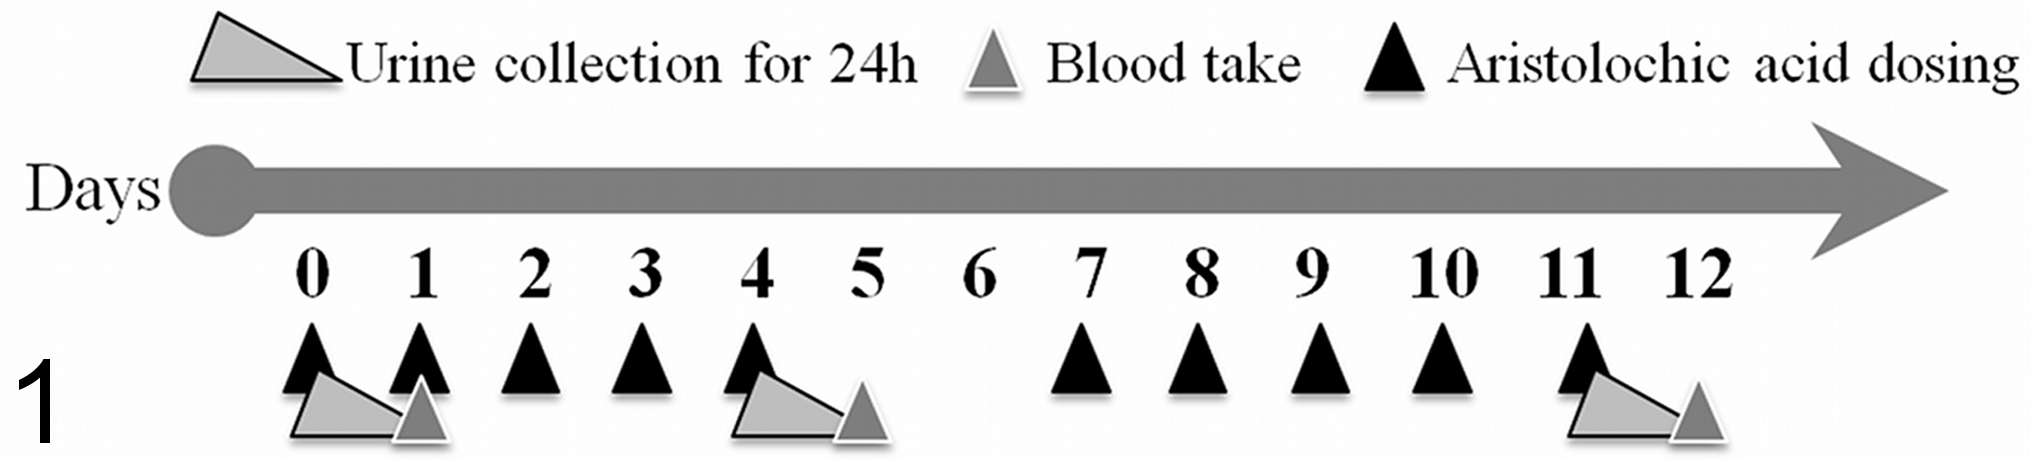
Illustration of the treatment and blood/urine collection over the dosing period. Animals were dosed daily for 5 days with 2 days of interception. Sample collection was performed on days 1, 5, and 12. Final necropsy and tissue collection was performed on day 12.
Blood samples and aliquots of urine were immediately used for routine clinical chemistry analyses. The remaining urine and serum were stored at –20°C until further analysis. Organs (liver, kidney, and bladder) were removed and weighed. The left kidney was partitioned transversely in a ratio of approximately 2:1; the larger part was stored in formalin. The remainder and the right kidney were snap-frozen in liquid nitrogen and stored at −80°C. The liver and bladder were stored in formalin.
Clinical Chemistry
Urine and serum analyses were carried out at the Laboratory for Clinical Chemistry, University of Wuerzburg, on a Vitros 700XR (Ortho-Clinical Diagnostics, Neckarsgemuend, Germany) using standard protocols for the determination of these parameters according to the manufacturer’s instructions. The following parameters were determined in urine: glucose, GGT (γ-glutamyl transferase), total protein, creatinine, and osmolality. For blood samples, the following parameters were determined in serum: creatinine, urea, total bilirubin, aspartate aminotransferase, alanine amino transferase, GGT, alkaline phosphatase, and total protein.
Determination of Urinary Kidney Markers
Urinary β2-microglobulin, α–glutathione S-transferase (α-GST), Kim-1, Timp-1, vascular endothelial growth factor (VEGF), calbindin D-28K, clusterin, cystatin C, neutrophil gelatinase-associated lipocalin (NGAL), and osteopontin were determined using the WideScreen Rat Kidney Toxicity Panels 1 and 2 by Merck Millipore (Darmstadt, Germany). Both assays are based on the Luminex xMAP (Austin, TX) technology, which is a combination of a sandwich enzyme-linked immunosorbent assay and flow cytometry. For Panel 1, the recommended sample dilution of 2-fold was used for α-GST, β2-microglobulin, and VEGF. For Kim-1, the dilution factors 2 and 10 were required. The recommended dilution for Panel 2 measurement was 50-fold. To take into account the variance between the animals, as well as the induction potential of some markers, dilution factors of 10, 50, and 1000 were required to detect all markers in an optimal range. The detection range of clusterin and osteopontin was optimal after a dilution of 10-fold. Cystatin C was diluted 50-fold or 1000-fold. For the detection of NGAL, dilutions over the whole range were needed. For all measurements, 30 μl of diluted urine sample was analyzed in duplicate. On each plate, a high- and a low-concentration control were also included. The assay was performed as previously described. 15
For the MULTI-SPOT technology-based assays provided by Meso Scale Discovery (Rockville, MD), the Argutus AKI test was used, including α-GST, GSTY1b, and RPA-1. The recommended dilution factor of 10 was used. For the Argutus AKI test kit, an 8-point standard curve was prepared. For the standard curve, the provided calibrator blend was diluted 3-fold in a serial dilution with diluent 31 solution. The plate was blocked with 150 μl of 3% (w/v) blocker B in phosphate-buffered saline (PBS). Therefore, 600 mg blocker B was dissolved in 20 ml PBS. In addition, 60 μl of the used detection antibody, provided as a blend at a 50× concentration, was mixed with 30 μl of the 10% stock of blocker D-R and 2910 μl of diluent 31. After each well of the 96-well plate was blocked for 1 hour with 150 μl blocker B solution by vigorous shaking (750 rpm), the plate was washed 3 times with PBS (Invitrogen, Karlsruhe, Germany) plus 0.05% Tween-20 (Merck KGaA, Darmstadt, Germany) (PBS-T). The washing steps were performed in an automated Tecan Hydro-flex wash station (Tecan Deutschland GmbH, Crailsheim, Germany). Then, 50 μl of sample or calibrator blend was dispensed into the appropriated wells and sealed by an adhesive plate sealer before the plates were incubated for 2 hours under the same conditions described above. The plate was again washed 3 times with PBS-T followed by adding 25 μl of detection antibody solution into each well. After a final 2-hour incubation and a final washing step, 150 μl of read buffer T was added into each well directly before measurement with a SECTOR Imager 6000 (Meso Scale Discovery).
For both technologies, the blank was subtracted from all values and multiplied by the appropriate dilution factor to represent the undiluted sample concentration.
RNA Isolation and Quality Control
Total RNA from the kidney of the AA dosed and control rats was isolated by an automated procedure using an RNeasy Mini Kit on the Qiacube System (Qiagen, Hilden, Germany). The yield of the extracted RNA was determined spectrophotometrically by measuring the optical density at 260 nm on the NanoDrop system (Thermo Fischer Scientific, Waltham, MA). The quality determination of the isolated RNA was evaluated using the RNA 6000 Nano LabChip and Agilent 2100 Bioanalyzer (Agilent Technologies, Santa Clara, CA). Only RNA with RNA integrity numbers (RINs) greater than 7.0 were used for quantitative real-time polymerase chain reaction (qRT-PCR) and microarray experiments.
Quantitative RT-PCR
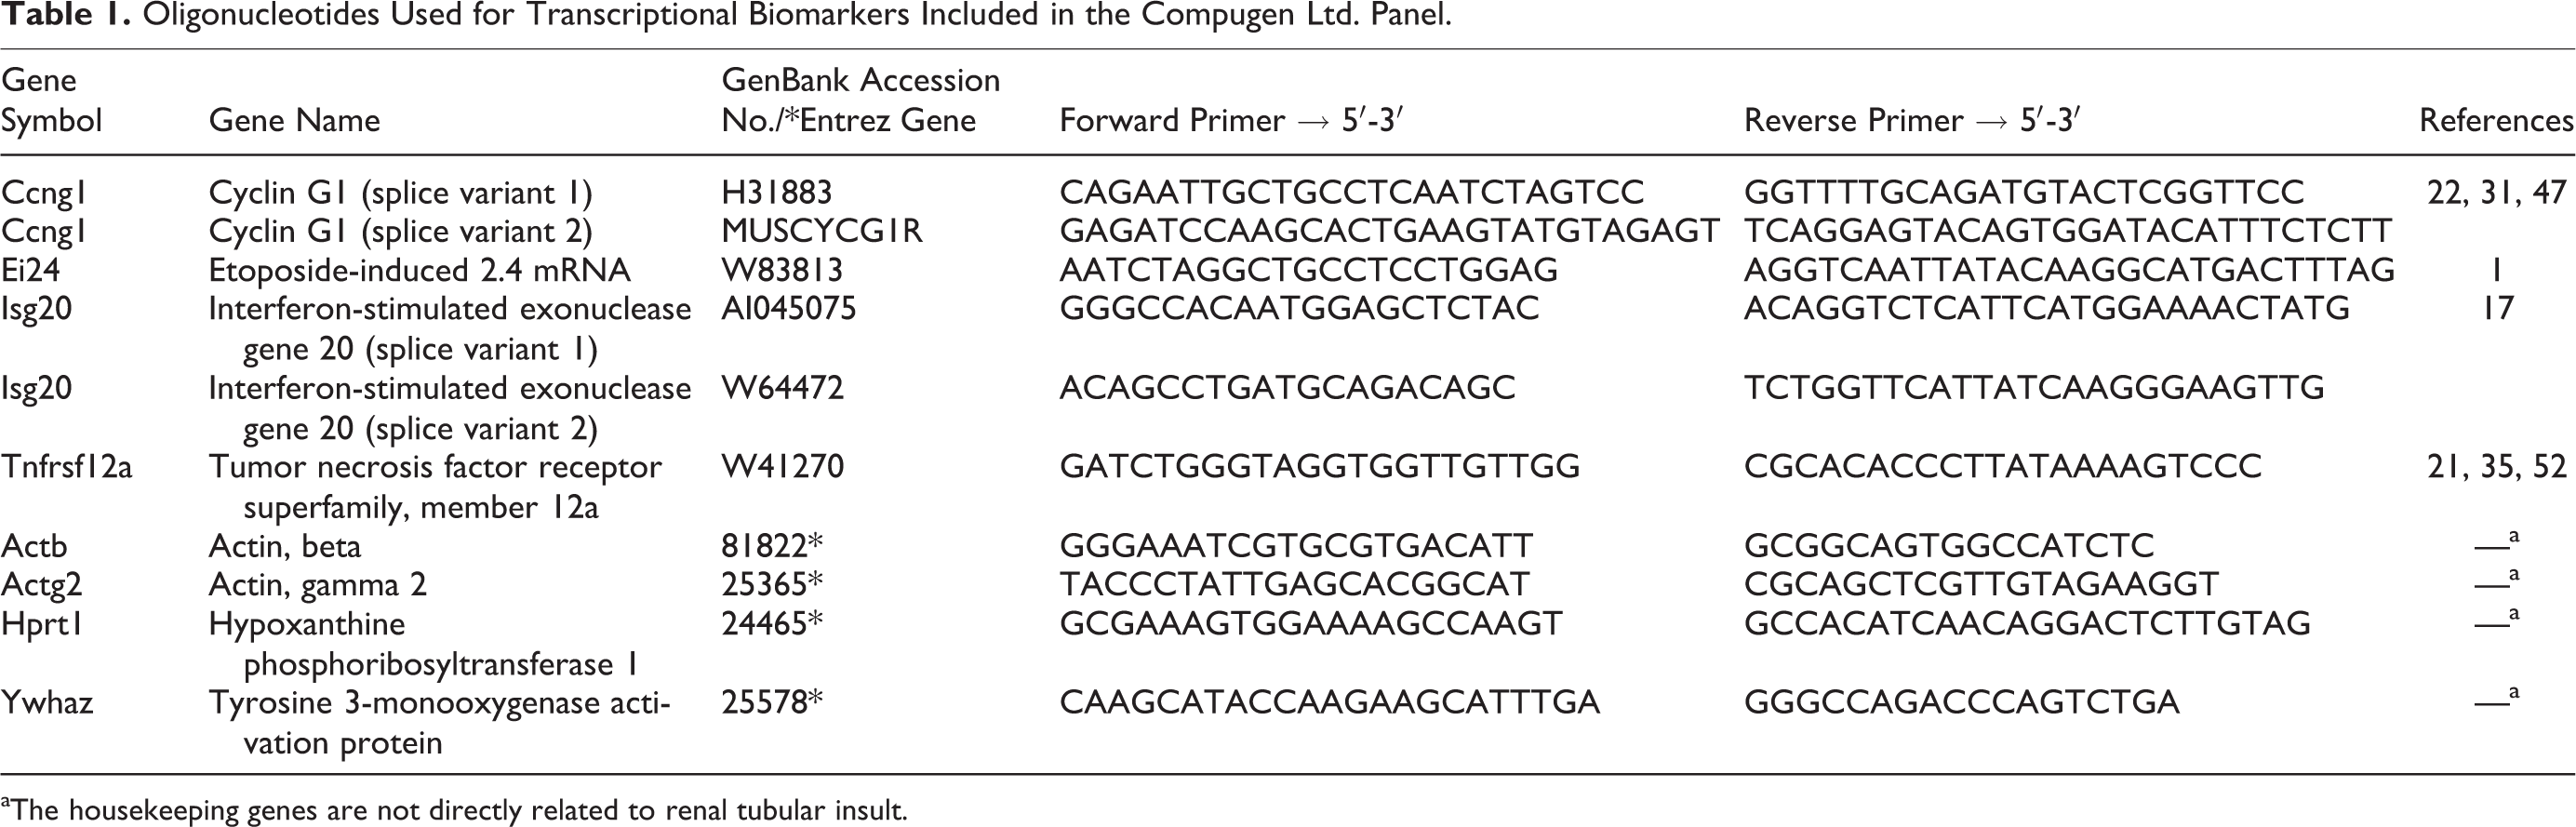
SuperScript II Reverse Transcriptase (0.2 U/ml; Invitrogen), 0.3 μg/μl random hexamer primers (Roche, Mannheim, Germany), 10 mM deoxy-NTPs (Roche), and 40 U/μl RNAsin (Promega GmbH, Mannheim, Germany) were used to transcribe 4 μg total RNA to complementary DNA (cDNA) in 30 μl for 60 minutes at 42°C. Transcription of selected (Compugen Ltd. [Tel Aviv, Israel] nephrotoxicity signature) genes was quantified in triplicates using custom-made oligonucleotides (Sigma Aldrich, Steinheim, Germany) on the ABI Prism 7000 Sequence Detection System (Applied Biosystems, Darmstadt, Germany; see Table 1). Forty cycles were run with the following parameters: 50°C for 2 minutes, 95°C for 10 minutes, and then 40 cycles of 95°C for 15 seconds, followed by 60°C for 1 minute, except for cyclin G1 (Ccng1) splice variant 2, for which the annealing temperature was 62°C, for transcription using SYBR green chemistry (Applied Biosystems). cDNAs were stored at –80°C and diluted 1:20 in TE buffer (10 mM Tris [pH 8], 1 mM EDTA), and PCR reactions were performed with 5 μl of diluted cDNA in 20-μl reactions. On every plate, an 8-point standard curve, prepared by reverse transcription of universal rat RNA (Stratagene, Heidelberg, Germany), was included.
Oligonucleotides Used for Transcriptional Biomarkers Included in the Compugen Ltd. Panel.
aThe housekeeping genes are not directly related to renal tubular insult.
Whole Transcriptional Gene Expression Analysis
cRNA synthesis and illumina whole-genome chip hybridization
Gene expression analysis was performed using Illumina Sentrix ratRef-12 V1 BeadChip Arrays (Illumina, San Diego, CA), allowing the simultaneous analysis of ∼22 000 transcripts. 39 An automated procedure using a Theonyx Liquid Performer robot (Aviso GmbH, Greiz, Germany) and MessageAmp aRNA amplification Kit (Ambion, Darmstadt, Germany) was used to synthesize biotinylated complementary RNA (cRNA). As described earlier, several modifications requested by Illumina to optimize the process were performed. 55 Instead of column cleanup, the bead-based Agencourt RNAclean system (Beckman Coulter, Krefeld, Germany) was applied to purify cDNA and cRNA. cRNA quality was assessed with the 2100 Agilent Bio-Analyzer. Quantities were measured spectrophotometrically via the NanoDrop. Then, 750 ng of amplified biotinylated cRNA was hybridized onto the Illumina Sentrix BeadChip in a Hybridization Cartridge under humidified conditions for 20 hours at 58°C (Hybridization Oven; Illumina). The chips were then washed, stained, and dried in an automated procedure using a Little Dipper Processor (Scigene Corp., Sunnyvale, CA). Staining was for 10 minutes with 1 μg/ml streptavidin-conjugated Cy3 (Amersham Biosciences, Buckinghamshire, UK) and finally dried by centrifugation according to the protocol provided. Fluorescence detection was carried out by confocal laser scanning with the Illumina BeadArray Reader (Illumina) at 532 nm and 0.8 μm resolution.
Statistical Data Analysis
Clinical chemistry
Data are expressed as mean ± standard deviation (n = 5/group). Statistical analysis was performed by analysis of variance (ANOVA) + Tukey post hoc test. Values significantly different from control are indicated as *P < .05, **P < .01, and ***P < .001.
Urinary multiplexing assays
Results calculated by an 8-point standard curve were normalized against the volume collected within 24 hours. Data are presented as individual animals (means are indicated by a black line). Statistical analysis was performed by ANOVA + Tukey post hoc test using the GraphPad Prism 5 software package (GraphPad Software, La Jolla, CA). Values significantly different from control are indicated as *P < .05, **P < .01, and ***P < .001.
Quantitative RT-PCR
Average Ct values were calculated from triplicate measurements for each sample. The standard curve was used to transform the average Ct to RNA expression levels. The geometric mean of the 4 housekeeping genes’ expression levels was calculated for each sample, and this value was used as a normalization factor accounting for the relative total RNA amount per sample. The RNA expression was further normalized for each marker, so that the geometric mean of the control sample expression levels was a predetermined value (the geometric mean of the control samples used to train the classifier; see below). A random forest classifier was used to determine the toxicity status for each sample. Both the 4-marker and the 6-marker classifiers used an additional sex parameter and gave numerical results between 0 and 1. Any sample with a value above 0.4 was considered toxic. A toxicity score was calculated for each group of samples (control and low, medium, and high dose), as the percentage of toxic samples in the group. All calculations were done on Excel (Microsoft, Redmond, WA), and the classifiers were created and run using R software, embedded in Excel as an add-in.
Whole transcriptional gene expression analysis
The array data analysis is a multistep process beginning with decoding of the image spots because of random assembly of the microbeads on the array surface. 14 Each bead type is represented on average 30 times per array, providing internal replicates. 39 Illumina BeadStudio Software was used for condensing these data and also to ensure array quality based on different control bead parameters. Data were uploaded into Genedata’s Expressionist Analyst software (Genedata AG, Basel, Switzerland) for data normalization and statistical analysis. The data were normalized by a quantile normalization algorithm followed by a 1-way ANOVA with a threshold of P ≤ .05. For further filtration of the data, ratio values were created with a threshold of ±1.5-fold deregulation of the average of the corresponding control animals. The data were uploaded into the Ingenuity Pathway analyzing software (Ingenuity Systems, Redwood City, Canada) as well as the ToxWiz software from Cambridge Cell Networks (Cambridge, UK) for functional analyses and biological interpretation.
Results
Summary of Renal Histopathology and Clinical Chemistry Findings
In the AA treatment groups, clinical signs of toxicity included irritation of the upper gastrointestinal tract, particularly in high-dose animals, consistent with the forestomach being a target of AA toxicity. Histopathological observations, performed by hematoxylin and eosin staining of formalin-fixed, paraffin-embedded liver and kidney showed no morphological changes in the control group or in the dosed animals, even at the highest dose.
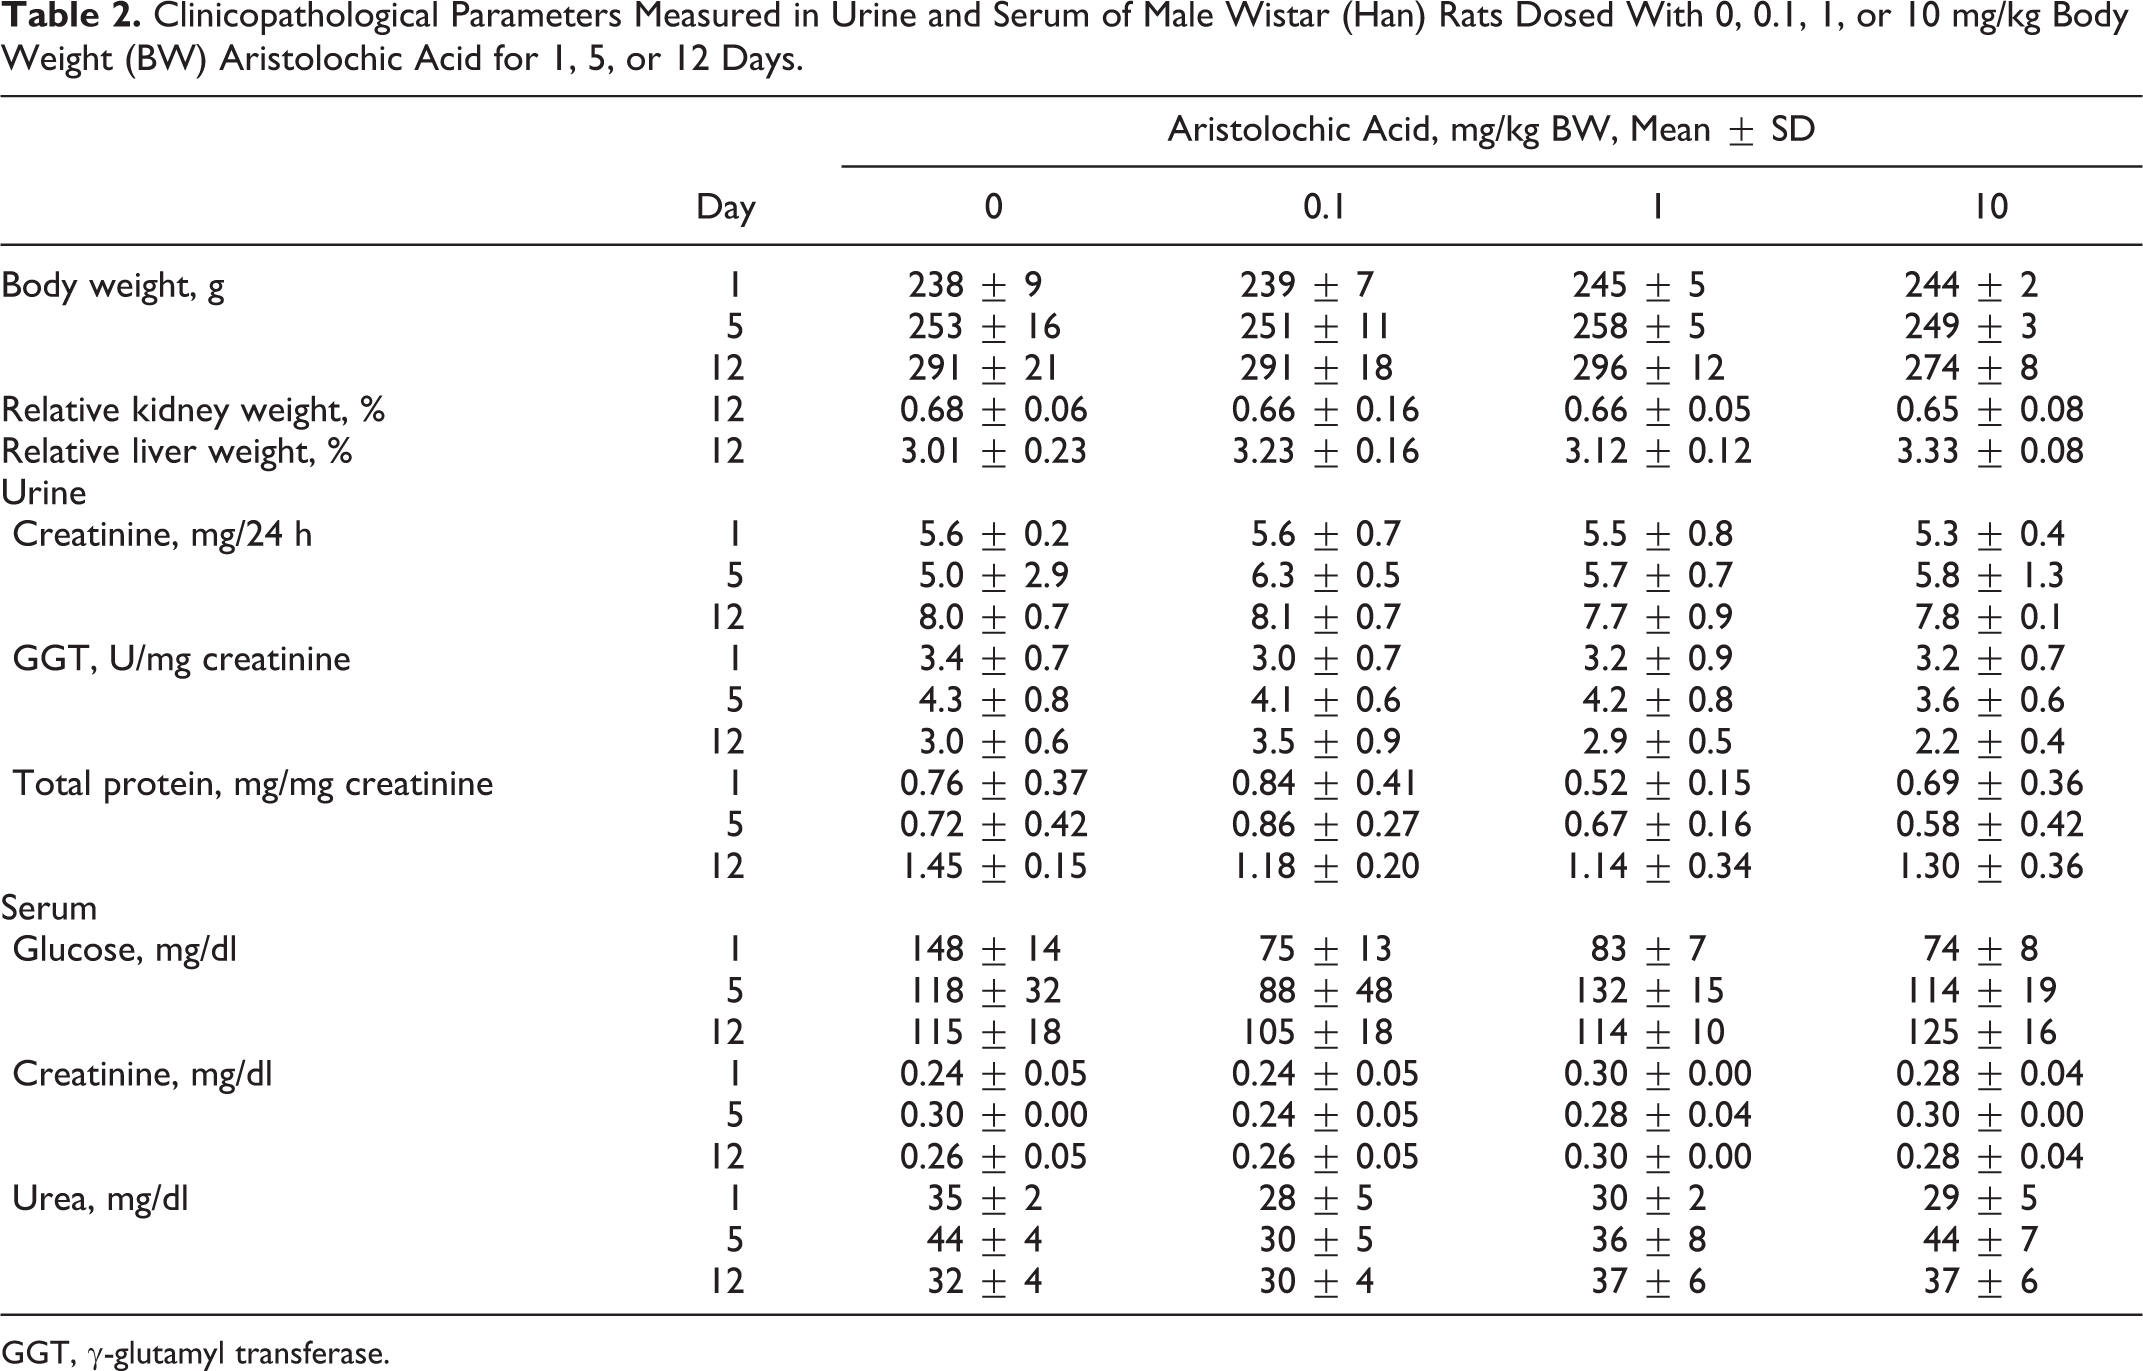
An overview of relevant or significantly altered parameters is given in Table 2. The most significant clinical chemical alteration was a strong decrease of the serum glucose level in all AA dose groups on day 1, which returned to control values at the later time points. These changes may be explained by a decreased feeding caused by a sore/swollen esophagus and reduced (albeit not statistically significant) body weight due to reduced food uptake. Consistent with the absence of histopathological changes in the kidney, analysis of clinical biochemistry markers indicative of renal tubular insult (ie, serum creatinine, SUN, urinary creatinine, total urinary protein, and GGT) provided no indication of kidney injury throughout the time course of this study. Total protein, one of the Food and Drug Administration/European Medicines Agency qualified urinary biomarkers not included in any of the tested panels used in this study, showed no dose- or time-dependent changes. In addition, no changes related to systemic toxicity were detected by clinical chemistry analyses.
Clinicopathological Parameters Measured in Urine and Serum of Male Wistar (Han) Rats Dosed With 0, 0.1, 1, or 10 mg/kg Body Weight (BW) Aristolochic Acid for 1, 5, or 12 Days.
GGT, γ-glutamyl transferase.
Analysis of Urinary Kidney Biomarkers
The measurements performed with the WideScreen Rat Kidney Toxicity Assay (Merck Millipore) for the detection of subacute renal tubular insult induced by treatment with AA were associated with time- and/or dose-dependent increases (Fig. 2) in urinary β2-microglobulin (Fig. 2a), lipocalin 2 (Fig. 2g), and osteopontin (Fig. 2h). A strong and statistically significant decrease in calbindin D-28K (Fig. 2i) compared with the control group was seen on day 1 in animals dosed with 1 and 10 mg/kg AA, while the highest dose of AA also showed a clear (although nonsignificant) decrease. Kim-1 (Fig. 2b) showed no significant changes over time or dose. Importantly, cystatin C (Fig. 2f) and Timp-1 (Fig. 2c) showed an early, albeit not statistically significant, increase in even low-dose animals without any alterations in serum creatinine or SUN. At the last time point, VEGF (Fig. 2d) showed an increase but was not significant in mid- and high-dose groups. The strongest and most significantly increased biomarker was lipocalin 2. The Luminex-based measurements of α-GST were under the lower limit of detection (LLOD) and are not shown in Fig. 2. However, most markers showed a large variance between single animals. Together, several of the urinary protein biomarkers provided some evidence for AA-induced renal tubular insult, even without any significant changes in the classic detection of serum creatinine or SUN.
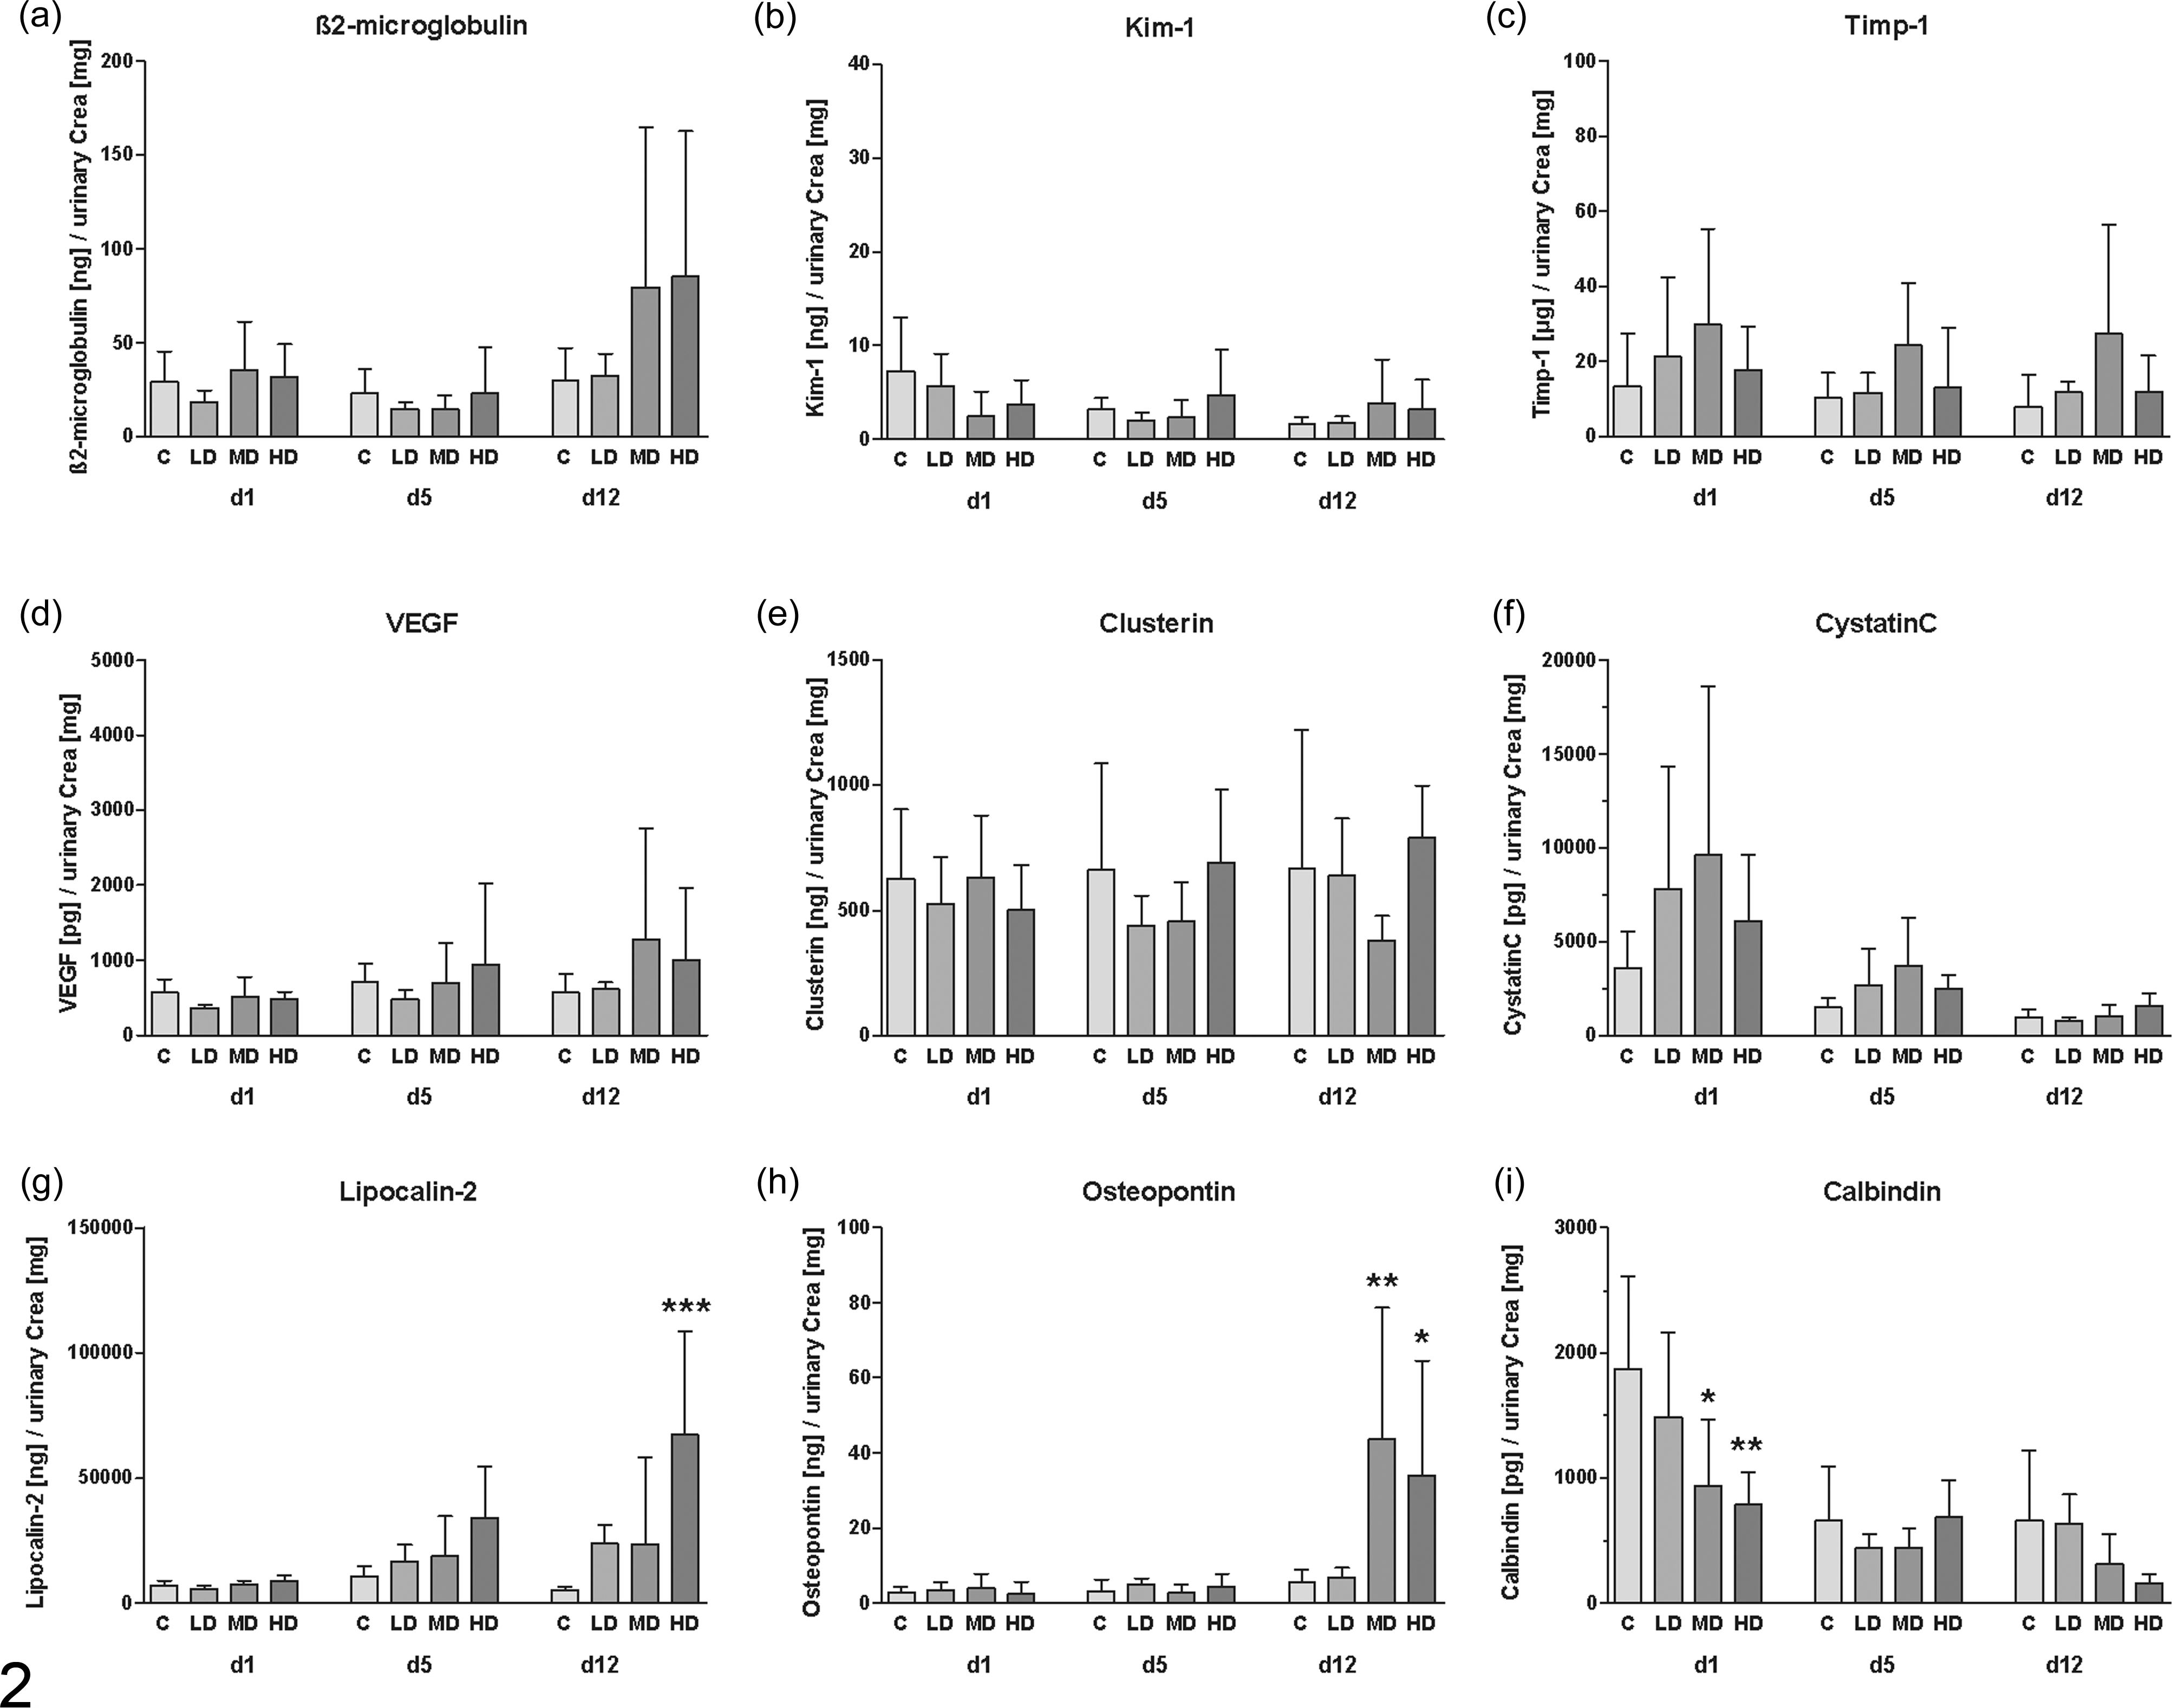
Measurement of (a) β2-microglobulin, (b) Kim-1, (c) Timp-1, (d) vascular endothelial growth factor (VEGF), (e) clusterin, (f) cystatin C, (g) lipocalin 2, (h) osteopontin, and (i) calbindin D-28K on the Luminex xMAP platform in urine of rats dosed with aristolochic acid for 12 days (d1, 5, 12 = urine available on days 1, 5, and 12 of treatment, respectively). Data are presented for animals of the control (C), low-dose (LD), mid-dose (MD), and high-dose (HD) group as mean ± standard deviation (n = 5). *P < .05, **P < .01, ***P < .001 (analysis of variance + Tukey test).
The markers included in the MULTI-SPOT technology-based assay (Meso Scale Discovery) showed similar but no significant increases over time and dose (Fig. 3). The detection of GSTYb1 was not possible because all values of the control and low-dose groups as well as most values of the mid- and high-dose groups were under the LLOD. α-GST (Fig. 3a) and RPA-1 (Fig. 3b) did not show any time- or dose-dependent changes.
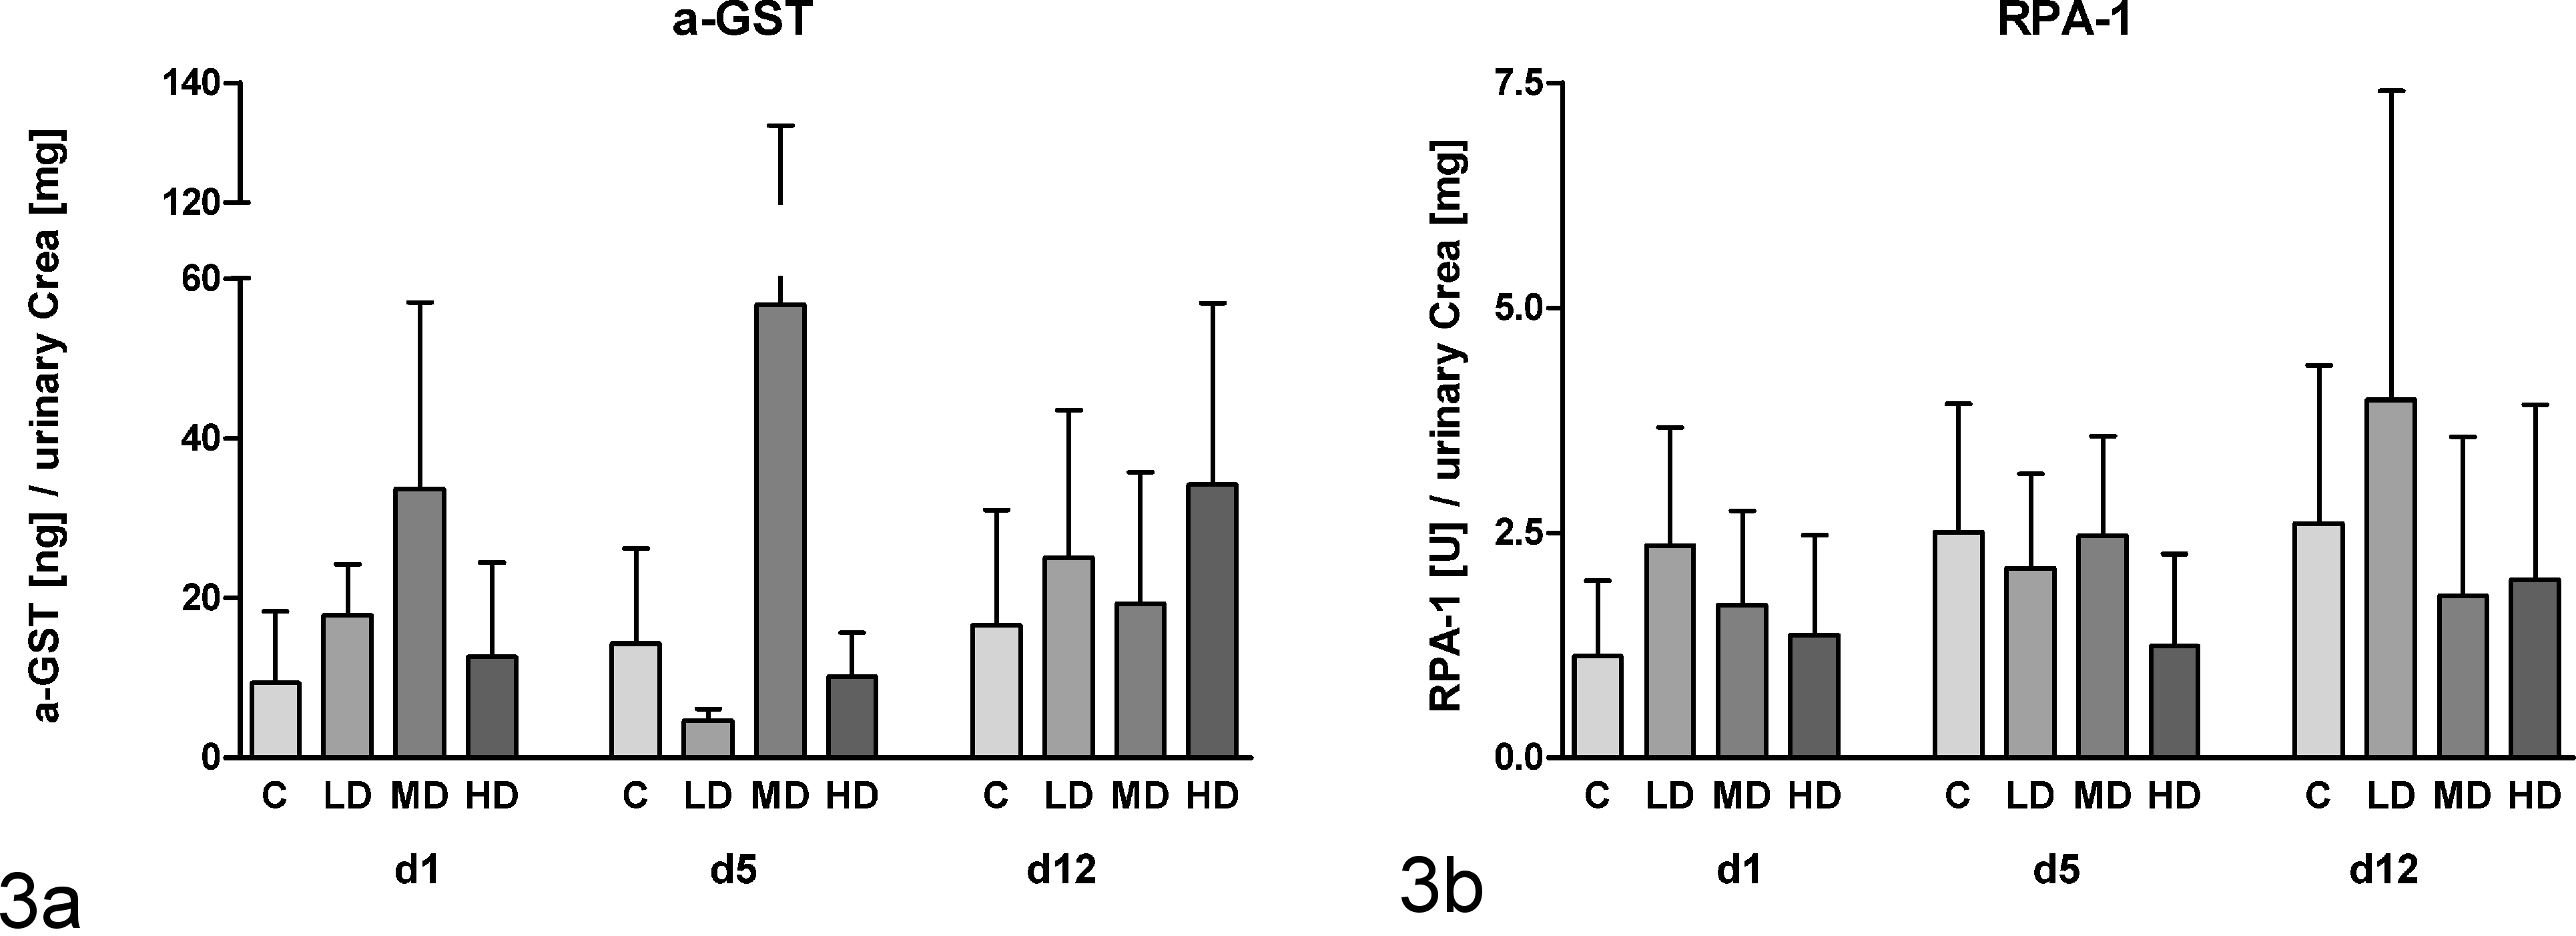
Measurement of urinary α–glutathione S-transferase (α-GST) (a) and RPA-1 (b) on the Meso Scale platform for rats dosed with aristolochic acid for 12 days (d1, 5, 12 = urine available on days 1, 5, and 12, respectively). Data are presented as mean ± standard deviation (n = 5) of the protein concentration normalized against urinary creatinine content. No statistical significant alterations were determined by analysis of variance + Tukey test.
Analysis of Transcriptional Kidney Biomarkers (Compugen Ltd)
Test set of the qRT-PCR–based classification model based on gentamycin-induced renal tubular insult
To show that the qPCR-based prediction model, provided by Compugen Ltd., is able to identify specific, substance-induced renal tubular insult, renal tissue was used from a study already published. 15 In this study, clear histopathological signs, as well as a related increase in specific urinary biomarkers, were observed and well correlated. Figure 4 shows the classifier values for the 4-gene and 6-gene classifier model as well as the resulting toxicity scores by using a cutoff value of 0.4 for 3 animals per group (all gentamycin-dosed animals showed proximal tubular necrosis). All 3 animals in the control group were below the cutoff value (0.1–0.2), while the low- and high-dose animals showed classification values between 0.6 and 0.7. In this case, independently of the used classification model (4-gene/6-gene model), both the low- and high-dose groups were classified as being positive (i.e., 100% score).
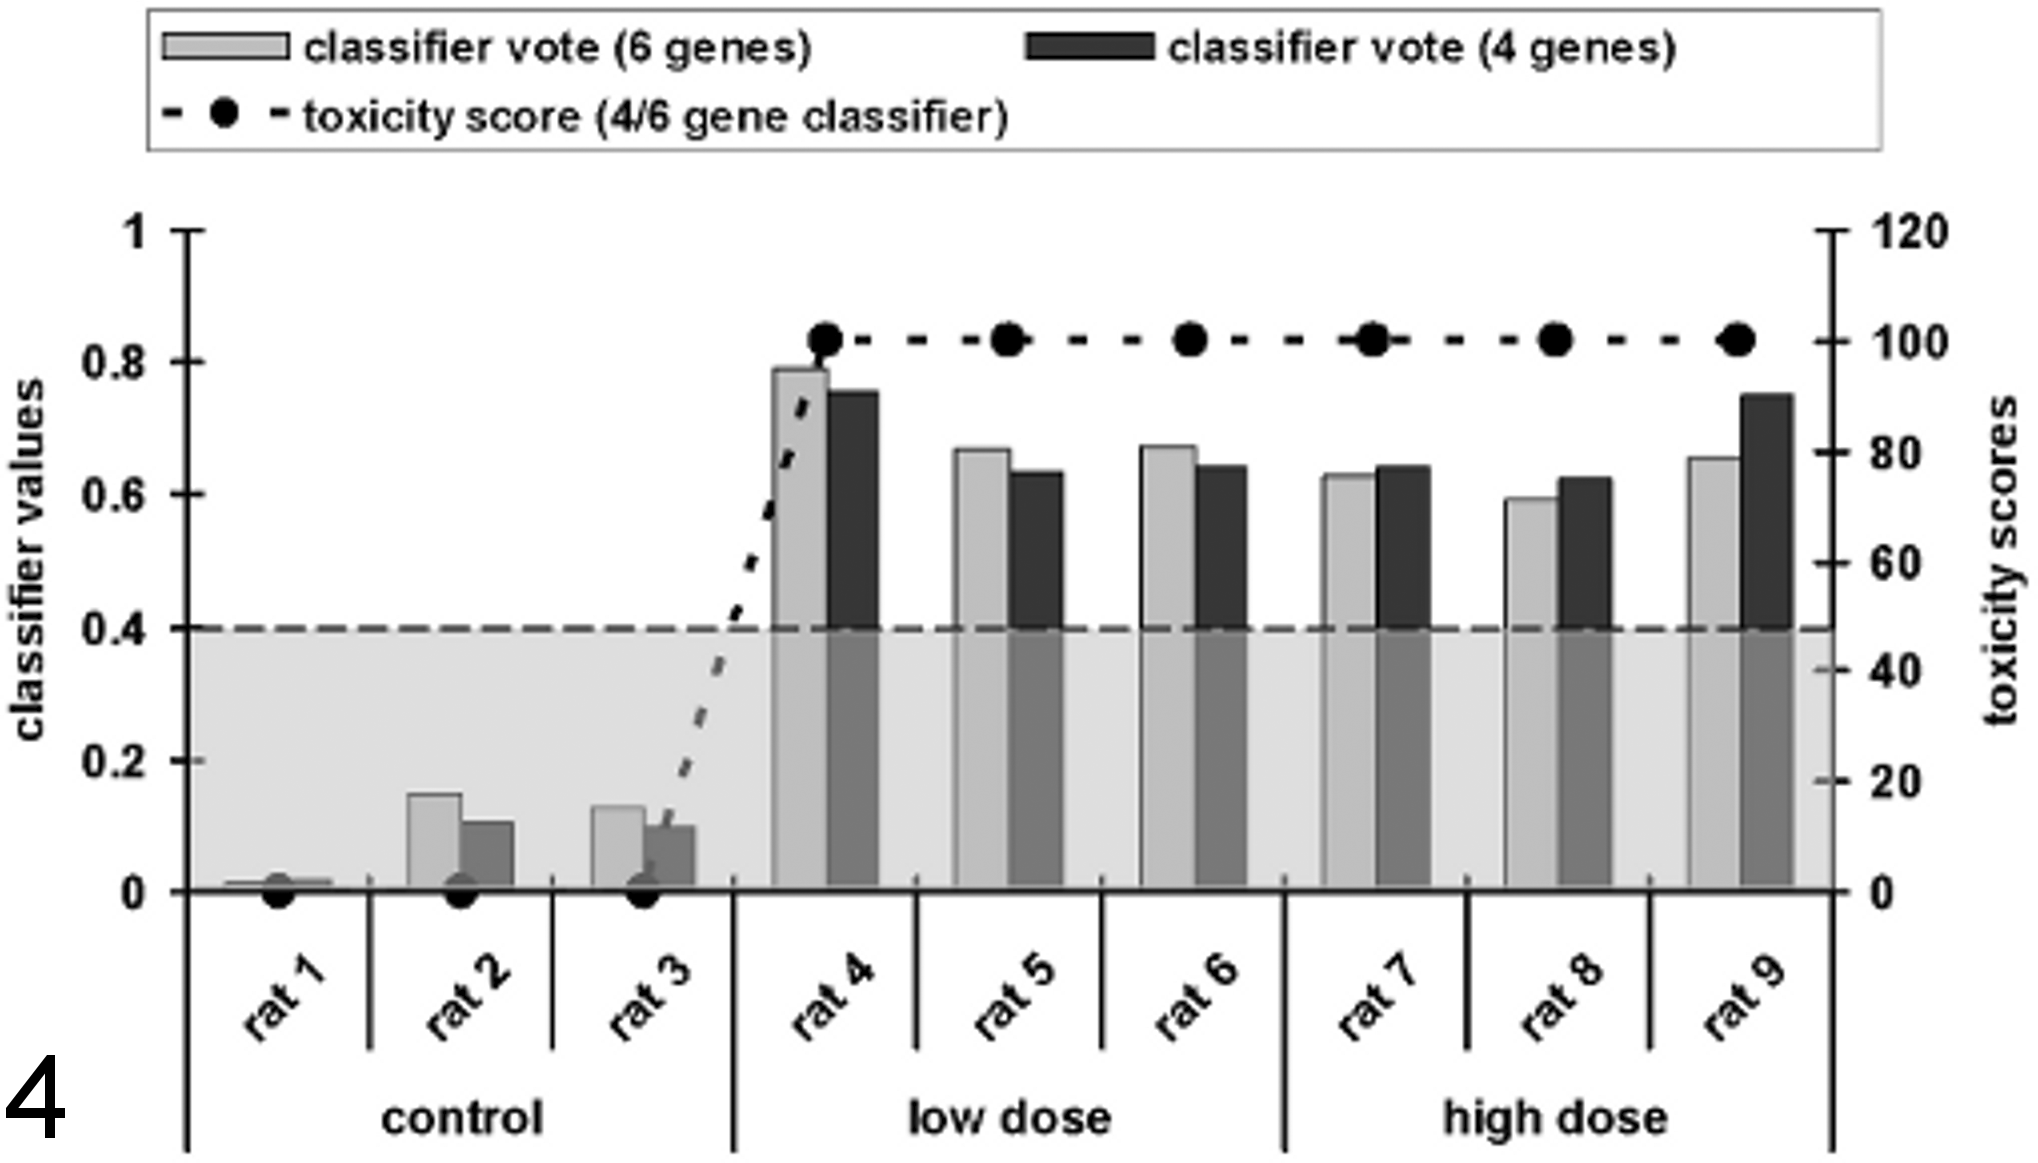
Overview of determined classification values for the 4- and the 6-gene classifier and the corresponding toxicity scores of a test set to validate the quantitative real-time polymerase chain reaction–based classification model provided by Compugen Ltd. Calculated toxicity scores based on the upregulation of cyclin G1 (Ccng1), etoposide-induced protein 2.4 (Ei24), interferon-stimulated exonuclease (Isg20), and tumor necrosis factor receptor superfamily member 12A (Tnfrsf12a) in the kidney of rats dosed with aristolochic acid for 12 days. The data were normalized to actin, beta (Actb); actin, gamma 2 (Actg2); hypoxanthin-guanin-phosphoribosyltransferase 1 (Hprt1); or tyrosine 3-monooxygenase/tryptophan 5-monooxygenase activation protein (Ywhaz) and then loaded into the Compugen classifier model. Data are presented as a toxicity score and the dependency of the classifier values of individual animals (shown as bars) and the resulting toxicity scores for the groups (shown as a dotted line). The classification cutoff value of 0.4 for the classification as toxic is shown as a broken line. The samples were derived from rats dosed with gentamycin daily for 7 days. Independently of the used classification model, the control animals were classified as 0% toxic affected, while the values derived from the low- and high-dose animals delivered a classification score of 100%.
Analysis of renal tissue of AA-acid dosed rats
Figure 5 shows that the control group of the AA-related study was classified with a toxicity score of 40% with the 6-gene classifier but only 20% by the 4-gene classifier. This means that 2 of 5 rats in the 6-gene classifier model (rats 2 and 5) and 1 rat in the 4-gene classifier model (rat 5) in this group were misclassified (Fig. 6). The mid-dose group was predicted to be nephrotoxic, with scores of 60% (4-gene classifier) and 80% (6-gene classifier) (Fig. 5). In contrast, the low dose was classified with a 20% score in both classification models. In this group, only 1 rat showed transcriptional changes in the observed transcripts, which predicted renal tubular insult (rat 7). Otherwise, the score for rat 14, an animal of the mid dose, was just below the cutoff value. However, using the 4-gene classifier, the classification score was 0.32, while the 6-gene classifier delivered a classification value of 0.39. On average, the classification scores of the 6- and 4-gene classifiers showed an increase from control (0.28/0.31) to high-dose (0.64/0.71) animals in a dose-dependent manner.
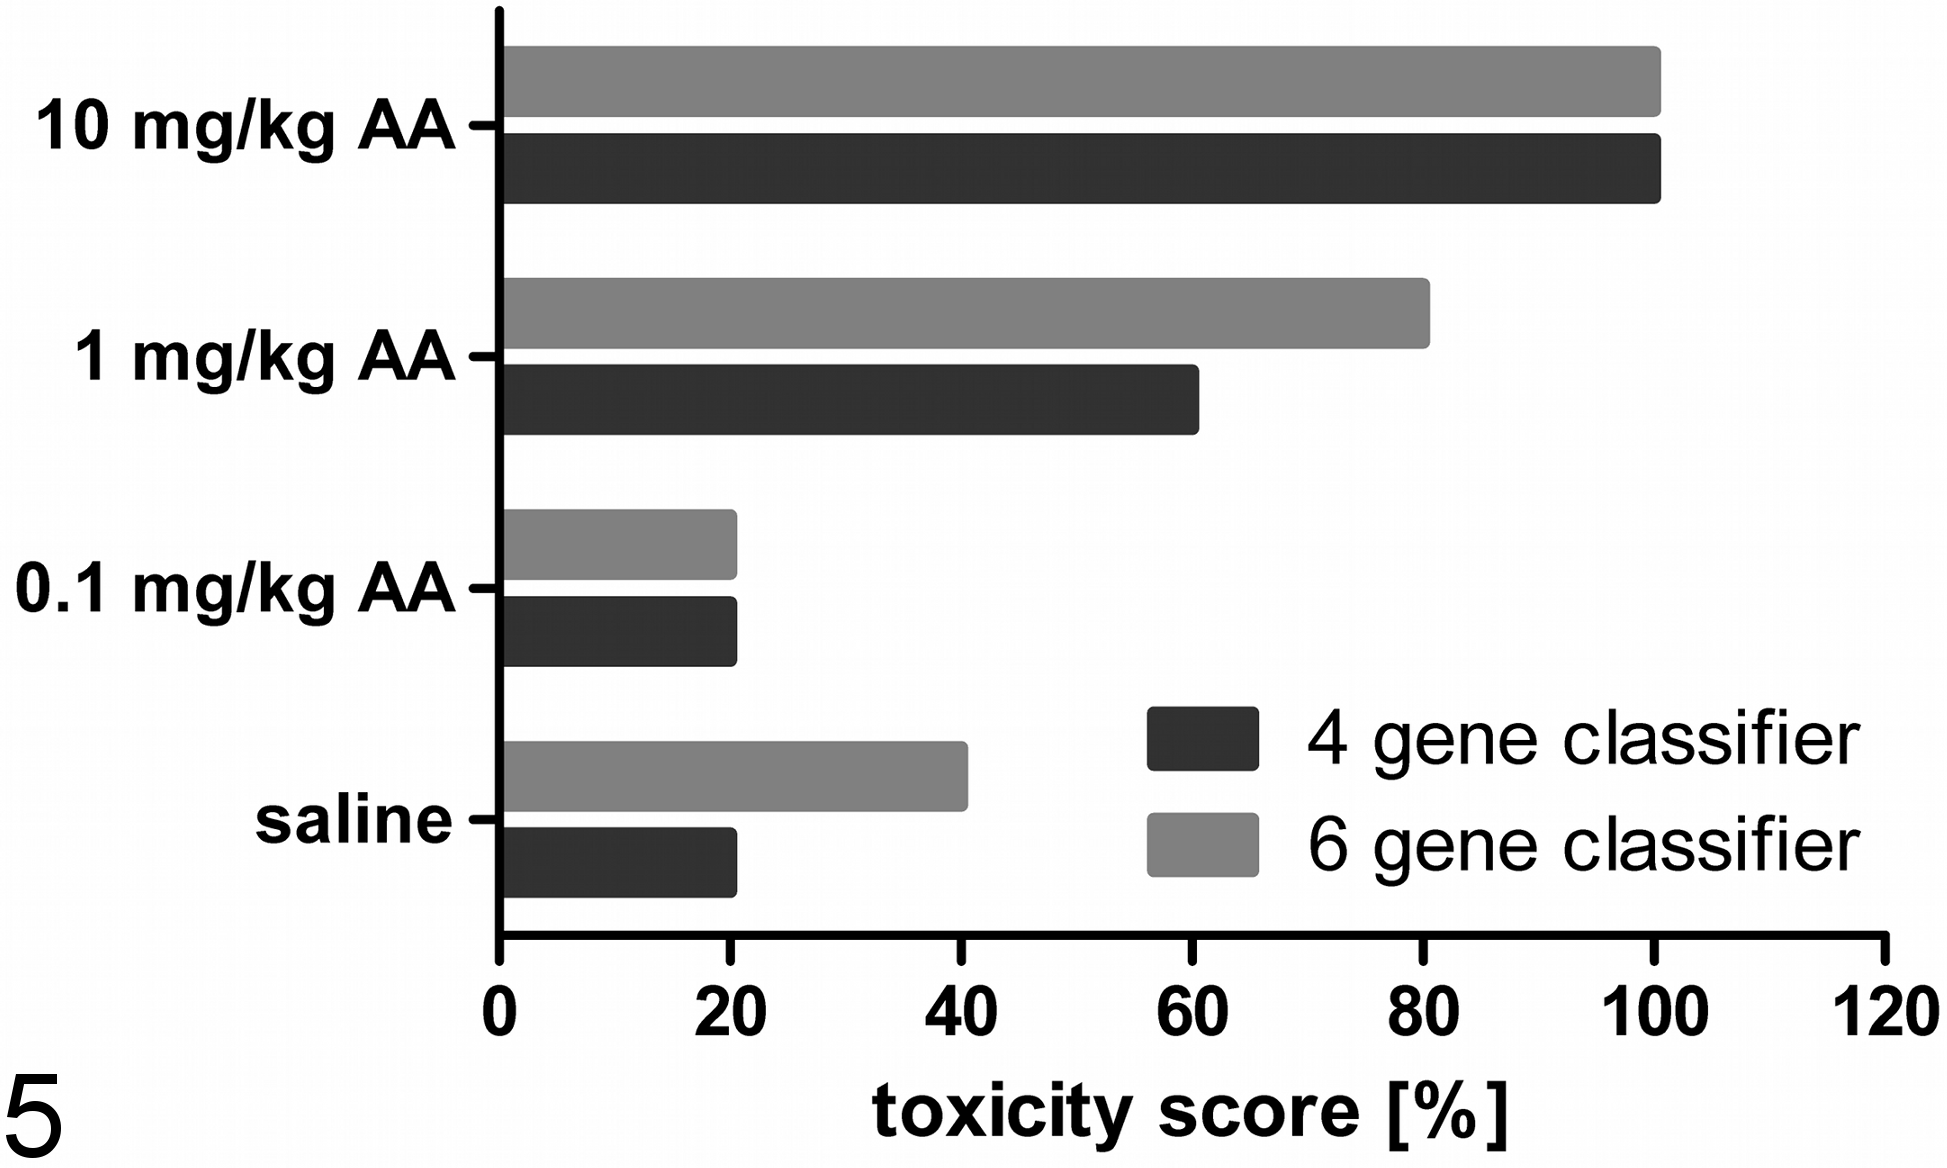
Calculated toxicity scores based on the upregulation of cyclin G1 (Ccng1), etoposide-induced protein 2.4 (Ei24), interferon-stimulated exonuclease (Isg20), and tumor necrosis factor receptor superfamily member 12A (Tnfrsf12a) in the kidney of rats dosed with aristolochic acid for 12 days. The data were normalized to actin, beta (Actb); actin, gamma 2 (Actg2); hypoxanthin-guanin-phosphoribosyltransferase 1 (Hprt1); or tyrosine 3-monooxygenase/tryptophan 5-monooxygenase activation protein (Ywhaz) and then loaded into the Compugen Ltd. classifier model. Data are presented as a toxicity score based on the number of affected vs nonaffected animals (shown as bars). Differences between the 4-gene and 6-gene classifier can be observed in the control group (20%/40%) and the mid-dose group (60%/80%). The low-dose group (20%) and the high-dose group (100%) were not affected by the used classification model.
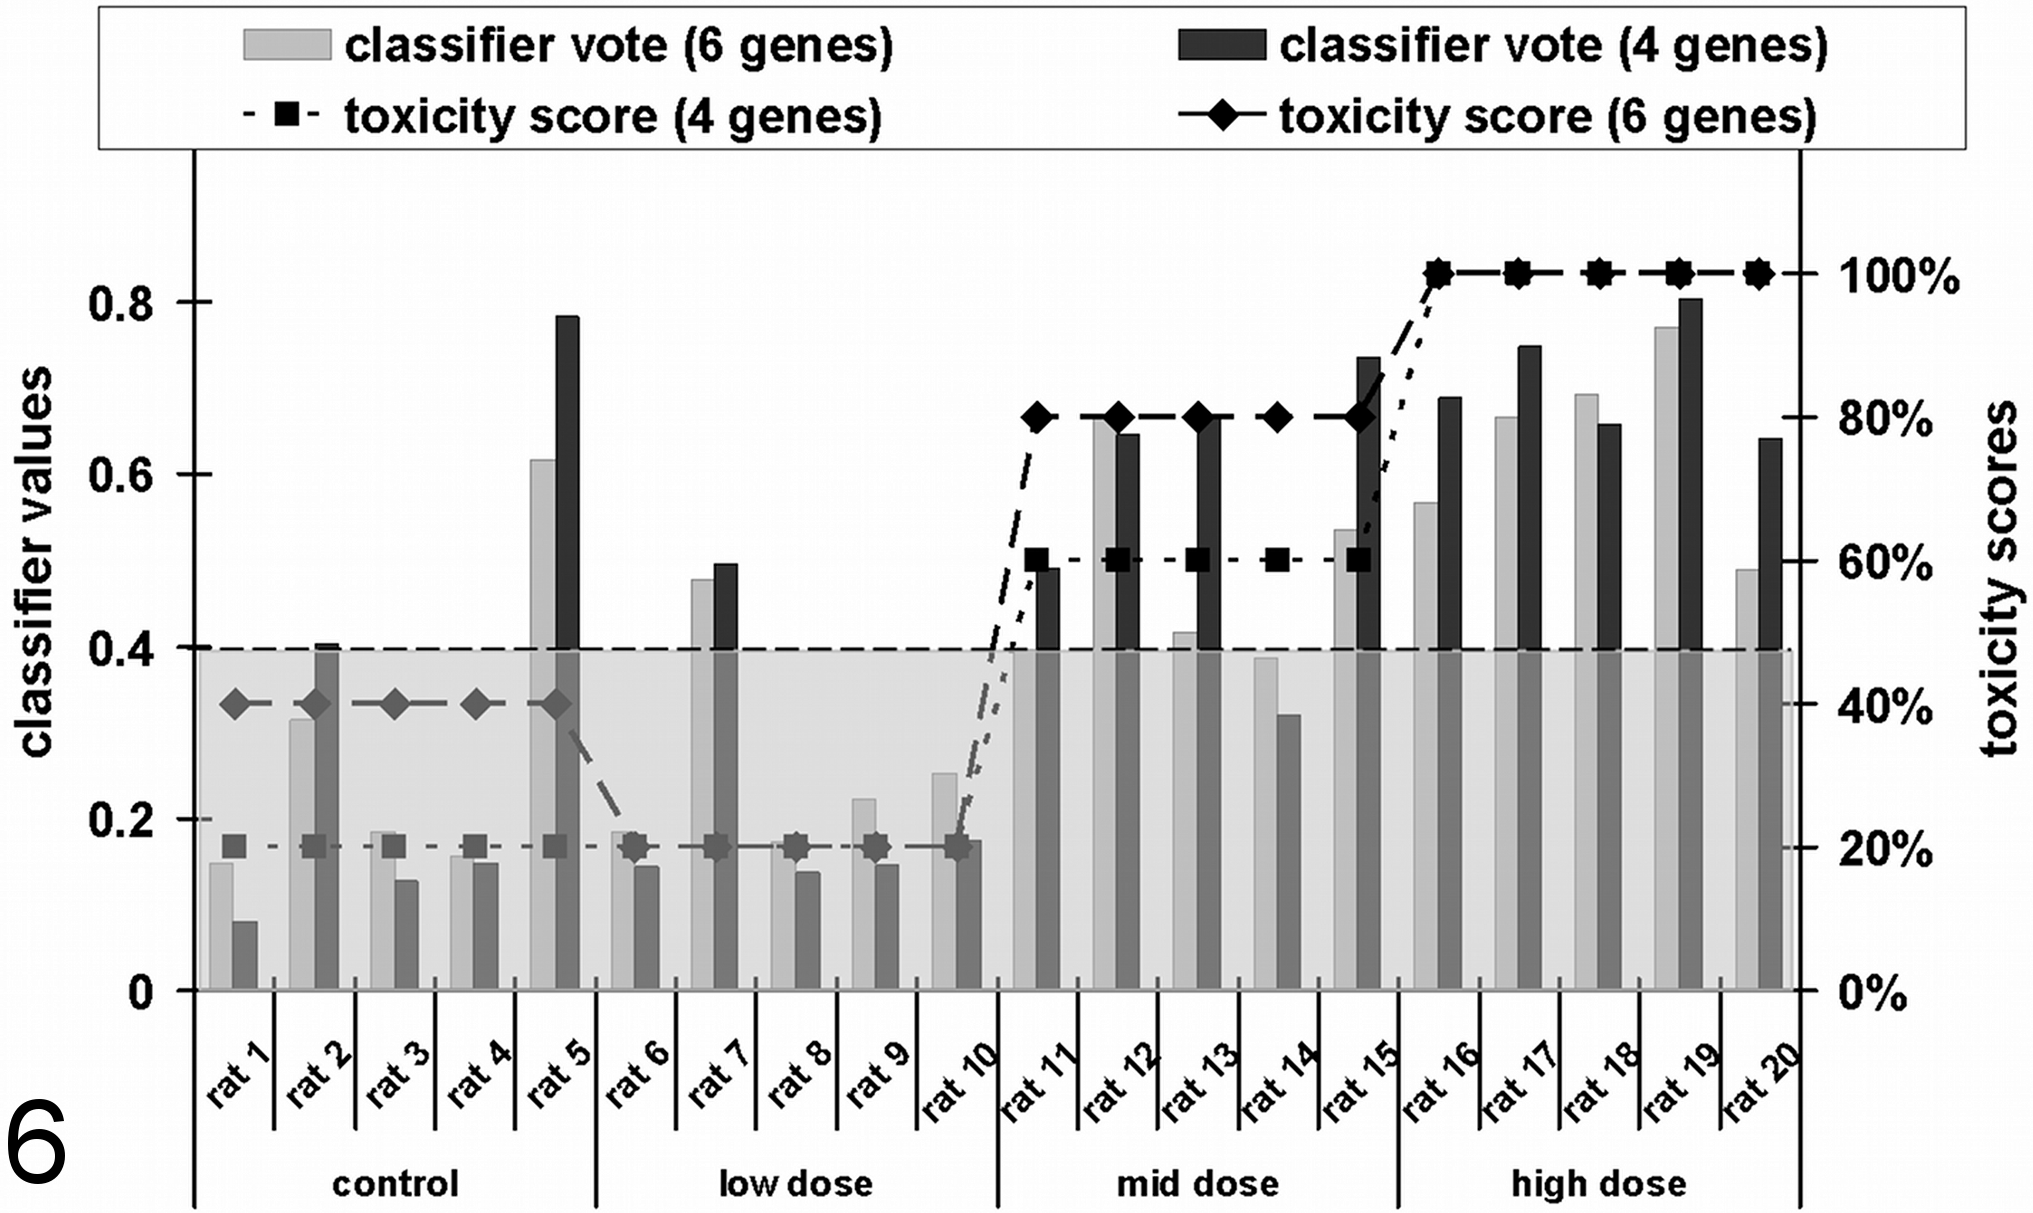
Calculated toxicity scores based on the upregulation of cyclin G1 (Ccng1), etoposide-induced protein 2.4 (Ei24), interferon-stimulated exonuclease (Isg20), and tumor necrosis factor receptor superfamily member 12A (Tnfrsf12a) in the kidney of rats dosed with aristolochic acid (AA) for 12 days. The data were normalized to actin, beta (Actb); actin, gamma 2 (Actg2); hypoxanthin-guanin-phosphoribosyltransferase 1 (Hprt1); or tyrosine 3-monooxygenase/tryptophan 5-monooxygenase activation protein (Ywhaz) and then loaded into the Compugen Ltd. classifier model. Data are presented as individual animals (shown as bars) and the resulting toxicity scores for the groups (shown as a dotted line). The classification cutoff value of 0.4 for the classification as toxic is shown as a broken line.
Analysis of gene expression pattern
Gene expression analyses were performed to investigate the mechanism underlying the renal damage induced by AA. Slight but significant changes in renal gene expression of AA-dosed animals were observed, relative to the corresponding control animals, especially for mid- and high-dose treatment groups. As shown in a principal components analysis (Fig. 7), the animals dosed with 1 (squares) and 10 mg/kg BW (plus signs) could be clearly separated from the animals dosed with the vehicle (circles) or 0.1 mg/kg BW (rhombuses). A total number of 178 genes were identified to be significantly (P ≤ .05) deregulated, with a fold-change >1.5 in at least one of the treatments. A list of the genes is shown in Table 3. Genes with unknown functions are included in a supplementary table.
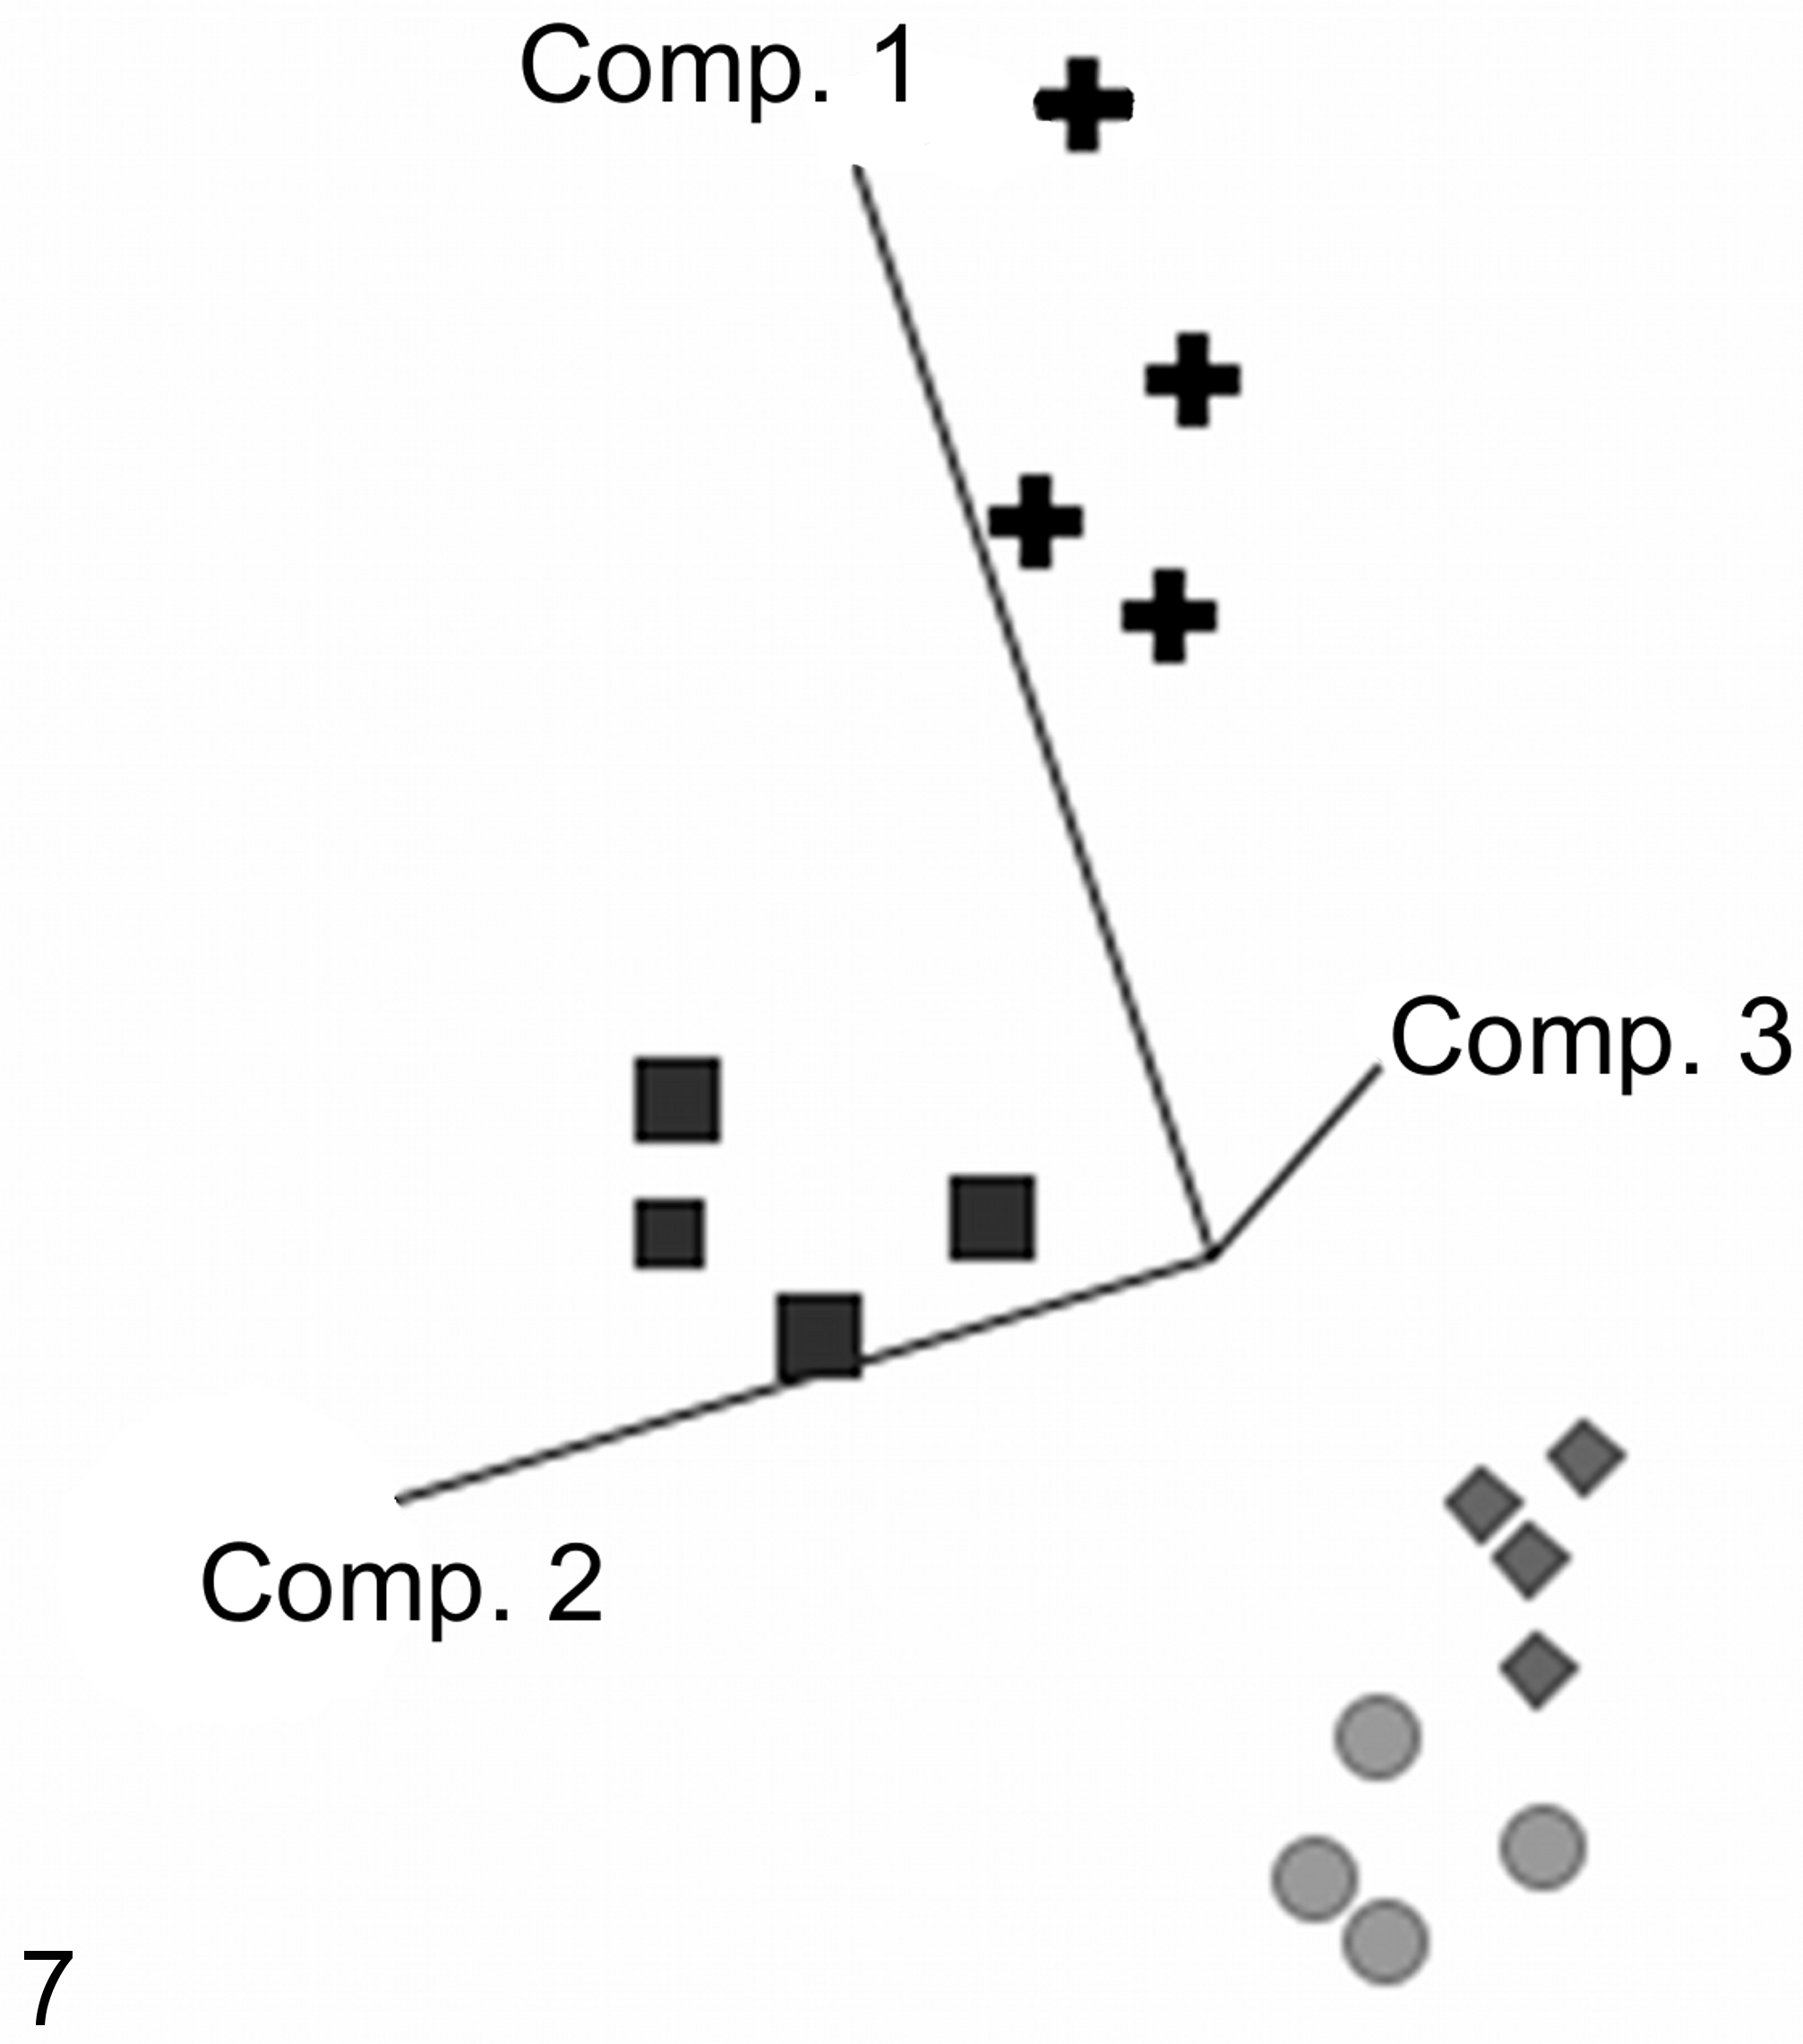
Aristolochic acid–induced dose-dependent gene expression changes. The calculated principal component analysis showed a separation of control (circles) and low-dose (rhombuses) groups from the mid-dose (squares) and high-dose (plus signs) groups along the individual components (Comp.). The mid- and high-dose groups also showed a separation from each other. The used genes were selected by a 1-way analysis of variance (P < .05).
Gene List of Significantly Deregulated Genes (P < .05) and an Threshold of Fold-Change of ±1.5 in the Kidney After Treatment With 0.1 mg/kg BW (LD), 1 mg/kg BW (MD), and 10 mg/kg BW (HD) AA Over 12 Days.
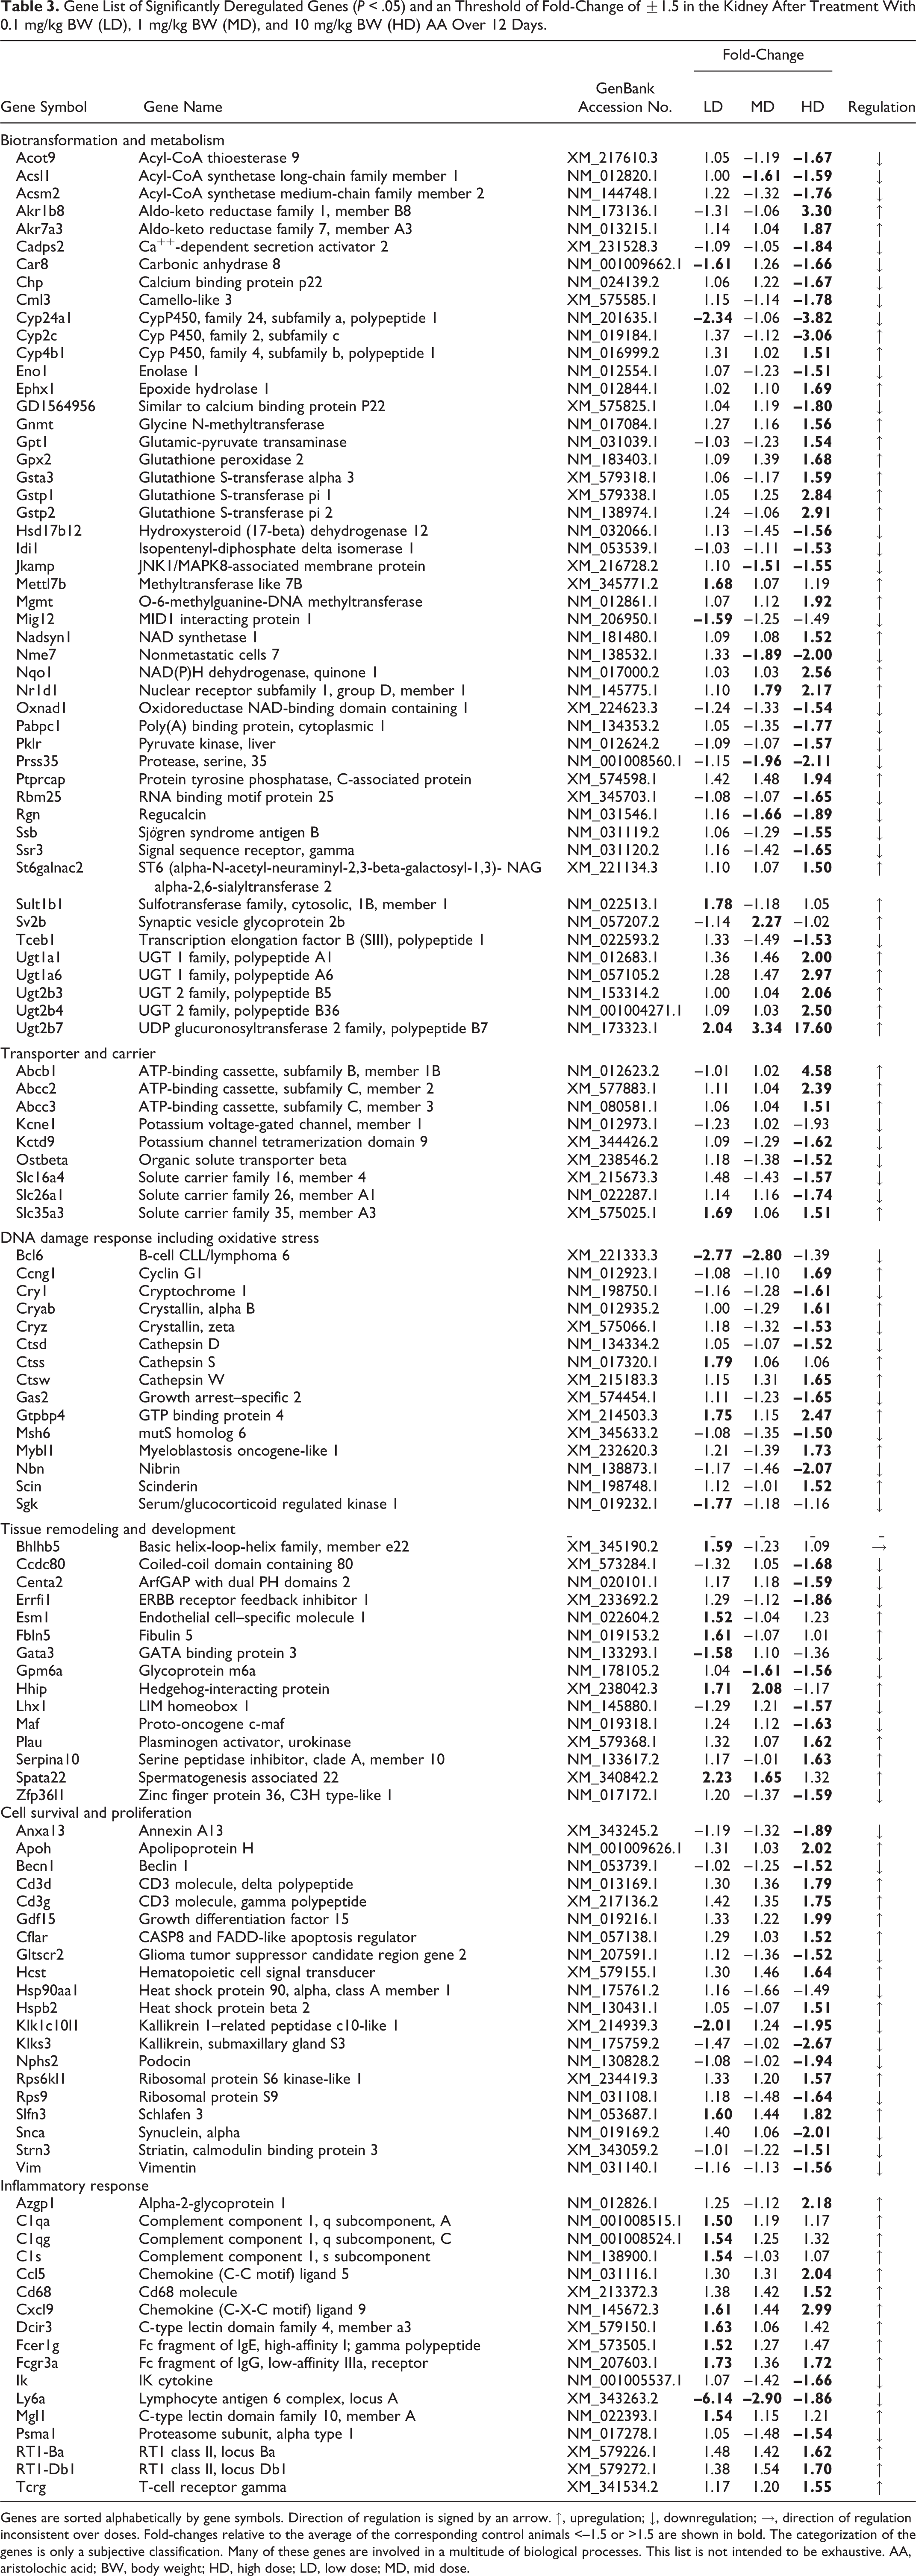
Genes are sorted alphabetically by gene symbols. Direction of regulation is signed by an arrow. ↑, upregulation; ↓, downregulation; →, direction of regulation inconsistent over doses. Fold-changes relative to the average of the corresponding control animals <–1.5 or >1.5 are shown in bold. The categorization of the genes is only a subjective classification. Many of these genes are involved in a multitude of biological processes. This list is not intended to be exhaustive. AA, aristolochic acid; BW, body weight; HD, high dose; LD, low dose; MD, mid dose.
Several genes are mechanistically linked to cancer induction and tumor formation. For example, NAD(P)H:quinone oxidoreductase (Nqo1) is reported to be directly involved in the bioactivation of AAI and subsequent AAI-DNA adduct formation and is increased after high-dose treatment. 43 In addition, Ccng1 (1.7), Ephx1 (1.7), Mybl1 (1.8), Mgmt (1.9), and Gdf15 (2.0) are involved in the development of cancer by multiple pathways. Genes involved in drug metabolism, especially the group of glucuronyltransferases (UGTs), including UGT1A1 (2.0), UGT1A6 (3.0), UGT 2B4 (2.5), and UGT2B7 (17.6), were induced. Transporter genes also showed significant deregulation, for example, Abcb1b (4.6), Abcc2 (2.4), Abcc3 (1.5), Slc26a1 (–1.7), and Slc35a3 (1.5). Several genes important for T-cell development, such as Cd3g (1.8), Cd3d (1.8), and Cflar (1.5), and the chemotaxis of T lymphocytes, such as Ccl5 (2.0) and Cxcl9 (3.0), showed an alteration in their expression values. Several of these deregulated genes have been described as being associated with proximal tubular damage. 16,25,29 The dose-dependent changes of potentially promising exploratory biomarker genes are shown in Fig. 7.
Discussion
In this study, several novel urinary and transcriptional kidney biomarkers were investigated to test their ability to predict AA-induced kidney injury. The data demonstrated that the urinary protein biomarkers were limited in their applicability for the early prediction of kidney injury caused by AA. Several markers did show a time- and/or dose-dependent increase (eg, β2-microglobulin and osteopontin). However, significant changes were observed only in a limited number of animals. Lipocalin 2 appeared to be the best predictive marker, detectable even when no morphological kidney damage was observable. However, it is important to note that urinary detection of lipocalin 2, an acute phase protein involved in the innate immune response and acute inflammatory responses, may occur in response to systemic inflammation or tissue damage at other sites than the kidney. 7,9 In this study, gastrointestinal and esophageal inflammation was observed, which may be responsible for the increased excretion of lipocalin 2.
Calbindin D-28K showed no changes except a significant decrease after 12 days in the high-dose group. Similar results were reported for the developmental pharmaceutical compound BI-3 (3-pyrrolidineacetic acid, 5-[[[4′-[imino[(methoxycarbonyl) amino]methyl] [1,1′-biphenyl]-4-yl]oxy]methyl]-2-oxo-methyl ester, (3S-trans)). 15 Currently, the involvement of Ca2+ in the development of renal damage is not yet completely understood. However, a decrease was observed in all animals, independent of the treatment time. It is known that a high amount of intracellular Ca2+ leads to increased tubular damage, 2 and the fact that no histopathological changes were observed suggests that cellular death has not yet begun, potentially because of the buffering potential of calbindin D-28K. So it is possible that calbindin D-28K is not a direct biomarker for renal damage per se, but it does have a strong link to the cellular mechanism of Ca2+ homeostasis within the kidney. Slight but significant changes in the expression of mRNAs correlating to some of the urinary protein biomarkers (i.e., Kim-1, Timp-1, and lipocalin 2) were also observed in the kidneys of the high-dose animals, using qRT-PCR methods (data not shown). Similarly, an increase in gene expression of Kim-1 was also detectable by whole-genome profiling via Illumina microarray, albeit with P values above .05.
The prediction of a developing AA-induced kidney injury with a small set of transcriptional biomarkers was successful and seen even before histopathological alterations manifested. The relatively high toxicity scores of the control group of 20% (4 genes) or 40% (6 genes) were due to the positive classification of 1 of 2 of the 5 animals. Only 1 of these 2 animals showed a high classification score, while the second was borderline. In the low-dose group, only 1 rat showed prediction of renal damage. The mid- and high-dose samples were increasingly classified as nephrotoxic. This dose-dependent increase, independent of the used classifier, delivered additional information about the robustness of this early prediction. Subsequently, the measured values of the gentamicin study (where clear histopathological findings were observable) delivered similar classification scores for the affected and nonaffected animals. 15 This result highlights the benefit of transcriptional biomarkers, especially in the early stages of developing kidney damage. In this investigation, changes in gene expression were observed much earlier than any increase in urinary marker proteins. These data suggest that the 4-gene classifier delivered comparable results to the 6-gene classification model. However, the 4-gene classifier seems to be less sensitive and in this case more specific than the 6-gene classifier due to a lower misclassification rate. Further investigations are needed using more nephrotoxins, as well as nonnephrotoxic compounds, to validate the utility of these transcriptional biomarkers.
In addition to the transcripts included in the panel provided by Compugen Ltd., several putative marker genes were detected by whole-genome profiling. These markers (Fig. 8) also predicted the nephrotoxic potential of even low doses of AA. A decrease of regucalcin (Rgn), a regulator of intracellular calcium, was previously observed after cisplatin, fluoromethyl-2,2-difluoro-1-(trifluoromethyl)vinyl ether (compound A), ochratoxin A, and cephaloridine induced renal damage. 16,21,24 CatepsinS (Ctss) showed an increase only after treatment with 0.1 mg/kg BW AA but not with higher doses. Ctss has been reported to be involved in several procarcinogenic pathways leading to DNA injury, tumorigenesis, and tumor proliferation. Gstp1/Gstp2 and Gsta3, described as putative markers for kidney damage, showed a strong increase only after high-dose treatment (10 mg/kg BW). 10,47,54 This again shows that after repeated administration of AA-specific detoxification, mechanisms were induced to prevent damage. In humans, CYP2C9 is reported to be the major AA-metabolizing enzyme, beside CYP1A1 and CYP1A2, which also have a robust AAI demethylating activity. 36 Acetyl-CoA-acyltransferase (Acaa1) was also reported to predict renal insult induced by different nephrotoxic compounds, including cadmium. 29 The fact that several drug-metabolizing enzymes, such as α-GST and π-GST, were also included into the urinary biomarker panel shows the important role of this class of enzymes in acute drug-induced tissue responses and in their potential to detect acute cellular changes. 32 The lack of detection at the protein level highlights the importance of transcriptional biomarkers for the early prediction of adverse effects.
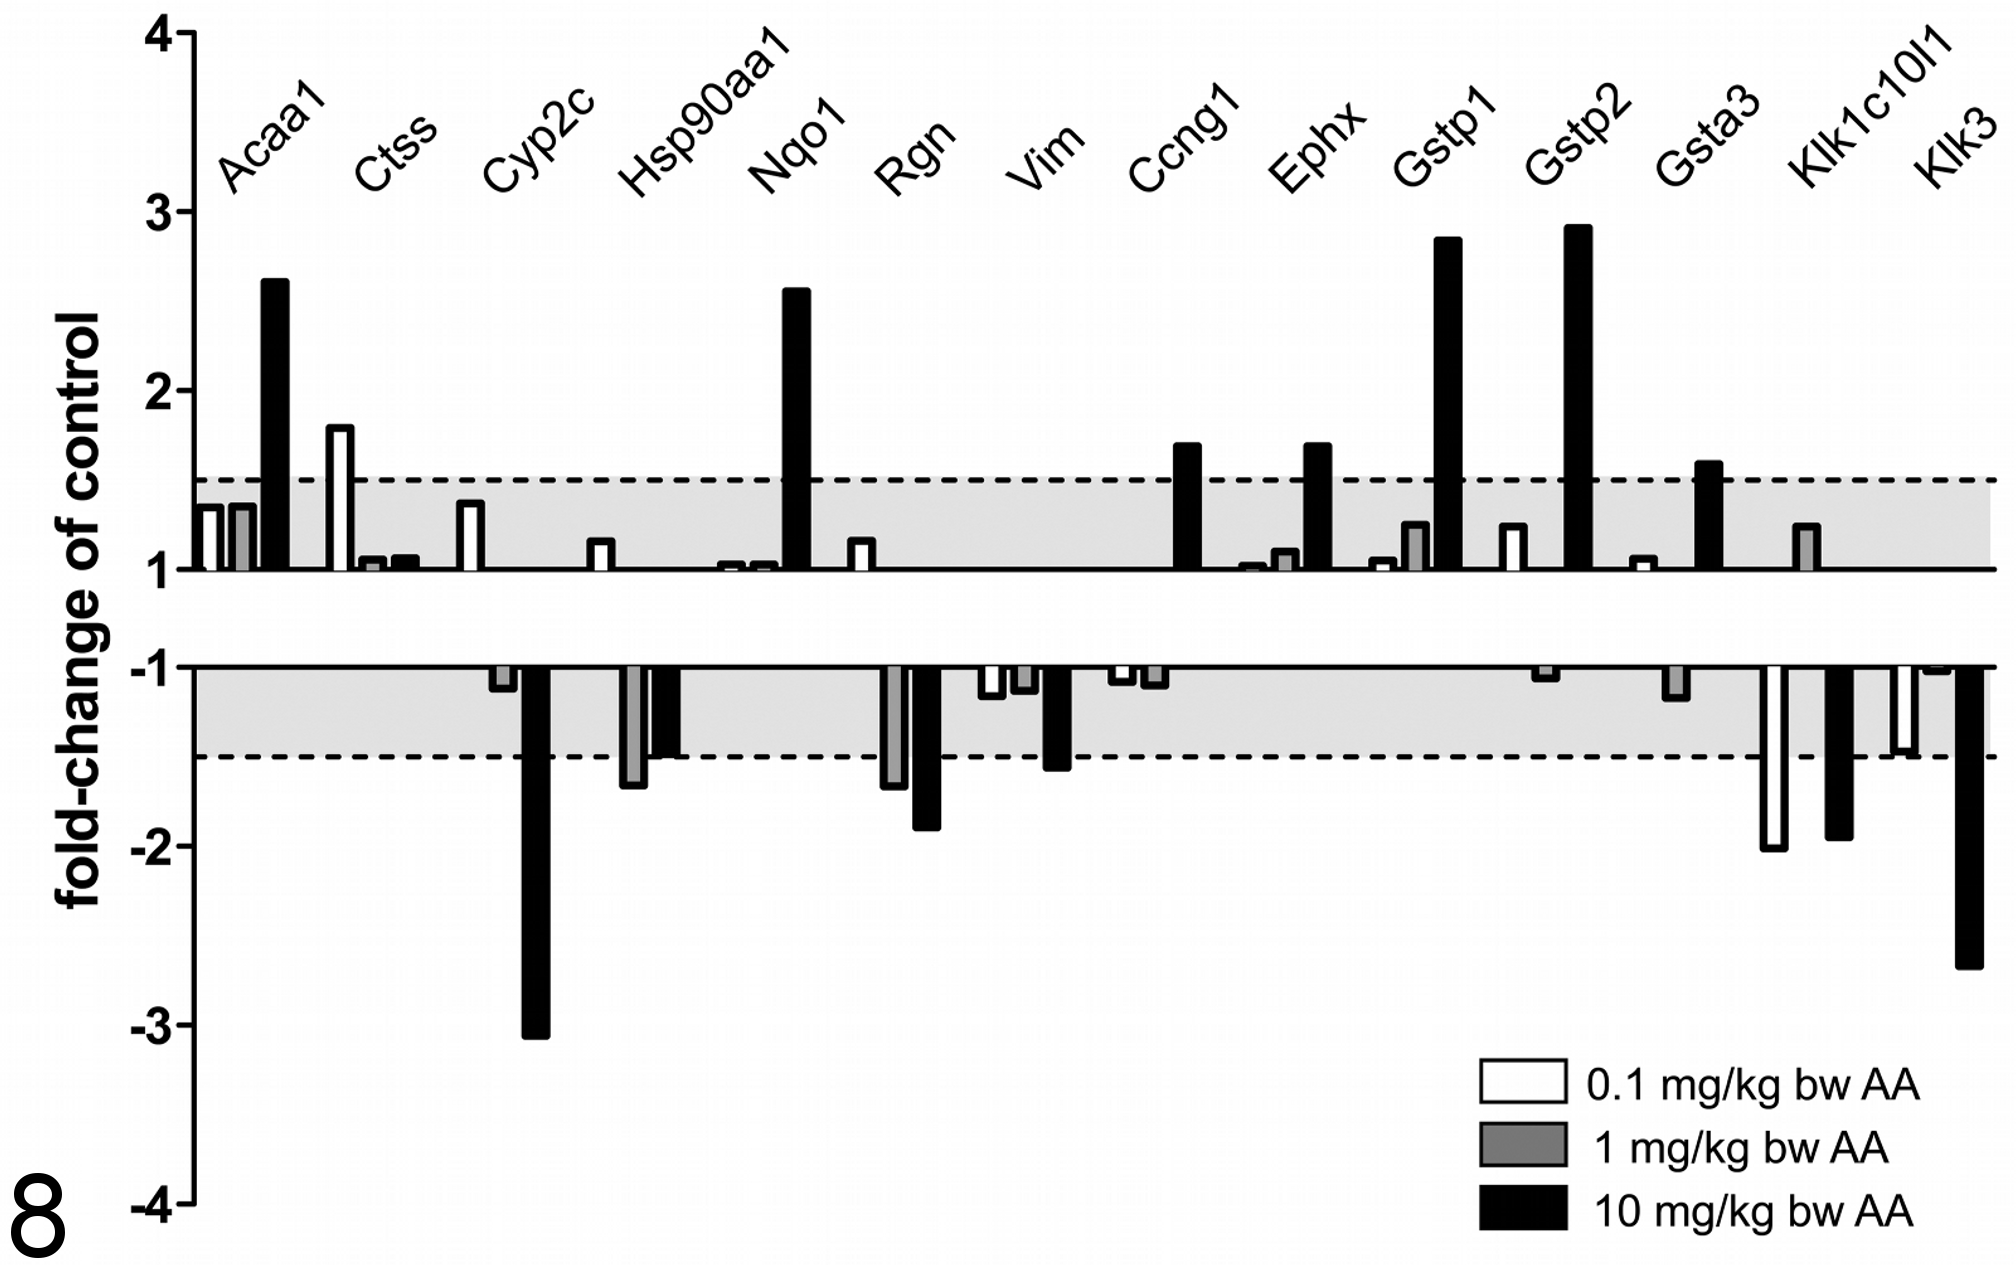
Fold-regulation, compared with the control group, of putative, transcriptional biomarkers. The range between –1 to –1.5 and 1 to 1.5 is shown in light gray. Genes >1.5 or <–1.5 were assumed to be deregulated. Most of the markers, such as Acaa1, Nqo1, Gstp1/2, and Gsta3, showed a deregulation only at the high dose. Hsp90aa1 and Rgn showed a decrease in the mid-dose group. Kalikrein-related peptidases (Klk1c10l1 and Klk3) showed significant decreases in the low- and high-dose animals but not at the mid dose. AA, aristolochic acid.
Vimentin, a promising marker for acute and chronic renal damage, showed a slight but significant decrease (1.6-fold) at the transcriptional level after treatment with 10 mg/kg BW. 34,48 Vimentin is a cytoskeletal component responsible for maintaining cell integrity 11 and is attached to the nucleus, endoplasmic reticulum, and mitochondria to support various cellular transport functions. 20,37 It is likely that the decrease of vimentin indicates an ongoing subcellular insult at the organelle and cytoskeleton levels, which was not seen at the histopathological level. CyclinG1 (Ccng1) has been shown in several studies to be upregulated independently of the technology or the tested compound. 22,31,46 In addition, Compugen Ltd. identified this marker and included it into its predictive classification model. 51,53 Urinary kallikrein excretion (UKE), often used as synonym for the kallikrein and kallikrein-related peptidase (Klk) family containing 15 serine proteases, is known to show a decrease 10 days after a single injection of cisplatin. 30 Kallikrein 3–related peptidase (Klk3) and kallikrein 1–related peptidase c10-like 1 (Klk1c10l1) showed a decrease, even at the lowest dose of AA at the transcriptional level. In addition, kallikrein-related peptidases are under investigation as predictors of renal cell carcinoma. 49
The transcriptional response to AA treatment was dominated by a group of Nrf2-regulated drug-metabolizing enzymes (eg, Nqo1, Afar, Ephx1, several UGTs and GSTs, and transporters) (Fig. 9). Although induction of Nrf2-responsive genes is generally viewed as a means to increase the cells’ capacity for detoxication, it is important to note that Nqo1 has also been implicated in the bioactivation of AA. 40,41 Thus, oxidative stress or reactive metabolite–driven induction of Nrf2 may enhance the formation of AA-derived reactive metabolites over time and dose.
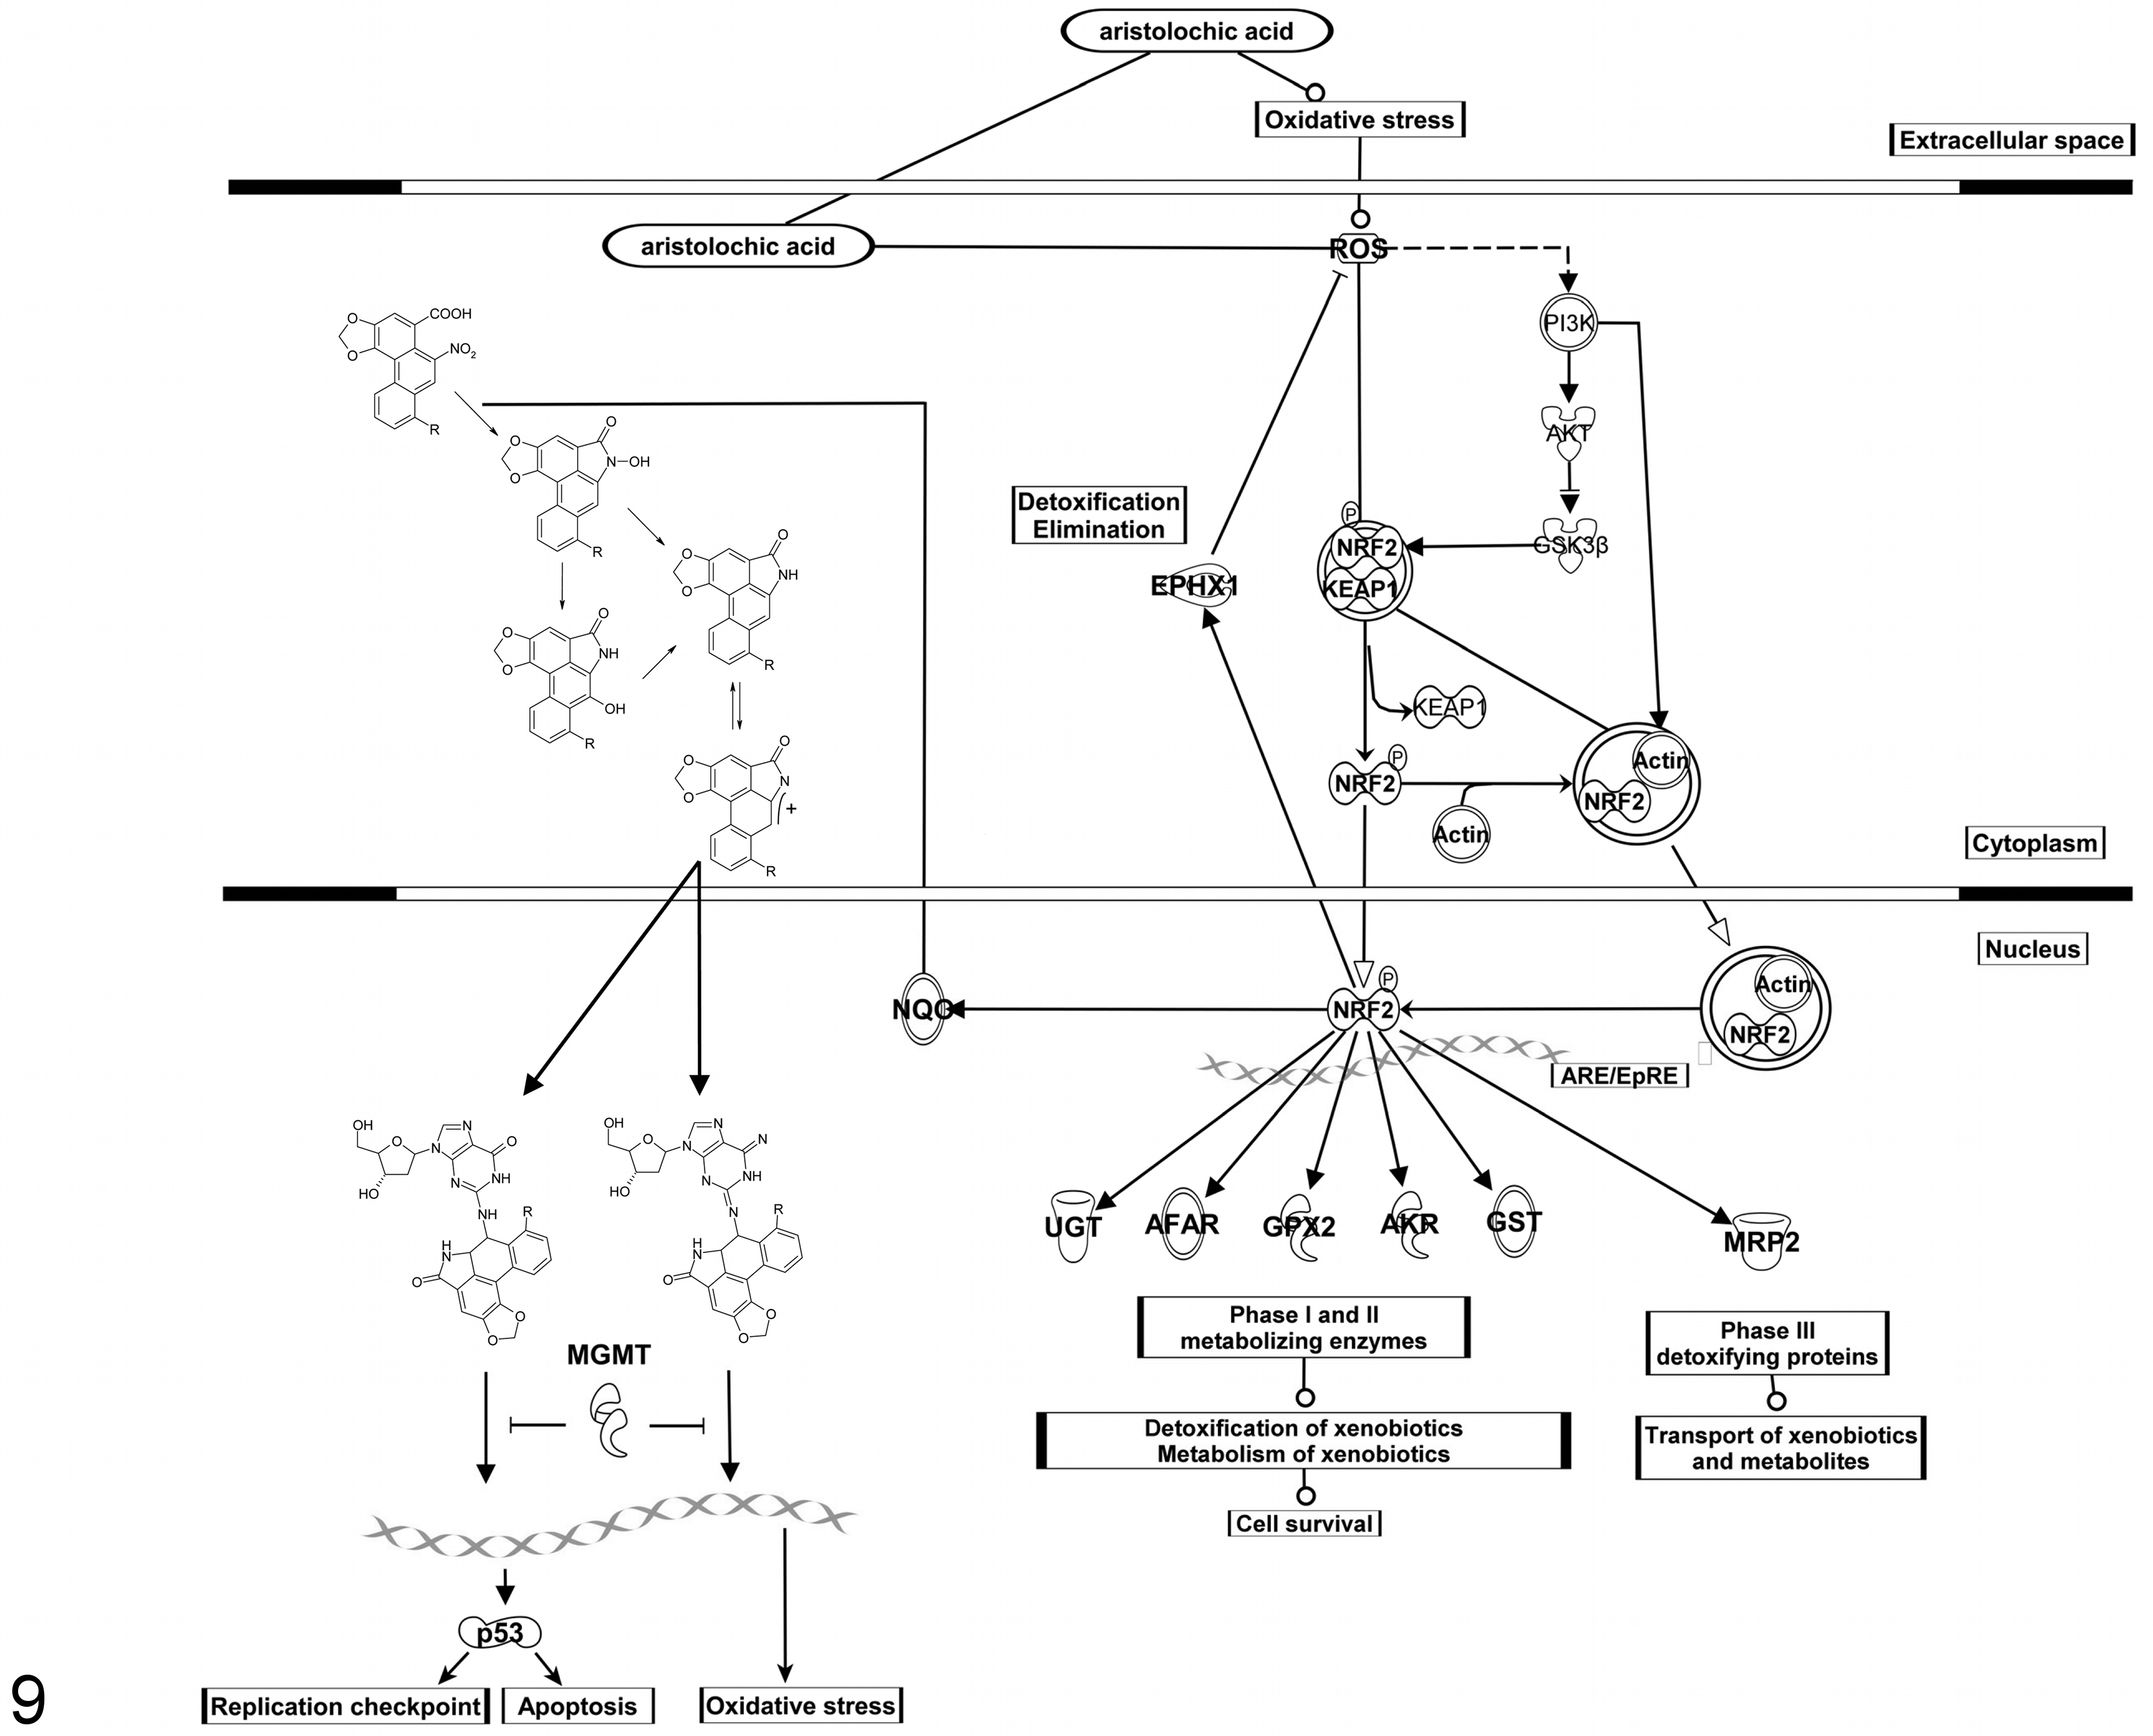
Hypothesis of the underlying mechanism of aristolochic acid (AA)–induced response in renal tissue. Shown is the toxification process of AA to the reactive metabolite, a cyclic nitrenium ion, by the NAD(P)H:quinone oxidoreductase (Nqo1) and the resulting DNA adducts. 39 –42 A reactive metabolite oxidative stress-driven response leading to Nrf2-mediated signaling and the induction of Nrf2-regulated genes such as Nqo1, Ephx1, GSTs, UGTs, and Mgmt.
The detoxification process of AA, catalyzed by several glucuronyltransferases, has been reported. 23,38 The transcriptional increase in multiple members of the UGT family suggests an increased potential for detoxification. These adaptive changes could be the reason for the low response with the urinary protein biomarkers and the lack of histopathological findings. In contrast, reactions catalyzed by cellular nitroreductases or oxidoreductases, such as Nqo1, generate reactive intermediates that form covalent AA-DNA adducts. 40 It is likely that a longer treatment period with doses used in the current study or higher doses of AA would eventually exhaust the phase II UGT system, leading to the buildup of potentially toxic metabolites. In addition, a switch between these 2 metabolism pathways, by induction of cellular reductases, and further procarcinogenic pathways could be envisaged.
Several of the increased transcripts encode for proteins/enzymes involved in the mechanism of AA-mediated renal tubular insult and carcinogenicity. It was shown that rats dosed with the same doses of AA as used in this study over 3 months showed a 28% increase of AA-induced tumor formation in the kidney. 26 In this study, whole-genome expression profiling suggested perturbations at the gene expression level, which strongly relate to carcinogenic outcomes, even after 12 days’ treatment of 1 mg/kg BW of AA.
Conclusion
In this study, the potential of novel transcriptional-based biomarkers and bioinformatic-based approaches for the early prediction of AA-induced renal damage could be shown. However, there is a need especially for transcriptional biomarkers, which appear to be more predictive at very early stages of organ damage, to further qualify and validate these markers. Because of the complexity of kidney injury, it appears that more than the 10 urinary protein markers (eg, as included in the WideScreen Rat Kidney Toxicity assays) assessed in this study will be required for the early prediction of AA-induced renal damage in rats. Ideally, a combined testing strategy should be implemented, based on very early predictive transcriptional biomarkers (eg, Compugen qPCR assay) and a large panel of urinary protein biomarkers that can provide early in-life data during later stage animal studies. 5,44 Whole-genome analysis for the identification of novel biomarkers as well as the discovery of the underlying mechanism represents an important tool for the toxicological evaluation and safety assessment of new molecules.
Footnotes
Acknowledgements
We are grateful to G. C. Hard for histopathological evaluation of tissue sections and to D. Hoffmann and M. Sieber for providing biological samples. In addition, we thank Yaron Kinar and Tanja Pergam for their work on setting up the RT-qPCR protocol and the classifier of RT-qPCR results.
Declaration of Conflicting Interests
The author(s) declared no potential conflicts of interest with respect to the research, authorship, and/or publication of this article.
Funding
The author(s) received no financial support for the research, authorship, and/or publication of this article.
References
Supplementary Material
Please find the following supplemental material available below.
For Open Access articles published under a Creative Commons License, all supplemental material carries the same license as the article it is associated with.
For non-Open Access articles published, all supplemental material carries a non-exclusive license, and permission requests for re-use of supplemental material or any part of supplemental material shall be sent directly to the copyright owner as specified in the copyright notice associated with the article.