
Abstract
Objective
To estimate the prevalence, severity, awareness, and clinical correlates of diabetic retinopathy among adults with type 2 diabetes living at very high altitude in Tibet.
Methods
This cross-sectional, community-based subanalysis used prospectively collected data from the China National Diabetic Chronic Complications Study data. Adults with physician-diagnosed type 2 diabetes from three Tibet sites (3650–4300 m) with ≥1 gradable nonmydriatic fundus photograph were included (N = 320). Diabetic retinopathy was centrally graded using the International Clinical scale. Vision-threatening diabetic retinopathy was defined as severe nonproliferative or proliferative diabetic retinopathy. Kidney indices included the urinary albumin-to-creatinine ratio and estimated glomerular filtration rate. Parsimonious multivariable logistic regression (complete-case n = 318) was used to evaluate correlates of any diabetic retinopathy.
Results
The prevalence of any diabetic retinopathy was 16.6% (95% confidence interval: 12.9–21.0), whereas vision-threatening diabetic retinopathy was observed in 4.4% of participants (95% confidence interval: 2.6–7.2). Diabetic retinopathy was predominantly nonproliferative, and proliferative diabetic retinopathy was rare (0.3%). Only 36.5% of participants with diabetic retinopathy reported prior awareness. Higher urinary albumin-to-creatinine ratio and estimated glomerular filtration rate <60 mL/min/1.73 m2 were independently associated with diabetic retinopathy, whereas glycated hemoglobin was not significant after adjustment.
Conclusions
In community-dwelling Tibetans with type 2 diabetes living at very high altitude, diabetic retinopathy is common, awareness is low, and markers of kidney damage are strongly associated with diabetic retinopathy, supporting integrated retinal–renal screening.
Keywords
Introduction
The global burden of type 2 diabetes mellitus (T2DM) continues to increase. The International Diabetes Federation estimates that 589 million adults were living with diabetes in 2024, with projections rising to 853 million by 2050, underscoring the urgent need to prevent and manage diabetes-related complications. 1 Diabetic retinopathy (DR) is a common microvascular complication of diabetes and a major cause of vision impairment in working-age adults. 2 Despite the availability of effective strategies, including risk factor control, systematic screening, and timely laser or intravitreal anti–vascular endothelial growth factor (VEGF) therapy, DR continues to contribute substantially to preventable vision loss. 3
China bears a particularly large and rapidly evolving diabetes burden. In a nationally representative survey (2013–2018), the estimated prevalence of diabetes in China reached 12.4%; however, awareness and treatment rates remained suboptimal, thereby highlighting persistent gaps in risk factor management at the population level. 4 For DR in particular, a recent nationwide prevalence survey using standardized fundus imaging reported that 16.3% of adults with diabetes had DR and 3.2% had vision-threatening DR (VTDR), with marked regional variation. 5 However, very high-altitude regions and Tibetan populations remain underrepresented in population-based DR studies, limiting generalizability and leaving a clinically important evidence gap for communities living under extreme environmental conditions.
Very high altitude is characterized by chronic hypobaric hypoxia and distinctive co-exposures. Globally, an estimated 14.4 million people live at ≥3500 m, illustrating that residence at very high altitude is not rare and has substantial public health relevance. 6 Tibet represents one of the world’s highest inhabited regions. Analyses based on national health service surveys indicate that high-altitude (3500–5000 m) and extreme-altitude (>5000 m) areas account for 93.69% of Tibet’s land area, reflecting the pervasive high-altitude living environment in this setting. 7 In addition, ultraviolet (UV) exposure increases with altitude because a thinner atmosphere absorbs less UV radiation, potentially enhancing oxidative stress burden. Lifestyle patterns may also differ; for example, Tibetan dietary practices have been reported to include high salt intake (e.g. traditional salty butter tea), which may influence blood pressure and vascular risk. 8
These high-altitude exposures provide a strong biological rationale for hypothesizing altered susceptibility to microvascular disease phenotypes, including DR. Chronic hypoxia activates oxygen-sensing pathways and can stabilize hypoxia-inducible factors (HIFs) (e.g. HIF-1α), thereby reshaping transcriptional programs involved in angiogenesis, inflammation, and vascular permeability. In the retina, these signaling cascades intersect with pathways implicated in DR progression and neovascular complications.9,10 In parallel, accumulating evidence places oxidative stress and endothelial dysfunction at the core of DR pathogenesis, and hypoxia can act synergistically with hyperglycemia and inflammatory mediators to amplify mitochondrial-related and nicotinamide adenine dinucleotide phosphate reduced (NADPH) oxidase–related reactive oxygen species generation. These mechanisms provide plausible links connecting the high-altitude environment to microvascular injury.11,12 Collectively, these considerations underscore the need for high-altitude–specific epidemiologic analyses that move beyond description toward hypothesis generation regarding how environmental stressors may modulate microvascular complication risk.
Kidney involvement, routinely assessed using reduced estimated glomerular filtration rate (eGFR) and elevated urinary albumin-to-creatinine ratio (UACR), is a complementary marker of systemic microvascular injury and often co-occurs in patients with DR and diabetes. Understanding retinal–renal co-phenotyping is therefore clinically meaningful for developing integrated screening strategies, particularly in settings where healthcare resources are limited and case detection is challenging. To address this knowledge gap, the China National Diabetic Chronic Complications Study was established as a large multicenter survey to characterize major chronic complications of diabetes at the national level using standardized protocols. 13 The present study is a dedicated subanalysis focusing on community-based participants with T2DM living in high-altitude Tibetan communities, with the following objectives: (a) to estimate the prevalence and severity distribution of DR and VTDR; (b) to assess awareness of DR; and (c) to examine associations between DR and kidney indices (eGFR and UACR) as well as other cardiovascular risk factors. By providing the first detailed community-based characterization of DR together with renal phenotyping in very high-altitude Tibetan settings, our findings aim to inform integrated microvascular screening strategies and generate mechanistic hypotheses for future longitudinal research.
Participants, materials, and methods
Study design, setting, and sampling framework
This is a secondary analysis of a prospectively collected cross-sectional survey conducted in 31 provinces/municipalities using a multistage, stratified random sampling design. Briefly, the China National Diabetic Chronic Complications Study was implemented through the National Chronic Disease and Risk Factor Surveillance System and the Basic Public Health Service (BPHS) diabetes registries. Surveillance sites were selected first, followed by sampling of subdistricts/townships and communities within each site. Eligible residents with diabetes were then sampled within prespecified strata (e.g. sex and age groups) from local registries and invited to attend a standardized survey visit at community clinics/health stations. The overall response rate in the parent survey was 91.2%.
The present subanalysis focused on three high-altitude communities in the Tibet Autonomous Region (approximately 3650–4300 m above sea level): Chengguan District, Bayi District, and Gongbujiangda County.
Reporting transparency
The reporting of this study conforms to the Strengthening the Reporting of Observational Studies in Epidemiology (STROBE) guidelines. 14
Participants and analytic sample
Participants were recruited from community-based diabetes registries and local healthcare facilities. They completed a standardized questionnaire interview and underwent physical examinations, laboratory testing, and retinal imaging during a single survey visit.
Participant selection for this Tibet subanalysis is summarized in Figure 1. We included adults with physician-diagnosed T2DM (parent dataset variable G1 = 2) who had at least one gradable fundus photograph. DR was graded on a 0–4 scale for each eye; participants with both eyes coded as ungradable (grade = 5) were excluded. After applying these criteria, 320 adults with T2DM were included for descriptive analyses (Table 1). For multivariable models, we conducted complete-case analyses for the covariates included in each prespecified model. A total of 318 participants contributed to the primary and sensitivity models (Figure 1).

Participant flow diagram. Adults screened in the Tibet sites of the China National Diabetic Chronic Complications Study subcohort are shown. Participants with type 2 diabetes (G1 = 2) were eligible. “Gradable retinal images” indicates at least one eye with a readable fundus photograph; participants with both eyes ungradable were excluded. The “complete-case analytic sample” includes participants with nonmissing variables required for the primary multivariable model (age, sex, HbA1c, UACR category, and CKD status). Numbers of exclusions at each step are displayed. CKD: chronic kidney disease; HbA1c: glycated hemoglobin; UACR: urinary albumin-to-creatinine ratio.
Baseline characteristics of adults with type 2 diabetes and ≥1 gradable retinal image in high-altitude Tibet (N = 320).

Data are presented as mean (SD) for approximately normally distributed continuous variables, median (IQR) for skewed continuous variables, and number (%) for categorical variables. Percentages are calculated using the nonmissing denominator for each variable.
UACR categories were defined as <30 mg/g, 30–300 mg/g, and ≥300 mg/g. CKD was defined as eGFR <60 mL/min/1.73 m2. Hypertension was defined as a self-reported physician diagnosis and/or measured blood pressure meeting hypertension criteria at the examination.
BMI: body mass index; CKD: chronic kidney disease; eGFR: estimated glomerular filtration rate; HbA1c: glycated hemoglobin; IQR: interquartile range; UACR: urinary albumin-to-creatinine ratio.
Data collection and measurements
Data were collected by trained staff using standardized instruments and operating procedures. The survey visit included eligibility confirmation and written informed consent, questionnaire interview, anthropometric and blood pressure measurements, fasting venous blood collection, spot urine collection, and retinal imaging.
Demographic variables (age and sex) and study site were recorded. Glycemic control was assessed by glycated hemoglobin (HbA1c; %) measured from venous blood. Body mass index (BMI; kg/m2) was calculated as weight/height 2 and categorized as <24.0, 24.0–27.9, and ≥28.0 kg/m2 according to Chinese criteria.
Kidney involvement was assessed using the UACR (mg/g) from spot urine samples, categorized as <30, 30–300, and ≥300 mg/g, and eGFR (mL/min/1.73 m2) was calculated using the chronic kidney disease epidemiology collaboration (CKD-EPI) creatinine equation. Chronic kidney disease (CKD) was defined as eGFR <60 mL/min/1.73 m2. Hypertension was defined according to the parent protocol (blood pressure criteria and/or current antihypertensive treatment).
Retinal photography, grading, and quality assurance
Nonmydriatic fundus photographs were obtained for both eyes using standardized equipment and procedures. In the parent protocol, photographs were graded centrally according to the International Clinical Diabetic Retinopathy Disease Severity Scale: 0 (no apparent DR), 1 (mild nonproliferative DR (NPDR)), 2 (moderate NPDR), 3 (severe NPDR), and 4 (proliferative DR).
Quality assurance procedures included standardized grader training and certification before grading, masking of graders to participants’ clinical information, independent grading by two ophthalmologists, and adjudication of discrepant grades by a senior ophthalmologist.
Awareness of DR
Among participants with any DR, awareness was assessed by asking whether a doctor/health professional had ever told the participant that they had diabetic eye disease/DR. Responses were categorized as aware (“yes”) or unaware/uncertain (“no” or “not sure”).
Statistical analysis
Baseline characteristics were summarized for the overall sample (Table 1) and compared by DR status (Table 2). Approximately symmetric continuous variables were reported as mean (SD), whereas skewed variables (e.g. UACR) were summarized as median (IQR). Between-group comparisons were performed using unpaired Student’s t tests or Wilcoxon rank-sum tests for continuous variables, and χ2 or Fisher’s exact tests were applied for categorical variables. All tests were two-sided with an α value of 0.05.
Comparison of participant characteristics by diabetic retinopathy status (no DR vs. any DR) in adults with type 2 diabetes and ≥1 gradable retinal image (N = 320).

Any diabetic retinopathy (any DR) was defined as International Clinical Diabetic Retinopathy Disease Severity Scale stages 1–4 in either eye; No DR was defined as stage 0 in both eyes. Data are presented as mean (SD) for approximately symmetric continuous variables, median IQR for skewed continuous variables, and number (%) for categorical variables. Percentages were calculated using the nonmissing denominator for each variable.
p values were calculated using the Wilcoxon rank-sum test for continuous variables (selected a priori for robustness to departures from normality) and the chi-square test or Fisher’s exact test for categorical variables, as appropriate.
UACR categories were defined as <30 mg/g, 30–300 mg/g, and ≥300 mg/g. CKD was defined as eGFR <60 mL/min/1.73 m2. Hypertension was defined as a self-reported physician diagnosis and/or measured blood pressure ≥140/90 mmHg at the examination.
BMI: body mass index; CKD: chronic kidney disease; DR: diabetic retinopathy; eGFR: estimated glomerular filtration rate; HbA1c:glycated hemoglobin; IQR: interquartile range; UACR: urinary albumin-to-creatinine ratio.
Prevalence estimates for any DR and VTDR were presented with 95% confidence intervals (CIs) (Wilson method; Figure 2). The severity distribution of the maximum DR stage was summarized (Figure 3), and HbA1c distributions by DR status were visualized (Figure 4).
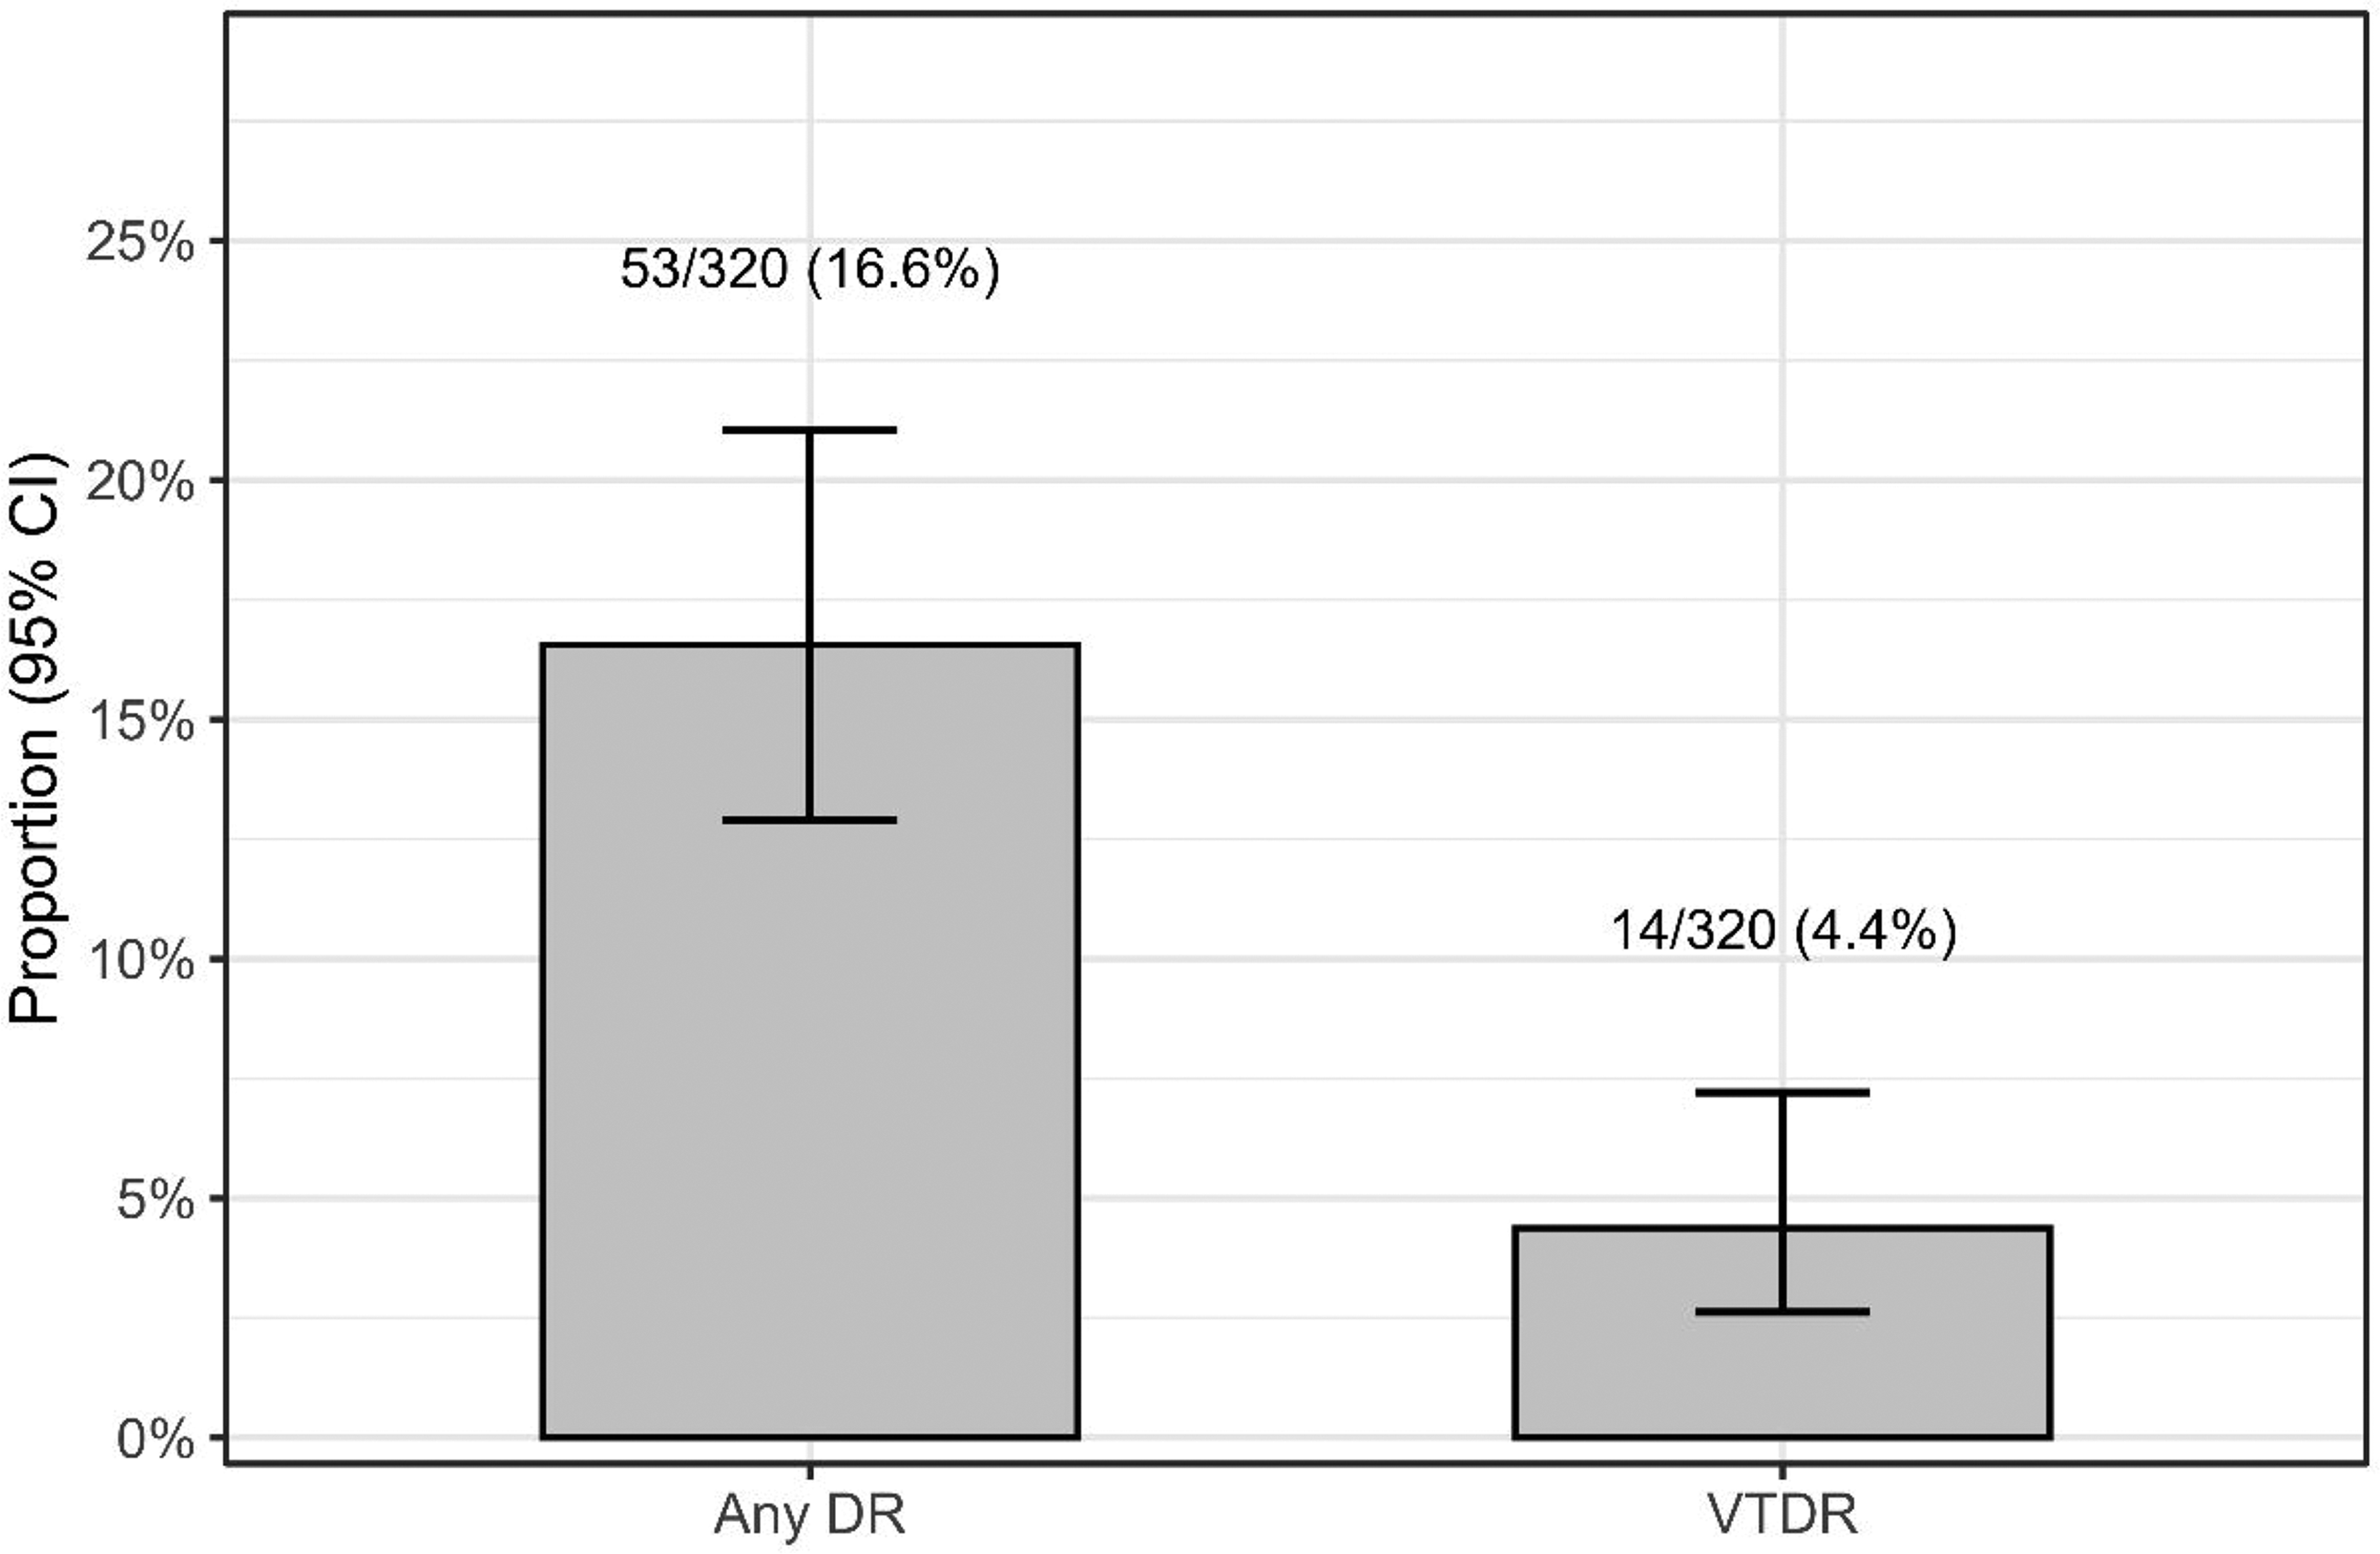
Prevalence of DR in the analytic sample. Bars represent the prevalence of any diabetic retinopathy (any DR) and VTDR among participants with type 2 diabetes and ≥1 gradable eye (N = 320). Any DR was defined as International Clinical Diabetic Retinopathy Disease Severity Scale stages 1–4 in either eye; VTDR was defined as severe nonproliferative DR (stage 3) or proliferative DR (stage 4) in either eye. Error bars indicate 95% CIs (Wilson method); labels display n/N and percentage. CI: confidence interval; DR: diabetic retinopathy; VTDR: vision-threatening diabetic retinopathy.

Distribution of DR severity (worse eye). The distribution of the maximum DR grade across both eyes is presented using the International Clinical Diabetic Retinopathy Disease Severity Scale: no apparent DR (stage 0), mild NPDR (stage 1), moderate NPDR (stage 2), severe NPDR (stage 3), and PDR (stage 4). Bars represent proportions in the analytic sample (N = 320), with labels showing n and percentage. DR: diabetic retinopathy; NPDR: nonproliferative diabetic retinopathy; PDR: proliferative diabetic retinopathy.

HbA1c distribution by DR status. Violin plots show the distribution of HbA1c (%) in participants with no DR versus any DR (defined as stages 1–4 in either eye). Overlaid boxplots indicate the median and IQR; whiskers represent 1.5 × IQR. Jittered points represent individual participants. Only participants with nonmissing HbA1c are plotted. DR: diabetic retinopathy; HbA1c: glycated hemoglobin; IQR: interquartile range.
Primary multivariable analysis (parsimonious model)
To evaluate factors associated with any DR while limiting overfitting, given 53 DR events, we prespecified a logistic regression model including age, sex, HbA1c, UACR category, and CKD status. This variable set was selected a priori based on clinical relevance and to maintain an acceptable events-per-variable ratio (Supplementary Table S1).
Sensitivity analyses (site and UACR functional form)
Because study site may capture contextual heterogeneity (e.g. recruitment catchment, healthcare access, or operational differences) rather than a biologically causal exposure, we treated site adjustment as a robustness check rather than a primary etiologic hypothesis. Therefore, we evaluated the following: (a) adding study site to the primary model and (b) adding study site while modeling UACR continuously as log2(UACR) (per doubling) to reduce degrees of freedom and improve model stability.
Model diagnostics and missing data
Model fit and assumptions were assessed using the Hosmer–Lemeshow test, discrimination with the area under the receiver operating characteristic (ROC) curve (AUC), predictive accuracy using the Brier score, and multicollinearity with variance inflation factors (VIF) (Supplementary Table S1). Missing covariates were handled using complete-case analysis for each model (318 participants in the prespecified models). Duration of diabetes was not included in the primary models because of substantial missingness. The potential for residual confounding is addressed in the strengths and limitations section.
Software
Analyses were conducted using R (version 4.5.2 for Windows) with RStudio (version 2026.01.0-392).
Results
Participant flow and baseline characteristics
Participant selection is presented in Figure 1. In total, 320 adults with T2DM who had at least one gradable fundus photograph were included in descriptive analyses (Table 1), and 318 participants contributed to the complete-case multivariable models (Tables 3–5).
Primary multivariable logistic regression model for factors associated with any diabetic retinopathy among adults with type 2 diabetes in Tibet.

The outcome was any diabetic retinopathy (any DR), defined as International Clinical Diabetic Retinopathy Disease Severity Scale stages 1–4 in either eye (vs. no DR, stage 0 in both eyes). ORs with 95% CIs were estimated using multivariable logistic regression.
The primary model included age (years), sex, HbA1c (%), UACR category, and CKD status. UACR <30 mg/g and eGFR ≥60 mL/min/1.73 m2 were used as reference categories. HbA1c was modeled as a continuous variable (per 1% increase). Analyses used a complete-case approach for variables included in the model (complete-case N reported in the participant flow diagram).
Model performance and assumptions (including goodness-of-fit and multicollinearity checks) are provided in the Model diagnostics table (Supplementary/Appendix), including the Hosmer–Lemeshow test and variance inflation factors.
DR: diabetic retinopathy; CI: confidence interval; CKD: chronic kidney disease; eGFR: estimated glomerular filtration rate; HbA1c: glycated hemoglobin; OR: odds ratio; UACR: urinary albumin-to-creatinine ratio.
Sensitivity analysis: multivariable logistic regression including study site for factors associated with any diabetic retinopathy.

The outcome was any diabetic retinopathy (any DR), defined as International Clinical Diabetic Retinopathy Disease Severity Scale stages 1–4 in either eye (vs. no DR, stage 0 in both eyes). ORs with 95% CCIs were estimated using multivariable logistic regression.
This sensitivity model included the primary covariates (age, sex, HbA1c, UACR category, and CKD) plus study site. Study site was included to account for potential site-level heterogeneity (e.g. differences in recruitment, clinical practice, access to care, or other unmeasured contextual factors) and to evaluate whether associations observed in the primary model were robust to adjustment for location. Bayi District served as the reference category for study site. UACR <30 mg/g and eGFR ≥60 mL/min/1.73 m2 were used as reference categories. HbA1c was modeled as a continuous variable (per 1% increase). Analyses used a complete-case approach for variables included in this model.
Model diagnostics (goodness-of-fit and multicollinearity checks, including Hosmer–Lemeshow and variance inflation factors) are reported in the Model diagnostics table (Supplementary/Appendix).
DR: diabetic retinopathy; CI: confidence interval; CKD: chronic kidney disease; eGFR: estimated glomerular filtration rate; HbA1c: glycated hemoglobin; OR: odds ratio; UACR: urinary albumin-to-creatinine ratio.
Sensitivity analysis: multivariable logistic regression including study site and log2-transformed UACR (per doubling) for factors associated with any diabetic retinopathy.

The outcome was any diabetic retinopathy (any DR), defined as International Clinical Diabetic Retinopathy Disease Severity Scale stages 1–4 in either eye (vs. no DR, stage 0 in both eyes). ORs with 95% CIs were estimated using multivariable logistic regression.
This sensitivity model included age, sex, HbA1c, CKD status, and study site, with UACR modeled as log2(UACR) to reduce the number of parameters compared with categorical modeling and to mitigate potential overfitting given the number of any DR events. The effect of UACR is reported per doubling of UACR; that is, a one-unit increase in log2(UACR) corresponds to a twofold higher UACR. Bayi District served as the reference category for study site. HbA1c was modeled as a continuous variable (per 1% increase). Analyses used a complete-case approach for variables included in this model.
Model diagnostics (goodness-of-fit and multicollinearity checks, including Hosmer–Lemeshow and variance inflation factors) are reported in the Model diagnostics table (Supplementary Table S1).
DR: diabetic retinopathy; CI: confidence interval; CKD: chronic kidney disease; eGFR: estimated glomerular filtration rate; HbA1c: glycated hemoglobin; OR: odds ratio; UACR: urinary albumin-to-creatinine ratio.
Baseline characteristics are summarized in Table 1. Participants had a mean age of 56.00 years (SD, 9.52) and were predominantly male (65.6%). Glycemic control was poor (mean HbA1c, 9.59%; SD, 2.73), with 13.1% achieving HbA1c <7.0%. Kidney involvement was common: the median UACR was 29.53 (7.54, 137.50) mg/g, and 49.4% of patients had albuminuria (UACR ≥30 mg/g), including 17.5% with UACR ≥300 mg/g. Median eGFR was 94.41 (82.86, 102.85) mL/min/1.73 m2, and 5.3% of patients met the definition of CKD (eGFR <60). Hypertension was present in 51.6%.
Prevalence and severity of DR
In the analytic sample (N = 320), 53 participants had any DR (16.6%; 95% CI: 12.9%–21.0%) and 14 had VTDR (4.4%; 95% CI: 2.6%–7.2%) (Figure 2). DR severity, defined using the maximum DR grade across both eyes, is summarized in Figure 3. Most participants had no DR (83.4%); among those with DR, moderate NPDR was the most common DR stage, whereas severe NPDR and proliferative DR (PDR) were uncommon.
Characteristics by DR status
Compared with participants without DR, those with DR were slightly older (58.30 ± 8.06 years vs. 55.54 ± 9.74 years; p = 0.049). Sex distribution and study site did not differ by DR status (p = 0.805 and p = 0.774, respectively). HbA1c was comparable between groups (9.52 ± 2.51 vs. 9.61 ± 2.77; p = 0.927), consistent with the overlapping distributions shown in Figure 4.
In contrast, kidney indices differed substantially. Participants with DR had significantly higher UACR (median 128.25 (29.51, 640.16) vs. 24.77 (6.14, 110.59) mg/g; p < 0.001) and demonstrated a shift toward higher UACR categories (p < 0.001). They also had significantly lower eGFR (median 89.57 (68.67, 98.65) vs. 94.91 (84.93, 103.40) mL/min/1.73 m2; p = 0.002) and a significantly higher prevalence of CKD (17.0% vs. 3.0%; p < 0.001). BMI was slightly lower in patients with DR (26.05 ± 4.52 vs. 26.83 ± 3.77 kg/m2; p = 0.049). Hypertension showed a nonsignificant trend toward higher prevalence among participants with DR (60.4% vs. 49.8%; p = 0.160).
Factors independently associated with any DR
Adjusted associations are presented in Tables 3–5. In the prespecified primary model (n = 318), kidney involvement remained independently associated with any DR. Compared with UACR <30 mg/g, UACR 30–300 mg/g was associated with higher odds of DR (odds ratio (OR) = 2.24, 95% CI: 1.07–4.72; p = 0.033), and UACR ≥300 mg/g showed a stronger association (OR = 3.08, 95% CI: 1.29–7.35; p = 0.011). CKD (eGFR, <60 vs. ≥60) was also associated with higher odds of DR (OR = 3.62, 95% CI: 1.17–11.18; p = 0.025). Age, sex, and HbA1c were not statistically significant after adjustment.
The findings were consistent in sensitivity analyses. Adding study site did not materially change the associations for UACR categories or CKD, and study site itself was not associated with DR (Table 4). When UACR was modeled as log2(UACR), each doubling of UACR was associated with higher odds of DR (OR = 1.26, 95% CI: 1.12–1.42; p < 0.001) (Table 5).
Model diagnostics (Supplementary Table S1) showed no evidence of poor fit (Hosmer–Lemeshow p = 0.303–0.588), modest discrimination (AUC: 0.685–0.718), and minimal multicollinearity (maximum VIF: 1.27–1.37). The prespecified modeling strategy also maintained an acceptable events-per-variable ratio across models (events per variable (EPV): 6.62–8.83).
Awareness of diabetic retinopathy among participants with DR
Among participants with any DR, awareness information was available for 52 individuals (Figure 5). Only 19/52 (36.5%; 95% CI: 24.8%–50.1%) reported being aware of having DR, whereas 33/52 (63.5%) were unaware or uncertain.

Awareness of diabetic retinopathy among participants with any DR. Among participants with any DR (n = 53), awareness information was available for n = 52 (one missing response). Awareness was assessed by the question “Have you ever been told by a doctor or health professional that you have diabetic eye disease or diabetic retinopathy?” Responses were categorized as Aware (“yes”) or Unaware/uncertain (“no” or “not sure”). Bars represent proportions with 95% CIs (Wilson method); labels display n/N and percentage. CI, confidence interval; DR, diabetic retinopathy.
Discussion
Main findings
In this community-based sample of Tibetan adults with T2DM living at very high altitude, DR affected 16.6% of participants (53/320; 95% CI: 12.9–21.0), and VTDR affected 4.4% (14/320; 95% CI: 2.6–7.2). Severity was predominantly nonproliferative: mild, moderate, and severe NPDR accounted for 10/320 (3.1%), 29/320 (9.1%), and 13/320 (4.1%), respectively, whereas PDR was rare (1/320, 0.3%). Overall, NPDR accounted for 52/53 (98.1%) of DR cases.
Among participants with any DR with available awareness data (n = 52), only 36.5% (19/52; 95% CI: 24.8–50.1) reported having been previously informed by a health professional that they had diabetic eye disease.
Kidney indices showed the clearest graded associations with DR. Compared with UACR <30 mg/g, UACR 30–300 mg/g and UACR ≥300 mg/g were independently associated with DR (adjusted ORs, 2.24 and 3.08, respectively), and CKD (eGFR, <60 mL/min/1.73 m2) was also independently associated. In contrast, HbA1c was not statistically significant after adjustment in the prespecified model.
Overall, these findings suggest that in a very high-altitude community sample, the prevalence of DR is comparable to contemporary national estimates, whereas VTDR is not lower. Renal microvascular involvement is common and is closely associated with DR. 5
Comparison with previous studies
Comparisons with national and global estimates should be interpreted cautiously because differences in fundus imaging (mydriatic vs. nonmydriatic; number of fields), grading systems (clinical severity scale vs. Early Treatment Diabetic Retinopathy Study (ETDRS)–derived grading), and population case mix (including diabetes duration and healthcare access) can materially affect prevalence estimates.5,15
Our estimate of any DR (16.6%; 95% CI: 12.9–21.0) is comparable to a recent nationally representative estimate in China (16.3%; 95% CI: 15.3–17.2), whereas our VTDR estimate (4.4%; 95% CI: 2.6–7.2) is numerically higher than the national estimate (3.2%; 95% CI: 2.9–3.5). 5 Because VTDR events were few (n = 14), the CI for our VTDR estimate is wider, and imprecision due to small-sample may partly explain this difference.
Global pooled estimates among patients with diabetes (DR, 22.27%; VTDR, 6.17%) are generally higher than our observed prevalence, with substantial between-study heterogeneity. 15 Variation in diabetes duration distribution, screening coverage and treatment access, and methodological differences in ascertainment likely contribute to these contrasts.
The strong renal–retinal coupling observed in this study is consistent with evidence that albuminuria reflects systemic microvascular vulnerability and predicts retinal disease progression. A natural history study from the Adolescent Cardio-Renal Intervention Trial (AdDIT) observational cohort reported that higher UACR tertiles predicted subsequent DR progression, independent of glycemic control. 16 Consistent with this, a recent Circulation state-of-the-art review described the urinary albumin-to-creatinine ratio as a cross-organ biomarker associated with vascular dysfunction and adverse cardiometabolic outcomes. 17
HbA1c is a well-established determinant of DR risk and progression; 18 however, it was not independently associated with DR in our adjusted models. This finding may reflect limitations of single, cross-sectional HbA1c measurement as a proxy for cumulative glycemic exposure and variability, residual confounding by unmeasured diabetes duration, and model dependence when downstream organ damage markers are included. Nationally representative data from China demonstrate strong gradients of DR and VTDR prevalence across diabetes duration strata, underscoring the importance of duration information for both risk interpretation and confounding control. 5 Additional analyses that model glycemia separately from kidney indices (e.g. excluding kidney markers or testing mediation-aware models) could help assess potential overadjustment in future work.
Potential mechanisms at high altitude
Residence at very high altitude entails chronic hypobaric hypoxia and activation of hypoxia-responsive pathways, including HIF signaling. 19 In the context of our strongest empirical signal, graded associations between albuminuria and DR, we proposed a hypothesis-generating framework in which hypoxia-related vascular stress contributes to systemic microvascular permeability and endothelial dysfunction, manifesting concurrently in the glomerulus (albumin leak) and the retina (microvascular damage).
Three nonmutually exclusive pathways may be relevant. First, hypoxia-HIF activation can induce programs that increase vascular permeability and angiogenic signaling, including pathways implicated in retinal barrier breakdown and neovascular complications.18,20 Second, hypoxic stress may amplify oxidative and inflammatory signaling that converges with diabetes-related metabolic stress to impair endothelial function. Human physiological studies at extreme altitude support altitude-related microvascular dysfunction and inflammatory activation. 21 Third, high-altitude hematological adaptations that alter blood viscosity and microvascular flow could plausibly influence tissue perfusion and shear stress in both renal and retinal microcirculations. 22 Additional exposures (e.g. increased ultraviolet radiation and distinctive dietary patterns) may also contribute but require dedicated measurement in this setting.
These mechanisms are proposed as hypotheses rather than causal explanations. Our study did not directly measure oxygen saturation, hemoglobin/hematocrit, HIF-related mediators, endothelial or oxidative biomarkers, UV exposure, or dietary factors. Longitudinal studies integrating objective hypoxic exposure metrics, vascular/endothelial biomarkers, and high-resolution retinal microvascular imaging alongside kidney phenotyping are needed to evaluate these pathways.
Implications for screening and care
The combination of VTDR prevalence and low awareness underscores the need to strengthen DR screening pathways in Tibet. The observed graded association between UACR and DR suggests that UACR stratification may have the potential to inform prioritization when retinal imaging capacity is limited. However, translating this association into a triage strategy requires local validation, including evaluation of predictive performance (sensitivity/specificity, calibration, and decision-analytic utility) and implementation feasibility.
In our data, multivariable models for any DR showed modest discrimination (AUC: 0.685–0.718 across the primary and sensitivity models), indicating that kidney indices are informative but insufficient alone for high-accuracy triage. In remote settings, portable fundus photography with teleophthalmology and, where locally validated, automated retinal image analysis systems may support scale-up and consistent referral triage. 23
Strengths and limitations
Strengths of this study include its community-based design, standardized kidney phenotyping, and centralized DR grading with masked dual assessment and adjudication.
Limitations of this study include its cross-sectional design and incomplete covariate data. Diabetes duration was unavailable, which can bias association analyses because longer duration increases the risk of both DR and kidney damage. The direction and magnitude of residual confounding may vary with patterns of diagnosis, survival, and healthcare access. 5 Participants with ungradable fundus photographs in both eyes (n = 58) were excluded; because ungradable imaging can cluster in older participants or those with comorbidities and is a recognized screening challenge, this exclusion may introduce selection bias in prevalence estimates and association analyses. 24 In addition, any residual DR misclassification from field-limited photography or image quality would be expected to attenuate associations toward the null. 5
Residual confounding is possible because we did not measure or fully adjust for factors that may influence both UACR and DR in this setting, including objective hypoxemia severity (e.g. peripheral capillary oxygen saturation (SpO2)), hemoglobin/hematocrit, long-term blood pressure control, smoking/alcohol use, and renoprotective or glucose-lowering agents with potential microvascular effects (e.g. angiotensin-converting enzyme inhibitors (ACEi)/angiotensin receptor blockers (ARB), sodium–glucose cotransporter 2 (SGLT2) inhibitors, glucagon-like peptide-1 (GLP-1) receptor agonists, and insulin). 17
Conclusions
In very high-altitude Tibetan communities, the prevalence of DR was comparable to contemporary national estimates; however, VTDR and albuminuria burdens were not lower, and awareness of DR among patients with diabetes remained limited. 5 The statistically significant graded associations between DR and kidney involvement support integrated retinal and renal risk assessment and underscore the need for longitudinal studies to evaluate hypoxia-related endothelial and permeability pathways underlying concurrent renal and retinal microvascular disease.17,19
Supplemental Material
sj-pdf-1-imr-10.1177_03000605261437612 - Supplemental material for Diabetic retinopathy and kidney involvement in adults with type 2 diabetes in high-altitude Tibet: A cross-sectional subanalysis of the China National Diabetic Chronic Complications Study
Supplemental material, sj-pdf-1-imr-10.1177_03000605261437612 for Diabetic retinopathy and kidney involvement in adults with type 2 diabetes in high-altitude Tibet: A cross-sectional subanalysis of the China National Diabetic Chronic Complications Study by Lihui Yang and Zexin Zhang in Journal of International Medical Research
Footnotes
Acknowledgments
We thank the participants, community healthcare workers, and field teams in Chengguan District, Bayi District, and Gongbujiangda County for their contributions to the China National Diabetic Chronic Complications Study. We are grateful to the staff of Tibet Autonomous Region People’s Hospital for logistical and technical support. No AI tools were used for data cleaning, statistical analysis, figure generation, variable creation, or outcome ascertainment.
Author contributions
Lihui Yang: conceptualization, data curation, formal analysis, visualization, and drafting of the manuscript.
Zexin Zhang: conceptualization, methodology, supervision, interpretation of data, and critical revision of the manuscript for important intellectual content.
Both authors approved the final version and agree to be accountable for all aspects of the work.
Data availability
The China National Diabetic Chronic Complications Study data are governed by national regulations on human genetic resources in China. Deidentified data from the Tibetan subcohort may be made available upon reasonable request to the corresponding author, subject to approval by the relevant authorities.
Declaration of conflicting interests
The authors declare no conflicts of interest relevant to this work.
Ethics,consent,and confidentiality
The China National Diabetic Chronic Complications Study was conducted in accordance with the Declaration of Helsinki (1975, as revised in 2024). The China National Diabetic Chronic Complications Study protocol received ethical approval from the Ethics Committee of Shanghai Sixth People’s Hospital (Shanghai, China; Approval No. 2018-010; approval date: 25 January 2018). The present study is a secondary analysis of the Tibet (Xizang) site of the China National Diabetic Chronic Complications Study. Written informed consent was obtained from all participants prior to participation. All participant data were deidentified prior to analysis and are presented in aggregate, and no individually identifiable information is included. Study data were stored and analyzed on secure, access-restricted systems.
Funding
This work was supported by the Key Project of the Tibet Autonomous Region Natural Science Foundation (grant XZ202401ZR0063).
Supplemental material
Supplemental material for this article is available online.
References
Supplementary Material
Please find the following supplemental material available below.
For Open Access articles published under a Creative Commons License, all supplemental material carries the same license as the article it is associated with.
For non-Open Access articles published, all supplemental material carries a non-exclusive license, and permission requests for re-use of supplemental material or any part of supplemental material shall be sent directly to the copyright owner as specified in the copyright notice associated with the article.