
Abstract
Objectives
The present study aimed to investigate the status of abnormalities in thyroid-related hormones, lipid profile parameters and total proteins in the sera of patients suffering from various metabolic disorders.
Methods
To analyze the study parameters, enzyme-linked immunosorbent assays, Bradford assays and standard clinical kits and methods were applied. Data were analyzed through the appropriate statistical tests.
Results
In all subjects except those with hypotension, thyroid-stimulating hormone, total cholesterol and low-density lipoprotein were elevated, whereas triiodothyronine levels were downregulated. Thyroxin was downregulated in subjects with diabetes and symptomatic thyroiditis but upregulated in patients with hypertension. High-density lipoprotein was upregulated in men who were diabetic only, and total protein was downregulated in those with hypotension only. Hypothyroidism in patients with diabetes, symptomatic thyroiditis and hypertension was correlated with dyslipidemia. In subjects with hypertension, it was correlated with total protein.
Conclusion
This study revealed a link between hypothyroidism, dyslipidemia and total protein in patients with various metabolic disorders.
Keywords
Introduction
Thyroid hormones (THs) perform important functions, such as the regulation of nutrient metabolism, blood sugar, cholesterol, pregnancy and menstruation.1,2 TH-associated abnormalities have been examined in approximately 110 countries, with 1.6 billion people identified to be at risk of developing thyroid disorders.3,4 The prevalence of thyroid-related disorders varies significantly among men and women. Similarly, the severity of thyroid disorders differs between age groups. 5
Cholesterol is generally classified as three forms: low-density lipoprotein (LDL), high-density lipoprotein (HDL) and very low-density lipoprotein. The condition of elevated lipids in the circulation is referred to as dyslipidemia. Thyroid disorders promote dyslipidemia. 6 In addition, thyroid status influences cholesterol metabolism, 7 and changes in thyroid activity affect the transport of lipoproteins.
Various metabolic abnormalities, such as altered glucose levels, dyslipidemia, hypotension and hypertension, are related to metabolic syndromes. 8 Thyroiditis is an inflammation of the thyroid gland that may be painful and tender or painless. According to the World Health Organization, the number of patients with diabetes in 2002 was 170 million globally, and this number is predicted to increase to more than 366 million by 2030. 9 Irregular thyroid levels increase the risk of diabetes. Hence, diabetes and thyroid abnormalities are considered associated factors.8,10 The occurrence of thyroid disorders is considerably greater among people with diabetes, ranging from 6.9% to 16%. 11 The prevalence of thyroid dysfunction in Greek patients with diabetes was reported to be 12.3%, and women were more frequently affected than men. 12
Hypertension can exacerbate diabetes-related complications, 13 and abnormal levels of THs affect blood pressure.14,15 Thyroid problems can also lead to infertility and menstrual cycle abnormalities.16,17 Women in the post-menopausal stage have higher serum total cholesterol (TC) and LDL compared with women who are pre-menopausal. However, serum HDL remains significantly lower in women who are post-menopausal. 18
The main objective of this study was to document any abnormalities in the levels of THs (thyroid-stimulating hormone [TSH], thyroxin (T4) and triiodothyronine [T3]), lipid profile parameters (TC, LDL and HDL) and total protein (TP) contents in patients with various metabolic disorders. Related research was previously carried out worldwide 12 and in some cities of Pakistan, such as Islamabad/Rawalpindi/Lahore,19,20 Karachi, 21 Peshawar 22 and Azad Jammu Kashmir, 23 but the findings have not been described in a population of Southern Punjab, Pakistan. Thus, the present study aimed to determine the relationship between thyroid and lipid parameter irregularities. Furthermore, an important motive to initiate this study was the alarming increase in the prevalence of diabetes, hypertension and cholesterol-related issues among residents of Southern Punjab, Pakistan.
Materials and methods
The current case–control study was conducted in January 2018 at the Department of Biochemistry and Biotechnology, Islamia University of Bahawalpur, Pakistan. The study region was district Rahim Yar Khan (RYK), a city of Southern Punjab, Pakistan. This study was approved by the Sub-Committee of Advanced Studies and Research Board of the Faculty of Science and Technology, Virtual University in its 5th meeting held on 4 February 2019 (Letter No. VU/ASRB/160-13, dated 26 February 2019). The study was conducted in accordance with the 1998 Declaration of Helsinki. All subjects were enrolled in the study after signing a predesigned informed consent form.
Collection of samples
Normal control samples were collected. In addition, patients with various disorders, such as diabetes, hypertension, hypotension and symptomatic thyroiditis, were enrolled in this study. To document menopause-related variations in TH levels, samples from women who were post-menopausal were included in the study group. Initially, residents of RYK were surveyed through a pre-designed questionnaire to document their profile of clinical indicators related to thyroid and lipid abnormalities. Complete information for each individual regarding age, sex, marital status, occupation and medical history was recorded. Most samples were collected from urban and rural areas of RYK, and a few were obtained from Sheikh Zaid Hospital, RYK. In total, 5 mL of non-fasting venous blood was drawn from each individual following standard procedures and precautions and used for the extraction of serum. The obtained sera were stored at −80°C.
Inclusion criteria
Healthy subjects and patients of both sexes between 18 to 50 years old Patients included those with diabetes, hypertension, hypotension and symptomatic thyroiditis abnormalities and women who were post-menopausal Residents of district RYK, Punjab, Pakistan only Subjects who consented to participate in the study
Exclusion criteria
Subjects who did not sign the consent form Patients suffering from any other disease, especially hepatitis Patients from other areas of Pakistan
Quantification of thyroid-related hormones
An enzyme-linked immunosorbent assay (ELISA) 24 was used to measure thyroid-related hormones with kits purchased from BIOS, Hayward, CA, USA (TSH: Catalog# 10304, T4: Catalog# 10302 and T3: Catalog# 10301). Standard curves with different dilutions of TSH, T4 and T3 were generated to estimate the quantity of the unknown concentrations of the corresponding molecules in the test samples. The color development during the enzymatic reaction was shown.
Quantification of lipid profile parameters
All lipid profile parameters in the serum were estimated using standard kits purchased from Human (Wiesbaden, Germany). TC was quantified by an oxidation-based enzymatic colorimetric Cholesterol Oxidase Peroxidase Amino Phenazone assay (catalog# 10028). LDL was estimated by the CHOD-PAP method (catalog# 143309990885) using a precipitation reagent and spectrophotometric systems. HDL was calculated by subtracting LDL from TC.
Quantification of TP
TP was quantified through a Bradford Assay 25 using different concentrations of bovine serum albumin as the standard.
Statistical analysis
The mean and standard deviation of measurements and Pearson bivariate correlation among parameters of each group were determined using IBM SPSS Statistics for Windows, Version 23 (IBM Corp., Armonk, NY, USA) and Minitab 16 (Penn State University, State College, PA, USA). The mean and standard deviations were determined to assess variations among different categories. Pearson bivariate correlation was distributed into negative and positive phases, and each phase was further categorized into three levels of strength according to Evans statistical rule 1996: weak (>0.3), medium (0.3–0.5) and strong (<0.5). A negative correlation reflects an inversely proportional relationship between two variables, while a positive correlation indicates a directly proportional association. The p-value was used to compare the significance level of variations between normal controls and samples. p < 0.05 was considered statistically significant.
Results
Demographic data
A flow diagram (Figure 1) was presented to illustrate the overall strategy of this study. The study population consisted of normal controls (n = 164) and patients (n = 106) suffering from various diseases (diabetes [n = 20], hypertension [n = 20], hypotension [n = 20], symptomatic thyroiditis n = 20] and post-menopausal women [n = 24]) with suspected altered levels of THs, TP and lipoproteins. The information regarding sex and age distribution was summarized in Supplementary data Figure 1.

Methodology flow diagram of the study.
The dietary pattern of normal controls differed from that of patients. The diet of all patients and normal individuals was enriched with carbohydrates and lipids, while the consumption of other dietary contents, including iodine, protein, vegetables, fruits and dairy, varied between groups (Supplementary data Table 1).
Quantification of thyroid-related hormones
The working range of TSH was found to be 1.25 to 20 µIU/mL, as revealed by the standard curve (Figure 2). The standard curves of T4 (Figure 3) and T3 (Figure 4) showed a decrease in the absorbance with increasing concentrations of T4, and the working range of the assay was determined to be 0.5 to 2.5 µg/dL. Initially, a blue color developed (Figure 5), indicating the presence of the tested analyte (TSH/T4/T3). Finally, a yellow color developed during ELISA (Figure 6), and the intensity of the color directly correlated with the corresponding concentrations of the TSH/T4/T3.

TSH (µIU/mL) standard curve.
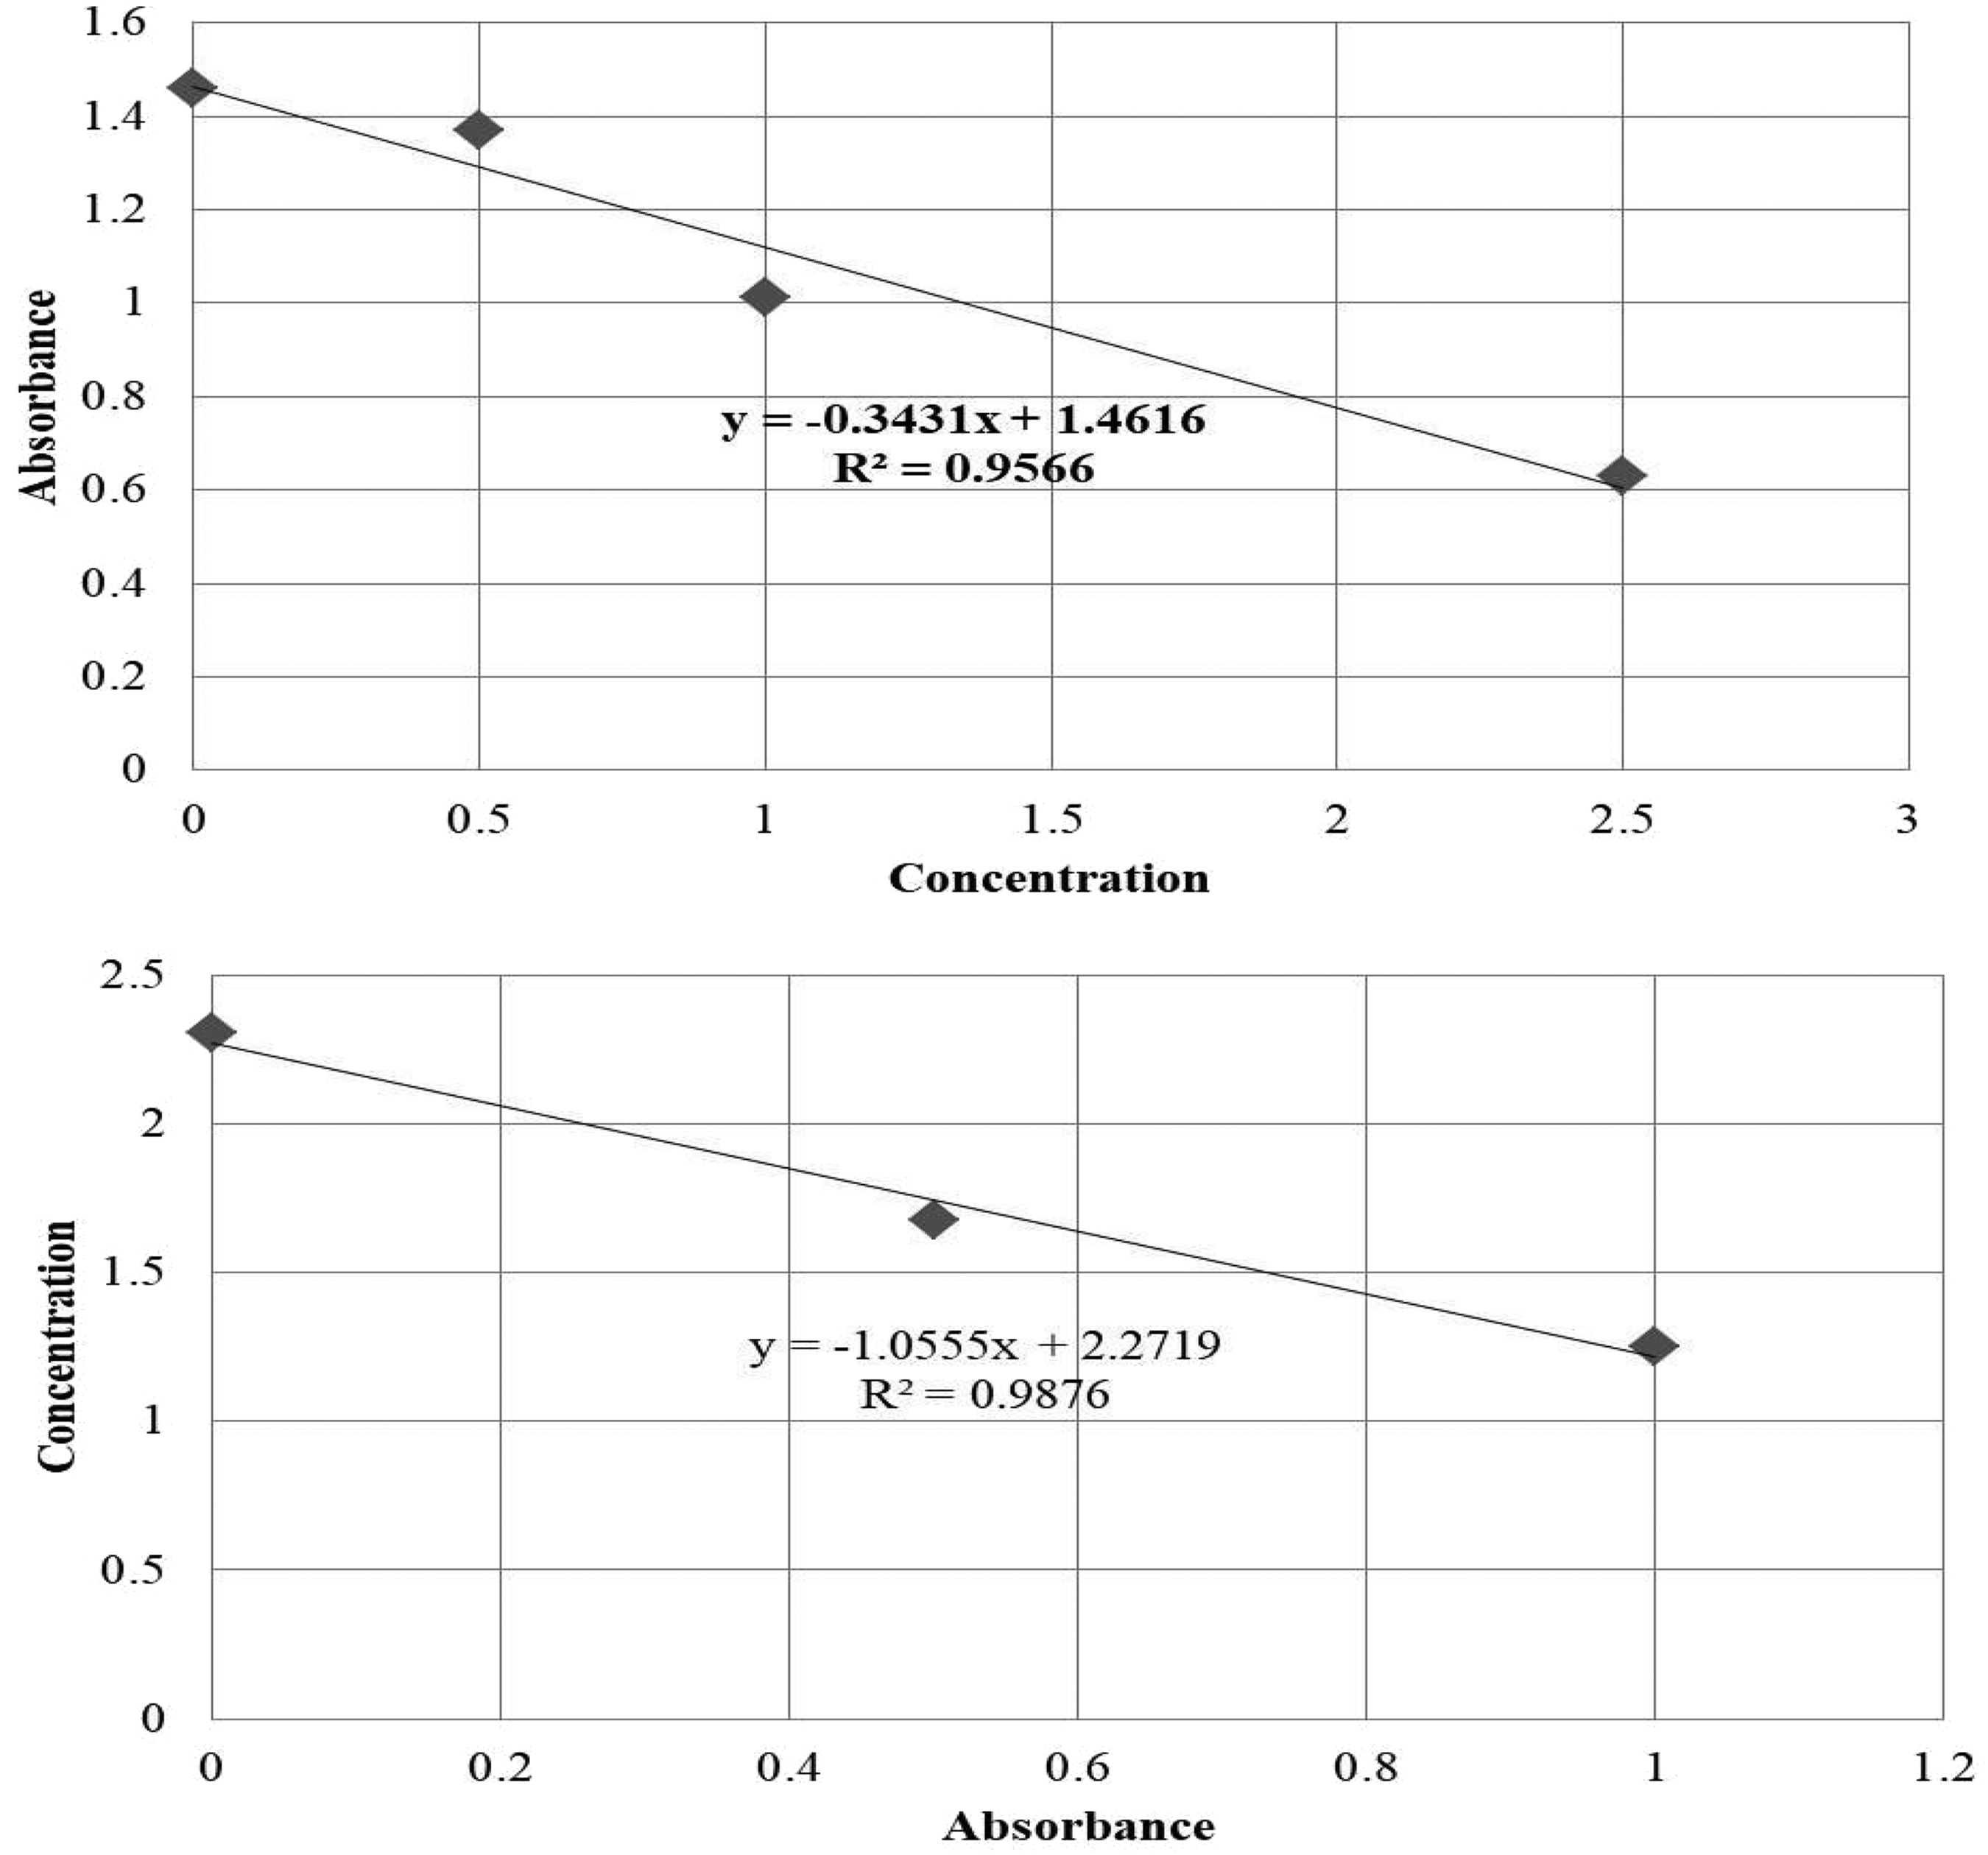
T4 (µg/dL) standard curve.
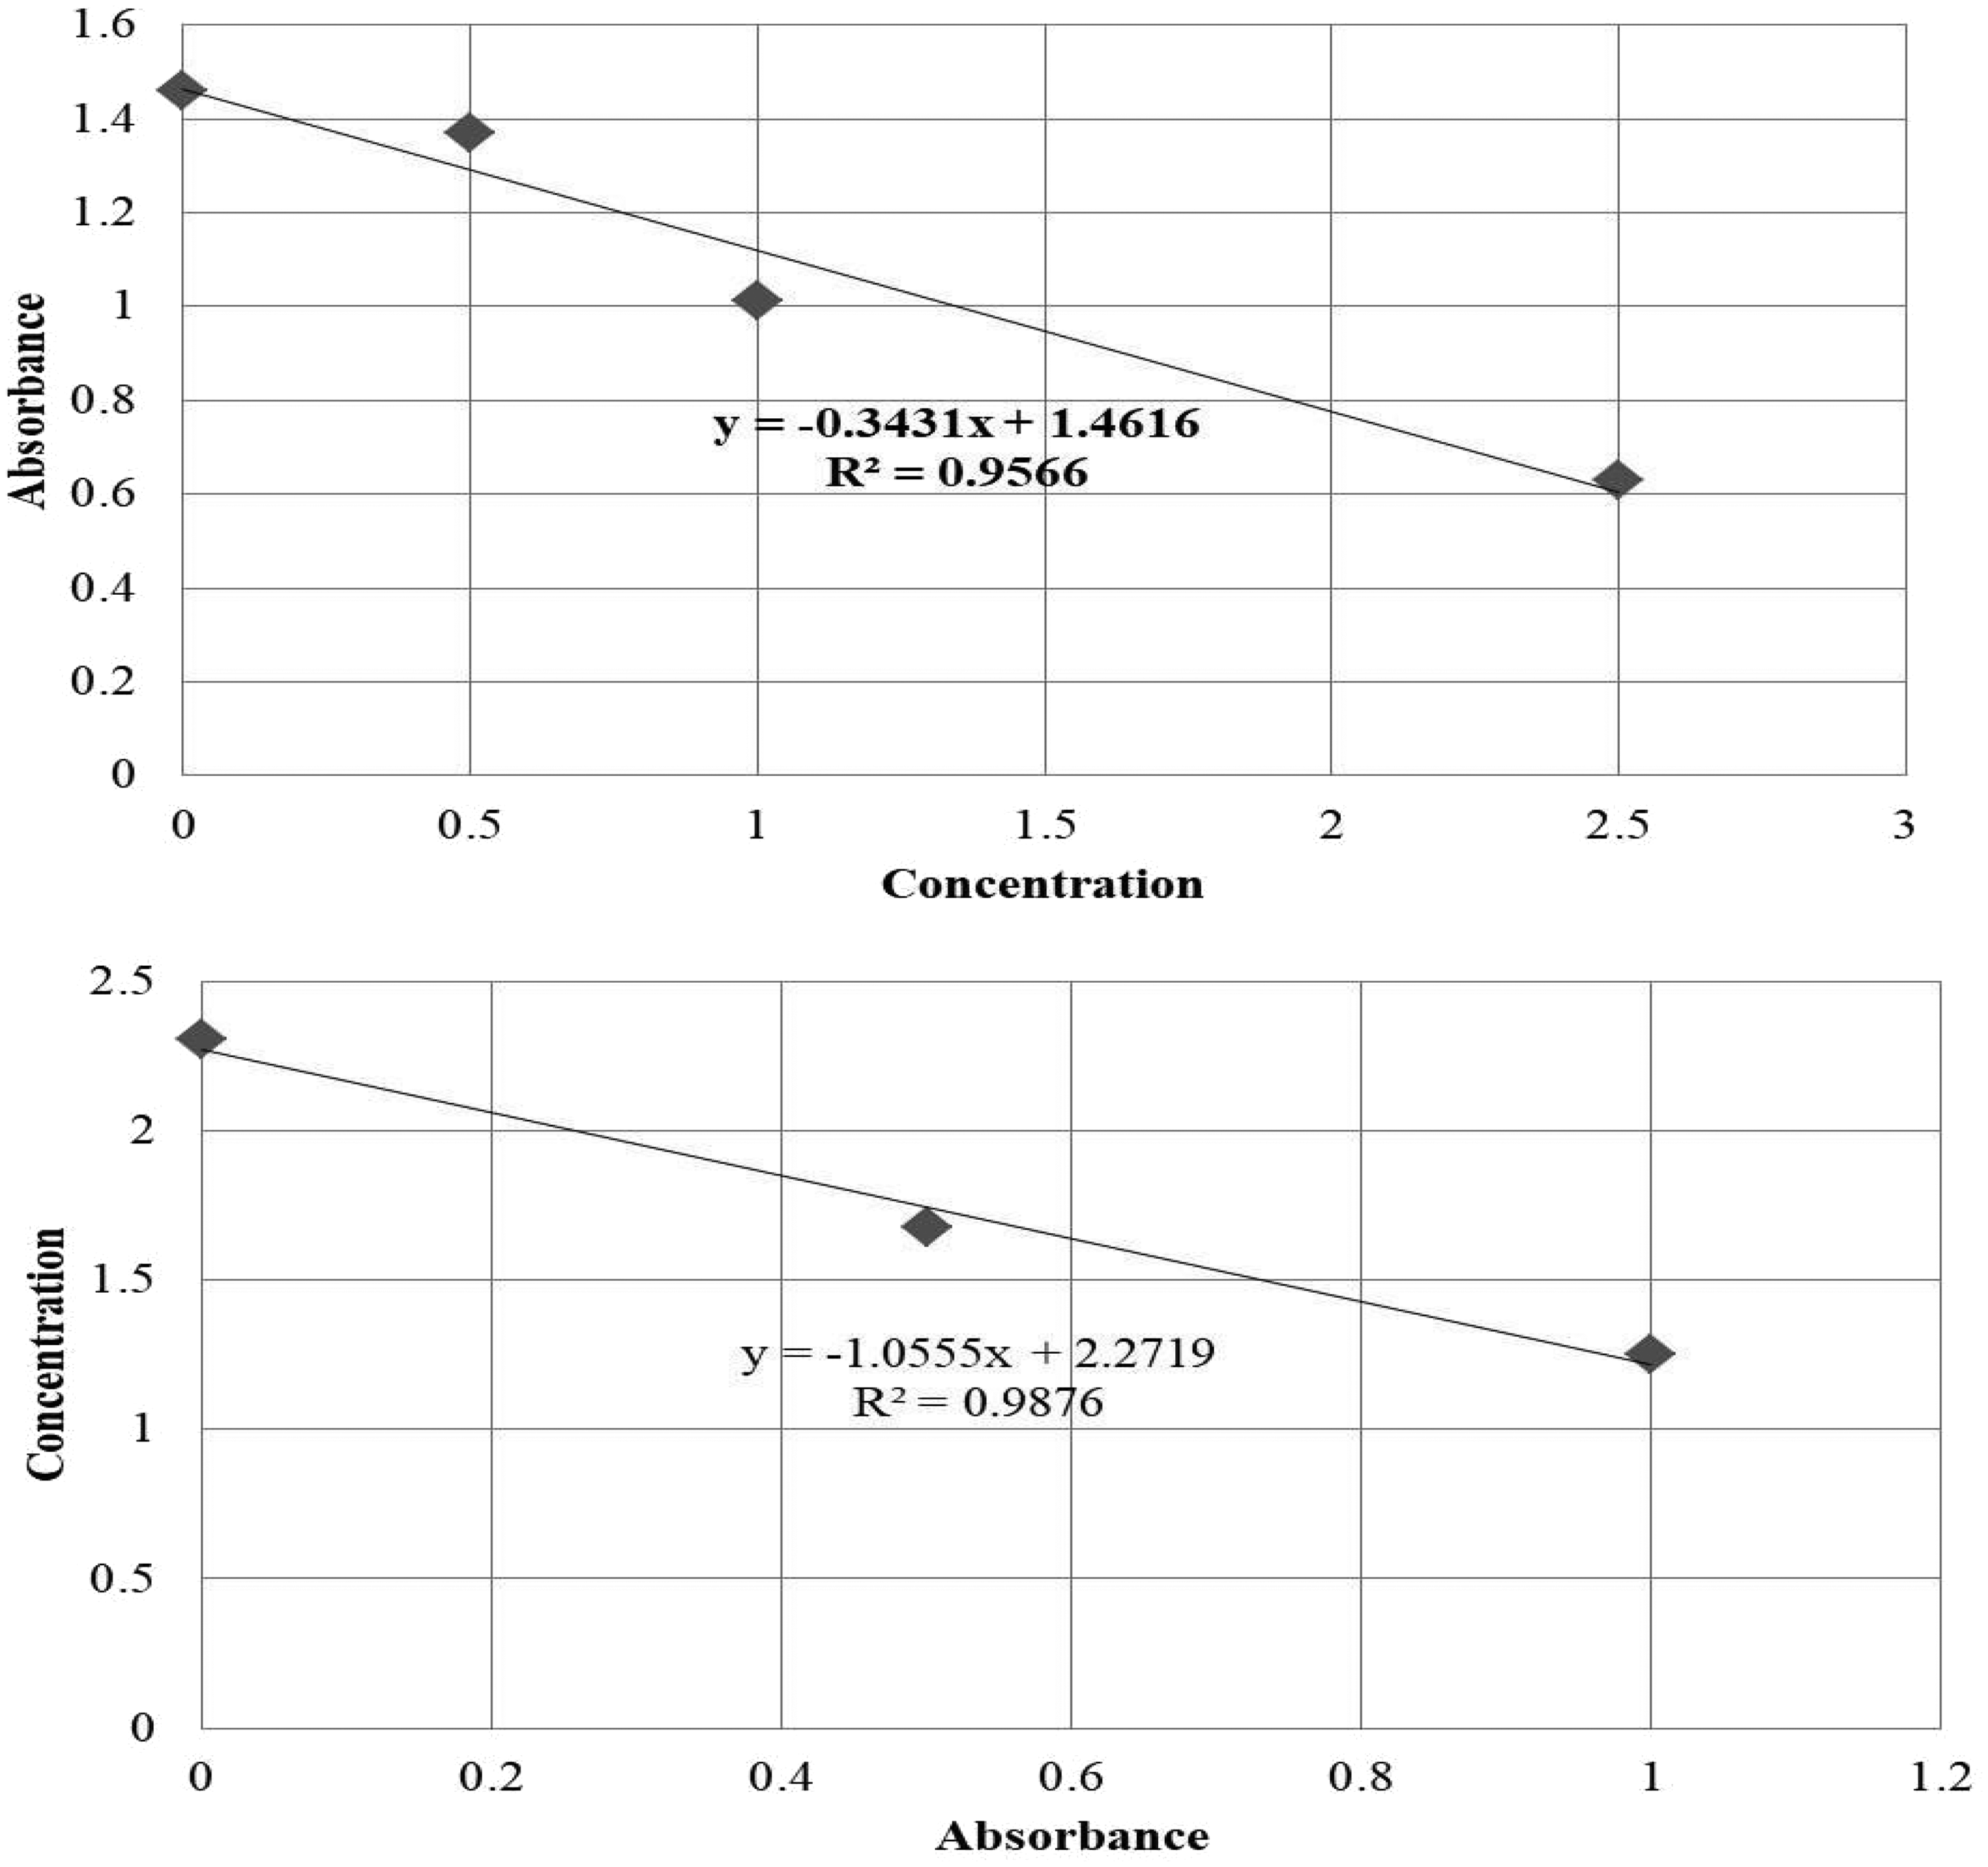
T3 (µg/dL) standard curve.
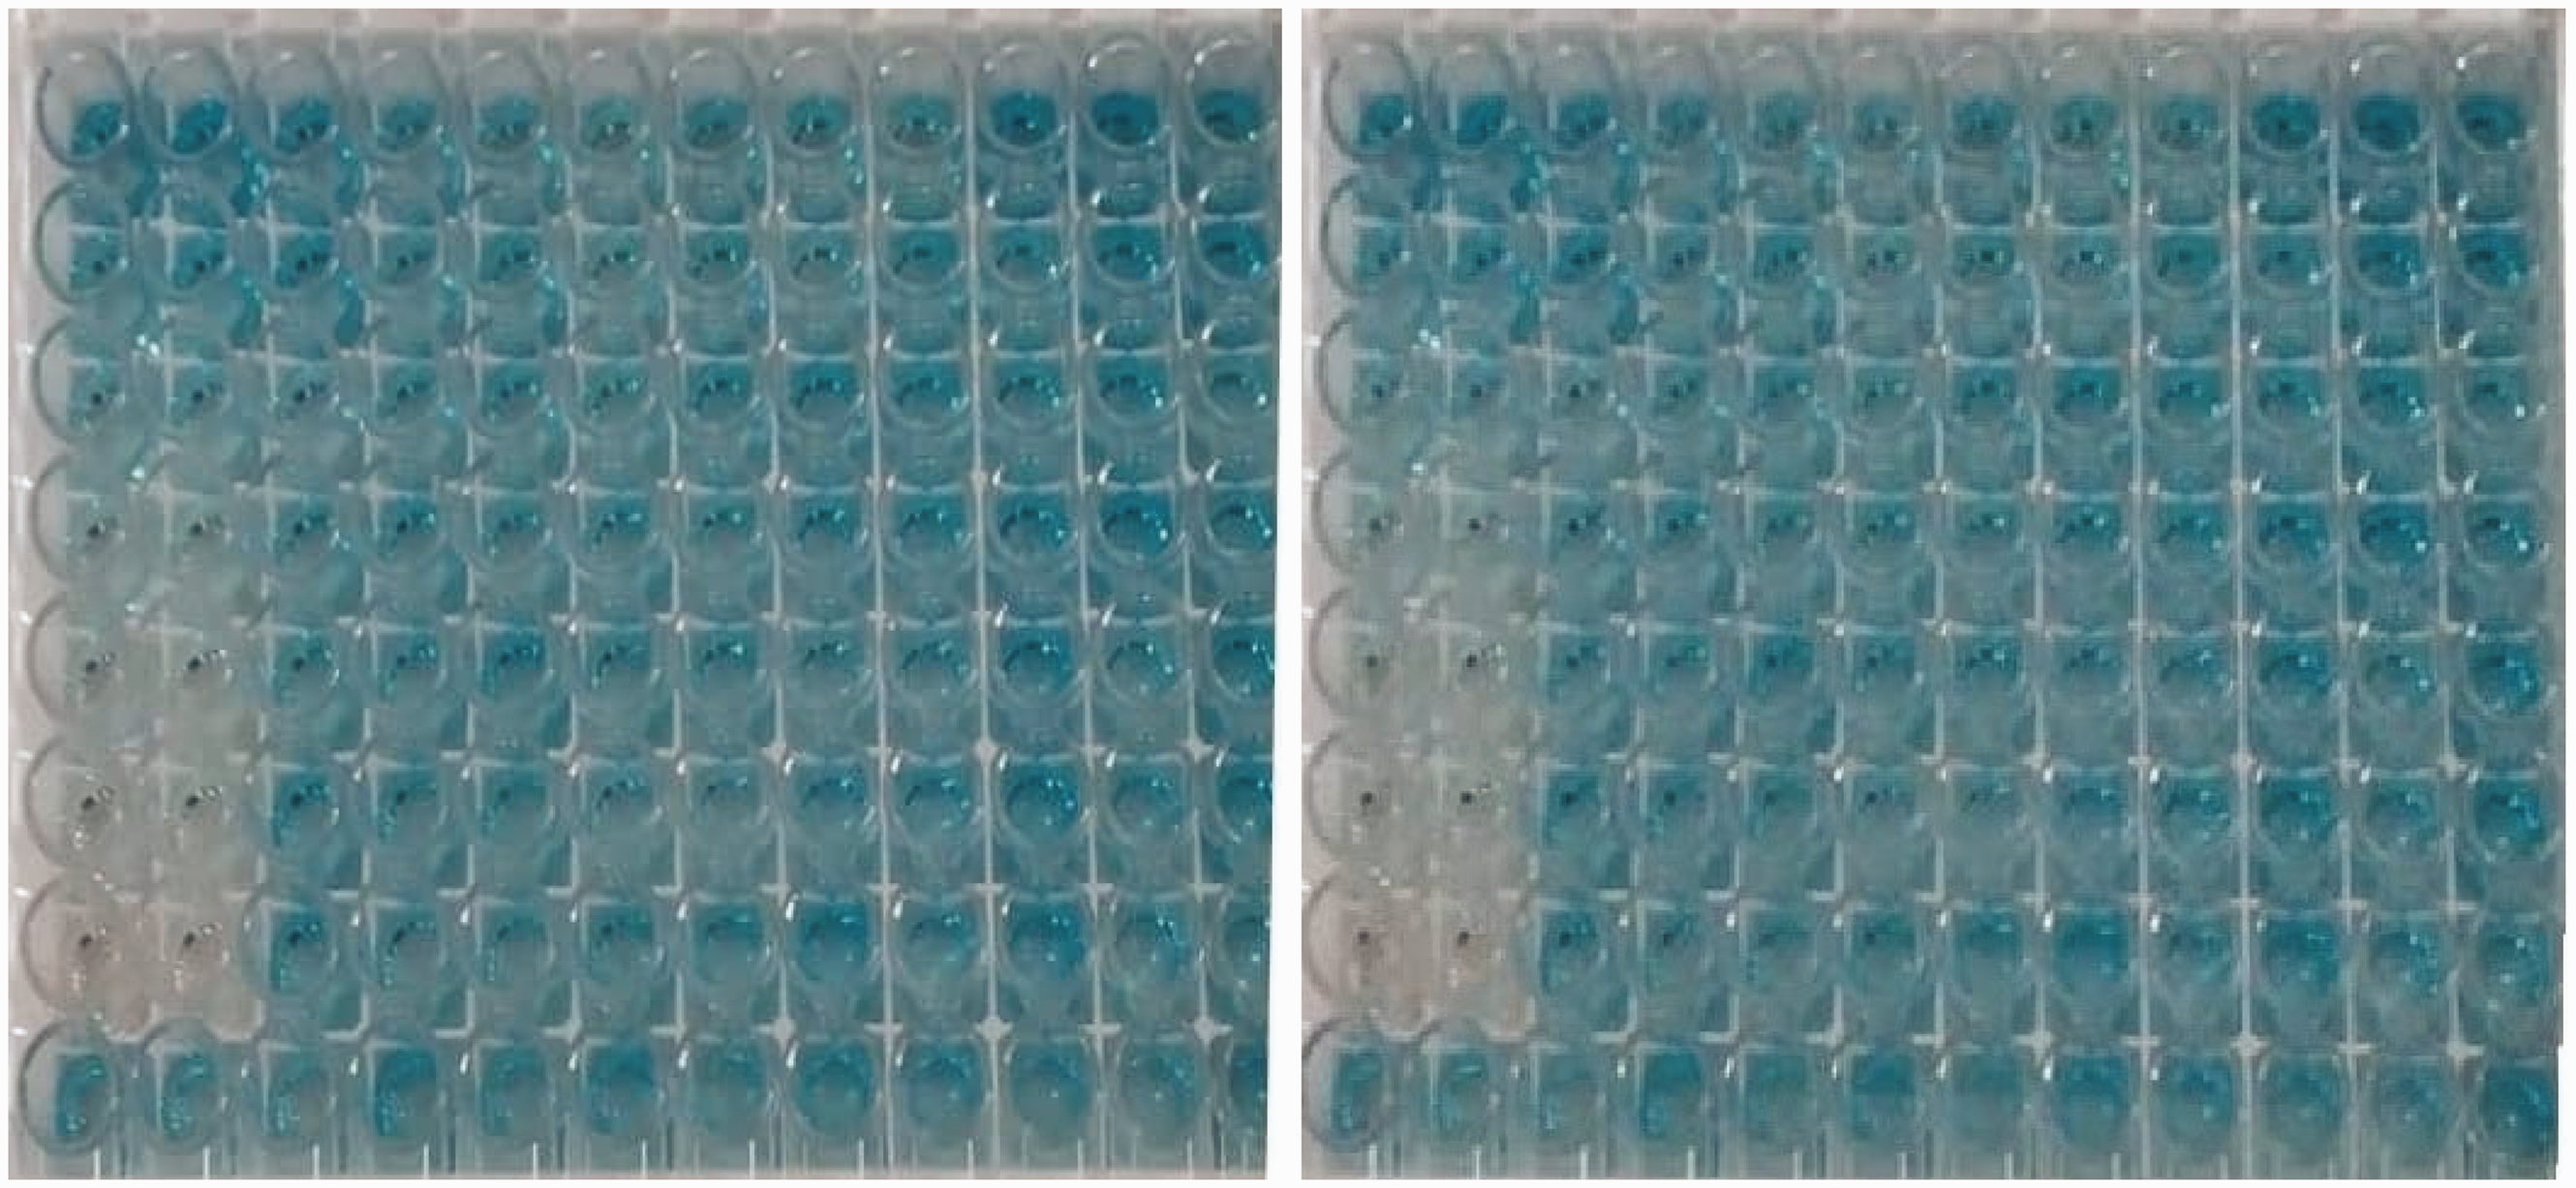
Development of blue color during TSH, T4 and T3 estimation.

Final stage (development of yellow color) of T3, T4 and TSH in the enzyme-linked immunosorbent assay.
Analysis of control group
In our study, the TSH level was positively correlated with TC (Supplementary data Tables 2 and 5) and LDL in men in the normal control group (Supplementary data Tables 2 and 6). TC had a significant positive correlation (strong) with LDL (Supplementary data Tables 5 and 6) and HDL (Supplementary data Tables 5 and 7) in both men and women. LDL showed a strong positive correlation with HDL in both men and women (Supplementary data Tables 6 and 7). T3 was negatively correlated with TC, HDL and TP in men in the normal control group (Supplementary data Table 4).
Analysis of patients with diabetes
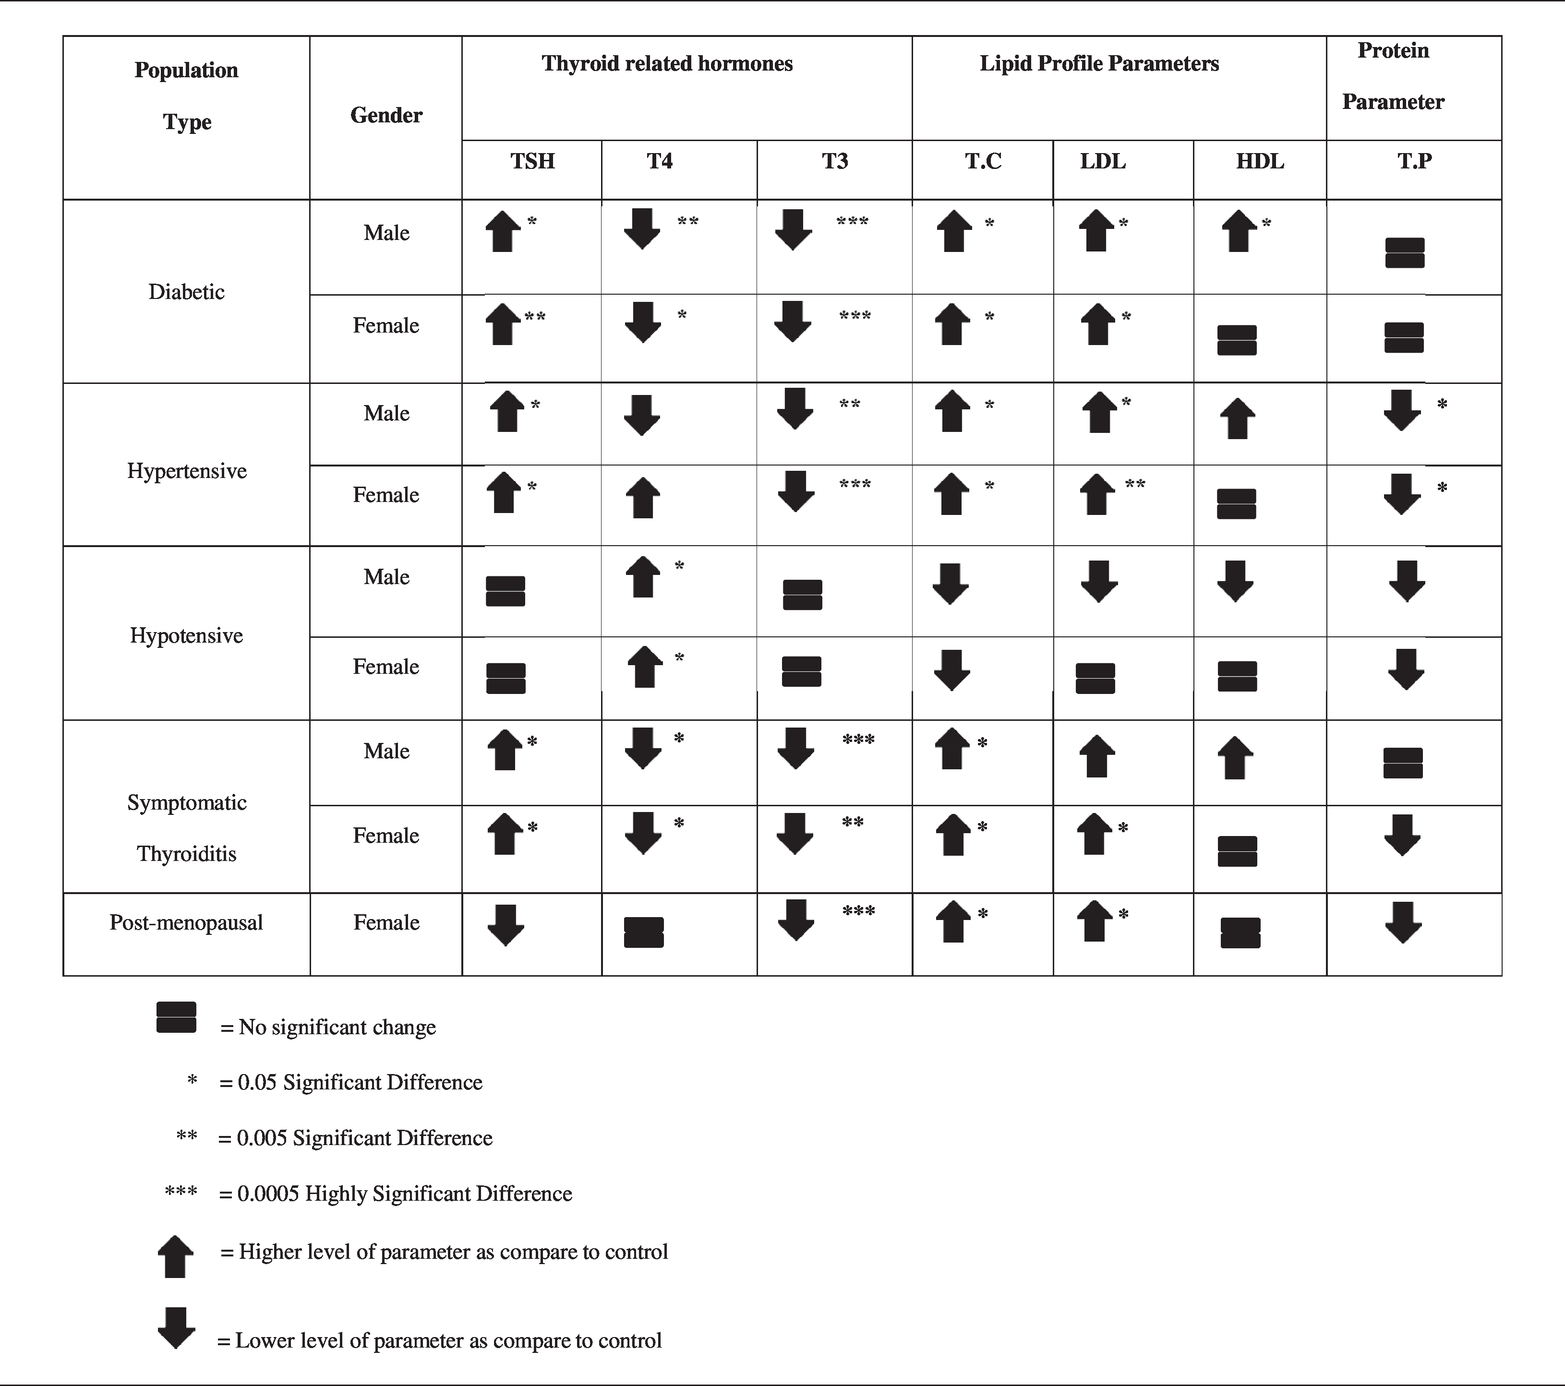
TSH was significantly upregulated in men (p = 0.013) and women (p = 0.005) with diabetes, whereas T4 (p = 0.007) and T3 (p < 0.001) were downregulated (Table 1). In patients with diabetes, lipid parameters were significantly upregulated (TC, p = 0.021; LDL, p = 0.037; HDL, p = 0.033), except for HDL in female patients with diabetes. However, TP in patients was similar to that in normal controls (Table 1).
Changes in study parameters among different study groups.

TSH and T4 were strongly correlated with TP and T3 (Supplementary data Tables 2 and 3), respectively, in men with diabetes. T3 showed a strong correlation with LDL in women (Supplementary data Table 4). TC was strongly correlated with LDL in both men and women (Supplementary data Tables 5 and 6). TP was strongly correlated with TSH, TC and LDL in men. HDL was correlated with TC and LDL in female patients (Supplementary data Tables 7 and 8). LDL was found to be strongly correlated with TP in men and HDL in women (Supplementary data Table 8).
TSH was strongly correlated with T4, and T4 was correlated with TP in men (Supplementary data Tables 2 and 3). T3 exhibited a strong correlation with TC, LDL and TP in men (Supplementary data Table 4).
Analysis of patients with hypertension
TSH (men, p = 0.027; women, 0.012) and TC levels were significantly upregulated, while T3 (men, p = 0.007; women, p < 0.001) and TP levels (men, p = 0.028; women, p = 0.045) were downregulated in both men and women. The change was insignificant in the case of T4 and HDL (Table 1).
TC was strongly correlated with LDL in both sexes. In men, TC was strongly correlated with HDL and TP (Supplementary data Table 5). LDL was strongly correlated with TP in men (Supplementary data Table 6). Among thyroid parameters, only TSH showed a strong negative correlation with T4 in women (Supplementary data Table 2). No correlation was found in the other studied parameters (Supplementary data Tables 3, 4, 7–8).
Analysis of patients with hypotension
T4 was upregulated in both men (p = 0.042) and women (p = 0.026), whereas the difference in other parameters was insignificant (Table 1). TSH was strongly correlated with T4 in women (Supplementary data Table 2). TC had a strong correlation with LDL and HDL in both men and women (Supplementary data Table 5). LDL was strongly correlated with HDL in both sexes. TC and LDL were correlated with TP in female patients only (Supplementary data Tables 5 and 6). HDL was strongly correlated with TP in women only (Supplementary data Table 5).
Analysis of patients with symptomatic thyroiditis
Among thyroid parameters, only TSH (men, p = 0.02; women, p = 0.02) and TC levels (men, p = 0.026; women, p = 0.043) were upregulated, whereas T4 (men, p = 0.018; women, 0.039) and T3 (men, p < 0.001; women, p = 0.007) were downregulated in both men and women with symptomatic thyroiditis. LDL was also upregulated but only in women (p = 0.039, Table 1). No change was observed in the other parameters.
TSH was strongly correlated with TC and LDL in men with symptomatic thyroiditis (Supplementary data Table 2). TC was strongly correlated with LDL in both men and women and HDL in women only (Supplementary data Table 5).
Analysis of women who are post-menopausal
T3 was downregulated (p < 0.001). TC (p = 0.028) and LDL (p = 0.026) were upregulated, whereas the other parameters varied insignificantly (Table 1). TSH showed a medium correlation with HDL (Supplementary data Table 2). T3 was strongly correlated with HDL. TC showed a strong correlation with LDL and HDL (Supplementary data Table 5). LDL showed a medium correlation with HDL (Supplementary data Table 6).
Discussion
THs and lipoproteins in patients with diabetes
The results of our study suggested significant upregulation of TSH and downregulation of T4 and T3 levels, similar to other studies.6,8,26 We found significantly elevated TC and LDL levels, as suggested in other studies. 6 In contrast to earlier reports of HDL downregulation, we found significantly upregulated levels in men with diabetes. In contrast to our findings, 12 another study observed lower LDL levels in women with diabetes compared with the levels in normal controls. Another study 27 suggested a positive correlation of TSH with TC and LDL in female patients with diabetes. During the present study, we found this correlation to be weakly positive in women and strongly positive in men.
THs and lipoproteins in hypertension
An earlier study 28 observed that TSH was elevated in a hypertensive population. Our results also suggested the significant upregulation of TSH in subjects with hypertension. A few other studies have demonstrated a link between hyperthyroidism and hypertension, similar to our results.29,30 A previous study 15 showed that the lipid profile parameters (LDL and TC) in a hypertensive population were significantly higher than those in normal controls, similar to our present study. Consistent with our results, other studies31–33 suggested that the change in the HDL level was not significant.
THs and lipoproteins in hypotension
A few studied have revealed the role of THs and lipoproteins in hypotensive populations 34 and showed that thyroxin therapy in a young woman with symptoms of hypotension increased blood pressure. The individuals with hypotension in our study were relatively young (45 years old) and displayed abnormally high T4 levels. The results of our study indicated that most men and women with hypotension exhibited euthyroidism, but only one woman with hypotension displayed unfamiliar hypothyroidism due to a high level of THs (T3 and T4) along with elevated TSH. Previous studies35,36 observed the development of hypothyroidism in older patients (>65 years) with hypotension, but those with hypotension in our study were not older and did not frequently experience hypothyroidism.
THs and lipoproteins in patients with symptomatic thyroiditis
A previous study 37 found similar results as ours, showing that TC and LDL levels fluctuated instead of HDL in patients with hypothyroidism. Other studies38,39 reported elevated TSH, TC and LDL levels in patients compared with those in healthy controls but normal HDL levels, similar to our study. A previous study 22 reported that TC and LDL were positively correlated with hyperthyroidism and hypothyroidism, but HDL exhibited no association with thyroid dysfunction. These results were mostly similar to ours.
Effect of post-menopausal status on thyroid and lipoprotein parameters
TSH fluctuates during the menstrual cycle and is not associated with menopausal status. 17 Our study displayed similar results as women who were post-menopausal exhibited no significant change in TSH levels. An earlier study 16 reported that women who were pre- and post-menopausal had increased TSH levels, whereas our results showed no significant change in TSH levels. Another group 18 found higher TC and LDL levels in women who were post-menopausal, as observed during the present study. However, another group of researchers 40 observed high levels of LDL and HDL. Similarly, a previous study 41 showed that HDL negatively correlated with TSH in women who were post-menopausal.
Conclusion
The levels of studied parameters in healthy subjects were in accordance with the internationally known standard ranges. Among the patient groups, the TSH level was upregulated in all studied subjects, except for those with hypotension. T4 was downregulated in patients with diabetes and symptomatic thyroiditis but upregulated in those with hypotension. T3 was downregulated in all studied subjects, except for those with hypotension. TC was elevated in all subjects, except for patients with symptomatic thyroiditis. LDL followed a similar pattern and was found to be upregulated in all studied subjects. HDL was increased in men with diabetes only. TP was decreased in subjects with hypotension only. TSH showed a strong positive correlation with TP in men with diabetes and TC and LDL in male subjects with symptomatic thyroiditis. TSH was found to have a strong positive correlation with T4 in female subjects with hypotension but a strong negative correlation with the same parameter in men with diabetes and women with hypertension. T4 showed a strong positive correlation with T3 and a strong negative correlation with TP in men with diabetes. T3 was found to have a strong positive correlation with LDL in female subjects with diabetes and HDL in women who were post-menopausal. T3 showed a strong negative correlation with TC, LDL and TP in male subjects with diabetes. TC demonstrated a strong positive correlation with LDL in all studied subjects and TP in men with diabetes and hypertension and women with hypotension. TC showed a strong positive correlation with HDL in all subjects with diabetes, symptomatic thyroiditis and hypotension and male subjects with hypertension. TP also showed a strong negative correlation with T3 in patients with diabetes only.
The results of the present study revealed an association of dyslipidemia with hypothyroidism or hyperthyroidism in subjects with various diseases, but this study should be expanded in the future by including a larger number of subjects with each type of metabolic disorder. In addition, this study should be extended to explore the underlying mechanisms and processes. The results are useful to improve the management of these diseases and reduce associated complications.
Supplemental Material
sj-pdf-1-imr-10.1177_03000605221119656 - Supplemental material for Hypothyroidism correlates with dyslipidemia and protein contents in patients with various metabolic disorders
Supplemental material, sj-pdf-1-imr-10.1177_03000605221119656 for Hypothyroidism correlates with dyslipidemia and protein contents in patients with various metabolic disorders by Muniba Kiran, Samina Ejaz, Muhamad Nouman Iqbal, Waqas Nazir Malik, Sana Zahoor and Syeda Abida Ejaz in Journal of International Medical Research
Footnotes
Acknowledgement
We thank the volunteers who participated in this study.
Declaration of conflicting interest
The authors declare no conflict of interest.
Funding
This research did not receive any specific grant from funding agencies in the public, commercial or not-for-profit sectors.
Authors contributions
SE conceived and designed the study, MK conducted research, MNI provided research materials, and MK collected and organized data. SZ analyzed and interpreted data. MK and SE wrote the initial and final draft of the article and provided logistic support. WNM conducted experiments, wrote the first draft, and was involved in making the final corrections suggested by the reviewers. SAE performed the statistical analysis and proofread the final manuscript. All authors have critically reviewed and approved the final draft and are responsible for the content and similarity index of the manuscript.
Supplemental material
Supplemental material for this article is available online.
References
Supplementary Material
Please find the following supplemental material available below.
For Open Access articles published under a Creative Commons License, all supplemental material carries the same license as the article it is associated with.
For non-Open Access articles published, all supplemental material carries a non-exclusive license, and permission requests for re-use of supplemental material or any part of supplemental material shall be sent directly to the copyright owner as specified in the copyright notice associated with the article.