
Abstract
Objective
To examine the effects of chronic alcohol consumption on brain functional connectivity using resting-state functional magnetic resonance imaging and degree centrality analysis.
Methods
This was a cross-sectional study, with participants including 23 light-to-moderate drinkers, 25 heavy drinkers, and 29 healthy controls aged 40–60 years. Degree centrality analysis was used to compare brain function differences among groups, and the relationships between degree centrality values, cognitive scores, and drinking behaviors were explored.
Results
Heavy drinkers showed significantly reduced degree centrality values in the left inferior temporal gyrus compared with healthy controls as well as in the left inferior temporal gyrus and left middle occipital gyrus compared with light-to-moderate drinkers. Degree centrality values in the left inferior temporal gyrus and left middle occipital gyrus were negatively correlated with drinking frequency and Michigan Alcoholism Screening Test scores but were positively correlated with cognitive scores.
Conclusions
Heavy drinking significantly disrupts brain functional networks. These findings suggest a potential link between cognitive function and drinking behavior, which may inform future research on early interventions aimed at protecting brain function in chronic alcohol users.
Keywords
Introduction
Chronic alcohol consumption (CAC) is a key manifestation of alcohol use disorder (AUD). In 2023, the World Health Organization issued a statement in The Lancet highlighting that no level of alcohol consumption is considered safe. CAC not only leads to various physical health issues but also causes damage to the central nervous system, resulting in alcohol-related brain damage.1,2 Previous functional magnetic resonance imaging (fMRI) studies have identified functional abnormalities in the brains of individuals with alcohol abuse, particularly in resting-state fMRI (rs-fMRI). Many of these studies have examined the effects of CAC on brain network activity, often focusing on the functional connectivity (FC) characteristics of global brain networks, such as alterations in the default mode network (DMN) or the executive control network (ECN). Several methods have been developed to explore the functional changes associated with CAC. Regional homogeneity (ReHo) and amplitude of low-frequency fluctuation (ALFF) are widely used rs-fMRI techniques for evaluating spontaneous neural activity at the local level. ReHo reflects local synchronization of neural activity, while ALFF and fractional ALFF (fALFF) measure the amplitude of low-frequency oscillations. Studies have shown that long-term alcohol users exhibit abnormal ALFF in the prefrontal-parietal-cerebellar circuits 3 and that both ReHo and fALFF values are significantly associated with drinking patterns and cognitive function. 4 However, these regional metrics may not fully reflect global disruptions in brain network organization. Degree centrality (DC), a voxel-wise graph theoretical method, offers a complementary perspective by quantifying the total number of direct functional connections for each voxel with the rest of the brain. 5 This data-driven approach does not require predefined regions of interest, making it suitable for identifying global brain connectivity alterations in an unbiased manner. Studies have reported higher DC values in the left precentral gyrus of AUD patients compared with controls, with a greater number and volume of altered voxels observed in the left hemisphere, 6 indicating lateralized vulnerability to alcohol-related damage.
Further supporting these findings, resting-state FC analyses have revealed disrupted interregional coordination. For example, FC between the left precentral gyrus and medial orbitofrontal cortex, as well as the periaqueductal gray involved in pain regulation, may play a role in alcohol-related behavioral regulation. 7 Increased alcohol intake has also been associated with weakened connectivity between the amygdala and prefrontal cortex. 8 Moreover, by combining DC with seed-based FC analysis, Ruan et al. 9 found that altered FC patterns were closely linked to symptom severity in AUD, offering deeper insight into its neurobiological mechanisms.
Recent advances have also emphasized the role of dynamic FC (dFC), which captures temporal fluctuations in connectivity over time. AUD individuals show fewer dFC states and reduced switching frequency than healthy controls (HCs), 10 reflecting reduced flexibility and adaptability of brain networks. Alcohol exposure has been linked to decreased DMN connectivity related to memory encoding, 11 and multimodal studies further implicate DMN and salience network dysfunction in alcohol-related memory decline. 12 Notably, increased drinking is associated with enhanced DMN connectivity in the posterior cingulate cortex and weakened ECN connectivity. 13 Despite these findings, prior research has primarily focused on AUD patients during detoxification or abstinence, leaving a gap in our understanding of brain network alterations during the sustained drinking phase, particularly in middle-aged and older adults. Furthermore, few studies have explored how varying levels of alcohol consumption differentially affect brain FC across regions.
Therefore, this study aimed to compare three groups—HCs, light-to-moderate drinkers (LMDs), and heavy drinkers (HDs), aged 40–60 years—using DC analysis to reveal the effects of different levels of alcohol consumption on brain function. We further investigated the relationship between abnormal DC values in specific brain regions, drinking behavior, and cognitive performance.
Based on previous findings, we hypothesized that individuals with heavy alcohol consumption would show significant DC alterations in key brain regions such as the prefrontal cortex, cerebellum, and DMN. These changes are expected to correlate with drinking severity and impaired cognitive functions, especially in domains related to executive control and attention. The goal is to provide new theoretical foundations and neuroscientific insights into how long-term alcohol consumption affects global brain function in a middle-aged population.
Materials and methods
Participants
This was a cross-sectional, convenience-sampled study that recruited 51 untreated long-term alcohol users from the communities surrounding Shiyan Renmin Hospital, along with 29 demographically matched HCs. The inclusion criteria were aged 40–60 years, with a drinking history of at least 5 years, and Michigan Alcoholism Screening Test (MAST) score ≥5. We recorded the participants’ years of alcohol consumption and daily alcohol intake, calculated based on the types of alcoholic beverages and their intake. The standard unit for Chinese liquor is “liang” (a traditional Chinese measurement), where 1 liang (50 mL) of 45-proof liquor contains approximately 2.22 standard units (1 standard unit contains 8 g of pure alcohol), and 500 mL of 3% beer contains approximately 1.48 standard units. Based on the drinking classification standards set by the British Medical Journal, 14 participants were divided into two groups based on drinking frequency: LMD: 1–21 units/week for men, 1–14 units/week for women; HD: >21 units/week for men, >14 units/week for women. Exclusion criteria included a history of neurological or psychiatric disorders; a history of head trauma; severe cardiovascular or endocrine diseases (such as hypertension, diabetes, coronary artery disease, etc.); contraindications for MRI; substance addiction (other than alcohol, such as smoking or drug dependence); and left-handedness.
Thirty healthy volunteers were recruited during the same period, with demographic characteristics (sex, age, education level, etc.) matching those of the CAC group. These individuals had no alcohol or substance dependence. The HC group included individuals with low drinking frequency, typically those who did not drink alcohol or only occasionally consumed it during holidays, with each instance being <1 standard unit. The exclusion criteria were the same as those for the CAC group. This study was conducted in accordance with the Declaration of Helsinki (1975), as revised in 2024, and was approved by the Medical Ethics Committee of Shiyan Renmin Hospital, located in Shiyan, China (Approval No: syrmyy-95, Date: 2024-08-12). All participants provided written informed consent prior to participation. The reporting of this study conforms to the Strengthening the Reporting of Observational Studies in Epidemiology (STROBE) guidelines. 15
Cognitive and alcohol level assessment
All participants completed the Mini-Mental State Examination (MMSE) and Montreal Cognitive Assessment (MoCA) before undergoing MRI scanning. MAST scores were only collected from the alcohol-drinking group.
MRI acquisition
MRI data were acquired using a Siemens (Lumina) 3.0 T MRI scanner. Before scanning, soft foam earplugs were inserted to reduce equipment noise, and participants were instructed to keep their eyes closed, remain awake, and avoid thinking about anything in particular. A routine scan was performed to exclude participants with brain lesions. Subsequently, 3D T1-weighted images were collected for spatial localization, followed by resting-state blood oxygenation level dependent (BOLD) data acquisition. The scanning parameters for the BOLD sequence were as follows: repetition time =2000 ms, echo time = 30 ms, flip angle = 90°, slice number = 33, slice thickness = 4.0 mm, no slice gap, field of view = 240 mm ×240 mm, matrix size = 80 × 80. A total of 240 time points were obtained, with a scan duration of 8 minutes and 8 seconds.
fMRI data processing
Raw DICOM data were converted to the Neuroimaging Informatics Technology Initiative format using MRICRON software (https://people.cas.sc.edu/rorden/MRICRON/install.html). The quality of the images was visually inspected to exclude those with artifacts or distortions. Data preprocessing was performed in the Matlab 2023 b environment (https://cn.mathworks.com/products/matlab/) using the DPABI 8.2 toolbox (Data Processing & Analysis for Brain Imaging, https://rfmri.org/dpabi). For preprocessing, the first 10 volumes of each time series were discarded to reduce potential effects of scanner instability and participant adaptation. Slice timing differences were corrected to account for the within-scan acquisition time differences between slices. Functional images were realigned to the mean image to correct for head motion. Data with translational movement exceeding 3 mm or rotational movement exceeding 3° were excluded (3 cases from the alcohol group and 1 case from the HC were removed). Data were normalized to the Montreal Neurological Institute (MNI) space using the Diffeomorphic Anatomical Registration Through Exponentiated Lie Algebra (DARTEL) technique to ensure spatial consistency across subjects. Linear trends in the time series were removed, and nuisance covariates, including head motion parameters, white matter signal, and cerebrospinal fluid signal, were regressed out to minimize noise. Temporal band-pass filtering (0.01–0.1 Hz) was applied to extract low-frequency signals associated with resting-state brain function and to remove high-frequency noise and low-frequency drifts.
Degree centrality analysis
Degree centrality analysis was conducted using the DPABI 8.2 toolbox. Based on the preprocessed and unsmoothed fMRI data, voxel-wise Pearson correlation coefficients were computed between each voxel within the gray matter mask and all other voxels to generate the whole-brain FC matrix. To reduce spurious correlations, a threshold of r > 0.25 was applied to retain only statistically meaningful connections. The resulting DC values, representing the number of suprathreshold connections for each voxel, were then normalized using Fisher’s r-to-z transformation to produce individual z-score DC maps. Only after this transformation, spatial smoothing was applied to the z-score DC maps using an 8-mm full-width at half maximum Gaussian kernel to improve signal-to-noise ratio and spatial consistency across participants. These smoothed z-score DC maps were used in subsequent group-level statistical analyses.
Statistical analysis
This study included 23 participants in the LMD group, 25 in the HD group, and 29 in the HC group. Statistical analyses were performed using the smoothed z-score DC maps.
We tested group differences in mean framewise displacement (FD) using the Kruskal–Wallis test, and the Shapiro–Wilk test indicated non-normal distributions in the LMD and HD groups (P < 0.05). The results showed no significant differences in mean FD among the HC, LMD, and HD groups (H = 0.47, P = 0.79); therefore, FD was not included as a covariate in subsequent analyses.
One-way analysis of variance (ANOVA) was performed using DPABI to compare DC differences among the three groups, with age and sex included as covariates. Group differences were identified after applying Gaussian random field (GRF) correction (voxel-level P < 0.001, cluster-level P < 0.05), resulting in spatial maps of brain regions with significant differences.
For post-hoc analysis, two-sample t-tests were conducted on the regions identified by the ANOVA to further examine pairwise group differences. GRF correction was applied (voxel-level P < 0.005, cluster-level P < 0.05, minimum cluster size >20 voxels).
To investigate the relationship between the DC values of abnormal brain regions and behavioral measures (MMSE, MoCA, MAST scores, drinking years, and drinking frequency), correlation analyses were first conducted separately within the HD and LMD groups. However, no statistically significant associations were observed in either subgroup. To increase statistical power, we then combined the HD and LMD groups into a single group for further correlation analysis. Prior to the analysis, the normality of both the DC values and behavioral variables was assessed using the Shapiro–Wilk test. If both variables followed a normal distribution, Pearson correlation analysis was applied. If either variable deviated from normality, Spearman rank correlation was used instead. All statistical analyses were conducted using R version 4.3.0 (https://www.r-project.org/), with a two-tailed P value < 0.05 considered statistically significant.
For thresholding and correction for multiple comparisons, we applied different voxel-level thresholds for the ANOVA and post-hoc two-sample t-tests based on common practice in neuroimaging studies and recommendations in the DPABI documentation. Specifically, a stricter voxel-level threshold (P < 0.001) was used for the initial ANOVA to ensure a conservative identification of brain regions with potential group-level differences. For post-hoc comparisons, we used a slightly more lenient voxel-level threshold (P < 0.005) to maintain sensitivity while still ensuring robustness. In both cases, cluster-level correction was applied using GRF theory (cluster-level P < 0.05), which accounts for spatial autocorrelation in fMRI data and controls for multiple comparisons across the whole brain. Additionally, a minimum cluster size threshold (k > 20 voxels) was applied to minimize the likelihood of detecting false positives due to noise. While some clusters appeared small, they all survived GRF-based cluster-level correction, ensuring statistical rigor.
Results
Demographic and clinical data
Statistical analyses were performed using SPSS 24.0 (https://www.ibm.com/cn-zh/spss). Categorical data are expressed as frequencies, and group differences in sex were analyzed using the χ2 test. Continuous data conforming to a normal distribution are expressed as mean ± SD. One-way ANOVA was used to compare differences among three groups, and independent samples t-tests were used for comparisons between two groups. Data not conforming to a normal distribution were expressed as medians (interquartile range). The Kruskal–Wallis H test was used for comparisons among three groups, and the Mann–Whitney U test was used for comparisons between two groups. Details are provided in Table 1.
Demographic and clinical characteristics.

BMI: body mass index; HC: healthy control; HD: heavy drinking; LMD: light-to-moderate drinking; MAST: Michigan Alcoholism Screening Test; MoCA: Montreal Cognitive Assessment; MMSE: Mini-Mental State Examination.
P < 0.05 compared with the HC group.
P < 0.05 compared with the LMD group.
Results of DC analysis
Compared with HC group, the HD group exhibited significantly lower DC values in the left inferior temporal gyrus ITG.L (Figure 1). Similarly, compared with the LMD group, the HD group demonstrated significantly lower DC values in the left middle occipital gyrus (MOG.L) and ITG.L (Figure 2). No significant differences were observed between the LMD and HC groups. Detailed results are presented in Table 2.

(a, b) The green-blue areas indicate brain regions with lower DC values in the HD group compared with the HC group (ITG.L). DC: degree centrality; HC: healthy control; HD: heavy drinking; ITG.L: left inferior temporal gyrus.
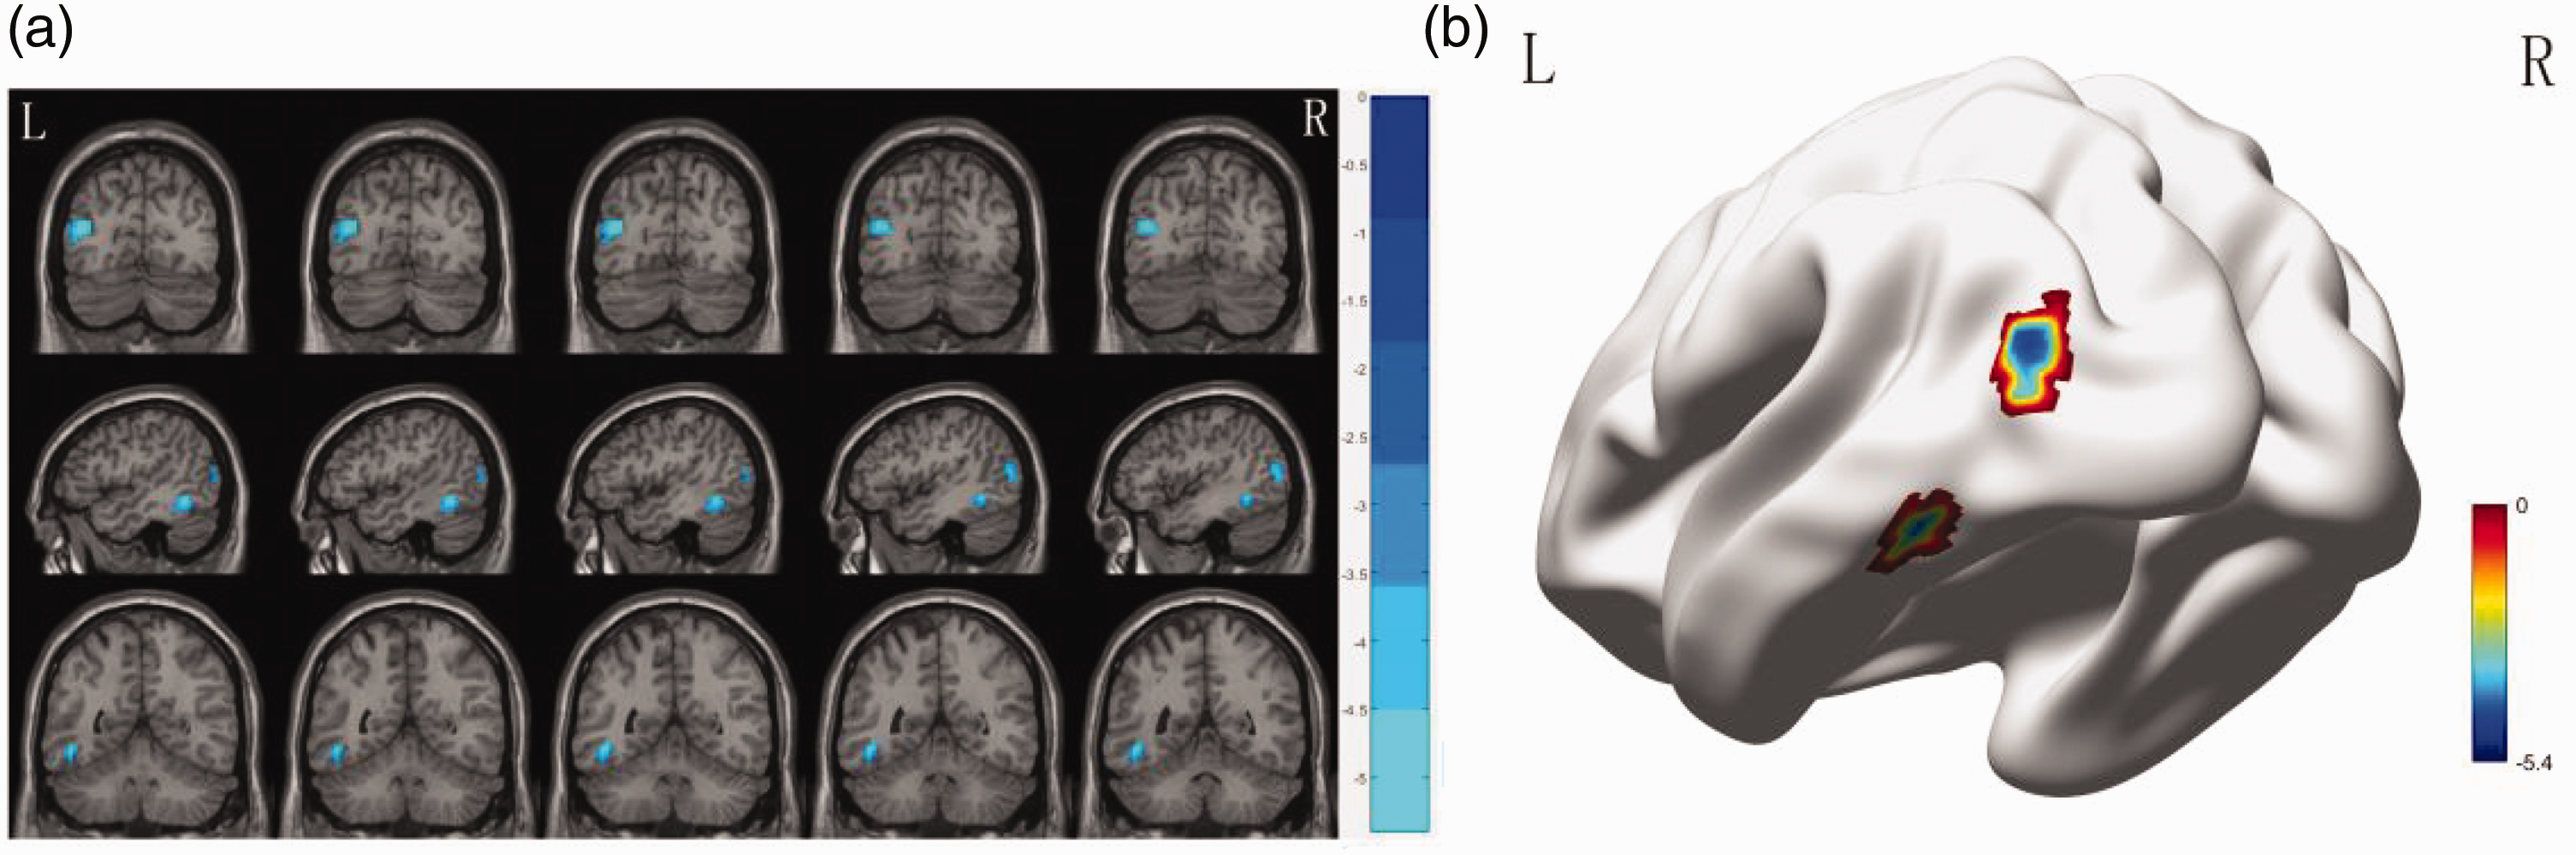
(a, b) The green-blue areas indicate brain regions with lower DC values in the HD group compared with the LMD group (MOG.L and ITG.L). DC: degree centrality; ITG.L: left inferior temporal gyrus; HD: heavy drinking; LMD: light-to-moderate drinking; MOG.L: left middle occipital gyrus.
Brain area differences in degree centrality between different groups.

BA: Brodmann’s area; HC: healthy control; HD: heavy drinking; ITG.L: left inferior temporal gyrus; LMD: light-to-moderate drinking; MNI: Montreal Neurological Institute; MOG.L: left middle occipital gyrus.
Correlation analysis
Correlation analysis between the abnormal DC values of brain regions and behavioral data in the drinking groups (HD and LMD) was performed. The DC value of the ITG.L showed a moderate negative correlation with drinking frequency (r = −0.474, P = 0.0007, Spearman correlation analysis) (Figure 3(a)). The DC value of the MOG.L also showed a moderate negative correlation with drinking frequency (r = −0.491, P = 0.0004, Spearman correlation analysis) (Figure 3(b)). The DC value of the ITG.L showed a moderate positive correlation with the MoCA score (r = 0.37, P = 0.011, Pearson correlation analysis) (Figure 3(c)), and the DC value of the MOG.L showed a moderate positive correlation with the MMSE score (r = 0.39, P = 0.006, Pearson correlation analysis) (Figure 3(d)) and the MoCA score (r = 0.35, P = 0.015, Pearson correlation analysis) (Figure 3(e)). The DC value of the ITG.L showed a moderate negative correlation with the MAST score (r = −0.43, P = 0.002, Spearman correlation analysis) (Figure 3(f)), and the MOG.L DC value also showed a moderate negative correlation with the MAST score (r = −0.44, P = 0.002, Spearman correlation analysis) (Figure 3(g)).
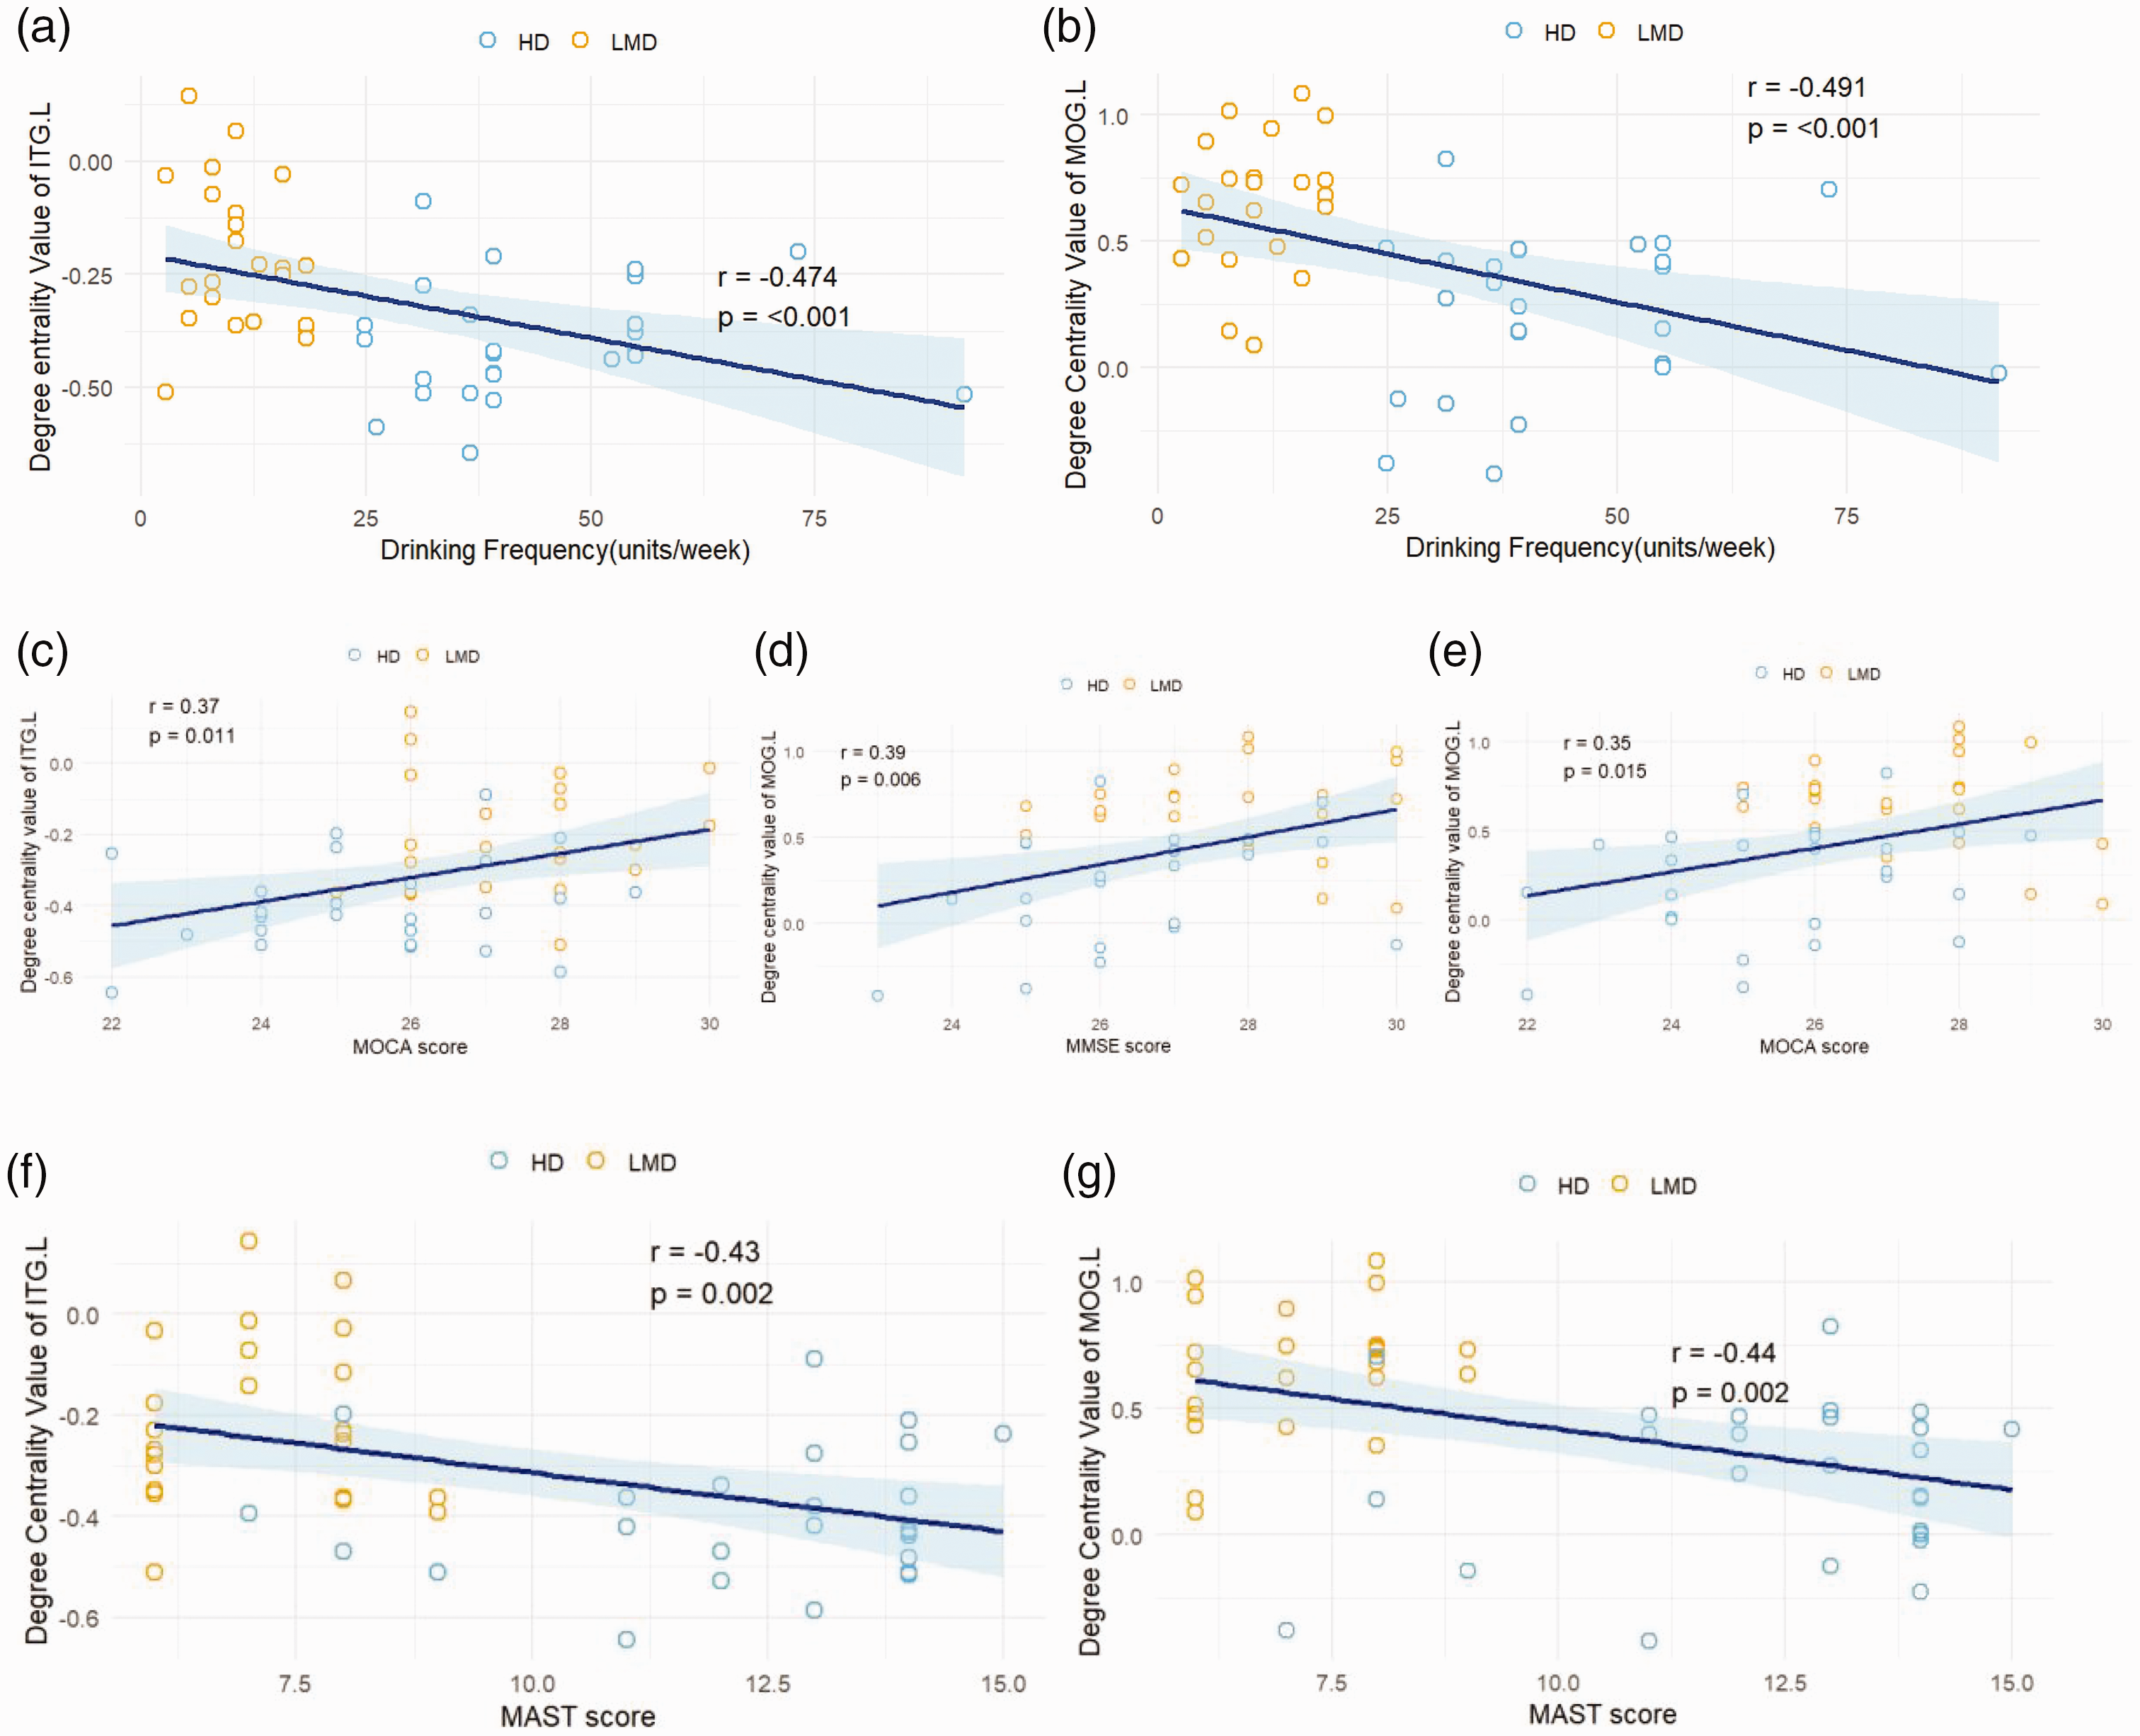
(a) Correlation graph depicting the relationship between the DC value of ITG.L and drinking frequency; (b) correlation graph depicting the relationship between the DC value of MOG.L and drinking frequency; (c) correlation graph depicting the relationship between the DC value of ITG.L and MoCA score; (d) correlation graph depicting the relationship between the DC value of MOG.L and MMSE score; (e) correlation graph depicting the relationship between the DC value of MOG.L and MoCA score; (f) correlation graph depicting the relationship between the DC value of ITG.L and MAST score; (g) correlation graph depicting the relationship between the DC value of MOG.L and MAST score. (Shaded areas indicate confidence intervals). DC: degree centrality; ITG.L: left inferior temporal gyrus; MAST: Michigan Alcoholism Screening Test; MoCA: Montreal Cognitive Assessment; MOG.L: left middle occipital gyrus; MMSE: Mini-Mental State Examination.
Discussion
This study employed DC analysis to investigate the effects of varying levels of long-term alcohol consumption on brain function. It also examined the correlations between imaging differences in brain regions and clinical variables, alcohol dependence indices, and neuropsychological test scores. We found that, compared with the HC group, the HD group exhibited significantly reduced DC values in the ITG.L and MOG.L. Additionally, compared with the LMD group, the HD group also showed significantly lower DC values in these two regions. Partial correlation analysis further revealed that DC values in the ITG.L were significantly associated with drinking frequency, MoCA scores, and MAST scores. Similarly, DC values in the MOG.L were significantly correlated with drinking frequency, MMSE scores, MoCA scores, and MAST scores. These findings reflect the impact of long-term alcohol use on brain function and suggest potential neuropathological mechanisms underlying alcohol-related cognitive impairment.
Our findings indicate that, compared with the HC group, individuals in the HD group had significantly decreased DC values in the ITG.L. The inferior temporal gyrus, as a key structure in the temporal lobe and part of the ventral visual stream, 16 plays a central role in higher-order visual processing and semantic memory, particularly in object recognition, semantic information processing, and visual language comprehension. Numerous neuroimaging and neuropsychological studies17,18 have emphasized the importance of this region in recognizing and understanding visual information. Dysfunction in this area has been implicated in conditions such as prosopagnosia, semantic memory impairment, and visual agnosia. Previous research 19 has shown that CAC may impair brain mitochondrial function by downregulating SIRT3 expression in the hippocampus, leading to increased protein oxidative stress and acetylation levels. Alcohol can also suppress ATP production by inhibiting mitochondrial complex II oxidative phosphorylation, ultimately impairing energy metabolism in the brain and causing cognitive decline. Our study demonstrated reduced DC values in the ITG.L in the HD group, suggesting that long-term alcohol exposure may disrupt FC between this region and the rest of the brain, potentially leading to impairments in visual recognition, language comprehension, and overall cognitive abilities. Furthermore, the significant positive correlation between DC values in the ITG.L and MoCA scores reinforces the critical role of this region in cognitive formation and highlights its involvement in the neuropathology of alcohol-related cognitive deficits.
Unfortunately, we did not find significant brain region differences between the HD and LMD groups. One possible explanation is that light-to-moderate drinking had not yet caused lasting disruptions to brain functional networks in the LMD group and thus failed to produce detectable changes in neural activity on fMRI. Additionally, DC, as a measure of nodal connectivity strength, may lack sensitivity to early or subtle reorganization of brain function. Future studies should incorporate larger sample sizes, more refined grouping criteria, and multimodal imaging techniques to comprehensively explore the impact of various levels of alcohol consumption on brain functional networks.
Compared with the LMD group, the HD group exhibited significantly decreased DC values in the MOG.L and ITG.L. The MOG.L spans Brodmann areas (BA) 18 and 19, which serve distinct roles in visual processing: BA18 is primarily involved in transforming primary visual information into perception, while BA19 integrates visual, auditory, and other sensory information to form higher-level cognition. 20 As a critical region of the visual cortex, the middle occipital gyrus not only processes visual signals but also participates in language processing, working memory, and motor perception. Previous studies have shown that HDs exhibit weakened alpha-wave activity in the occipital visual association cortex during visuospatial tasks, suggesting abnormal neural dynamics associated with impaired visuospatial processing. 21 Karoly et al. 22 reported cortical thinning in the occipital lobe among HDs, indicating structural damage in visual-processing regions. Wei et al. 23 documented aberrant intra- and interhemispheric FC within the visual resting-state network in chronic drinkers, with the degree of connectivity disruption positively correlated with average alcohol intake and severity of alcohol dependence. Our findings of reduced DC values in the MOG.L and inferior temporal gyrus in the HD group provide functional-level evidence supporting alcohol-induced damage to these regions and offer new insights into the underlying neural mechanisms. Partial correlation analysis further revealed that DC values in the MOG.L were significantly associated with drinking frequency and MAST scores. This suggests that higher drinking frequency and more severe alcohol use behaviors are linked to greater brain functional impairments. As a hub region for visual information processing, DC changes within the middle occipital gyrus may reflect disruptions in its integrative role within the brain’s functional network caused by alcohol. Moreover, the association between MAST scores and DC changes supports the notion that brain functional networks are sensitive to long-term or high-frequency alcohol use. These findings bolster the dose-response hypothesis between alcohol consumption and neurotoxicity and offer objective neuroimaging evidence of alcohol-related neurological impairment.
Previous studies have shown that light drinking may be harmless or even protective to the central nervous system. However, chronic or excessive alcohol consumption is linked to irreversible cognitive deficits, neurodegeneration, and dementia. Mechanistically, alcohol activates glutamate receptors (especially N-methyl-D-aspartate (NMDA) receptors), inducing excitotoxicity and neuronal death. It also promotes oxidative stress, which damages cell membranes and DNA, and accelerates neurodegeneration. 24 A recent meta-analysis 25 revealed a J-shaped relationship between alcohol intake and cognitive decline or dementia risk. High levels of alcohol consumption (more than 30 g/day for men and 20 g/day for women) are significantly associated with increased risk of cognitive impairment and dementia. Our study further highlights that even in the absence of clinically evident dementia, early alterations in brain functional networks are closely related to alcohol use behavior, underscoring the potential long-term effects of alcohol on brain microstructure.
Limitations
This study has several limitations. First, the relatively small sample size and the age range restriction to 40–60 years may limit the generalizability of the results and reduce statistical power. Additionally, drinking behaviors were self-reported, which may introduce subjective bias, and the study did not differentiate between different types of alcoholic beverages. The analysis focused solely on DC as a measure of brain FC. Future research should incorporate multimodal techniques such as electroencephalography and fMRI to gain a more comprehensive understanding of the underlying mechanisms.
Conclusion
This study, based on DC analysis, revealed significant alterations in brain FC in key network hubs in long-term drinkers, particularly in the ITG.L and MOG.L. Correlation analyses with clinical variables, neuropsychological scores, and alcohol dependence severity further demonstrated that these functional abnormalities are closely linked to alcohol use behavior and cognitive dysfunction. The findings suggest that chronic, high-frequency alcohol consumption may disrupt the integrative function of brain networks and accelerate cognitive decline. Changes in DC within the inferior temporal and middle occipital gyri may serve as potential neuroimaging biomarkers of alcohol-induced brain dysfunction, providing theoretical and imaging-based evidence to support understanding of the neuropathological mechanisms of alcohol use and inform early intervention strategies.
Footnotes
Acknowledgements
We sincerely thank all the participants for their contribution to this study.
Author contributions
Yue Liu: Conceptualization, Resources, Data Curation, Supervision.
Guangping Su: Formal Analysis, Visualization, Writing–Original Draft, Writing–Review & Editing.
Zhezi Wang: Formal Analysis, Visualization, Writing–Original Draft, Writing–Review & Editing.
Yanxi Xiong: Investigation.
Xingwu Xie: Investigation.
Bencheng Mo: Resources, Data Curation.
Data availability statement
The data supporting the findings of this study are available from the corresponding author upon reasonable request. Due to the high cost of data collection and the involvement of personal participant information, the dataset is not publicly available.
Declaration of conflicting interests
The authors declare no conflicts of interest.
Funding
This research was supported by the Guiding Research Project of Shiyan Science and Technology Bureau (No. 22Y69) and the Guiding Research Project of Hubei Provincial Health Commission (No. WJ2023F091).