
Abstract
Objectives
The aim of the present study was to compare the differences in clinical outcomes within 6 months postoperatively between a complement-dependent cytotoxicity <10% group of low-risk kidney transplant patients and a complement-dependent cytotoxicity ≥10% group of relatively high-risk patients.
Methods
The clinical data of 330 patients who underwent kidney transplantation were retrospectively analyzed. The patients were divided into three groups according to the results of complement-dependent cytotoxicity crossmatch: (a) group 1 (complement-dependent cytotoxicity ≥10%); (b) group 2a (5% ≤ complement-dependent cytotoxicity < 10%); and (c) group 2b (complement-dependent cytotoxicity <5%). The clinical outcomes were compared between the three groups.
Results
Significant differences were noted in serum creatinine levels and estimated glomerular filtration rate between groups 2a and 2b on days (D) 1, 2, 3, and 7 (P < 0.005). From postoperative D1 to month (M) 6, a significant difference (P < 0.05) was noted in urea levels between the three groups. On D3, blood glucose levels were significantly lower in group 2b than in group 2a (P < 0.001); at M6, group 2b exhibited lower blood glucose levels than group 1 (P = 0.043). On D2, group 2b had a lower neutrophil percentage than group 1 (P < 0.05), which was significantly different from those of groups 1 and 2a on D3 (P < 0.05). The percentage and absolute number of lymphocytes in group 2b were significantly higher than those in group 1 (P < 0.01) on D1 and D2. The percentage and absolute number of lymphocytes were significantly higher in group 2b than in groups 1 and 2a on D3 and D7 (P < 0.05).
Conclusions
Complement-dependent cytotoxicity <10%, particularly complement-dependent cytotoxicity <5%, was associated with superior attributes compared with complement-dependent cytotoxicity ≥10% in terms of most aspects of postoperative recovery and low incidence of adverse events. However, delayed graft function rate was highest in the complement-dependent cytotoxicity of 5%–10% group. The source of donor kidneys was the most important factor influencing delayed graft function, and a larger cohort with a longer follow-up period may be needed to verify the tendency.
Keywords
Introduction
End-stage renal disease is the terminal stage of chronic kidney disease. Renal replacement therapy, including hemodialysis, peritoneal dialysis, and kidney transplantation, remains the most effective treatment for patients with this condition. For most patients with renal failure, kidney transplantation is considered a superior treatment modality for reducing all-cause mortality. This treatment modality has shown a survival benefit compared with continuous dialysis, 1 although not all patients with renal failure are eligible for kidney transplantation as their risk–benefit profiles are individualized. 2 Advances in transplantation surgery, pharmacology, immunology, and post-transplant care have led to progressively longer survival times for transplanted organs and their recipients; however, the 10-year survival rate of transplanted kidneys is 62.4%. 3
Previously published studies have suggested that approximately 60% of cases of kidney graft dysfunction are attributed to donor-specific antibody (DSA)–mediated rejection, and the main component of DSA is anti-donor human leukocyte antigen (HLA) antibody.4,5 With the continuous development of surgical techniques for kidney transplantation, generalization of tissue-matching techniques, widespread use of antibody-inducing therapies, and introduction of novel potent immunosuppressants during the perioperative period, the occurrence of acute rejection (AR) has gradually decreased. Nevertheless, rejection remains the primary independent risk factor for the long-term survival of transplanted kidneys, representing a bottleneck that needs to be urgently addressed. Routine complement-dependent cytotoxicity crossmatch (CDC-XM) and panel reactive antibody (PRA) testing prior to transplantation can effectively reduce the risk of AR.
A dead lymphocyte count of >10% in CDC-XM is usually defined as being complement-dependent cytotoxicity (CDC)-positive. However, CDC positivity is a contraindication to kidney transplantation, as a previous study 6 demonstrated that a positive result considerably reduces both post-transplantation graft survival and patient survival. In clinical practice, the transplant surgeon may consider a CDC of 10%–20% but not >20% as an acceptable threshold. Furthermore, some patients with a dead lymphocyte count slightly >10% may be operated on following a comprehensive evaluation that takes into account the results of the PRA or DSA assay, donor–recipient HLA genotypic match, and general condition of the patient targeted to undergo transplantation, thus increasing the kidney transplant rate. In Asia, only a few studies have been conducted on the clinical outcomes of kidney transplants for patients with CDC >10%. 7 This study aimed to estimate the differences in postoperative outcomes within 6 months between a CDC <10% group of low-risk kidney transplant patients and a CDC ≥10% group of relatively high-risk patients, providing improved guidance for the selection of clinical donor kidneys and post-transplant therapy.
Patients and methods
Design and study cohort
The reporting of this retrospective study conforms to the Strengthening the Reporting of Observational Studies in Epidemiology (STROBE) guidelines. 8 A total of 666 patients who underwent CDC-XM between September 2020 and September 2022 at the First Affiliated Hospital of Anhui Medical University were enrolled in the present study. The inclusion criteria were as follows: (a) patients who had successfully undergone kidney transplantation and were first-time solid organ transplantation recipients; (b) those aged between 18 and 60 years; (c) those with negative or weakly positive preoperative PRA; (d) those who were administered standard triple immunosuppressive therapy with tacrolimus (TAC) + mycophenolate mofetil (MMF) + glucocorticoids in the postoperative period; and (e) those with well-established laboratory indicators at the relevant postoperative time points. The exclusion criteria were as follows: (a) patients who required early postoperative changes in the administration of maintenance immunosuppressive drugs; (b) those with underlying diseases, such as severe hypertension, diabetes mellitus, coronary heart disease, or cerebrovascular disease; and (c) those with incomplete clinical data. A total of 330 patients were included in this study after screening. The details of patient selection from the database are shown in Figure 1.

Details of patient selection and research process.
Patients were followed up for 6 months postoperatively. 9 The data collected included recipient information (name, sex, age, ABO and Rhesus (Rh) blood groups, history of illnesses, and diagnosis of the current hospitalization), donor information (type of donor, relationship with the recipient, and ABO and Rh blood groups), surgical information (date of surgery, results of CDC-XM, and details of maintenance immunosuppressive medications), laboratory data (levels of serum creatine (SCr) and urea, estimated glomerular filtration rate (eGFR), levels of blood glucose and hemoglobin (Hb), percentages of reticulocytes (RET%), absolute numbers of reticulocytes (RET#), low-fluorescence intensity reticulocytes (LFRs), medium-fluorescence intensity reticulocytes (MFRs), high-fluorescence intensity reticulocytes (HFRs), Hb content of reticulocytes (RET-He), white blood cell count (WBC), percentage of neutrophils (N%), absolute number of neutrophils (N#), percentage of lymphocytes (L%), absolute number of lymphocytes (L#) on the final preoperative day and on postoperative day (D) 1, D2, D3, D7, D30, D90, and D180, and the blood drug level of TAC on postoperative D7, D14, D30, D90, and D180), and post-transplant adverse events (delayed graft function (DGF), pulmonary infection, and recipient death or graft loss within 1 year of transplantation). DGF was defined as the need for hemodialysis treatment within 7 days postoperatively or SCr level >400 µmol/L within 7 days postoperatively despite not requiring hemodialysis. Pulmonary infection was defined as inflammation of the lungs, as suggested by chest radiographs or computed tomography within 2 weeks postoperatively.
According to the percentage of dead lymphocytes in the final CDC-XM evaluated prior to transplantation, patients were divided into three groups. Patients with CDC ≥10% were included in group 1; we attempted to categorize the negative group into two groups to obtain more instructive conclusions (group 2a (5% ≤ CDC < 10%) and group 2b: (CDC < 5%)). If the recipient underwent plasma exchange (PE), double-filtration plasmapheresis (DFPP), or lymphoplasmapheresis (LPE) prior to transplantation, they were grouped based on the CDC detected after processing. If CDC was <10% after treatment, these patients were placed in group 2a or 2b; if CDC was ≥10% after treatment, they were placed in group 1.
Test methods and equipment
All tests were performed at the same facility, and the results were recorded in the hospital database. CDC-XM experiments were performed using Ficoll–Hypaque density gradient centrifugation. 10 Renal function indicators were measured using a Roche automated biochemistry analyzer and accompanying reagents, and emergency items were measured using a DT-60 dry chemistry analyzer (Roche Diagnostics). Blood routine indexes were tested using a SYSMEX™ XE-2100 (Sysmex Corporation) automatic five-category blood cell analyzer and supporting reagents. The blood level of TAC was measured using enzyme-linked immunosorbent assay at the Therapeutic Drug Monitoring Center.
Immunosuppression
The postoperative immunosuppression regimen for all patients was standard triple immunosuppressive therapy (TAC + MMF +glucocorticoids). 11 Sulfamethoxazole and ganciclovir were prescribed as antimicrobial prophylaxis medication. The majority of patients underwent either regular preoperative hemodialysis or peritoneal dialysis to remove toxins from the body. Patients with weakly positive PRA and CDC >10% underwent (if possible) at least two rounds of PE or DFPP to remove antibodies prior to transplantation, and several patients received combination therapy with rabbit anti-thymocyte globulin or rituximab to induce immunity. If the recipient required hemodialysis during preconditioning, PE/DFPP and hemodialysis were alternatively performed. In one patient, the immunosuppressant was changed to cyclosporine at 2 months postoperatively; therefore, the laboratory results of this patient at month (M) 3 and M6 were excluded from the statistical analysis.
Prior to transplantation, recipients with ABO-incompatible (ABOi) or Rh-incompatible blood received immunosuppressive therapy for 1–4 weeks. According to the initial blood group antibody titer of the recipient, rituximab (100–200 mg/m2) was combined with LPE to remove B lymphocytes and existing blood group antibodies as well as inhibit the production of new antibodies. The COBE spectra blood cell separator (Terumo BCT, Lakewood, CO, USA) was used, and the matched disposable leukocyte separation kit was used for LPE. A blood preservation solution (anticoagulant citrate dextrose solution A) was used as anticoagulant. As determined by the height and weight of the recipient, 500 mL of 5% albumin and 1500–2000 mL of AB-type plasma were selected as replacement fluid each time. The program manual mode was set to mononuclear cell to remove lymphocytes and plasma simultaneously. LPE was repeated until the blood group antibody titer was lower than the target titer (immunoglobulin M (IgM) ≤ 1:4; IgG ≤ 1:16). As a cautionary measure, after reaching the target titer, the recipient still received 1–2 additional rounds of LPE to obtain a lower titer. Dexamethasone was used prophylactically 30 min before LPE to relieve possible allergic reactions during plasma infusion. If the recipient required hemodialysis during preconditioning, LPE and hemodialysis were alternatively performed. The blood group antibody titer was monitored within 2 weeks postoperatively, and recipients with an IgG or IgM blood group antibody titer of ≥1:32 further underwent LPE 2–3 times.
Ethical considerations
The study procedures were in accordance with the Helsinki Declaration of 1975, as revised in 2013. Ethical approval for the study was granted by the First Affiliated Hospital of Anhui Medical University Ethics Committee (approval no. Quick-PJ 2024-01-47). De-identified patient details were used for the study. The data and samples utilized in this study were obtained from the hospital’s electronic medical record system. In the present retrospective study, the privacy and personal information of all patients were protected.
Statistical analysis
The study groups were compared based on baseline characteristics and relevant laboratory indicators, and Statistical Package for the Social Sciences 25.0 (IBM Corp.) was used for statistical analyses. Normally distributed quantitative data were expressed as the mean ± standard deviation (mean ±SD), and analysis of variance with a completely randomized design was used to compare different groups. Non-normally distributed quantitative data were expressed as median (interquartile range). The Friedman M test was used for comparison of data within groups, and the Mann–Whitney U test or Kruskal–Wallis H test with post hoc analysis was used for comparisons among the different groups. Qualitative data were expressed as frequencies (percentages, n (%)), and comparisons between groups were made using chi-squared test. Spearman’s method was used to analyze the correlation between two variables. P-values of <0.05 were considered to indicate statistical significance.
Results
Baseline characteristics of the patients
A total of 330 patients who underwent kidney transplantation were included in this study; of these, 245 (74.24%) were males and 85 (25.76%) were females, with a mean age of 36.68 ± 8.76 years. The baseline characteristics of the patients are shown in Table 1. Except for ABO blood group compatibility (P = 0.020), source of donor kidneys (P < 0.001), and incidence of DGF (P = 0.004), which were significantly different among the three groups, no significant differences (P > 0.05) were noted in other characteristics, including age, sex, and blood groups of the patients, between the three groups.
Baseline characteristics of study groups.
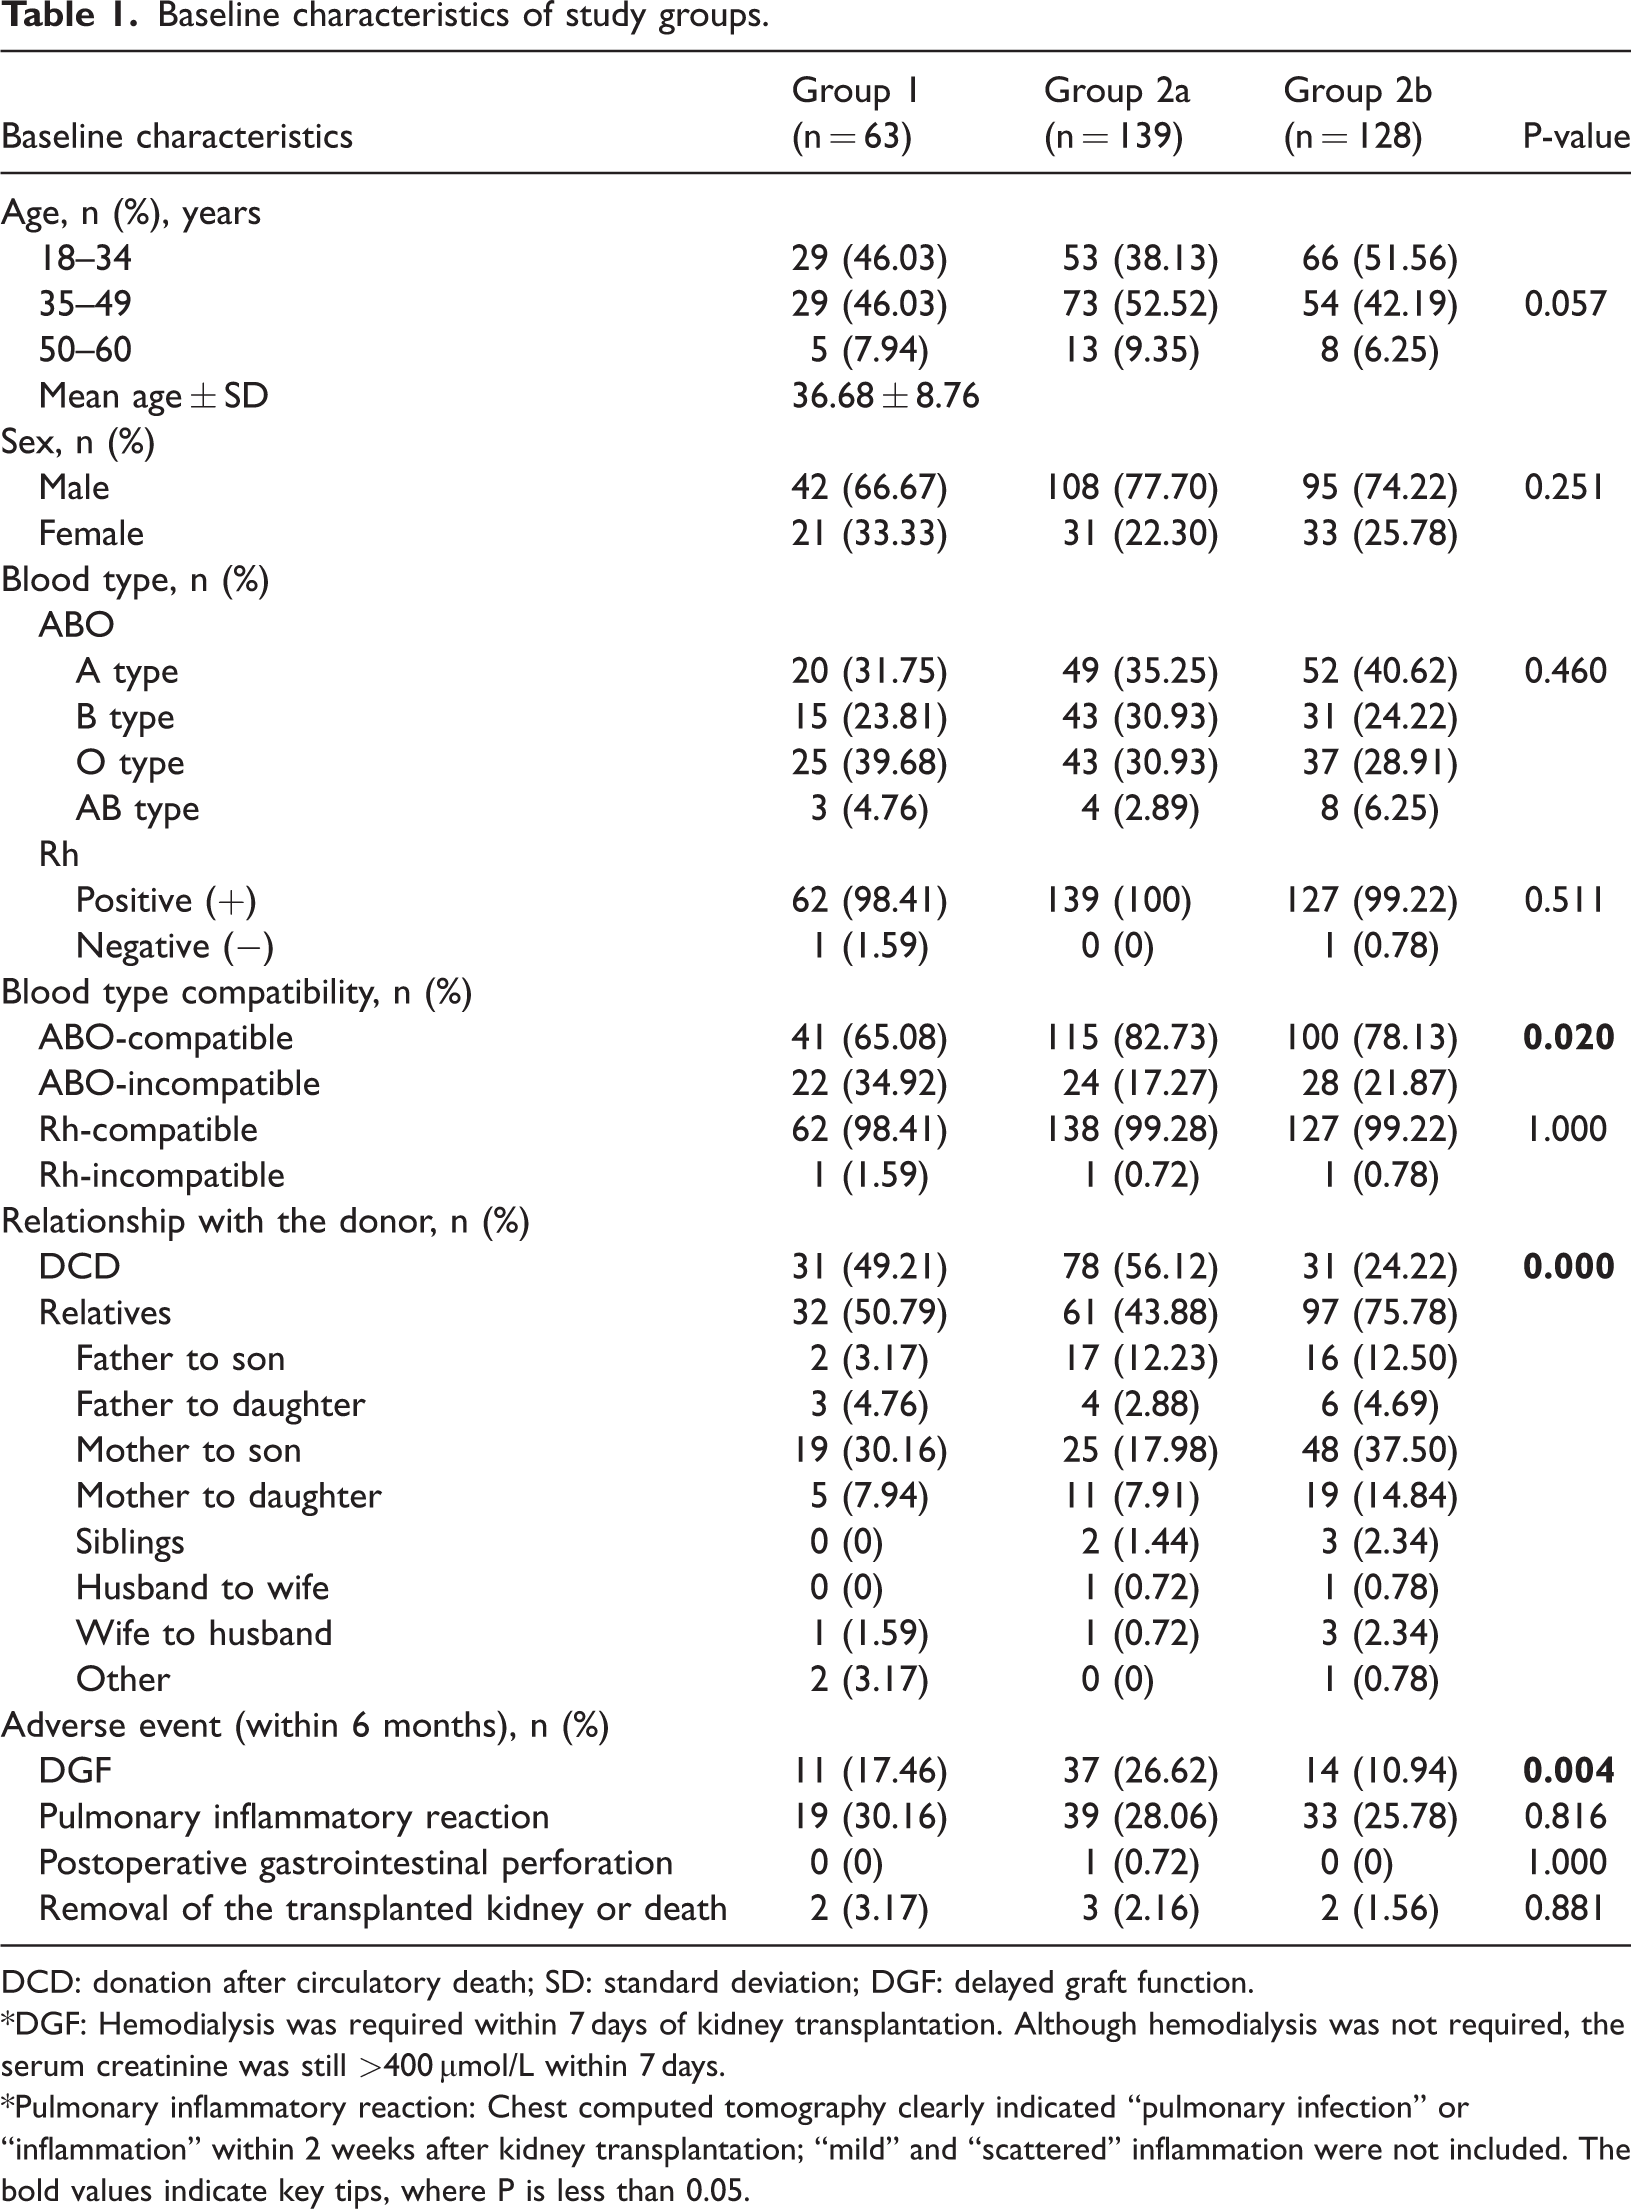
DCD: donation after circulatory death; SD: standard deviation; DGF: delayed graft function.
*DGF: Hemodialysis was required within 7 days of kidney transplantation. Although hemodialysis was not required, the serum creatinine was still >400 μmol/L within 7 days.
*Pulmonary inflammatory reaction: Chest computed tomography clearly indicated “pulmonary infection” or “inflammation” within 2 weeks after kidney transplantation; “mild” and “scattered” inflammation were not included. The bold values indicate key tips, where P is less than 0.05.
In group 1, the proportion of ABOi kidney transplants (34.92%) was significantly higher than those in the other two groups (17.27% and 21.87%), and approximately half of the patients’ donor kidneys originated from deceased donors (49.21%). Patients in group 2a had the highest proportions of donor kidneys originating from deceased donors (56.12%) and patients experiencing DGF following surgery (26.62%). In contrast, group 2b had a high proportion of related donors (75.78%), and only 10.94% of patients experienced DGF, which was the lowest among the three groups. The incidence of pulmonary infection within 2 weeks postoperatively was approximately 25%–30%, with group 2b exhibiting the lowest incidence (25.78%) and group 1 showing the highest incidence (30.16%), although the difference was not statistically significant (P = 0.816).
Primary outcomes
The curves of changes in the clinical indicators from the perioperative period to 6 months postoperatively are shown in Figure 2, and the statistical descriptive data are shown in Table SI.

Curve chart of changes in various clinical indicators within 6 months after surgery. (a) Serum creatinine (SCr); (b) Estimated glomerular filtration rate (eGFR); (c) Urea; (d) Serum glucose (Glu); (e) Hemoglobin (Hb); (f) Percentage of reticulocytes (RET%); (g) The absolute number of reticulocytes (RET#); Continued.(h) Low-fluorescence intensity reticulocytes (LFR); (i) Medium-fluorescence intensity reticulocytes (MFR); (j) High-fluorescence intensity reticulocyte (HFR); (k) Hemoglobin content of reticulocytes (RET-He); (l) Leukocyte count (WBC); (m) The absolute number of Neutrophils (N#); (n) The percentage of neutrophils (N%); (o) The percentage of lymphocytes (L%); (p) The absolute number of lymphocytes (L#). *D0: Last blood drawn before transplantation; D1: the first day after transplantation; D2: the second day after transplantation; D3: the third day after transplantation; D7/W1: the 7th day after transplantation/1 week after transplantation; W2: 2 weeks after transplantation; M1: 1 month after transplantation; M3: 3 months after transplantation; M6: 6 months after transplantation.
Comparisons of renal function
Based on an analysis of the curves, the SCr levels decreased with postoperative time, leveling off after 7 days (notably, group 2a leveled off after 1 month). In contrast, the eGFR levels increased with postoperative time, leveling off after 7 days (group 2a leveled off after 3 months) (Figure 2(a) and (b), Table SIA and SIB). On D1, D2, D3, and D7, the levels of SCr and eGFR differed among the three groups, and post hoc comparisons revealed that the differences between group 2a and group 2b (P < 0.005), those between group 1 and group 2a, and those between group 1 and group 2b were not statistically significant (P > 0.05) (Table SIIA and SIIB). As chi-squared test performed to assess differences within the groups revealed significant differences, post hoc comparisons were subsequently performed within the groups (Table SIIIA and SIIIB), which revealed that the recovery of SCr and eGFR levels was slower in group 1 than in group 2, although this recovery stabilized at 7 days postoperatively in all three groups.
The decrease in the urea level occurred most significantly between D7 and M1 (Figure 2(c)), leveling off after 1 month. No significant decreases in urea levels were observed between groups 1 and 2a at 3 days postoperatively; notably, a slight increase was observed, which then began to be reversed, ultimately falling below the preoperative baseline level after D7. A gradual downward trend in the urea level of group 2b was observed from D1; therefore, group 2b exhibited characteristics distinct from the other two groups. There were significant differences among the three groups at all seven postoperative time points (P < 0.05), and post hoc comparisons between and within groups are shown in Tables SIIC and SIIIC. Similar to SCr and eGFR, the most significant differences between the three groups in the urea level were mainly observed between group 2a and group 2b; in addition, on D3, the differences in urea levels between group 2b and group 1 and between group 2b and group 2a were statistically significant.
Comparison of blood glucose levels
The blood glucose level increased rapidly from D1 to D3 postoperatively, which was influenced by surgery or infusion performed postoperatively, with subsequent stabilization observed after reaching normal levels on D7 (Figure 2(d) and Table SIIID). On D3, the levels of blood glucose were significantly lower in group 2b than in group 2a (P < 0.001) (Table SIID). At M6, group 2b had significantly lower blood glucose levels than group 1 (P = 0.043), whereas the difference between group 2b and group 2a was not statistically significant.
Comparison of erythrocyte systems
The Hb level tended to initially decrease and subsequently increase with the postoperative time, stabilizing at M3 and returning to essentially normal levels at M6 (Figure 2E). The decline in the Hb levels of groups 1 and 2a started to be reversed on D3, whereas for group 2b, this reversal occurred earlier and faster compared with the other two groups. The Hb levels of groups 1 and 2b recovered to the D0 level by M1, whereas that of group 2a recovered relatively slowly, not managing to recover to the D0 level until M3 (Table SIIIE). Unusually, the Hb level of females in group 2a was significantly lower than that of males in the same period at each preoperative and postoperative time point (P < 0.05).
The RET% and RET# values fell within the normal range from D0 to D7 with insignificant fluctuations, although they rose rapidly after D7, peaking at M1 (approximately twice the baseline levels), showing a significant increase compared with the values in the preoperative period and early postoperative period (P < 0.001); the levels subsequently declined after M1 but remained higher than normal (Figure 2(f) and (g)). The RET% value in group 2b increased earlier than the other two groups (P < 0.05); moreover, the RET# values exhibited the same trend, although the differences were not significant in the present study (P > 0.05) (Table SIIIF and SIIIG).
Compared with the other two groups, group 2b had the highest preoperative LFR values and the lowest MFR and HFR values, although the difference was not statistically significant (P > 0.05). Changes in the LFR curve of group 1 showed a significant trough level at D7, whereas the HFR curve of group 2b exhibited a significant peak level at M1. Regarding the changes in MFR, all three groups showed a peak at D7 (Figure 2(h)–(j)). The RET-He values tended to fluctuate in a general downward trend within the normal range, with troughs occurring at D3 and M1 and a peak occurring at D7 in all three groups. The peak level was the highest during the observation time (group 1: 32.8 (range: 35.0–30.3); group 2a: 32.9 (range: 34.5–31.4); and group 2b: 33.1 (range 34.1–31.1)) (Figure 2(k)).
Comparison of leukocyte systems
The leukocyte levels of the three groups of patients were 6–7 × 10⁹/L on D0, increasing rapidly from D1 and then essentially declining to the high normal level within 7 days, with a further decrease to the D0 level after 1 month. Leukocyte levels in group 1 decreased more slowly than those in groups 2a and 2b within 7 days postoperatively (Figure 2(l), Table SIL, and Table SIIIL). The trends of N# and N% values were essentially identical to the leukocyte levels, and the neutrophil parameters of the patients in the three groups were all within the normal range on D0, increasing rapidly to reach the highest value of the curve on D1 and D2, with a subsequent decrease to the D0 level after M1, finally leveling off after M3 (Figure 2(m) and 2(n)). The N% value was lower in group 2b than in group 1 on D2 (P < 0.05), whereas the difference between group 2b and both groups 1 and 2a were found to be significant on D3 (P < 0.05) (Table SIIE). In contrast, the N% value declined earlier in group 2b than in the other two groups, whereas the N# value declined more slowly in group 1 than in the remaining two groups (Table SIIIM and SIIIN).
The L% and L# values decreased sharply on D1 and were sustained at a very low level for 3 days post-transplantation, before beginning to rise gradually, eventually returning to the D0 level and leveling off at M1 (Figure 2(o) and 2(p); Table SIO and SIP, and Table SIIIO and SIIIP). Significant differences (P < 0.05) were observed among the three groups on D1, D2, D3, and D7 (Table SIIF and SIIG). The L% and L# values were significantly higher in group 2b than in group 1 on D1 and D2 (P < 0.01), whereas the difference between group 1 and group 2a was not significant (P > 0.05). On D3 and D7, the L% and L# values were significantly higher in group 2b than in groups 1 and 2a (P < 0.05) (Figures 3 and 4).

Difference in the percentage of lymphocytes (L%) among three groups of patients on D1 (a), D2 (b), D3 (c), and D7 (d).

Difference in the absolute number of lymphocytes (L#) among three groups of patients on D1 (a), D2 (b), D3 (c), and D7 (d).
Comparisons and correlation analysis of the blood TAC level
During the five time points used in the study, the blood TAC levels in the three groups were essentially controlled within the limits described above, and the differences between the groups were not statistically significant (P > 0.05). Spearman’s correlation analysis showed that the correlation coefficients between the CDC and TAC blood levels at week (W) 1, W2, M1, M3, and M6 were 0.040 (P = 0.471), −0.142 (P = 0.01), 0.012 (P = 0.831), −0.038 (P = 0.499), and −0.015 (P = 0.785), respectively (Figure 5, Table SIV).
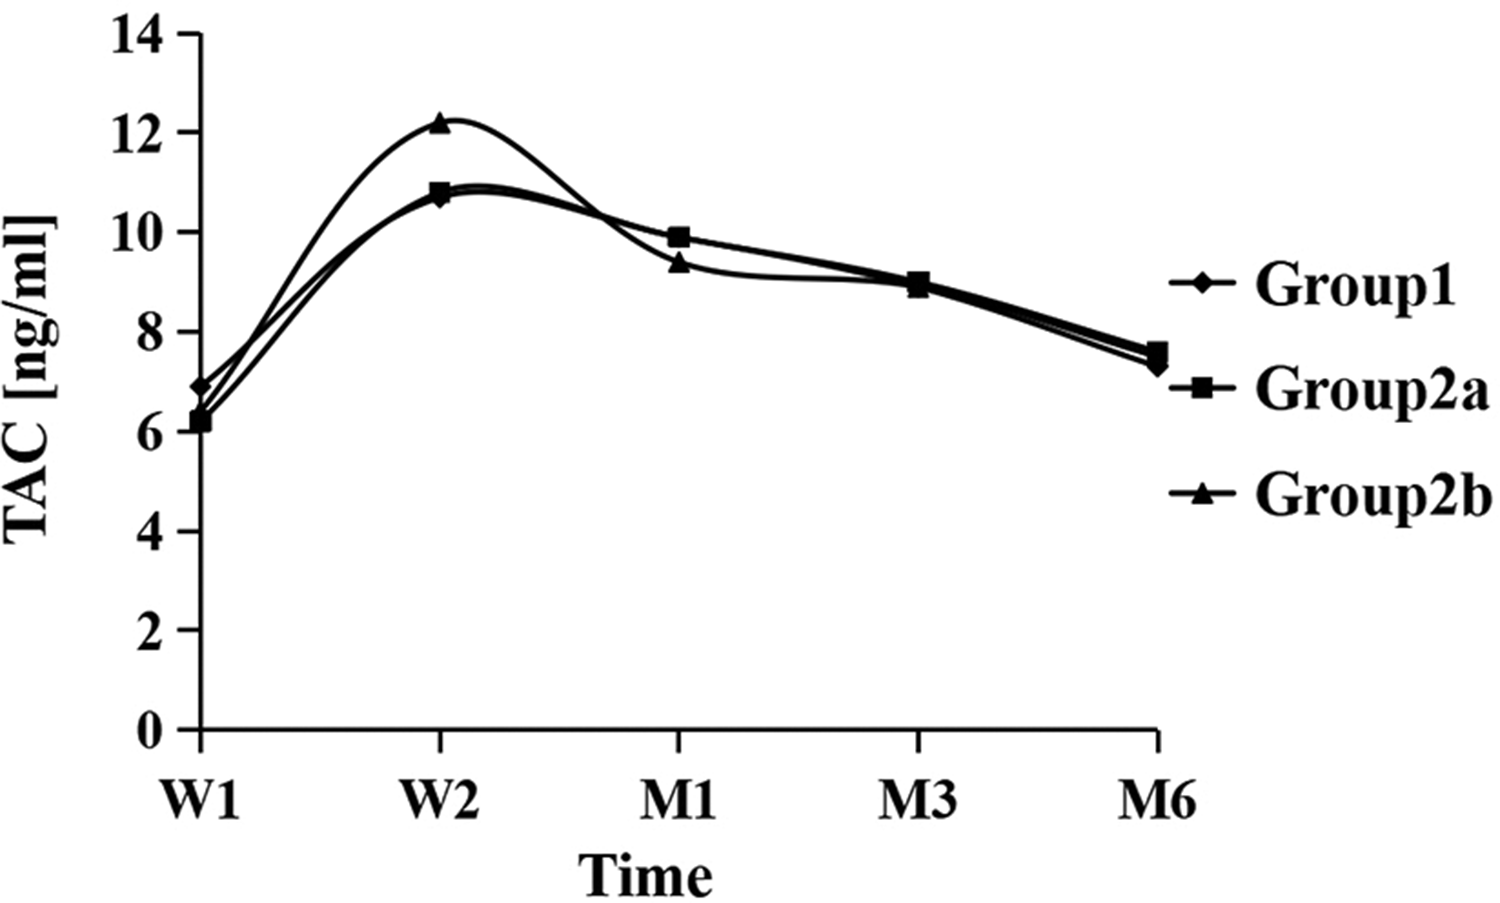
Curve chart of changes in blood level of tacrolimus (TAC) within 6 months postoperatively.
Multivariate regression analysis
In the present study, differences were noted among the three groups in terms of the source of donor kidneys, ABO compatibility, and incidence of DGF. Therefore, multivariate regression analysis was performed, with the presence or absence of DGF as the dependent variable and CDC, ABO compatibility, and source of donor kidneys as independent variables (Table SVA). The results showed that the effect of the source of donor kidneys on DGF was statistically significant in the regression model, although CDC and ABO compatibility had no statistically significant effects on DGF. Multivariate regression analysis of eGFR also showed that the influence of the source of donor kidneys on eGFR after transplantation was statistically significant, whereas that of CDC and ABO compatibility on eGFR was not statistically significant (Table SVB). Similarly, only the source of donor kidneys revealed statistically significant results in multivariate regression analyses of other clinical indicators. This may be explained by the indirect effect of CDC and the greater influence of the source of donor kidneys on the clinical outcome after transplantation. It must, however, be admitted that our sample size may have been too small to reach a firm conclusion on this issue, and an insufficient number of variables were included.
Discussion
CDC-XM can assess the risk of rejection occurring before transplantation, 6 and it remains an important test prior to transplantation. Transplant crossmatching can reduce the incidence of AR by detecting pre-formed HLA antibodies, although the levels of such antibodies may increase immediately after transplantation. 12 In general, CDC positivity is considered a contraindication to kidney transplantation, and the lower the percentage of CDC, the lower the probability of adverse effects occurring after transplantation. In the present study, all patients were divided into three groups based on CDC levels, and the proportion of patients who developed postoperative pulmonary infection increased as the CDC levels increased, although the difference was not significant. Of the 139 patients with 5% ≤ CDC < 10%, 26.62% experienced DGF, indicating an even higher percentage than that of patients with CDC ≥10% (17.46%). Patients with CDC <5% had the lowest percentage of DGF (10.94%), and a significant difference existed among the three groups (P = 0.004). A review of patients who developed DGF found that patients with a CDC of 5%–10% had the highest proportion of donor kidneys that originated from unrelated deceased donors (94.5%); as this proportion declined, the incidence of DGF also decreased. Preparation of purified lymphocyte suspensions is often difficult to accomplish in deceased donors, and high levels of granulocyte contamination have been shown to result in an excessive positive reaction, possibly due to the higher sensitivity of granulocytes to the nonspecific cytotoxicity of rabbit complement. 6 In addition, the deceased donor may have had a blood transfusion prior to death; therefore, the lymphocytes tested may not have been derived exclusively from the donor, resulting in a deviation between the results of the crossmatch and the actual donor–recipient match. The mechanism of anti-CD20 drugs on B cells mainly comprises CDC mediated by the Fc portion of the antibody. 13 When the Fc portion binds to two neighboring CD20 molecules on the surface of the B cell, complex molecular interactions occur, leading to a significant increase in affinity toward complement. 14 Therefore, it is also necessary to consider the interference of anti-CD20 treatment in CDC-XM. As detailed out-of-hospital medication history is difficult to review, it is often challenging to determine whether the patients had been administered with anti-CD20 drugs, such as rituximab, prior to transplantation.
Group 2a had the lowest rate of ABO incompatibility (2.7%) in patients who developed DGF, suggesting that blood group antibodies are not a major factor influencing prognosis. ABOi living donor kidney transplantation (LDKT) was pioneered as a technique in Japan 15 and subsequently has become more common globally. A total of 74 (22.42%) patients underwent ABOi kidney transplantation in the present study. Improvements in desensitization protocols for incompatible LDKT have led to modest improvements in the likelihood of successful transplantation for ABOi candidates. 16 After ABOi transplantation, the majority of grafts continue to function well, even after anti-donor blood group antibodies return.17–19 It has been shown that ABOi LDKT is associated with a greater mortality risk within the first 30 days post-transplantation (cumulative survival rate of 99.0% vs. 99.6%), although the mortality risk was lower at 180 days post-transplantation. Patients who underwent ABOi LDKT had higher cumulative survival rates at 5 and 10 years (90.0% and 75.4%, respectively) compared with similar patients who remained on the waiting list or underwent ABO-compatible (ABOc) LDKT or ABOc deceased donor kidney transplantation (81.9% and 68.4%, respectively). 20 A study by Montgomery et al. showed that the difference in graft loss in ABOi kidney transplantation was driven by graft loss within 14 days of transplantation, with no significant differences observed after 14 days, and high-volume centers have not reported higher perioperative risks for graft loss. 21
In the present study, compared with patients with CDC >5%, those with CDC <5% were identified as having the lowest SCr level, highest eGFR level, and lowest urea level in the postoperative period, demonstrating a significant advantage in the recovery of postoperative renal function. Patients with CDC of 5%–10% had a lower eGFR compared with the other two groups from D1 to M6 postoperatively, although this difference was not statistically significant between M1 and M6. It has been reported that patients who appeared to have a high eGFR and remained stable within 1 year of transplantation received organs from young donors, which exhibit low immunological risk, absence of persistent allograft injury (immune and nonimmune), and fewer histological lesions associated with allograft injury. 9 Potentially, these findings could explain why group 1 patients (with higher CDC levels) had higher eGFR levels than group 2a patients (with lower CDC levels), as group 1 patients had received a higher proportion of donor kidneys both from related donors and younger donors.
EPO is an important factor in the body that regulates the hematopoietic function of the erythrocyte system. It is mostly secreted by the kidneys and can act on the bone marrow hematopoietic system.22–25 In the present study, the Hb content of reticulocytes fluctuated within normal values during the observation time in all three groups, indicating that the patients did not suffer from iron deficiency as the RET-He parameter is closely associated with iron-deficient erythropoiesis. Therefore, in the mid- to late postoperative period, Hb levels in female patients were found to be significantly lower compared with those in male patients in the same group during the same period of time, probably due to the lower level of androgens in women compared with men and the relatively lower secretion of EPO, which subsequently affects erythropoiesis and Hb synthesis. The Hb level of female patients with CDC of 5%–10% was found to be significantly lower compared with that of males in the same period at each preoperative and postoperative time point, which may be accounted for by the lower preoperative baseline level of Hb in this group of female patients.
In this study, the majority of the patients were mildly anemic in the preoperative period, and there was a further decline in Hb during the early postoperative period, although the numbers of reticulocytes did not show any significant decline, an observation that was different from that reported in other studies. 26 This phenomenon may be due to the gradual recovery of renal function in the early postoperative period and the increased secretion of EPO, although hematopoiesis remained relatively weak, suggesting that the production of reticulocytes may not be sufficient to fully compensate for the loss of red blood cells. The relative increases in the percentages of reticulocytes with medium- and high-fluorescence intensities (i.e. MFRs and HFRs) that were observed in the early postoperative period corroborated this hypothesis as higher the fluorescence intensity, more naive the reticulocytes. In the middle and late postoperative period, with the gradual recovery of the function of the transplanted kidney, the reticulocytes reached a higher level, whereas the Hb level gradually increased; this was significantly higher compared with the level in the preoperative and early postoperative period, resulting in significant recovery of the patients from anemia.
The differences in the Hb level and in the RET%, RET#, LFR, MFR, HFR and RET-He values among the three groups were not found to be significant (P > 0.05) in the timeframe selected for the present study, suggesting that preoperative levels of CDC may not have a significant effect on postoperative erythropoiesis and metabolism, although this observation still needs to be confirmed by retrospective or prospective studies with larger sample sizes.
The leukocyte system provides the best defense against a myriad of dangers. Cell-mediated immunity impairment is common in patients with untreated uremia, and this may increase the susceptibility and severity of microbial and viral infections, which are one of the major causes of illness and death in this population. 26 The immune system exhibits a reactive inflammatory reaction in response to the longer duration and larger incision of kidney transplantation, and so the WBC often increases rapidly from postoperative D1, with a major increase in the numbers of neutrophils observed. Patients with CDC < 10% were superior to those with CDC ≥ 10% in terms of resistance to the inflammatory reaction, as mainly reflected by the fact that patients with CDC ≥ 10% exhibited a decline in leukocyte-associated parameters that occurred slightly later compared with the former group. The trajectories of lymphocytes are the most marked in the leukocyte system, with the L# and L% values being maintained at very low levels from D1 to D7 postoperatively. This may be due to the fact that the use of postoperative immunosuppressive drugs directly leads to a reduction in the numbers of lymphocytes 27 or blockage of lymphocyte activation, conductance and expression, 28 which is reflected in the significant decrease in lymphocyte-associated parameters. Patients with a CDC > 10% were observed to have lower L# and L% values. It has been suggested that the lymphocyte count may be a risk factor for graft and patient prognosis, with patients having a higher risk of graft failure and death when their lymphocyte count falls below 750/mm3 at a given follow-up time compared with similar patients without lymphopenia at the same time points. 29 Therefore, increased attention should be given to lymphocyte parameters in the long-term postoperative care of kidney transplant patients. However, in the present study, the patients were observed only up to 6 months postoperatively, and only seven patients experienced graft loss or death; moreover, the conditions were insufficient for survival analysis to be performed, and so the effects of lymphocyte parameters on long-term prognosis in the present study were not clearly defined.
Triple immunosuppression, consisting of a calmodulin inhibitor, an antiproliferative drug and glucocorticoids, is the most common maintenance immunosuppression protocol for kidney transplantation, with >60% of all patients receiving this treatment. 30 At present, the majority of transplant centers rely on TAC as an effective baseline immunosuppressant in kidney transplantation, 31 and TAC is included in the guidelines as the drug of choice for maintaining immunity.32,33 Owing to pharmacokinetic differences, patients who use TAC require regular monitoring of drug levels to achieve target trough blood levels.34–36 High variant TAC trough levels have been shown to be associated with de novo DSAs and poor prognosis in allogeneic kidney transplantation.37–40 The transplant physicians in our hospital adjusted the usage strictly according to the FK506 C0 window (m1: 10–15; m2–m3: 9–12; m4–m6: 7–10; >6 m: 4–8) during the postoperative period, and the TAC blood drug level was essentially comparable among the three groups of patients. Correlation analysis showed that there was no significant linear correlation between CDC and the TAC blood drug level for each time point (although a significant difference was found at W2, the correlation coefficient was small, and the correlation was weak). However, the present study lacked data on TAC trough levels to assess the differences in this parameter among the three groups, and this limitation will resolve in the next part of the study.
In the present study, correlation analyses were conducted for all indicators, and although certain of the data reflected statistically significant differences, the correlation was weak (−0.3 < r < 0.3), which may have been resulted from the small sample size of the study; therefore, it was not possible to conclude whether or not there was a clear correlation between the CDC and the indicators.
To address the insufficient numbers of kidney donors to meet clinical needs, efforts are being made worldwide to expand the donor pool, including performing kidney transplantations under CDC-positive and ABOi conditions. CDC positivity is highly associated with AR and immediate graft loss. Desensitization is usually achieved using therapeutic apheresis and B cell depletion therapies, which are accompanied by strong immunosuppression. There are two commonly used major clinical desensitization methods, as follows: high-dose intravenous immunoglobulin (IVIG) and PE combined with low-dose IVIG that have been used to decrease the circulating anti-HLA antibody load in patients, thereby increasing the chance of transplantation for sensitized patients.
Overall, the lower the percentage of CDC in kidney transplant patients, the more likely they are to show advantages in terms of most aspects of postoperative recovery as well as a low incidence of adverse events. Conversely, patients in the CDC 5%–10% group had the highest DGF rate compared with the other two groups, and the source of donor kidneys was the most important factor in the occurrence of DGF; however, a larger sample size and longer follow-up period may be needed to evaluate this trend. The single use of CDC levels to assess the prognosis of kidney transplant patients is very lopsided, especially as far as the long-term prognosis is concerned, and the influence of numerous other factors should be taken into consideration, including the source of donor kidneys, DSA, and immunosuppressive regimens. Our goal is to share these data so that clinical doctors can make an informed decision when evaluating histocompatibility based on their crossmatch test of choice.
There were, however, several other limitations of this study. First, retrospective studies are only capable of collecting and analyzing routinely collected data, and the interpretation of the data is limited by the characteristics that were examined for each patient. For example, the complete blood cell count included only the total number and proportion of lymphocytes, with no phenotypes of lymphocyte subpopulations. Second, the study did not address the limited data on pre-transplantation PRA and the absence of information on flow cytometric crossmatch and CDC with anti-human globulin. To avoid the possibility that patients who were statistically different compared with the included patients may have been excluded from the study, cases with a small percentage of missing values were retained in the present study, and the missing values were replaced using an appropriate algorithm; however, this may have resulted in some deviation between their placement and the true values. Finally, this was a single-center study with a medium sample size, and higher-quality multicenter or prospective studies are required to validate the findings of our analysis.
Supplemental Material
sj-pdf-1-imr-10.1177_03000605251332762 - Supplemental material for Impact of preoperative complement-dependent cytotoxicity crossmatch on postoperative outcomes in kidney transplant recipients: A retrospective analysis
Supplemental material, sj-pdf-1-imr-10.1177_03000605251332762 for Impact of preoperative complement-dependent cytotoxicity crossmatch on postoperative outcomes in kidney transplant recipients: A retrospective analysis by Chonghe Xu, Siqi Xie, Meiyi Lu, Wei Xu and Mei Zhu in Journal of International Medical Research
Footnotes
Acknowledgments
The authors thank all the colleagues of the Department of Clinical Laboratory for comments on earlier versions of this manuscript.
Authors’ contributions
CX, ML, and SX collected, organized, and analyzed data. ML wrote the original draft and edited and critically revised the manuscript. CX, SX, WX, and MZ critically revised and edited the manuscript. All authors substantially contributed to the conception and revision of the work.
Data availability statement
The data generated and/or analyzed during the current study are available from the corresponding author upon reasonable request.
Declaration of conflicting interests
The authors declare they have no competing interests.
Funding
This study received funding from the Major Project of Humanities and Social Sciences Research in Anhui Universities (Grant no. SK2021ZD0032) and the Key Project of Natural Science Research of Higher Education Institutions in Anhui Province (Grant No. 2024AH050739).
Supplementary material
Supplemental material for this article is available online.
References
Supplementary Material
Please find the following supplemental material available below.
For Open Access articles published under a Creative Commons License, all supplemental material carries the same license as the article it is associated with.
For non-Open Access articles published, all supplemental material carries a non-exclusive license, and permission requests for re-use of supplemental material or any part of supplemental material shall be sent directly to the copyright owner as specified in the copyright notice associated with the article.