
Abstract
Objective
To develop and validate a nomogram for predicting renal dysfunction in patients with simple renal cysts (SRCs).
Methods
We performed a multivariable logistic regression analysis of an in-hospital retrospective cohort of patients with SRCs in the Urology Department of the First Affiliated Hospital of Anhui Medical University. For prognostic model development, 386 patients with SRCs were enrolled from January 2016 to December 2018. External validation was performed in 46 patients with SRCs from January 2019 to April 2019. The primary outcome was renal dysfunction.
Results
Patients were divided into normal or abnormal estimated glomerular filtration rate groups (293 vs. 93) based on the cut-off value of 90 mL/minute/1.73 m2. Logistical regression analysis determined that age, haemoglobin, globulin, and creatinine might be associated with renal dysfunction, and a novel nomogram was established. Calibration curves showed that the true prediction rate was 77.42%, and decision curve analysis revealed that the nomogram was more effective with threshold probabilities ranging from 0.1 to 0.8. The area under the curves were 0.829, 0.752, and 0.888 in the overall training, internal, and external validation cohorts, respectively.
Conclusions
We established a nomogram to predict the probability of developing renal dysfunction in patients with SRCs.
Keywords
Introduction
Simple renal cysts (SRCs), one of the most frequent kidney diseases, exhibit a prevalence of approximately 27% in patients over 50 years old. 1 The incidence, number, and size of SRCs increase with age. 2 Generally, operative management, including percutaneous aspiration with ethanol injection, open surgery, endoscopic cyst opening, and laparoscopic decortication, is considered in patients with cysts >4 cm in diameter or severe complications. 3 SRCs are found during routine health check-ups, and small cysts cause symptoms and complications, including dull flank pain, hypertension, haematuria, infection, and urinary tract obstruction. 4 Furthermore, whether SRCs are related to renal dysfunction and hypertension has attracted researchers’ attention.5–7 An early study showed that the presence of SRCs was related to hypertension but not renal dysfunction. 6 However, other studies have shown that SRCs are associated with renal dysfunction, and an increased cyst diameter contributed to a more rapid decline in renal function in patients with SRCs.5,7 Therefore, we aimed to further explore the relationship between SRCs, hypertension, and renal dysfunction.
Currently, the estimated glomerular filtration rate (eGFR) is routinely used to assess kidney function, but specific tools for the prediction of renal function in patients with SRCs have not been explored. 8 A nomogram, which is a graphic calculation method, can be used to determine the likelihood of a clinical event through approximate graphical computation based on a two-dimensional diagram. Nomograms are widely used to predict oncological outcomes by integrating different patient variables.9–12 In addition, a nomogram has been applied to evaluate eGFR in patients with suspected renal cell carcinoma undergoing robot-assisted partial nephrectomy. 13 Therefore, we aimed to use a nomogram to estimate eGFR in patients with SRCs.
In the present study, clinical and haematological features were collected from in-hospital patients with SRCs who were prepared for the decortication of renal cysts. In addition, multivariable logistic regression was performed to select statistically significant variables. After establishing the nomogram, calibration curves and decision curve analyses (DCA) were applied to validate this model, and the internal and external validation cohorts were used to further assess the model.
Patients and methods
Participants
This study is a retrospective cohort study and included patients with Bosniak III and Bosniak IV cystic masses. The risks of observing Bosniak I cystic masses and Bosniak II cystic masses are particularly low; therefore, these patients were treated conservatively. 14 Consecutive patients who underwent laparoscopic renal cyst decortication between 1 January 2016 and 31 December 2018 for SRCs in the First Affiliated Hospital of Anhui Medical University were enrolled in this retrospective study. Additionally, in-hospital patients with SRCs were collected as the external validation cohort from 1 January 2019 to 31 April 2019. Because this study is a retrospective study, it did not require patient consent. This study was approved by the Institutional Review Board of the First Affiliated Hospital of Anhui Medical University on 13 January 2021 (approval number: Quick-PJ 2021-01-10). All surgical patients used the same antibiotic regimen after surgery, and patients did not receive nonsteroidal anti-inflammatory drugs after surgery. No patients received other therapies. The exclusion criteria were patients with renal cysts other than SRCs, other renal diseases except for kidney stones, severe systematic disorders, or severe dysfunction of important organs. We de-identified all patient details to protect their identity.
Datasets
All patients were divided into two groups based on eGFR: the normal eGFR group (≥90 mL/minute/1.73 m2) and the abnormal eGFR group (<90 mL/minute/1.73 m2). This dataset included patients’ demographics (age, sex, height, and weight) and health status (hypertension, diabetes mellitus, cyst location, dull flank pain, kidney stones, liver cysts, and haematological features) obtained through the hospital electronic medical record system by two independent researchers. Data regarding serum leukocytes, erythrocytes, thrombocytes, haemoglobin, albumin, globulin, blood urea nitrogen (BUN), creatinine, uric acid (UA), eGFR, triglycerides, high-density lipoprotein cholesterol (HDL-C), low-density lipoprotein cholesterol, and very-low-density lipoprotein cholesterol were included as haematological features. Body mass index (BMI) was calculated by the weight (kg) divided by the height (m) squared. All recorded variables from patients were detected approximately 1 week before surgery. Participants were removed because of missing relevant indicators (mostly because of missing lipid-related indicators).
In the current study, we performed a sample size calculation. We calculate the minimal sample size for the four factors in the nomogram for the training cohort using the following formulas.
The formula for categorical independent variables:

The formula for continuous independent variables:

In these formulas, n is the sample size, Zα/2 is the critical value of the normal distribution at α/2 (e.g., for a confidence level of 95%, α is 0.05, and the critical value is 1.96), σ2 is the population variance for continuous data, p̂ is the population proportion for categorical data, and ε is the difference. Then, we determined that the minimal sample size for age, haemoglobin, globulin, and creatinine is 8, 310, 237, and 163, respectively. The training cohort contained 386 patients for the analysis; therefore, the sample size is sufficient for the current study. We showed the results in Table S1.
Construction of the nomogram
All patients were assigned to the training cohort to establish the nomogram based on the identified variables from the logistic regression analysis. Continuous variables were transformed into categorical variables based on cut-off values determined based on the receiver operating characteristic (ROC) curve through the identification of maximum sensitivity and specificity.15–17 The nomogram was established based on the results of multivariate linear regression using the RMS package in R version 3.5 (www.r-project.org). Calibration curve analysis was performed to describe the consistency of the predicted and observed risks of renal failure. DCA was conducted to assess the clinical utility of the nomogram in the training cohort. The differences between the “true” positive rate and weighted false-positive rate across threshold probabilities were used to determine the net benefit of the nomogram. The predictive discrimination of the nomogram was evaluated using the ROC curve and the area under the curve (AUC). 18
Validation of the nomogram
Validation of the nomogram was achieved by randomly allocating 100 patients into the internal validation cohort and the newly enrolled external in-hospital patient cohort. The AUC values of ROC analysis in the internal and external validation cohorts were used to assess the predictive discrimination of the nomogram. 19 The greater the AUC, the better the accuracy and stability of the established nomogram. 20
Statistical analysis
All collected data were compared to assess significant differences between the two groups, and the patient data were excluded from the analysis when an item was missing. The Mann–Whitney U test was used to compare continuous variables that did not exhibit a normal distribution, and the chi-Square (χ2) test was used to analyse categorical variables. In addition, the forward LR method of logistic regression analysis was performed to identify significant independent predictors of renal dysfunction by screening all variables in the study. The Hosmer–Lemeshow test was applied to compare the nomogram-predicted probability of an abnormal eGFR and its actual value. All statistical analyses were performed using IBM SPSS Statistics for Windows, Version 22.0 (IBM Corp., Armonk, NY, USA) and the R software package (version 3.5; http://www.r-project.org). P < 0.05 was considered statistically significant, and the reporting of this study conforms to TRIPOD guidelines. 21
Results
Patient characteristics
The inclusion process for all patients is shown in Figure 1. All variables obtained from patients with SRCs are listed in Table 1. Among the 386 patients with SRCs, 293 (75.91%) patients were included in the normal eGFR group, and 93 patients (24.09%) were included in the abnormal eGFR group. The following factors significantly differed between the two groups: age (P < 0.001), cyst location (P = 0.002), hypertension (P = 0.005), erythrocyte counts (P = 0.006), haemoglobin (P = 0.033), globulin (P = 0.008), BUN (P = 0.004), creatinine (P < 0.001), UA (P<0.001), and HDL-C (P = 0.037). In most patients, cyst location, BMI, kidney stones, and hypertension were associated with renal dysfunction. We presented the distribution of these four variables in the normal eGFR and abnormal eGFR groups in Figure 2. Regarding the location of cysts, the rate of bilateral renal cysts in the abnormal eGFR group was 62.37% but only 44.37% in the normal eGFR group. Regarding the distribution of BMI, the prevalence of patients with a BMI >25 kg/m2 was greater in the normal eGFR group (33.79%) compared with that in the abnormal eGFR group (26.88%). Kidney stones were not associated with abnormal eGFR, and a similar number of patients in the two groups had kidney stones (22.58% vs. 19.45%). Regarding hypertension, 39.78% of patients showed increased blood pressure in the abnormal eGFR group, and only 24.57% of patients showed increased blood pressure in the normal eGFR group.

Flow chart of patient disposition.
Single analysis of clinical factors between the normal and abnormal eGFR groups in the training cohort.

eGFR, estimated glomerular filtration rate; BMI, body mass index; BUN, blood urea nitrogen; UA, uric acid; TG, triglyceride; HDL-C, high-density lipoprotein cholesterol; LDL-C, low-density lipoprotein cholesterol; VLDL-C, very low-density lipoprotein cholesterol.
For continuous variables with a non-normal distribution, the median with 25% and 75% percentiles were used to describe the distribution. For categorical variables, a two-way table was applied to describe the distribution.
#, Mann–Whitney U test, $Chi-Square test, *P < 0.05.

Distributions of patients with different clinical parameters in normal (n = 293) and abnormal eGFR (n = 93) groups. (a) Cysts in single or bilateral kidneys, (b) different BMI groups, (c) with or without kidney stones, and (d) with or without hypertension.
Independent predictive factors and predictive nomogram for renal dysfunction
Logistical regression analysis was performed to identify predictive variables for renal dysfunction, and Table 2 shows that age, haemoglobin, globulin, and creatinine were significantly associated with renal dysfunction in patients with SRCs (all P < 0.05). The cut-off values for haemoglobin, globulin, and creatinine were 135 g/L, 27.2 g/L, and 85 μmol/L, respectively, which were identified by ROCs (Figure S1). The nomogram for predicting renal dysfunction in patients with SRCs was established by integrating four independent predictive factors. As shown in Figure 3, age contributed the most to renal dysfunction, followed by creatinine and haemoglobin.
Multivariate logistic regression analysis of clinical factors associated with the abnormal eGFR group.

eGFR, estimated glomerular filtration rate; OR, odds ratio; CI, confidence interval; HB, haemoglobin; GB, globulin; Cr, creatinine.
With the logistic regression method of forward LR.
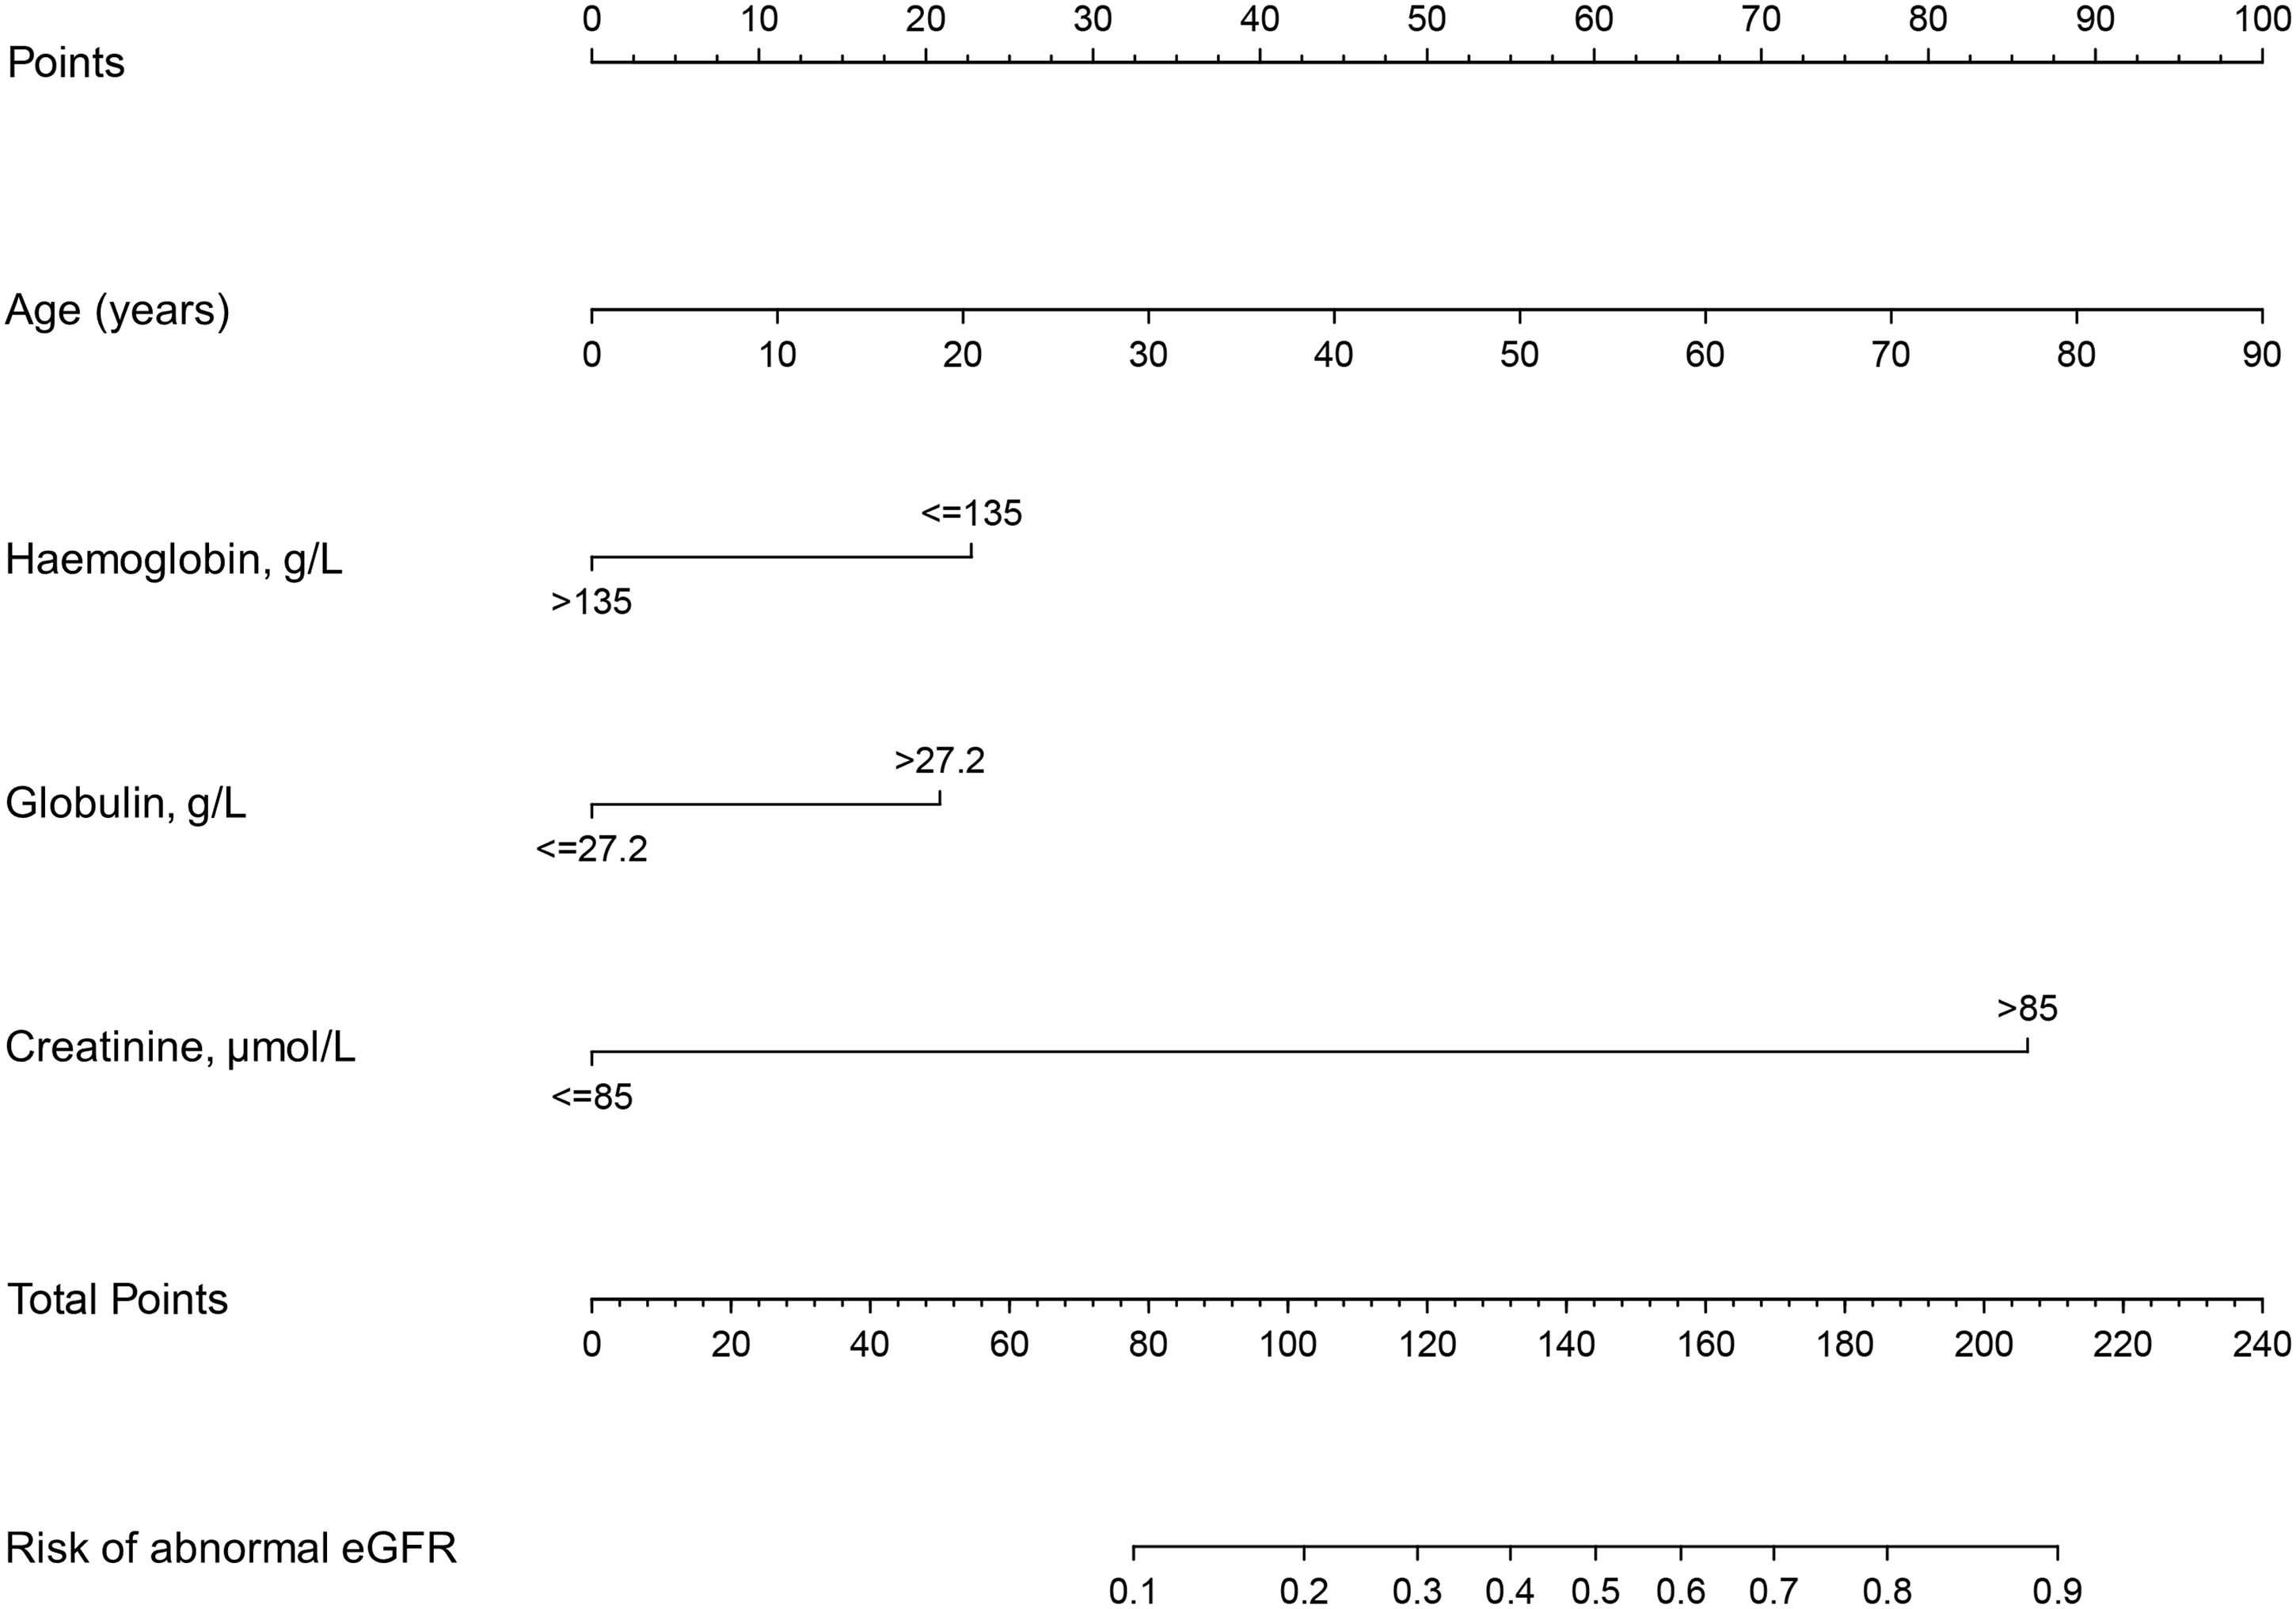
The predictive nomogram of abnormal eGFR risk for patients with SRCs.
Performance and clinical utility of the nomogram
For the calibration curve, the Hosmer–Lemeshow test was applied to detect the goodness of fit for the nomogram. The bootstrap-corrected coefficient of determination (R2) value between the nomogram-predicted probability of eGFR abnormality and its actual value was 0.812. In addition, the Brier score was 0.051, indicating that the truly predicted nomogram was approximately 77.42% (Figure 4a). For the DCA, the decision curve (blue line) showed that in a threshold probability range of 0.1 to 0.8, which indicates that the risk generated from the nomogram is 0.1 to 0.8, patients who decided to interrupt clinical treatment benefited more compared with those undergoing all treatment schemes (grey line) or the nontreatment scheme (black line) (Figure 4b).

Performance and clinical utility of the nomogram. Calibration curves (a) and decision curve analysis (b) of the nomogram.
Accuracy and stability of the nomogram model
An additional 46 in-hospital patients with SRCs were collected as the external validation cohort. As shown in Figure 5, the x- and y-axes represent the false-positive rate (1 − specificity) and true positive rate (sensitivity), covering a range of values from the predictive nomogram model. The AUC was 0.829 in the overall training cohort (Figure 5a), 0.752 in the internal validation cohort (Figure 5b), and 0.888 in the external validation cohort (Figure 5c, Table S2). Additionally, Table S3 shows a comparison of the difference between the validation cohort and training cohort. Together, these results demonstrated that the established nomogram model exhibited sufficient accuracy and stability and could be applied to evaluate the renal function status of patients with SRCs.

Accuracy and stability of the nomogram model. The ROC curve and AUC values are based on the nomogram in the training cohort (a), internal validation cohort (b), and external validation cohort (c).
Discussion
In recent years, many nomogram models have been explored to predict renal function in the context of urinary disease. For example, a nomogram for assessing significant eGFR reduction in patients with renal cell carcinoma after robotic partial nephrectomy was internally validated and displayed excellent calibration. 13 In addition, two nomograms for predicting renal function 1 year after partial nephrectomy in patients with renal tumours have been established and internally validated by preoperative variables. 22 However, nomograms evaluating eGFR in patients with SRCs are rare. Furthermore, whether renal cysts and renal dysfunction exhibit a causal relationship remains controversial. Tatar et al. 23 reported that SRCs are associated with poor renal function outcomes in solitary kidney patients. In Korea, Choi et al. 24 revealed that eGFR is an independent factor associated with the presence of renal cysts and that age, BMI, and hypertension represent other risk factors. Chin et al. 6 demonstrated that differences in eGFR between the control and cyst groups and the presence of cysts were not related to renal dysfunction, but patients with peripheral cysts had a lower eGFR than patients in the perihilar cyst subgroup. Therefore, investigating the association between SRCs and renal dysfunction and constructing a nomogram for simple renal patients are urgently needed.
In the present study, we provide a predictive nomogram model to evaluate eGFR and the probability of renal dysfunction. Moreover, the accuracy and stability of the nomogram model were assessed. Our major findings were as follows: (1) age, haemoglobin, globulin, and creatinine may be significant predictive factors for renal dysfunction in patients with SRCs, and the cut-off values for haemoglobin, globulin, and creatinine were 135 g/L, 27.2 g/L, and 85 μmol/L, respectively, and (2) the predictable nomogram is accurate and stable, with AUCs of 0.829, 0.752, and 0.888 in the training cohort, internal and external validation cohorts, respectively.
Age is an essential factor affecting eGFR because of the loss of renal mass in ageing people, and a proposed nomogram revealed that age plays a vital role in predicting renal function after partial nephrectomy.13,25 In the current study, age was significantly associated with renal dysfunction in patients with SRCs and included in the predictable nomogram.
Another study reported that the haematocrit value, haemoglobin, and erythrocyte counts were significantly elevated in patients with SRCs and significantly reduced after surgery, 26 which implicated potential crosstalk between blood parameters, SRCs, and renal dysfunction. Similarly, we revealed that haemoglobin ≤135 g/L might be a risk factor for renal function. Previous reports demonstrated that serum β2-microglobulin concentrations could be used to predict neonatal renal function and estimate GFR in infants and adults.27–29 Interestingly, we also found that globulin (globulin, >27.2 g/L) was a predictive factor affecting renal function. Regarding creatinine, two retrospective cohort studies enrolled 1380 and 577 individuals and demonstrated that increased serum creatinine may be a risk factor for the development of SRCs.30,31 Serum creatinine was also identified as one of the preoperative predictors to evaluate eGFR after partial nephrectomy. 22 Consistently, serum creatinine (>85 μmol/L) was screened as a predictor to assess renal function in our nomogram. Based on a previous study, endogenous creatinine clearance overestimated the GFR, and endogenous creatinine clearance was a poor predictor of renal function in patients with nephrotic syndrome. 32 Therefore, we recommend serum creatinine as a predictive factor of renal function in patients with SRCs. Collectively, our nomogram established for predicting renal function will serve as a valuable tool in assisting decision-making in patients with SRCs.
Our nomogram was established by incorporating four variables, including age, haemoglobin, globulin, and creatinine, and the calibration curve for internal validation showed that the R2 was 0.812, indicating a preferable prognostic value of the nomogram. Additionally, DCA demonstrated that the established nomogram could predict more benefits based on the evaluation of the abnormal eGFR status of patients with SRCs. For further validation, the AUCs in the training cohort and two validation cohorts were all >0.75, which demonstrated good accuracy and stability. Therefore, internal validation demonstrated that our nomogram was reliable for clinicians to identify the probability of renal dysfunction.
This study has some limitations that cannot be ignored. 1) The smaller number of patients in the external validation will restrict its widespread use. In future research, we will further validate the clinical use of the nomogram in a multicentre study. 2) The odds ratios of these four independent predictors were very close to 1, potentially because the sample size was not large enough. The relationship between these predictors and renal function requires further research. 3) Moreover, although 22 significant variables were analysed in our study, other important predictive parameters, such as cyst size and precise location, septa in the cyst, and cyst infection, were not included in this study. 33
Conclusion
We established a nomogram that incorporated four preoperative covariates, including age, haemoglobin, globulin, and creatinine, which may predict the probability of renal dysfunction in patients with SRCs. Internal validation analyses based on a calibration curve, DCA, and AUCs indicated that the nomogram exhibited great accuracy and stability. This nomogram might be a useful tool for clinicians to evaluate the risk of renal dysfunction for patients with SRCs.
Supplemental Material
sj-jpg-1-imr-10.1177_03000605221087042 - Supplemental material for Development and external validation of a nomogram for predicting renal function based on preoperative data from in-hospital patients with simple renal cysts
Supplemental material, sj-jpg-1-imr-10.1177_03000605221087042 for Development and external validation of a nomogram for predicting renal function based on preoperative data from in-hospital patients with simple renal cysts by Yiding Chen, Lei Chen, Jialin Meng, Meng Zhang, Yuchen Xu, Song Fan, Chaozhao Liang and Guiyi Liao in Journal of International Medical Research
Supplemental Material
sj-pdf-2-imr-10.1177_03000605221087042 - Supplemental material for Development and external validation of a nomogram for predicting renal function based on preoperative data from in-hospital patients with simple renal cysts
Supplemental material, sj-pdf-2-imr-10.1177_03000605221087042 for Development and external validation of a nomogram for predicting renal function based on preoperative data from in-hospital patients with simple renal cysts by Yiding Chen, Lei Chen, Jialin Meng, Meng Zhang, Yuchen Xu, Song Fan, Chaozhao Liang and Guiyi Liao in Journal of International Medical Research
Supplemental Material
sj-pdf-3-imr-10.1177_03000605221087042 - Supplemental material for Development and external validation of a nomogram for predicting renal function based on preoperative data from in-hospital patients with simple renal cysts
Supplemental material, sj-pdf-3-imr-10.1177_03000605221087042 for Development and external validation of a nomogram for predicting renal function based on preoperative data from in-hospital patients with simple renal cysts by Yiding Chen, Lei Chen, Jialin Meng, Meng Zhang, Yuchen Xu, Song Fan, Chaozhao Liang and Guiyi Liao in Journal of International Medical Research
Supplemental Material
sj-pdf-4-imr-10.1177_03000605221087042 - Supplemental material for Development and external validation of a nomogram for predicting renal function based on preoperative data from in-hospital patients with simple renal cysts
Supplemental material, sj-pdf-4-imr-10.1177_03000605221087042 for Development and external validation of a nomogram for predicting renal function based on preoperative data from in-hospital patients with simple renal cysts by Yiding Chen, Lei Chen, Jialin Meng, Meng Zhang, Yuchen Xu, Song Fan, Chaozhao Liang and Guiyi Liao in Journal of International Medical Research
Footnotes
Acknowledgement
The authors thank Dr. Shiyang Guan, Department of Epidemiology and Biostatistics, School of Public Health, Anhui Medical University, for his help in performing the statistical analysis.
Author contributions
YDC, CZL, and GYL conceived and designed the study. YDC and LC contributed to data collection. YDC, YCX, and MZ analysed the data. YCX, SF, JLM, and MZ contributed materials and analysis tools. YDC, LC, and GYL wrote the manuscript. All authors have read and approved the final version of the manuscript and agreed with the order of the authors. YDC and LC contribute equally to the current work.
Declaration of conflicting interest
The authors declare that there is no conflict of interest.
Funding
This research received no specific grant from any funding agency in the public, commercial, or not-for-profit sectors.
Supplemental material
Supplemental material for this article is available online.
References
Supplementary Material
Please find the following supplemental material available below.
For Open Access articles published under a Creative Commons License, all supplemental material carries the same license as the article it is associated with.
For non-Open Access articles published, all supplemental material carries a non-exclusive license, and permission requests for re-use of supplemental material or any part of supplemental material shall be sent directly to the copyright owner as specified in the copyright notice associated with the article.