
Abstract
Objective
To investigate if fibroblast growth factor 18 (FGF18) expression plays an important role in endometrial carcinoma (EC).
Methods
The clinicopathological associations and prognostic value of FGF18 expression were retrospectively analyzed in 190 patients with EC. FGF18 expression was stably knocked down in EC cell lines. Changes in cell proliferation, migration, and invasion rates were examined via cell behavior experiments. Tumor growth was investigated using a xenograft mouse model. RNA sequencing (RNA-seq) was performed to identify differentially expressed genes (DEGs) in HEC-1-B cells after FGF18 knockdown, followed by pathway enrichment analysis of the DEGs.
Results
High FGF18 expression levels were closely correlated with EC clinicopathological features, such as histological subtype, FIGO stage, depth of myometrial invasion, and tumor size. Moreover, EC patients with high FGF18 expression levels had poorer overall survival. FGF18 knockdown in EC cells revealed its role in promoting tumor cell proliferation, migration, and invasion in vitro, as well as tumor growth in vivo. RNA-seq of HEC-1-B cells revealed that the DEGs were enriched in signaling pathways related to cell proliferation and migration.
Conclusions
Overexpression of FGF18 may serve as a prognostic biomarker for EC patients and is a potential therapeutic target for treating this disease.
Keywords
Introduction
With advancements in medical research, significant progress has been made in the fight against cancer, including the development of tumor immunotherapy and a better understanding of the mechanisms of chemotherapy resistance.1,2 Despite major achievements in multimodality treatments, endometrial carcinoma (EC) remains one of the most common and dangerous neoplasms among women worldwide. 3 Approximately 15% to 20% of EC patients experience recurrence after primary surgery, with the long-term survival rate being only about 18%. 4 The relevant treatment methods for this disease have depended on the specific clinicopathological features for many years. Researchers still hope to identify novel molecular biomarkers to better understand the tumor pathogenesis, improve patient prognosis, and refine the clinicopathological-related information.5,6 EC pathogenesis, including the metabolic and hormonal factors involved, is very complex. Studies have shown that certain molecular biomarkers are potentially helpful for EC prognosis and treatment, but the relevant mechanisms are not completely understood.7,8
Fibroblast growth factor 18 (FGF18) is an important member of the human FGF protein family that is involved in tissue differentiation and development regulation. The gene encoding FGF18 is located on chromosome 14p11.9,10 FGF18 not only increases the proliferation and differentiation of osteocytes and chondrocytes, but also promotes the growth of normal endometrial epithelial cells.11,12 In addition, FGF18 contributes to the tumorigenesis of several malignancies. Overexpression of FGF18 in tumor cells is associated with increased growth, metastasis, and migration of liver, breast, and lung carcinomas.13–15 Flannery et al. suggested that FGF18 plays a potentially important role in EC after finding that FGF18 expression levels are 8-fold higher in tumor cells compared with those in the normal proliferative endometrium. 16 However, no further information has been reported regarding the clinical significance and prognostic value of FGF18 expression in EC tumors.
An imbalance of estrogen and progestin primarily causes type I EC, which accounts for 85% of cases with a favorable prognosis. In contrast, type II EC is associated with p53 mutations and has a relatively poor prognosis. 6 In the mouse endometrium, Li et al. found that estrogen could promote the production of several types of FGFs, including FGF18, in endometrial stromal cells in a paracrine manner. 17 Accumulated data have also shown that tumor production of FGF18 via autocrine mechanisms is vitally important in the pathogenesis of numerous solid tumor types. Overexpression of FGF18 can promote the proliferation of gastric carcinoma cell lines via the ERK-MAPK pathway. 18 FGF18 expression can help predict the presence of ovarian cancer and is involved in its tumorigenicity through NF-κB signaling. 19 In addition to FGF18 production by tumor cells through autocrine mechanisms, FGF18 production by stromal cells through paracrine mechanisms also has important effects on certain malignant tumors. Furthermore, colon cancer exhibits increased FGF18 expression, which exerts pro-tumorigenic effects on both epithelial cells and the corresponding stroma by promoting tumor cell growth, fibroblast invasion, and neovascularization. 20
Here, we aimed to determine if epithelial cell-derived FGF18 is a major driver of EC carcinogenesis, as no relevant reports have been published on this concept. In this study, we investigated FGF18 expression levels in EC tissues, then explored the clinical significance and role of FGF18 in promoting tumor growth and metastasis in this cancer type.
Materials and methods
Patients
Pathological sections and clinical data were collected from all EC patients in the Department of Punan Branch of Renji Hospital from January 2013 to January 2022. Two senior pathologists separately analyzed these sections. Patients with surgically resected, pathologically confirmed EC were recruited for this study. These patients underwent radical resection of the EC and pelvic lymphadenectomy, but did not receive any preoperative chemotherapy. Patients who had other malignancies and those who received preoperative radiochemotherapy were excluded.
These samples were classified based on the definition of the International Federation of Gynecology and Obstetrics (FIGO) stage. The follow-up time was defined as the time from the beginning to the study endpoint or last record. This work was performed in accordance with the relevant institutional guidelines. The study was approved by the Ethical Review Committee of the Punan Branch of Renji Hospital (No. 2021007) on 30 July 2021. Written informed consent was obtained from all patients or their families. The reporting of this study conforms to the Strengthening the Reporting of Observational Studies in Epidemiology (STROBE) guidelines.
Immunohistochemistry (IHC)
Regions with abundant tumor tissue were selected to generate a tissue microarray (TMA), which was constructed according to the method described by Matysiak et al. 21 IHC staining for FGF18 (1:100, ab86571, Abcam, Cambridge, UK) was performed on the EC TMA. Human hepatocarcinoma samples were obtained from Renji Hospital’s Punan Branch Pathology Department and served as positive controls for FGF18 expression.
IHC scoring
The tumor FGF18 and β-actin IHC staining results were analyzed via semiquantitative scoring. The staining intensity score was divided into four categories: 0 (negative), 1 (weak), 2 (moderate), and 3 (strong). The proportion of positively stained cells score was defined as 0 (0%), 1 (≤25%), 2 (>25% and ≤50%), 3 (>50% and ≤75%), and 4 (>75%). The staining intensity and proportion of positively stained cells scores were multiplied to calculate the cumulative score. The EC cases were then classified into a low expression group (0–6 score) and high expression group (7–12 score) using the cumulative FGF18 IHC staining score.
Cell culture
The KLE (CRL-1622), AN3 CA (HTB-11), U-87 MG (HTB-14), and 293 (CRL-1573) cell lines were acquired from American Type Culture Collection (ATCC; Manassas, VA, USA). The HEC-1-B (TCHu115), RL95-2 (TCHu198), HEC-1-A (TCHu149), and MCF-7 (TCHu74) cell lines were obtained from the Cell Bank of the Chinese Academy of Sciences (Shanghai, China). Ishikawa (CL-0283) cells were purchased from Wuhan Procell (Wuhan, China). All cell lines were cultured in Dulbecco’s Modified Eagle Medium (DMEM; Thermo Fisher Scientific, Waltham, MA, USA) supplemented with 10% fetal bovine serum (FBS; HyClone, Logan, UT, USA) and incubated in a 37°C, 5% CO2 environment.
Lentivirus transfection
Lentiviral vectors expressing a short hairpin RNA (shRNA) targeting FGF18 mRNA (5′-GCAAGGAGTGTGTGTTCATCG-3′) or the negative control sequence (5′-TTCTCCGAACGTGTCACGT-3′) were synthesized and cloned into the GV493 (hU6-MCS-CBh-gcGFP-IRES-puromycin) vector with BsmBI sites (purchased from Shanghai Genechem Co., Ltd., Shanghai, China). The recombinant vectors were confirmed by DNA sequencing. The viral vectors were transfected into 293T cells using Lipofectamine 2000 (Invitrogen, Thermo Fisher Scientific) together with two helper plasmids, psPAX2 and pMD2.G. The infectious lentiviruses were harvested 72 hours post-transfection, rapidly centrifuged to remove cell debris, and filtered through 0.45-μm cellulose acetate filters. The viral titer was determined via fluorescence-activated cell sorting analysis of GFP-positive 293T cells. Approximately 72 hours after infection with the fluorescent lentiviruses, GFP expression in cells was observed using a fluorescence microscope, with the fluorescence rate used to indicate the positive infection rate. Cells with more than 80% infection efficiency were selected for further experiments.
Western blot analysis
The cells were lysed with RIPA buffer (Beyotime, Shanghai, China), then the protein concentrations of the supernatants were analyzed using a BCA assay. Proteins were separated by sodium dodecyl-sulfate polyacrylamide gel electrophoresis (SDS-PAGE) and transferred to polyvinylidene difluoride membranes. The membranes were blocked with Tris-buffered saline with Tween-20 (TBST) + 5% skim milk. The membranes were incubated with anti-FGF18 (1:1000, ab86571, Abcam) and anti-β-actin (1:2000, ab8226, Abcam) primary antibodies, followed by washes with TBST. ECL luminescent solution (Beyotime) was applied, then the samples were exposed to film. The exposure conditions were adjusted and the films were developed, fixed, scanned, and analyzed with Alpha Ease FC software (Alpha Innotech Corporation, San Leandro, CA, USA).
Cell proliferation assay
Transfected FGF18-knockdown HEC-1-B and RL-95-2 cells and untransfected controls were cultured in 96-well plates at 2500 cells/well for 0 to 96 hours. The cells were washed three times with PBS, then 100 μL of CCK-8 (Dojindo, Kumamoto, Japan) solution was added to each well. After 1 hour, the absorbance values at 450 nm were measured with a microplate reader (BioTek, Winooski, VT, USA). Each test included six blanks and the experiments were repeated three times.
Cell migration assay
A wound healing assay was used to examine tumor cell migration. HEC-1-B and RL-95-2 cells in the logarithmic growth phase were seeded in 96-well plates at 5 × 10⁵ cells/well. After overnight growth, a sterile pipette tip was used to scratch the cell layer. The cells were washed with PBS and cultured in serum-free medium. Wound healing was photographed and evaluated over 24 hours.
Cell invasion assay
Matrigel-coated Transwell chambers (Corning, Corning, NY, USA) were dried overnight. Transfected HEC-1-B or RL-95-2 cells (1 × 10⁵ cells/mL) were seeded in the upper chamber of a 24-well plate with 10% FBS-DMEM in the lower chamber. After 24 hours of incubation, non-invading cells were removed, and invading cells were fixed and stained with crystal violet staining solution. The infiltration value was assessed by counting stained cells via microscopy (100×). The experiment was repeated three times.
Colony formation assay
Transfected HEC-1-B or RL-95-2 cells were seeded in 6-well plates at 2000 cells/well and cultured in 10% FBS-DMEM for 10 days. Colonies were imaged and counted after fixation and crystal violet staining.
Xenograft mouse model
The animal experiments were performed in strict accordance with the relevant guidelines and regulations approved by the Medical Ethics Committee for Animal Care and Use of the Punan Branch of Renji Hospital (No. GSZE0329096, 1 July 2022). The handling of experimental animals adhered to the regulations, and this study complies with the ARRIVE 2.0 guidelines. 22 Twenty male, six-week-old BALB/c nude mice were randomly assigned to two groups with 10 mice in each group. Each mouse received a subcutaneous injection of 4 × 10⁶ HEC-1-B cells. The size of the subcutaneous tumors was recorded every 3 days. A Vernier caliper was used to measure the longest (long axis, a) and shortest (short axis, b) parts of the tumor, with the formula V = 1/2ab 2 used to calculate the tumor volume. On the 20th day, the nude mice were euthanized with 0.5 mL pentobarbital sodium (150 mg/kg), which was confirmed by cervical dislocation, then the tumors were weighed. This study strictly adhered to the guidelines and principles outlined in the Eighth Edition of the “Guide for the Care and Use of Laboratory Animals” (National Research Council, 2011) to ensure that all the animals received proper care and use during the experimental procedures. 23
RNA sequencing (RNA-seq) and enrichment analysis
After RNA extraction, its purity and integrity were assessed using ultraviolet spectrophotometry and agarose gel electrophoresis. Fragmented mRNA was reverse transcribed into first-strand cDNA using M-MuLV reverse transcriptase and random oligonucleotide primers (Takara Bio, Dalian, China). Subsequently, RNaseH was added to degrade the RNA, enabling DNA polymerase I to synthesize second-strand cDNA using dNTPs as substrates. The synthesis method was used to generate RNA-seq data. DESeq2 version 1.16.1 was used to analyze the differentially expressed genes (DEGs) between the two groups. ClusterProfiler version 3.4.4 was used to perform gene ontology (GO) enrichment analysis to explore DEG functions.
Quantitative reverse transcription polymerase chain reaction (RT-qPCR)
To verify the RNA-seq and enrichment analysis results, the mRNA expression patterns of proto-oncogenes or tumor suppressor genes, such as Fos, protein tyrosine phosphatase receptor type N (PTPRN), Bcl2 modifying factor (BMF), inhibitor of DNA binding 1 (ID1), and ID4, were examined by RT-qPCR. Total RNA was extracted from transfected HEC-1-B cells with TRIzol (Shanghai Pufei Company, Shanghai, China) and then reverse transcribed using the M-MLV kit (Promega, Madison, WI, USA) to obtain cDNA. Target gene amplification was performed using RT-qPCR on an Applied Biosystems 7500 instrument (Thermo Fisher Scientific), with the relative expression levels subsequently analyzed. The relevant primer sequences were as follows: Fos: 5
Statistical analysis
SPSS 20.0 (IBM Corp., Armonk, NY, USA) was used for statistical analysis. The chi-square test was used to examine the relationships between tumor FGF18 expression levels and clinicopathological factors. Patients without outcomes were censored at last contact (April 2022). Kaplan–Meier curves were used to analyze overall survival (OS) in EC patients, with the log-rank test used to identify significant differences. The Cox model was used to assess the correlations between OS and clinicopathological factors. Paired t-tests were used to analyze differences between groups. P-values ≤ 0.05 were considered statistically significant; *P ≤ 0.05; **P ≤ 0.01; ***P ≤ 0.001.
Results
Associations between FGF18 expression levels and clinicopathological factors
The EC samples examined in this study included 147 cases of endometrioid type I EC and 43 cases of other EC types, including serous EC. FGF18 IHC staining of the EC TMA indicated that FGF18 protein was expressed in the cytoplasm and membrane of endometrial tumors or stromal cells (Figure 1(a)–(d)). The associations between the FGF18 expression levels and clinicopathological features of the 190 patients are shown in Table 1. For FIGO stage classification, these samples included 126 stage I, 45 stage II, and 19 stage III–IV cases. The median age of the patients was 54.31 (24–75) years. High FGF18 expression was significantly correlated with histological subtype, FIGO stage, depth of muscle invasion, and tumor size (P < 0.05). Moreover, high FGF18 expression was not significantly correlated with other factors, such as age, childbirth, blood pressure, blood glucose, or lymph node involvement (Table 1).

Fibroblast growth factor 18 (FGF18) expression levels correlate with endometrial carcinoma (EC) patient prognosis; FGF18 knockdown in EC cells. FGF18 protein is expressed at (a and b) low levels and (c and d) high levels in EC tissue samples. (e) The log-rank test indicated that low FGF18 expression levels are associated with a better prognosis in EC patients (P < 0.05). (f) FGF18 protein is highly expressed in HEC-1-B and RL-95-2 cells compared with other EC cell lines and (g) stably infected HEC-1-B and RL-95-2 cells displaying green fluorescence were successfully generated. (h and i) Western blot analysis showing that FGF18 protein expression levels were decreased in both HEC-1-B (t-test, P < 0.001) and RL-95-2 cells (t-test, P < 0.05) with FGF18 knockdown relative to their respective controls.
Correlations between tumor fibroblast growth factor 18 (FGF18) expression levels and endometrial carcinoma patient clinicopathological features.

, total samples, n = 190; b, subgroup samples.
EM, endometrioid; FIGO, International Federation of Gynecology and Obstetrics; NA, not available.
P < 0.05.
FGF18 expression is an independent prognostic indicator for EC
Follow-up data were obtained from 131 EC patients, with a median follow-up (range) time of 80.6 (5.1–124.3) months. Twenty-five deaths were recorded. The log-rank test was used for univariate analysis. Overall, patients with high FGF18 tumor expression levels had a significantly worse OS than those with low FGF18 tumor expression levels (P < 0.001; Figure 1(e)). The Cox proportional hazards regression model was used to identify independent prognostic factors by examining the relationships between patient OS and clinicopathological features (Table 2). In the univariate analyses, tumor FGF18 expression, FIGO stage, tumor size, and myometrial invasion depth were significantly correlated with OS (P < 0.05; Table 2). The multivariate analysis revealed that FIGO stage and myometrial invasion depth retained their prognostic significance (P < 0.05; Table 2).
Endometrial carcinoma prognostic factors for overall survival identified using Cox univariate and multivariate analyses.
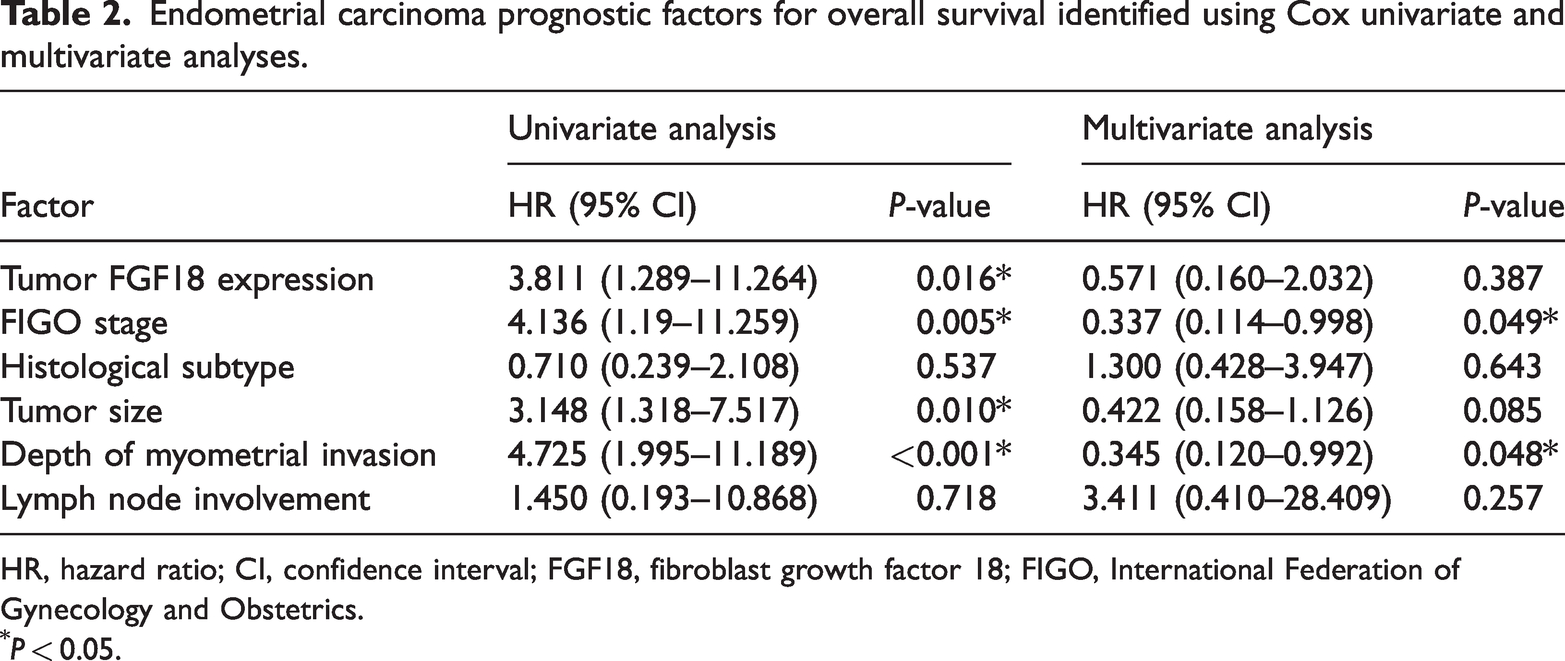
HR, hazard ratio; CI, confidence interval; FGF18, fibroblast growth factor 18; FIGO, International Federation of Gynecology and Obstetrics.
P < 0.05.
FGF18 promotes EC cell proliferation, migration, and invasion
Among the different EC cell lines examined, FGF18 protein was highly expressed in HEC-1-B and RL-95-2 cells (Figure 1(f)). A lentiviral vector carrying the FGF18 shRNA sequence was used to knock down FGF18 expression in HEC-1-B and RL-95-2 cells. Stably infected EC cells were confirmed by detecting green fluorescence signal (Figure 1(g)). Western blot analysis revealed significantly reduced FGF18 protein expression levels in the FGF18-knockdown HEC-1-B (P < 0.001) and RL-95-2 cells (P < 0.05) (Figure 1(h)–(i)).
We next evaluated if reduced FGF18 expression levels could influence EC cell proliferation, migration, and invasion rates. CCK-8 assays revealed that cell proliferation was significantly lower following FGF18 knockdown in HEC-1-B and RL-95-2 cells (P < 0.05; Figure 2(a)–(b)). The colony formation assay results demonstrated that significantly fewer colonies formed in FGF18-knockdown EC cells, for both HEC-1-B and RL-95-2 cells (P < 0.001 and P < 0.05, respectively; Figure 2(c)–(d)). The wound healing rates were also markedly lower in the cells with low FGF18 expression levels (P < 0.001, Figure 2(e)–(g)). Furthermore, Transwell invasion assays revealed that knocking down FGF18 expression significantly inhibited cell invasion compared with the control cells. The number of migrated cells per field was significantly lower for both HEC-1-B and RL-95-2 cells with FGF18 knockdown compared with their respective controls (P < 0.001 and P < 0.05, respectively; Figure 2(h)–(i)).
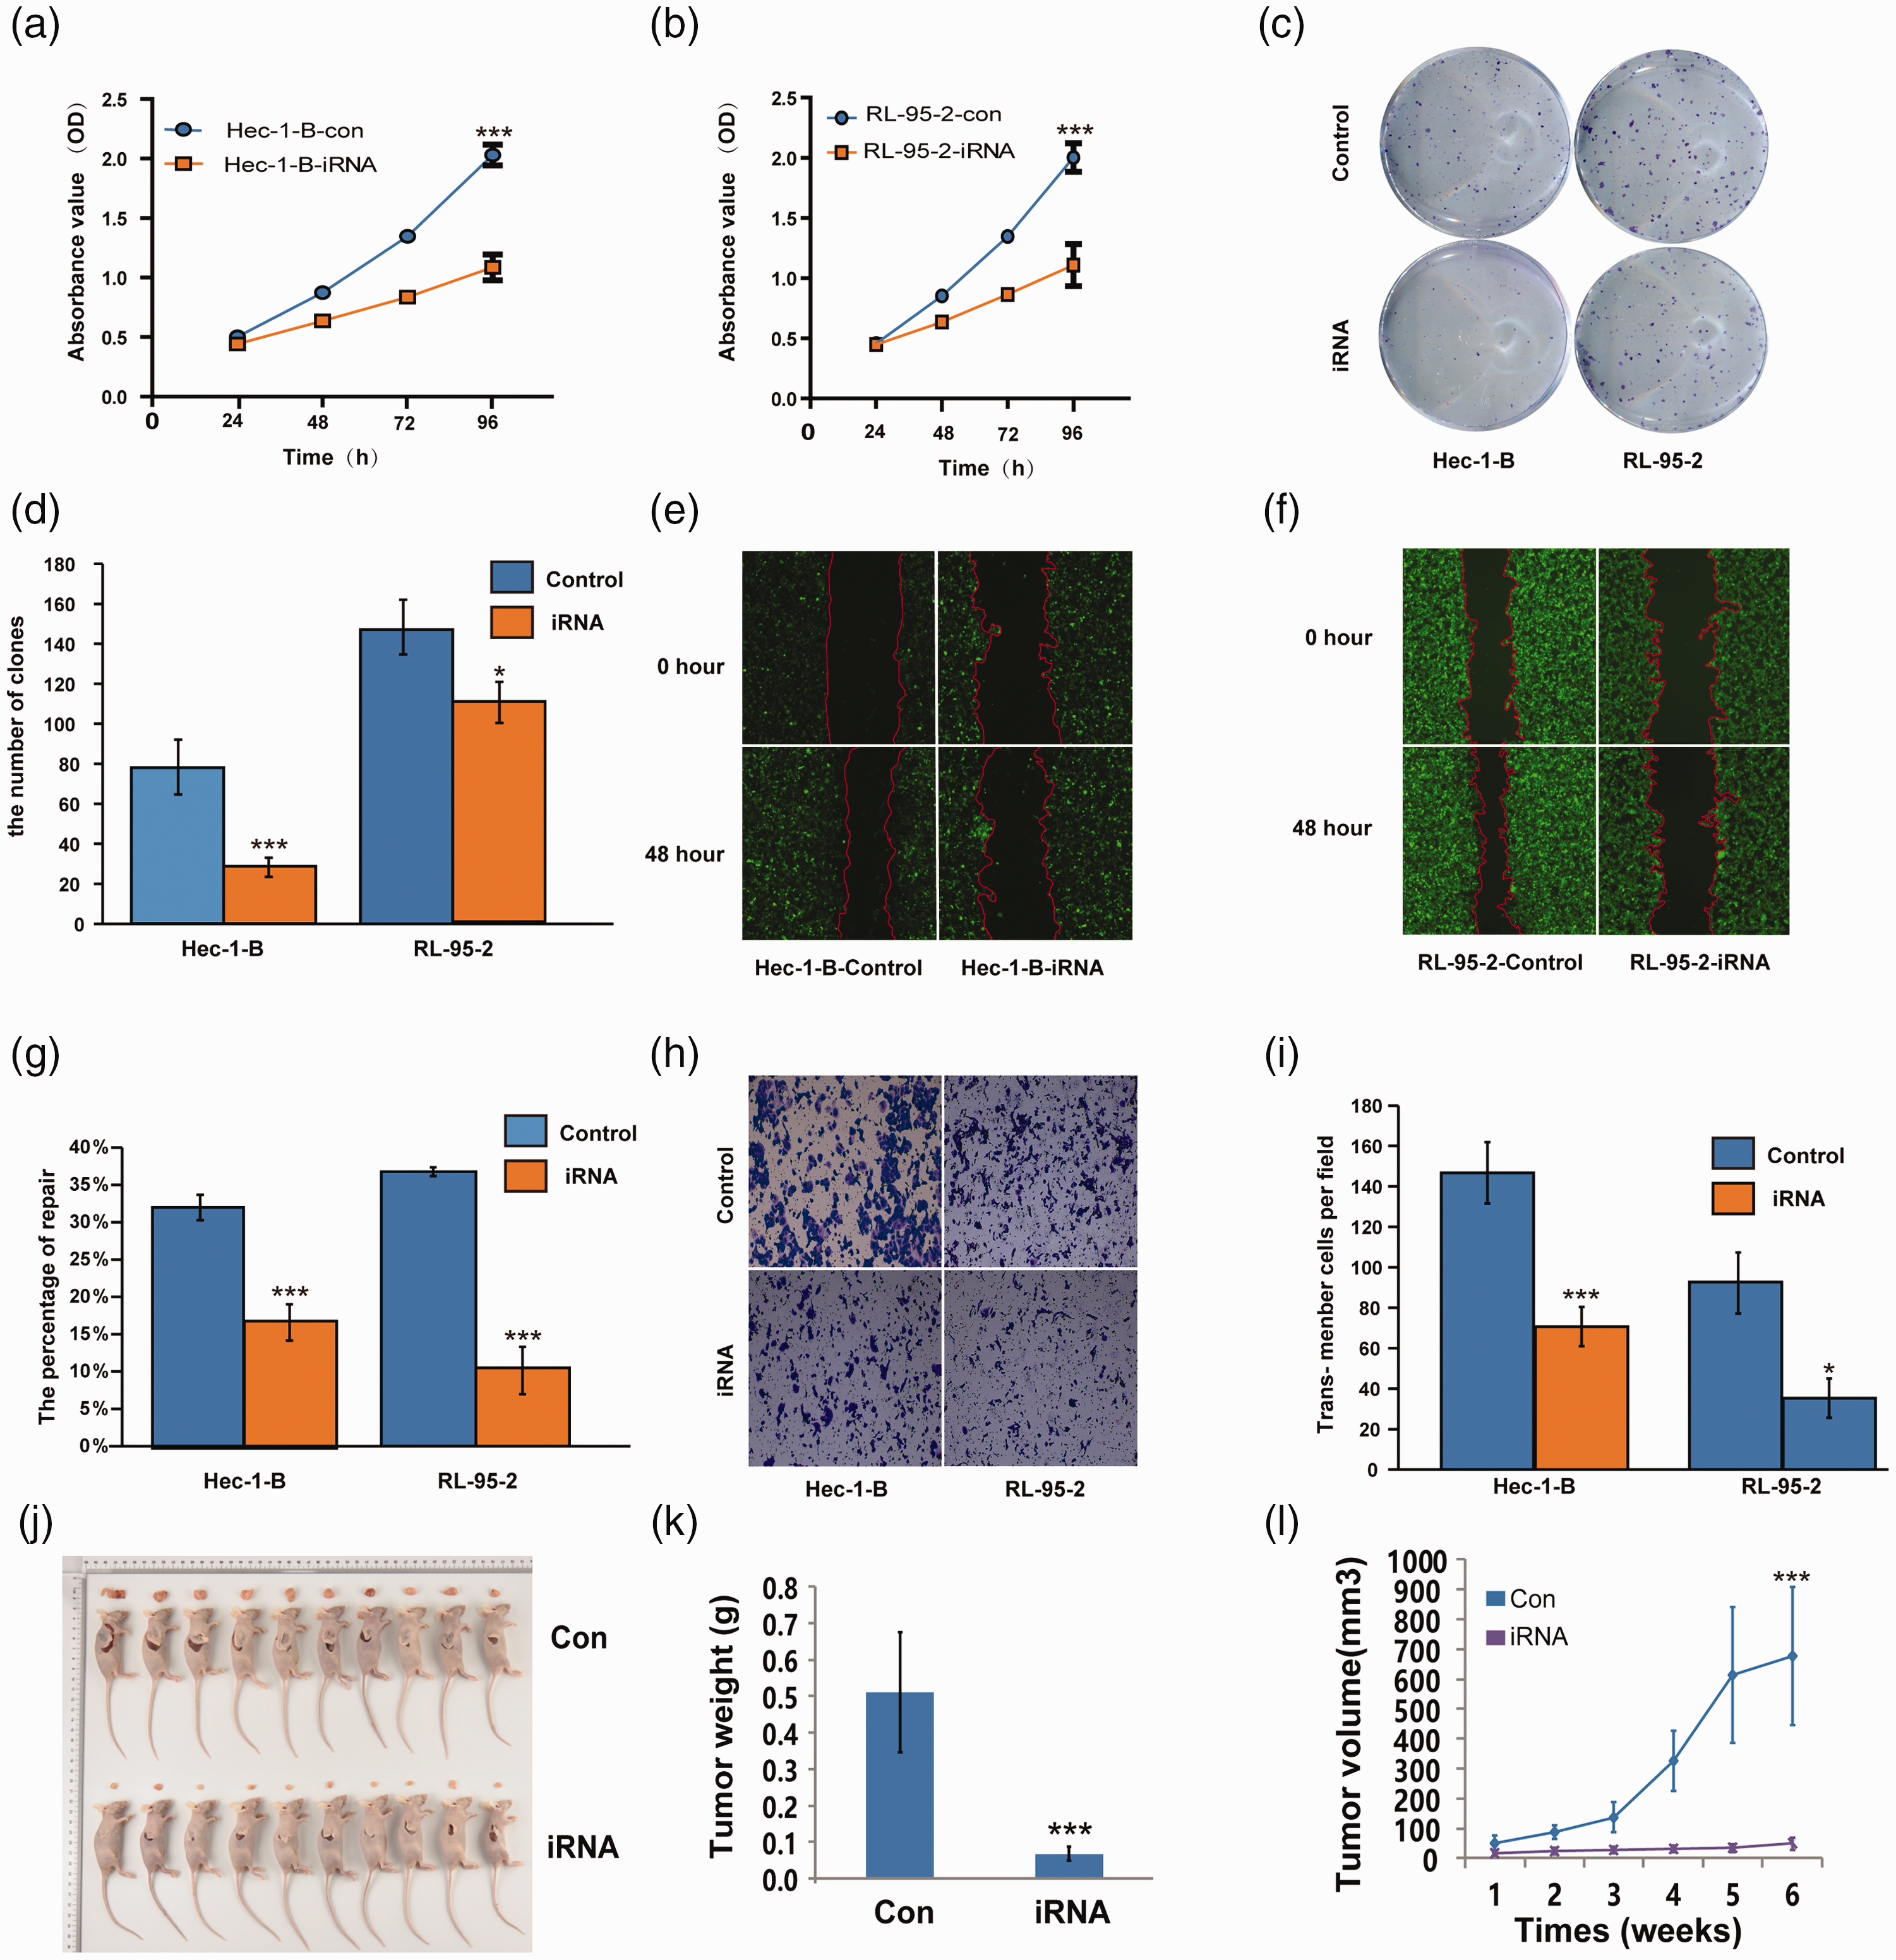
Fibroblast growth factor 18 (FGF18) knockdown suppresses the biological behavior of endometrial carcinoma (EC) cells in vitro and inhibits in vivo xenograft tumor growth in nude mice. FGF18 knockdown significantly reduced the EC cell (a and b) proliferation rate, (c and d) colony formation, (e–g) wound closure rate, and (h and i) number of invading cells (t-test, P < 0.05 or 0.001). (j) FGF18-knockdown HEC-1-B cells were subcutaneously injected into nude mice (t-test, P < 0.05 or 0.001). The tumor (k) weight and (l) volume of mice injected with FGF18-knockdown cells were significantly reduced compared with those of the control group (t-test, P < 0.001).
FGF18 knockdown inhibits EC tumor growth in vivo
After the tumor suppressive effects of low FGF18 expression levels were confirmed in vitro, we further investigated the tumorigenicity of FGF18 expression in vivo. HEC-1-B-con cells and HEC-1-B-iRNA cells were subcutaneously injected into BALB/c mice to establish a tumor mouse model (Figure 2(j)). After 6 weeks of observation, the mice with HEC-1-B-iRNA cell tumors displayed significantly reduced tumor volume and weight compared with those of the mice with HEC-1-B-con cell tumors (P < 0.001; Figure 2(k)). Moreover, the FGF18 knockdown group had a significantly lower tumor growth rate than the control group (P < 0.001; Figure 2(l)).
Proto-oncogene and tumor suppressor genes in signaling pathways downstream of FGF18
To understand the specific signaling pathways downstream of FGF18, we performed RNA-seq and performed bioinformatics analyses on the DEGs between FGF18-knockdown and control HEC-1-B cells (Figure 3(a)). Overall, 2432 DEGs were identified, including 1735 downregulated and 697 upregulated genes (Figure 3(b)). GO and Reactome enrichment analyses revealed that these DEGs were primarily related to cell proliferation and migration pathways (Figure 3(c)–(d)). The RT-qPCR results verified that HEC-1-B-FGF18-iRNA cells showed decreased expression levels of the proto-oncogenes FOS and PTPRN, while displaying increased expression levels of the tumor suppressor genes BMF, ID1, and ID4 (P < 0.05; Figure 3(e)).
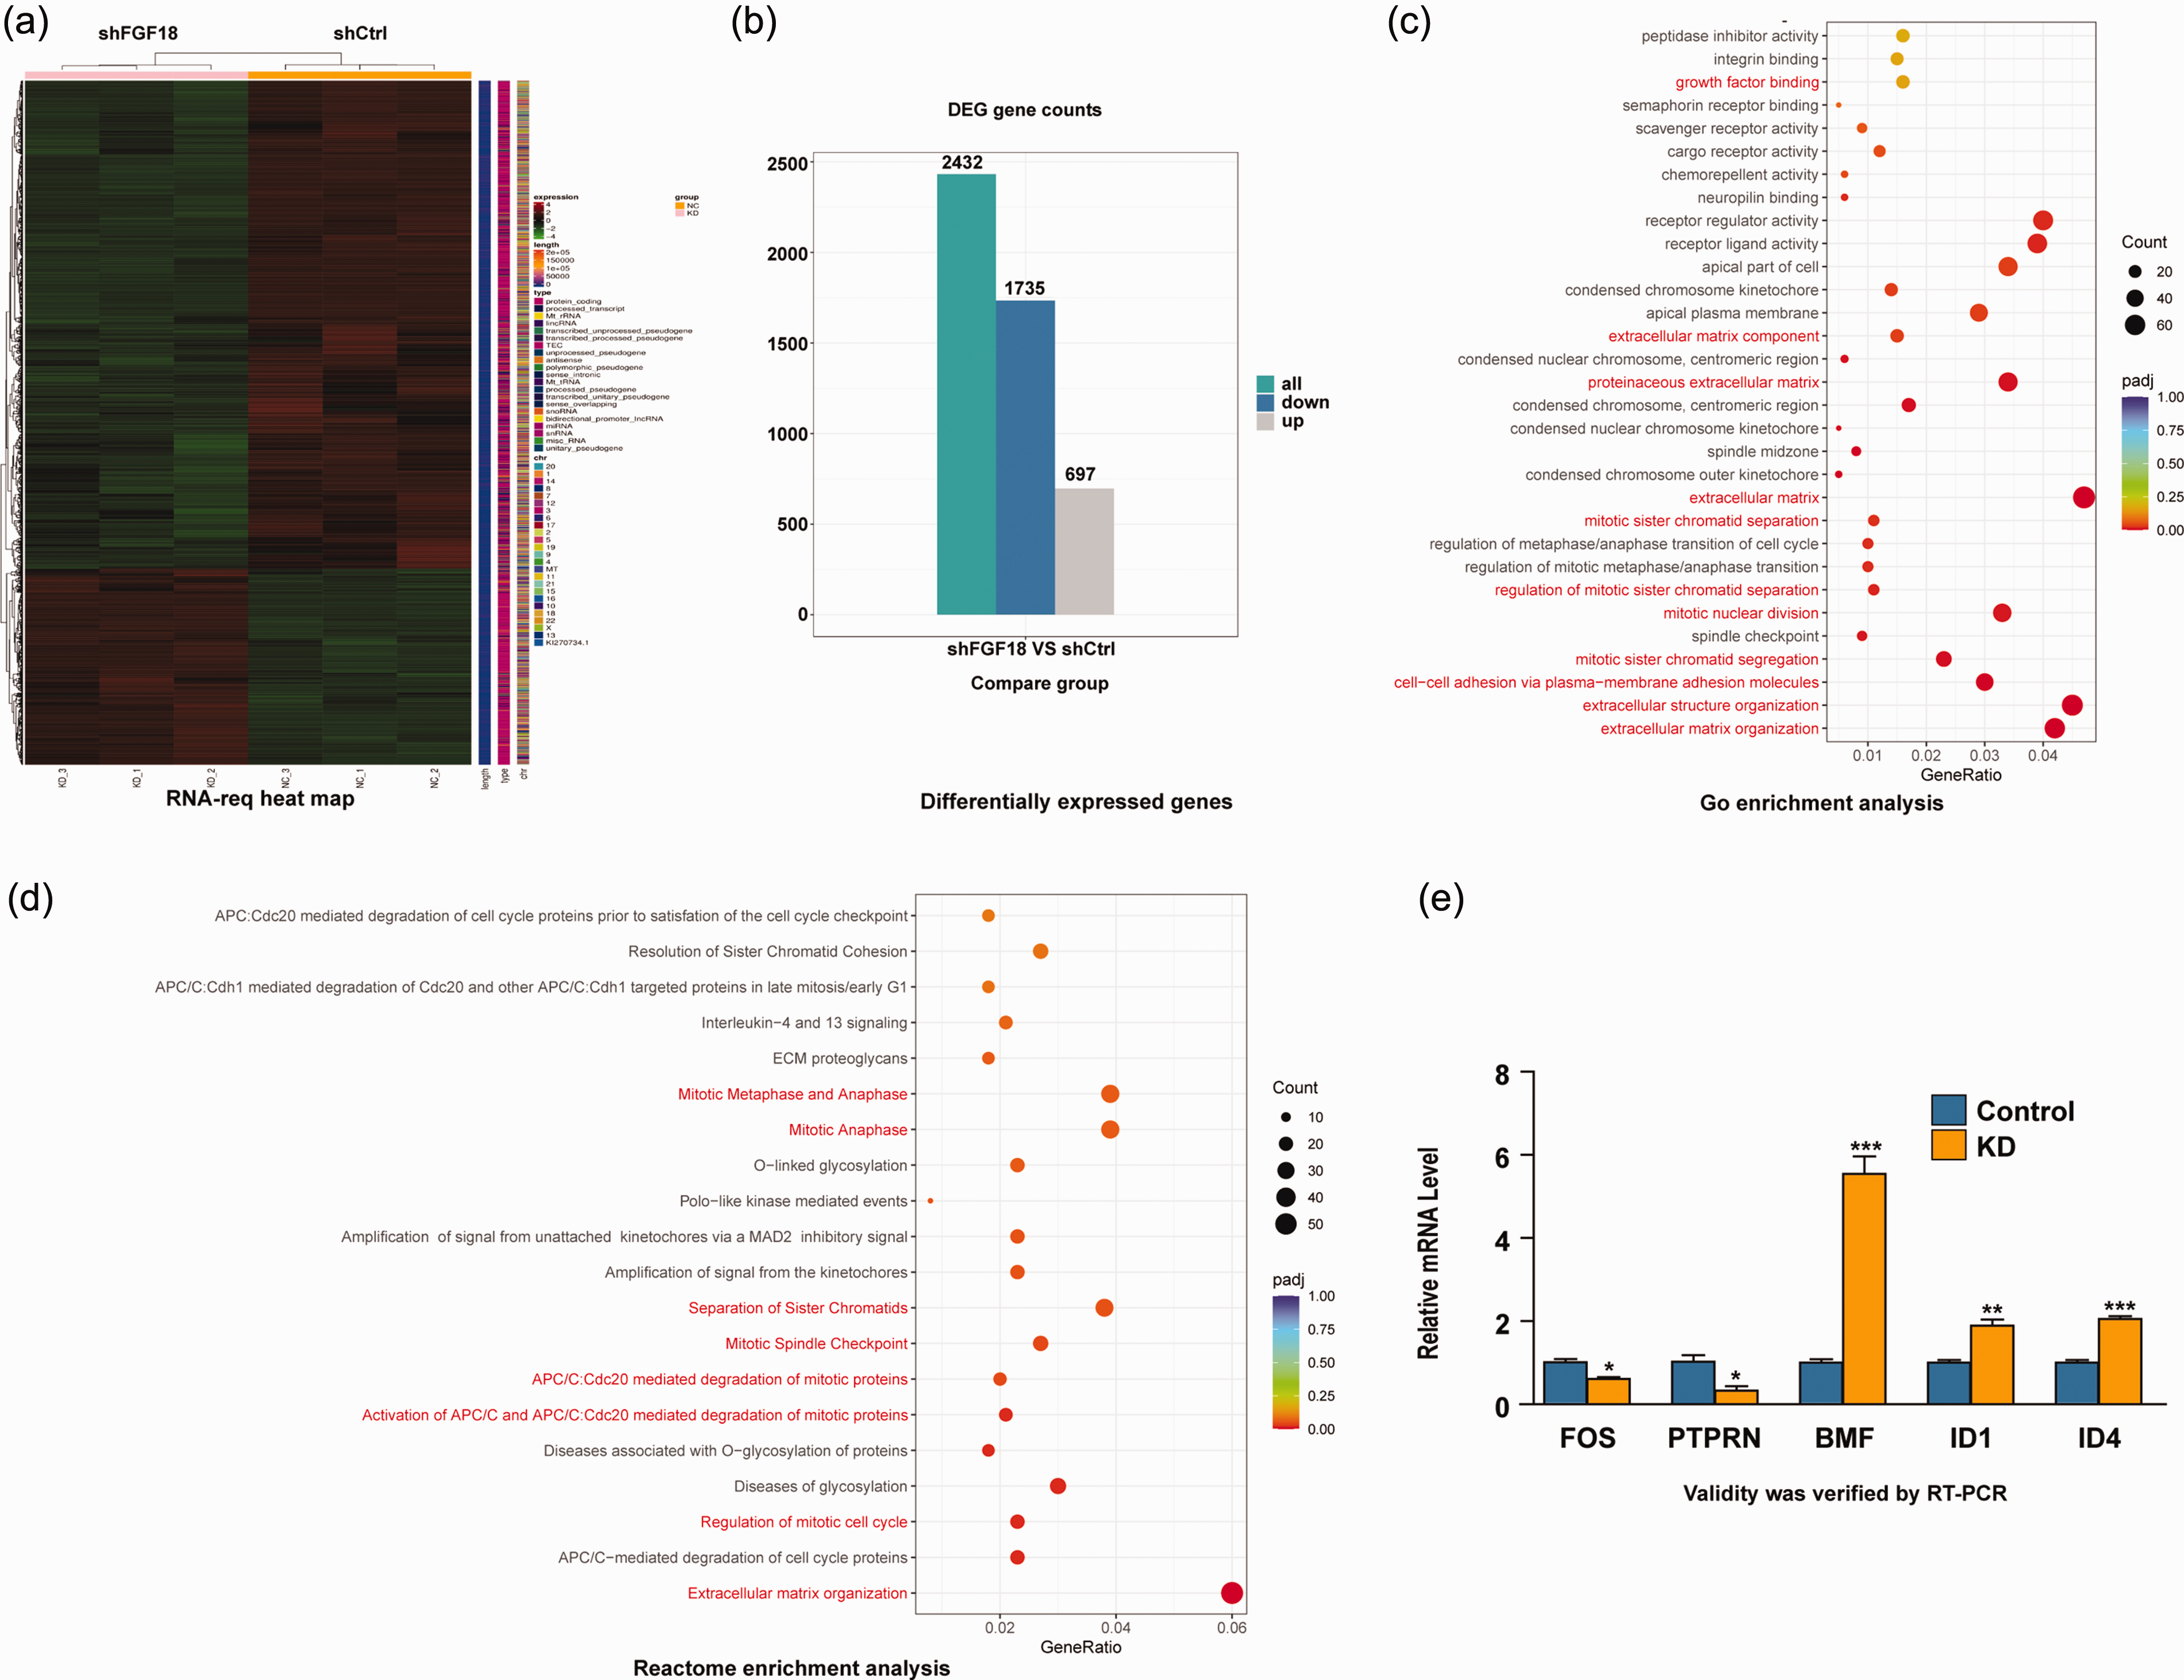
RNA sequencing (RNA-seq) and bioinformatics analyses of HEC-1-B cells revealed the differentially expressed genes (DEGs) between fibroblast growth factor 18 (FGF18)-knockdown and control cells. (a) RNA-seq was performed, then (b) DEGs were identified between FGF18-knockdown and control HEC-1-B cells. (c and d) Gene ontology and Reactome enrichment analyses demonstrated that the DEGs were involved in cell proliferation-related and migration-related pathways and (e) RNA-seq data were validated using quantitative reverse transcription polymerase chain reaction, which confirmed differential expression of certain proto-oncogenes and tumor suppressor genes following FGF18 knockdown (t-test, P < 0.05, 0.01, or 0.001).
Discussion
FGF18 can be produced by tumor or stromal cells. Gene mutations can result in FGF18 production in an autocrine manner, while tumor cells can induce endometrial stromal cells to produce and release FGFs from the extracellular matrix in a paracrine fashion. 24 Work in colorectal and liver cancers has demonstrated that induced FGF18 production via autocrine and paracrine mechanisms can mediate the biological behavior of tumor cells.20,25 Our previous report showed that stromal FGF18 could promote EC cell proliferation and infiltration. 26 Therefore, our study revealed that FGF18 production by both tumor cells (autocrine) and stromal cells (paracrine) play roles in EC carcinogenesis.
High tumor cell FGF18 expression levels have been observed in certain tumor types that are driven by estrogen, such as breast and ovarian tumors.14,19 Additionally, in serous and mucinous ovarian tumors, increased FGF18 expression is a marker of poorer prognosis. 27 FGF18, a novel prognostic biomarker, promotes gastric tumorigenesis in an autocrine manner. 18 High expression levels of HDAC7 and FGF18 in NSCLC are associated with poor prognosis, advanced TNM stage, and poor tumor differentiation. 28 Our current study demonstrated that FGF18 expression in EC patient samples was significantly correlated with histological subtype, FIGO stage, muscle invasion depth, and tumor size. FGF18 expression was also found to be an independent prognostic indicator for EC patients. One limitation of our study is that we only observed high FGF18 expression levels in EC samples without making comparisons with normal tissue samples. This will be included in future work to validate our findings.
Studying the mechanisms of tumor cell proliferation, invasion, and metastasis has become a key focus of cancer research. 29 Our data showed that knocking down FGF18 expression could inhibit the proliferation, migration, and invasion rates of EC cell lines. FGF18 also plays roles in the biological behavior and pathogenesis of various malignant tumors. As a proangiogenic growth factor, FGF18 can support tumor angiogenesis. FGF18 expression levels are high in cardiovascular tissues, which can induce endothelial cell migration. 30 Furthermore, FGF18 expression is associated with the microvessel density of liver and ovarian cancers.13,27 In addition to modulating angiogenesis, FGF18 also participates in tumor pathogenesis via the ERK signaling pathway. FGF18 can stimulate the proliferation and migration of H460 lung cancer cells and MDA-MB-231 breast cancer cells by activating ERK signaling.14,15 Our previous study demonstrated that estrogen-induced FGF18 production in the stromal environment can promote EC cell proliferation and invasion through activation of both the ERK and Akt signaling pathways. 26
Our current RNA-seq results tentatively revealed that FGF18 is associated with numerous genes that are involved in multiple signaling pathways related to cell division, apoptosis, proliferation, and extracellular matrix organization. As proto-oncogenes, Fos and PTPRN participate in the regulation of multiple biological processes, including cell cycle progression, proliferation, differentiation, migration, angiogenesis, and apoptosis.31,32 Tumor suppressor genes, such as BMF, ID1, and ID4, are also involved in the pathogenesis of multiple tumor types.33–35 Our data revealed that these proto-oncogenes and tumor suppressor genes are likely affected by FGF18 levels in EC. However, our current research on this is very limited. Therefore, additional studies are needed to identify these relevant signaling pathways in more detail.
Overall, FGF18 may contribute to EC pathogenesis via supporting tumor growth, invasion, and metastasis. It is also a strong prognostic biomarker for EC patients. FGF18 could potentially be used as a therapeutic target for treating EC in the future.
Footnotes
Acknowledgements
We thank Professor Xiang Tao from the Pathology Department of Obstetrics and Gynecology Hospital, Fudan University, and Professor Xiang-hua Yi from the Pathology Department of Tongji Hospital, Tongji University, for their guidance and assistance in this research project.
Author contributions
Z.Y.L. and B.H.Z. designed the study; J.W. wrote the manuscript; W.X. diagnosed the pathological sections; M.W. and M.C.D. performed the experiments; and B.B.L. performed the statistical analyses.
Declaration of conflicting interest
The authors declare that there is no conflict of interest.
Funding
This work was supported by the Pudong New Area Science and Technology Development Foundation of Shanghai, China (PKJ2021-Y19) and the Key Project of Clinical Research and Cultivation in Tongji Hospital Affiliated with Tongji University (ITJ (ZD) 2105).