
Abstract
Objective
The management and risk stratification of non-massive pulmonary embolism (PE) remain unclear. However, early assessment of PE severity can aid physicians in establishing better treatment milestones. There has been no direct comparison of mortality rates in patients with non-massive PE, and existing data are sometimes contradictory. Therefore, we examined the relationship between the Qanadli index and conventional risk stratifiers in PE.
Methods
We retrospectively analyzed 200 consecutively selected patients diagnosed with PE. The assessment included computed tomography pulmonary angiography, electrocardiography, echocardiography findings, outcomes, and a comparison with the Simplified Pulmonary Embolism Severity Index (SPESI) score. Descriptive, regression, and receiver operating characteristic analyses were performed.
Results
The mean Qanadli score was 13.5 ± 1.15. Pearson correlation analysis revealed significant associations between the total Qanadli score and several variables: right ventricular enlargement, follow-up ejection fraction, and SPESI score. Although the Qanadli score did not significantly predict mortality, the risk of death increased by 58.8% for each 1-unit increase in the SPESI score.
Conclusions
Although the Qanadli index is valuable in assessing PE and guiding treatment strategies, its standalone predictive value for mortality may be insufficient. Therefore, incorporating scoring systems such as the SPESI and echocardiographic findings is recommended for more accurate mortality prediction.
Keywords
Introduction
Pulmonary embolism (PE) ranks as the third most prevalent cardiovascular disease, with an estimated mortality rate of up to 30% without treatment.1–3 According to the European Society of Cardiology (ESC), the incidence of PE is 50 cases per 100,000 people, leading to 100,000 deaths annually in the United States and 300,000 deaths in Europe.4–7
Managing PE is challenging because of its diverse clinical presentations, ranging from asymptomatic findings on computed tomography pulmonary angiography (CTPA) to hemodynamic instability and sudden death.1,8,9 Given the variety of treatment options, including anticoagulants, fibrinolytics, percutaneous catheter-directed therapy, and surgical embolectomy, a risk-adjusted approach to treatment is crucial. 10 As a result, numerous studies have explored risk stratification methods for patients with non-massive PE, though this topic remains controversial.
Currently, CTPA is the primary diagnostic tool for PE.4,11 This has prompted several studies investigating its role in risk stratification for PE. The CT obstruction index, also known as the Qanadli index (QI), is a quantitative method for assessing PE severity; however, its use in risk stratification has been debated. 12 Some studies have demonstrated its independent predictive value for mortality and chronic thromboembolic pulmonary hypertension, while others have not found such associations.13–21
In addition, right ventricular (RV) indices have been shown to predict mortality, and in line with ESC guidelines, RV dysfunction can be used in a risk-adjusted treatment approach for patients with PE.10,21,22 This study focused on exploring the association between the QI score, electrocardiography findings, echocardiography findings, and outcomes (mortality and morbidity), while also comparing the QI score with the Simplified Pulmonary Embolism Severity Index (SPESI) score, a well-established risk stratification method, 23 in patients with non-massive PE.
Methods
Patients and profiles
This retrospective cohort study involved 200 patients aged ≥18 years who were admitted with a diagnosis of pulmonary thromboembolism between January 2014 and March 2019 at Rasoul Akram Hospital, Tehran, Iran. The study assessed CTPA, electrocardiography, and echocardiography findings, as well as mortality, morbidity, and comparisons with the SPESI score. All individual details were de-identified in accordance with ethical considerations, and the reporting of the study adheres to the STROBE guidelines. 24
An unstable hemodynamic state was defined as a systolic blood pressure (SBP) of <100 mmHg and/or diastolic blood pressure of <60 mmHg, a respiratory rate of >30 breaths per minute, a heart rate of >110 beats per minute, or oxygen saturation of <90%. Bed rest was defined as immobilization for more than 3 days or prolonged travel (>4 hours), and obesity was defined as a body mass index of >30 kg/m2.
The SPESI score was determined by factors including age of >80 years, history of cancer, history of chronic cardiopulmonary disease, heart rate of >110 beats per minute, SBP of <100 mmHg, and oxygen saturation of <90%. 25 Echocardiographic findings were measured according to the latest guidelines, and the QI score was calculated using the formula ∑ ([n × d]/40) × 100. Here, n represents the number of segmental branches distal to the proximal thrombus in the pulmonary arterial tree (ranging from 1 to 20), and d represents the degree of obstruction (ranging from 0 to 2) (Figure 1). 12

Qanadli index score measurement. The QI score was calculated using the formula ∑ ([n × d]/40) × 100. Here, n represents the number of segmental branches distal to the proximal thrombus in the pulmonary arterial tree (ranging from 1 to 20), and d represents the degree of obstruction (ranging from 0 to 2). PE, pulmonary embolism.
Echocardiography and CTPA determination
Two-dimensional transthoracic echocardiography was performed within 6 hours of clinical suspicion of PE using a GE Vivid E9™ cardiac ultrasound system (GE HealthCare, Chicago, IL, USA). Experienced echocardiographers, blinded to the QI score, analyzed videotaped examinations. The quantitative assessment of the right ventricle was conducted according to the latest ESC guidelines using the apical four-chamber view.
All patients also underwent standard CTPA within 6 hours. A total of 50 mL of Visipaque™ (iodixanol) was administered. The CT scans were reviewed by two radiologists who were blinded to the echocardiographic findings, and the QI score was calculated as previously described.
Statistical analysis
The t-test or Wilcoxon signed-rank test was used to compare dependent variables across different time points. Receiver operating characteristic (ROC) and Cox hazard analyses were performed, with a significance level set at 0.05. Spearman’s test was employed to assess correlations between quantitative variables, while qualitative variables were analyzed using the Mann–Whitney test or Kruskal–Wallis test, as appropriate. Interobserver variability was determined for both CT and echocardiographic indices.
Quantitative variables between groups were compared using the t-test, and qualitative variables at different time points were compared using the chi-squared test. The results were expressed as absolute and percentage frequencies for qualitative variables and as mean ± standard deviation for quantitative variables. Data analysis was conducted using IBM SPSS version 26 software (IBM Corp., Armonk, NY, USA).
Results
Descriptive findings
A total of 200 individuals participated in this study, including 108 (54%) men and 92 (46%) women. Their mean age was 58.8 ± 18.8 years, and 14% of patients presented with SBP of <100 mmHg (Table 1). Nearly half of the patients experienced dyspnea at rest (44.5%), approximately one-third had an SPESI score of >1, and more than one-quarter exhibited elevated troponin levels (Table 2).
Basic and demographic characteristics.
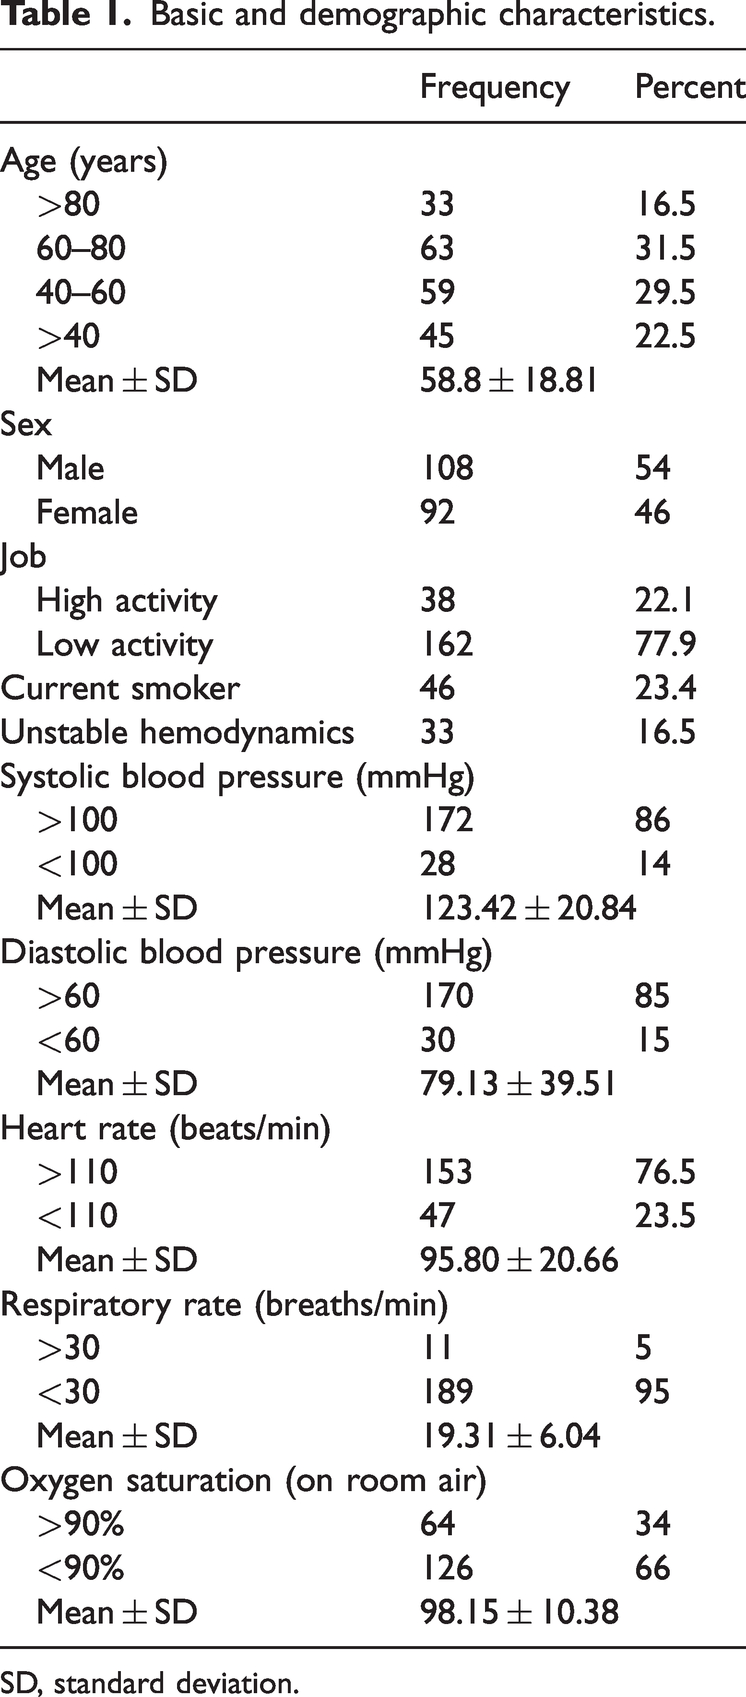
SD, standard deviation.
Basic clinical and paraclinical findings.

NYHA, New York Heart Association; SPESI, Simplified Pulmonary Embolism Severity Index; PE, pulmonary embolism; CRP, C-reactive protein; WBC, white blood cell count; pro-BNP, pro-brain natriuretic peptide; ESR, erythrocyte sedimentation rate; RV, right ventricular; LV, left ventricle; LDH, lactate dehydrogenase; TR, tricuspid regurgitation; IVC, inferior vena cava.
The mean QI score was 13.5 ± 1.15. Significant associations were found between the total QI score and various clinical variables, including RV enlargement (p = 0.002), McConnell’s sign (p = 0.007), pulmonary arterial hypertension (r = 0.19, p = 0.007), tricuspid regurgitation severity (p = 0.009), pulmonary artery pressure (r = 0.14, p = 0.049), 4-month follow-up ejection fraction (r = −0.41, p = 0.006), SPESI score (p = 0.002), pro-BNP level (p < 0.001), and systolic blood pressure (r = −0.17, p = 0.019).
The analysis focused on assessing the QI score’s predictive ability for mortality. Further details are provided in Table 3. The area under the ROC curve was 70.1%, indicating fair predictive performance. A QI score cut-off of 27.41 yielded a sensitivity of 68.7% and specificity of 69.5% (Figure 2).
Correlation/comparison between Qanadli score and clinical variables.

The table presents correlations and comparisons between the Qanadli score and several quantitative and qualitative variables using appropriate statistical tests. Significant associations were found with RV enlargement (p = 0.002), McConnell’s sign (p = 0.007), PAH (r = 0.19, p = 0.007), tricuspid regurgitation severity (p = 0.009), pulmonary artery pressure (r = 0.14, p = 0.049), 4-month follow-up ejection fraction (r = −0.41, p = 0.006), SPESI score (p = 0.002), pro-BNP level (p < 0.001), and systolic blood pressure (r = −0.17, p = 0.019).
RV, right ventricular; PAP, pulmonary artery pressure; IVC, inferior vena cava; SPESI, Simplified Pulmonary Embolism Severity Index; RBBB, right bundle branch block; RAD, right axis deviation; AF, atrial fibrillation; STD, ST depression; RV.LV, right ventricle to left ventricle ratio; PA.AO, pulmonary artery to aorta ratio; F/U, follow-up; PFO, patent foramen ovale; PAH, pulmonary arterial hypertension; TR, tricuspid regurgitation; SPAP, systolic pulmonary artery pressure; S1Q3T3, S wave in lead I, Q wave in lead III, T wave inversion in lead III pattern; RV strain, right ventricular strain; T inversion, T wave inversion; CRP, C-reactive protein; WBC, white blood cell count; Pro-BNP, pro-brain natriuretic peptide; ESR, erythrocyte sedimentation rate; LDH, lactate dehydrogenase; Hb, hemoglobin; LV, left ventricle.
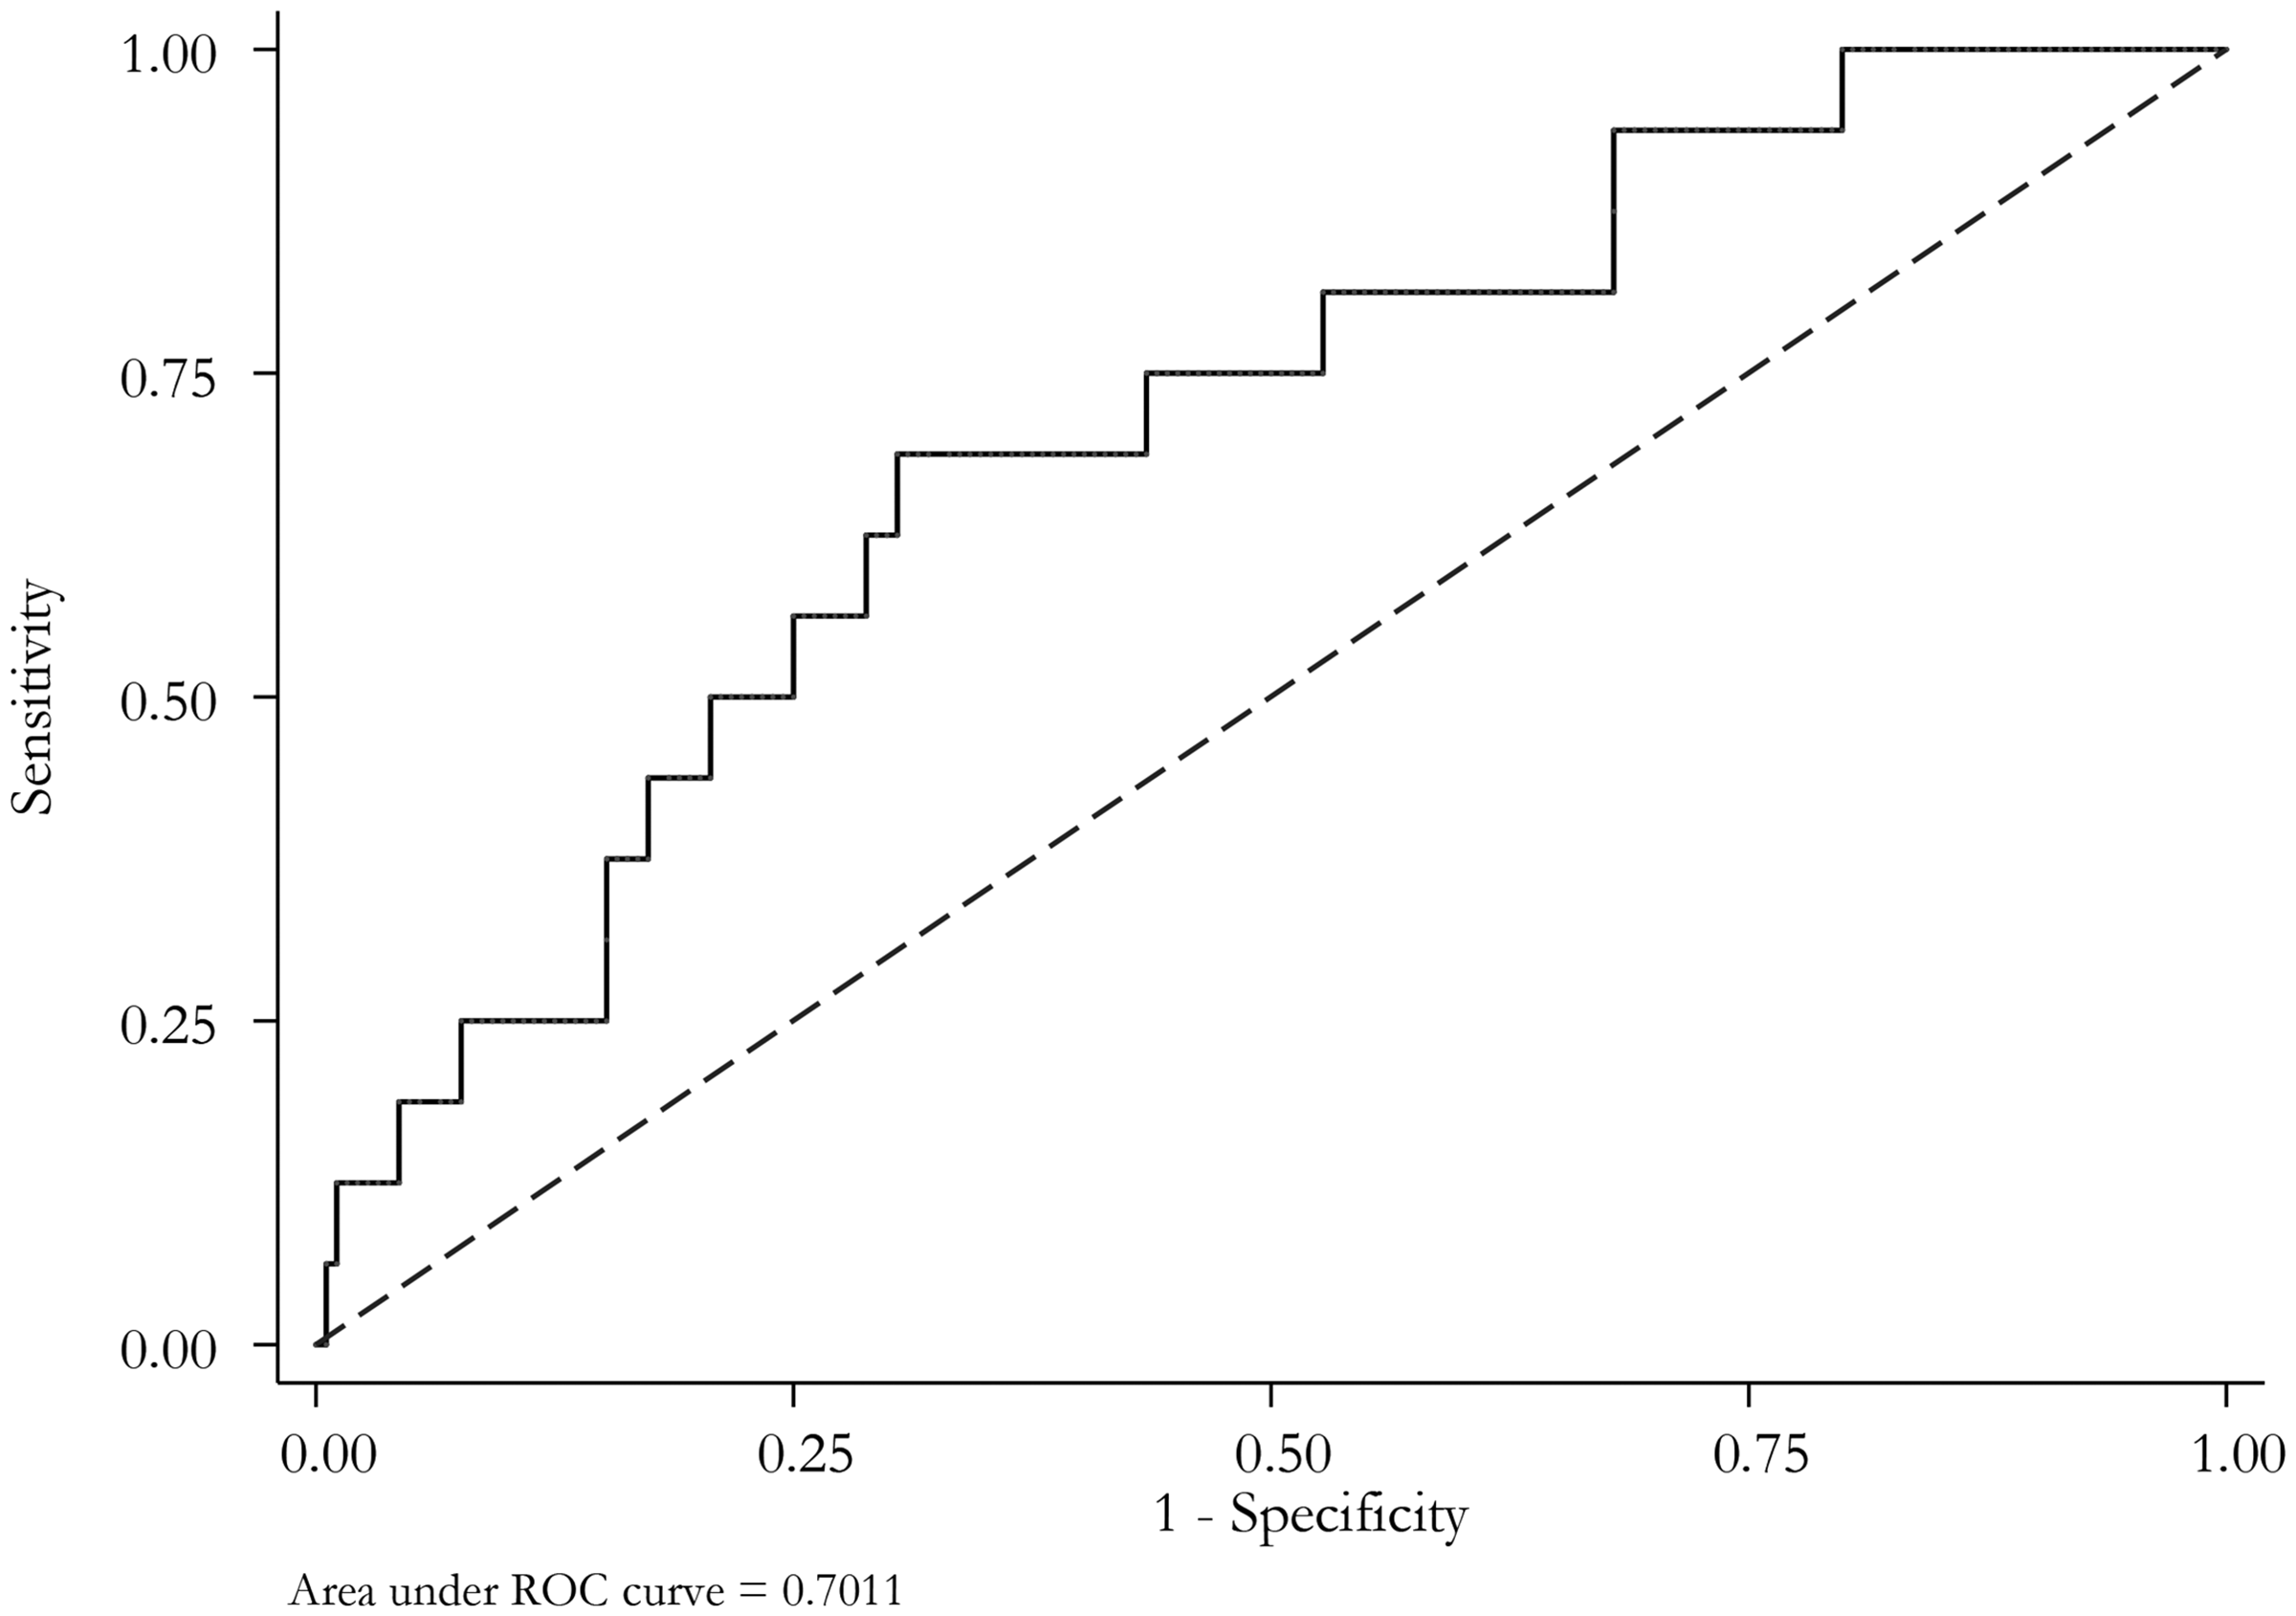
The area under the ROC curve for the Qanadli score was 70.1%, with a Qanadli score cut-off of 27.41, suggesting fair performance by a sensitivity of 68.7% and a specificity of 69.5%. ROC, receiver operating characteristic.
Although the QI score did not significantly predict mortality, the risk of death increased by 58.8% for each 1-point increase in the SPESI score. Cox proportional hazard models revealed that only the SPESI score was significantly associated with increased mortality in both the adjusted and crude models (Table 4).
Cox proportional hazard models for Qanadli and SPESI scores.

Only the SPESI score exhibited a significant increase in mortality in both the adjusted and crude models.
SPESI, Simplified Pulmonary Embolism Severity Index; CI, confidence interval.
Discussion
Given the ongoing controversy surrounding the management of patients with PE, particularly those with sub-massive PE, this study primarily examined the relationship between the QI score and patient outcomes, aiming to explore the potential of the QI score as a new indicator for thrombolytic therapy.
This retrospective study assessed the characteristics of 200 patients with non-massive PE, including their demographic, echocardiographic, electrocardiographic, and CTPA data. The findings showed a higher proportion of male than female patients and a four-fold higher likelihood of mortality in patients aged >80 than <80 years. Thrombolytic therapy was administered to 5% of patients. The in-hospital, 1-month, and 6-month mortality rates were 14.5%, 2.0%, and 6.5%, respectively. Furthermore, 6.5% of patients had a QI score of >20 (QI > 50), 1.5% had a left-sided QI score of >25, and 5% had a right-sided QI score of >25.
A significant relationship was observed between the total QI score and variables such as RV enlargement, McConnell’s sign, pulmonary arterial hypertension, tricuspid regurgitation severity, pulmonary artery pressure, 4-month follow-up ejection fraction, and SBP. However, the common occurrence of a higher right-sided QI score and worse outcomes did not yield a significant relationship with mortality. In addition, the total QI score did not demonstrate a significant association with mortality or unstable hemodynamics, indicating its limited predictive ability for mortality risk. However, significant associations were found between mortality and factors such as tricuspid regurgitation severity, RV dysfunction, unstable hemodynamics, erythrocyte sedimentation rate, C-reactive protein level, pro-BNP level, SPESI score, inferior vena cava diameter, and D-dimer level, suggesting that patients with non-massive PE may benefit from more advanced treatments, including thrombolytic therapy.
Qanadli et al. 12 compared the CT obstruction index and pulmonary arterial obstruction on angiography (assessed by the Miller index) and correlated these findings with echocardiography using linear regression. They demonstrated that a specific CT index could quantify the degree of arterial obstruction in PE, showing reproducibility and a high correlation with the index obtained through pulmonary angiography. 12 Our findings are consistent with their research, recognizing the QI score as a reliable and appropriate index for CTPA. Similarly, Aribas et al. 26 used the QI score and found it to be a reliable and appropriate index for CTPA.
Similar to these studies, Rodrigues et al. 27 and Attinà et al. 28 identified a relationship between the QI score and mortality. However, unlike our research, they reported a significant p-value, possibly due to differences in population size, data variability, and study design. By contrast, Furlan et al. 29 found that the clot burden shown by CTPA was not associated with short-term mortality, which aligns with our findings.
A study conducted in the United States in 2016 titled “CTPA-based scoring system to predict the prognosis of acute pulmonary embolism” by Kumamaru et al. 30 analyzed 1698 consecutive positive CTPAs at a single institution from 2003 to 2010. Two radiologists independently assessed each study for clinically relevant findings and conducted adjudication. 30 These variables, along with patient information, were used to develop a LASSO logistic regression model for predicting 30-day mortality. The final model generated a point score for each significant variable, and the PESI score was calculated for 568 patients who visited the hospital after 2007. Notably, the CTPA-based model demonstrated superior predictive ability for 30-day mortality compared with the PESI. Incorporating the CTPA-based scoring system into image interpretation workflows was suggested to help physicians select the most appropriate management approach for individual patients.
In our analysis, the performance of the QI score as a predictor of mortality was evaluated. The area under the ROC curve was 70.11%, indicating moderately fair predictive ability. Despite the QI score not showing a significant hazard for death, our adjusted model indicates that each 1-unit increase in the SPESI score increased the risk of death by 58.5%. Our study revealed a significant correlation between mortality and SPESI score criteria, which include laboratory data and echocardiographic findings, contradicting the results of the aforementioned studies.27,28,30
A German study involving 246 patients examined the Mastora score, an alternative method for assessing pulmonary vessel obstruction. The study concluded that thrombotic occlusion of pulmonary vessels is not associated with the clinical severity of PE, consistent with our findings regarding the lack of a significant correlation between the QI score and mortality. 31
Akhoundi et al. 32 also highlighted the inefficacy of the QI score in predicting mortality. They suggested enhancing the QI score by integrating the RV/LV ratio to create a combined QI score for better mortality prediction because the QI score alone lacks this predictive ability. 32 Notably, their study did not include a comparison between the QI score and the SPESI score.
The main limitations of this study are its single-center design and the restricted sample size of 200 patients. These limitations could be addressed by conducting multicenter studies with larger sample sizes.
Conclusion
Despite the advantages of the QI score in assessing PE and guiding treatment strategies, its standalone predictive value for mortality may be insufficient. Therefore, using scoring systems such as the SPESI and incorporating echocardiographic findings could be more beneficial for mortality prediction.
Footnotes
Acknowledgements
The authors express their appreciation to the healthcare workers, nurses, and doctors who provided care to the patients evaluated in this study.
Author contributions
SH: design and conceptualization, critical revision. AS: clinical data collection, critical revision, data analysis and interpretation. PB and EA: clinical data collection, laboratory data collection, drafting. SM was the corresponding author who revised, edited, and finalized the final manuscript. All the authors approved the final version of the manuscript.
Data availability statement
The data supporting the findings of this study can be requested from the corresponding author. They are not publicly accessible because of privacy or ethical restrictions.
Declaration of conflicting interests
The authors declare that they have no conflict of interest.
Ethical considerations
This study was approved by the Ethics Committee of Iran University of Medical Sciences (approval no. IR.IUMS.FMD.REC.1399.677). Prior to the study’s commencement, all participants were informed about the study and provided verbal informed consent for publication.
Funding
The authors did not receive support from any organization for the submitted work.