
Abstract
Objective
This study investigated the relationship between glycated serum protein (GSP) and progressive infarction (PI).
Methods
From April 2017 to December 2020, we recruited 477 patients within 48 hours after the onset of acute ischemic stroke into this case–control study. Demographic characteristics, clinical information, and laboratory and neuroimaging data were recorded after admission.
Results
PI occurred in 144 (30.8%) patients. Patients with PI had higher initial National Institute of Health Stroke Scale (NIHSS) scores, higher discharge NIHSS scores, higher modified Rankin scale scores at 3 months after onset, higher GSP levels, lower prothrombin times, and lower creatinine levels than patients without PI. The likelihood of PI increased with increases in the GSP quartile. Multiple regression analysis revealed that high GSP levels (>2.14 mmol/L) were independently associated with PI. Subgroup analyses identified high GSP levels as an independent predictor of PI in patients with large artery atherosclerosis (third quartile: odds ratio [OR] = 3.793; 95% confidence interval [CI] = 1.555–9.250; fourth quartile: OR = 2.675; 95% CI = 1.056–6.776) and anterior circulation small vessel occlusion (fourth quartile: OR = 13.859; 95% CI = 2.024–94.885).
Conclusions
GSP might be an independent predictor for PI in certain patients with acute ischemic stroke.
Keywords
Introduction
Acute ischemic stroke, as the most common subtype of stroke, has become the leading cause of death and disability in both China and the world.1,2 Early neurological deterioration (END) occurs in approximately 20% to 40% of patients after admission for acute ischemic stroke. 3 END has been defined as an increase of ≥1 point in motor power or ≥2 points in the total National Institute of Health Stroke Scale (NIHSS) score within 7 days after admission. 4 However, multiple factors can contribute to END, including progressive infarction (PI), increased intracranial pressure, recurrent cerebral ischemia, and secondary parenchymal bleeding.3,5 In recent years, many variables have been demonstrated to be associated with END, such as the initial NIHSS score, 6 Trial of Org 10172 in Acute Stroke Treatment (TOAST) classification, 7 low-density lipoprotein, 8 fibrinogen, 9 and blood pressure variability. 10
Diabetes is a risk factor for poor prognosis in acute ischemic stroke. Glycated hemoglobin (HbA1c) and glycated serum protein (GSP) have been widely used for monitoring disease control and adjusting therapy in diabetes. HbA1c reflects the glycemic status in the previous 2 to 3 months, whereas GSP reflects the average blood glucose level in the past 1 to 3 weeks.11,12 Two studies have demonstrated that HbA1c is associated with END in patients with diabetes and acute ischemic stroke or acute brainstem infarctions.13,14 Compared with HbA1c, GSP can better reflect fluctuations in blood glucose levels, especially recent changes. However, to the best of our knowledge, no studies have assessed the relationship between GSP and END.
Among the factors leading to END in acute ischemic stroke, PI is the most common, accounting for approximately 30% of cases. 5 Because GSP has attracted increasing attention in recent years, this work investigated the relationship between GSP and PI.
Materials and methods
Patients
We assessed patients who were admitted to the Stroke Unit of First Affiliated Hospital of Nanchang University (Nanchang, China) between April 2017 and December 2020. This study was approved by the Ethics Committee of the First Affiliated Hospital of Nanchang University (2022 Medical Research Ethic Fast Review No. 3-004). In addition, all patient details were de-identified. The reporting of this study conformed to the STROBE guidelines. 15 Informed written consent was not required for this retrospective study. Patients were selectively recruited if they met the following criteria: (1) admitted to our hospital within 48 hours after symptom onset and (2) presented with evidence of cerebral infarction on diffusion-weighted imaging (DWI) consistent with the clinical deficit. Patients were excluded if they lacked complete imaging, laboratory, and follow-up data. Patients who had received intravenous thrombolysis or endovascular therapy were also excluded. PI was defined as an increase of ≥1 point in motor power or ≥2 points in the total NIHSS score within 7 days after admission. 4 More importantly, the progression of infarction needed to be confirmed by DWI.
Clinical characteristics and laboratory parameters
Demographic characteristics and clinical information including age, sex, history of hypertension and diabetes, the initial and discharge NIHSS scores, and the modified Rankin scale (mRS) at 90 days were recorded. The mRS was evaluated by in-person interviews or telephone. Laboratory indices, including white blood cells (WBCs), red blood cells (RBCs), hemoglobin (HGB), platelets (PLTs), prothrombin time (PT), fibrinogen,
Evaluation of neuroimaging information
All patients underwent magnetic resonance imaging (MRI) using a 3.0 Tesla scanner (MAGNETOM Trio, Siemens, Erlangen, Germany) within 48 hours of onset, which was repeated immediately revisited once neurological deterioration was detected. The protocol included T1-weighted imaging, T2-weighted imaging, fluid-attenuated inversion recovery imaging, DWI (TR/TE of 3100/91 ms; field of view =230 ×230 mm2; 19 slices with a slice thickness of 5 mm; voxel size = 1.2 × 1.2 ×5 mm3; 2b values of 0 and 1000 s/mm2; scan time of 1.16 min), and three-dimensional time-of-flight magnetic resonance angiography (TR/TE of 22/3.86 ms; field of view 235 × 235 mm2; voxel size = 0.9 × 0.6 ×0.6 mm3; 2b values of 0 and 1000 s/mm2; scan time of 3.12 minutes). All images were reviewed and evaluated by two trained neurologists who were blinded to the patients’ information. Leukoaraiosis was analyzed by a four-point score as proposed by Fazekas et al. 17 The TOAST criteria were used to determine the subtype of ischemic stroke. 18
Statistical analysis
Baseline characteristics and risk factors were compared using Student’s t-test or the Mann–Whitney U test for continuous variables and the chi-square test or Fisher’s exact test for categorical variables. Continuous variables with a normal distribution were presented as the mean ± standard deviation, variables with a non-normal distribution were expressed as the median (interquartile range), and categorical variables were presented as the frequency (percentage). For the entire cohort, multivariate logistic regression models were performed to identify independent factors for PI. All patients were divided into quartiles based on GSP levels (Q1, <1.78 mmol/L; Q2, 1.78–1.99 mmol/L; Q3, 1.99–2.14 mmol/L; Q4, >2.14 mmol/L), and the lowest quartile was used as the reference. Subsequently, the association between GSP and PI was analyzed among several subgroups according to the TOAST criteria using logistic regression models. In the large artery atherosclerosis (LAA) subgroup, the patients were divided into quartiles based on GSP levels (Q1, <1.79 mmol/L; Q2, 1.79–2.03 mmol/L; Q3, 2.03–2.18 mmol/L; Q4, >2.18 mmol/L). Similarly, the patients were divided into quartiles based on GSP in the small vessel occlusion (SVO; Q1, <1.77 mmol/L; Q2, 1.77–1.96 mmol/L; Q3, 1.96–2.1125 mmol/L; Q4, >2.1125 mmol/L), anterior circulation small vessel occlusion (ACSVO; Q1, <1.77 mmol/L; Q2, 1.77–1.91 mmol/L; Q3, 1.91–2.07 mmol/L; Q4, >2.07 mmol/L), and posterior circulation small vessel occlusion (PCSVO) subgroups (Q1, <1.785 mmol/L; Q2, 1.785–2.05 mmol/L; Q3, 2.05–2.2475 mmol/L; Q4, >2.2475 mmol/L). Furthermore, the receiver operating characteristic (ROC) curve was constructed for GSP, and the area under the curve (AUC) and Youden’s index were further calculated to determine the cutoff. Then, patients were divided into two groups based on this cutoff, and we compared the frequency of PI between these groups using the chi-squared test. Significance was indicated by two-tailed P < 0.05. All statistical analyses were performed using SPSS version 26.0 (IBM Corp., Armonk, NY, USA).
Results
In total, 477 patients (310 men; mean age, 63.68 years) were recruited and investigated. Of these patients, 147 (30.8%) and 330 (69.2%) were classified into the PI and non-PI groups, respectively.
The baseline demographic, clinical, laboratory, and imaging data of the two groups are listed in Table 1. There were no significant differences in age; sex; WBC, RBC, and PLT counts; HGB, fibrinogen,
Comparison of baseline characteristics between the PI and non-PI groups.

*P < 0.05.
PI, progressive infarction; NIHSS, National Institute of Health Stroke Scale; mRS, modified Rankin Scale; WBCs, white blood cells; RBCs, red blood cells; HGB, hemoglobin; PLTs, platelets; PT, prothrombin time; BUN, blood urea nitrogen; Cr, creatinine; UA, uric acid; HDL, high-density lipoprotein; LDL, low-density lipoprotein; GSP, glycated serum protein; TOAST, Trial of Org 10172 In Acute Stroke Treatment; LAA, large artery atherosclerosis; SVO, small vessel occlusion; CE, cardioembolism; UE, undetermined etiology; OE, other etiology; IQR, interquartile range; SD, standard deviation.
As presented in Table 2, the odds ratio (OR) for PI in the entire cohort increased as the GSP quartile increased. A multivariate logistic regression model adjusted for adjusted for age and sex revealed that high GSP levels (>2.14 mmol/L) were independently related to PI (OR = 1.949; 95% confidence interval [CI] = 1.124–3.381; P = 0.018). Furthermore, higher GSP levels (>2.14 mmol/L) were independently associated with PI after adjustment for hypertension, the initial NIHSS score, Cr levels, and PT (OR = 1.891; 955% CI = 1.078–3.316; P = 0.026). Finally, after adjusting for relevant confounders including hypertension; the initial NIHSS score; the TOAST classification; the incidence of leukoaraiosis; and Cr, BUN, UA, and
Evaluation of the effect of GSP on PI using multivariate logistic regression models.

Model was adjusted for age and male sex.
Model was adjusted for hypertension, initial NIHSS, Cr, and PT.
Model was adjusted for hypertension, initial NIHSS, Cr, BUN, UA, TOAST, leukoaraiosis, and
OR, odds ratio; CI, confidence interval; PI, progressive infarction; GSP, glycated serum protein; NIHSS, National Institute of Health Stroke Scale; Cr, creatinine; PT, prothrombin time; BUN, blood urea nitrogen; UA, uric acid; TOAST, Trial of Org 10172 in Acute Stroke Treatment.
The results of subgroup analyses are presented in Table 3. Notably, high GSP levels were an independent predictor for PI in patients with LAA (third quartile: OR = 3.793; 95% CI = 1.555–9.250; fourth quartile; OR = 2.675; 95% CI = 1.056–6.776) and ACSVO (fourth quartile: OR = 13.859; 95% CI = 2.024–94.885), but not in patients with PCSVO.
Evaluation of the impact of GSP on progressive infarction in subgroups using multivariate logistic regression models.

Model was adjusted for fasting glucose, PT, NLR, and urine specific gravity.
Model was adjusted for BUN, fasting glucose,
Model was adjusted for triglycerides, BUN, PT, leukoaraiosis,
Model was adjusted for
OR, odds ratio; CI, confidence interval; LAA, large artery atherosclerosis; SVO; small vessel occlusion; ACSVO, anterior circulation small vessel occlusion; PCSVO, posterior circulation small vessel occlusion; GSP, glycated serum protein; PT, prothrombin time; BUN, blood urea nitrogen; NLR, neutrophil–lymphocyte ratio; LDL, low-density lipoprotein.
ROC curve analysis suggested that the GSP level was a predictor of PI in the entire cohort and in the LAA and ACSVO subgroups using a cutoffs of 2.035 (sensitivity = 59.2%; specificity =58.2%), 1.925 (sensitivity = 72.4%; specificity = 49.0%), and 1.865 mmol/L (sensitivity = 74.2%; specificity = 52.7%), respectively (Figure 1). The AUC of GSP for discriminating PI was 0.580 in the entire cohort, 0.601 in the LAA subgroup, and 0.655 in the ACSVO subgroup (Figure 1). Furthermore, patients were divided into two groups based on a cutoff of 2.035 mmol/L (Table 4). In the entire cohort, the frequency of PI was 23.8% in patients with GSP < 2.035 mmol/L, versus 63.0% in patients with GSP ≥ 2.035 mmol/L (P = 0.001). Likewise, in patients with LAA, PI was more frequently observed in patients with GSP ≥ 1.925 mmol/L (41.7%) than in those with GSP < 1.925 mmol/L (22.1%; P = 0.003). Additionally, in the ACSVO subgroup, the frequencies of PI were 46.9% and 21.6% in patients with GSP ≥ 1.865 mmol/L and GSP < 1.865 mmol/L, respectively (P = 0.023).
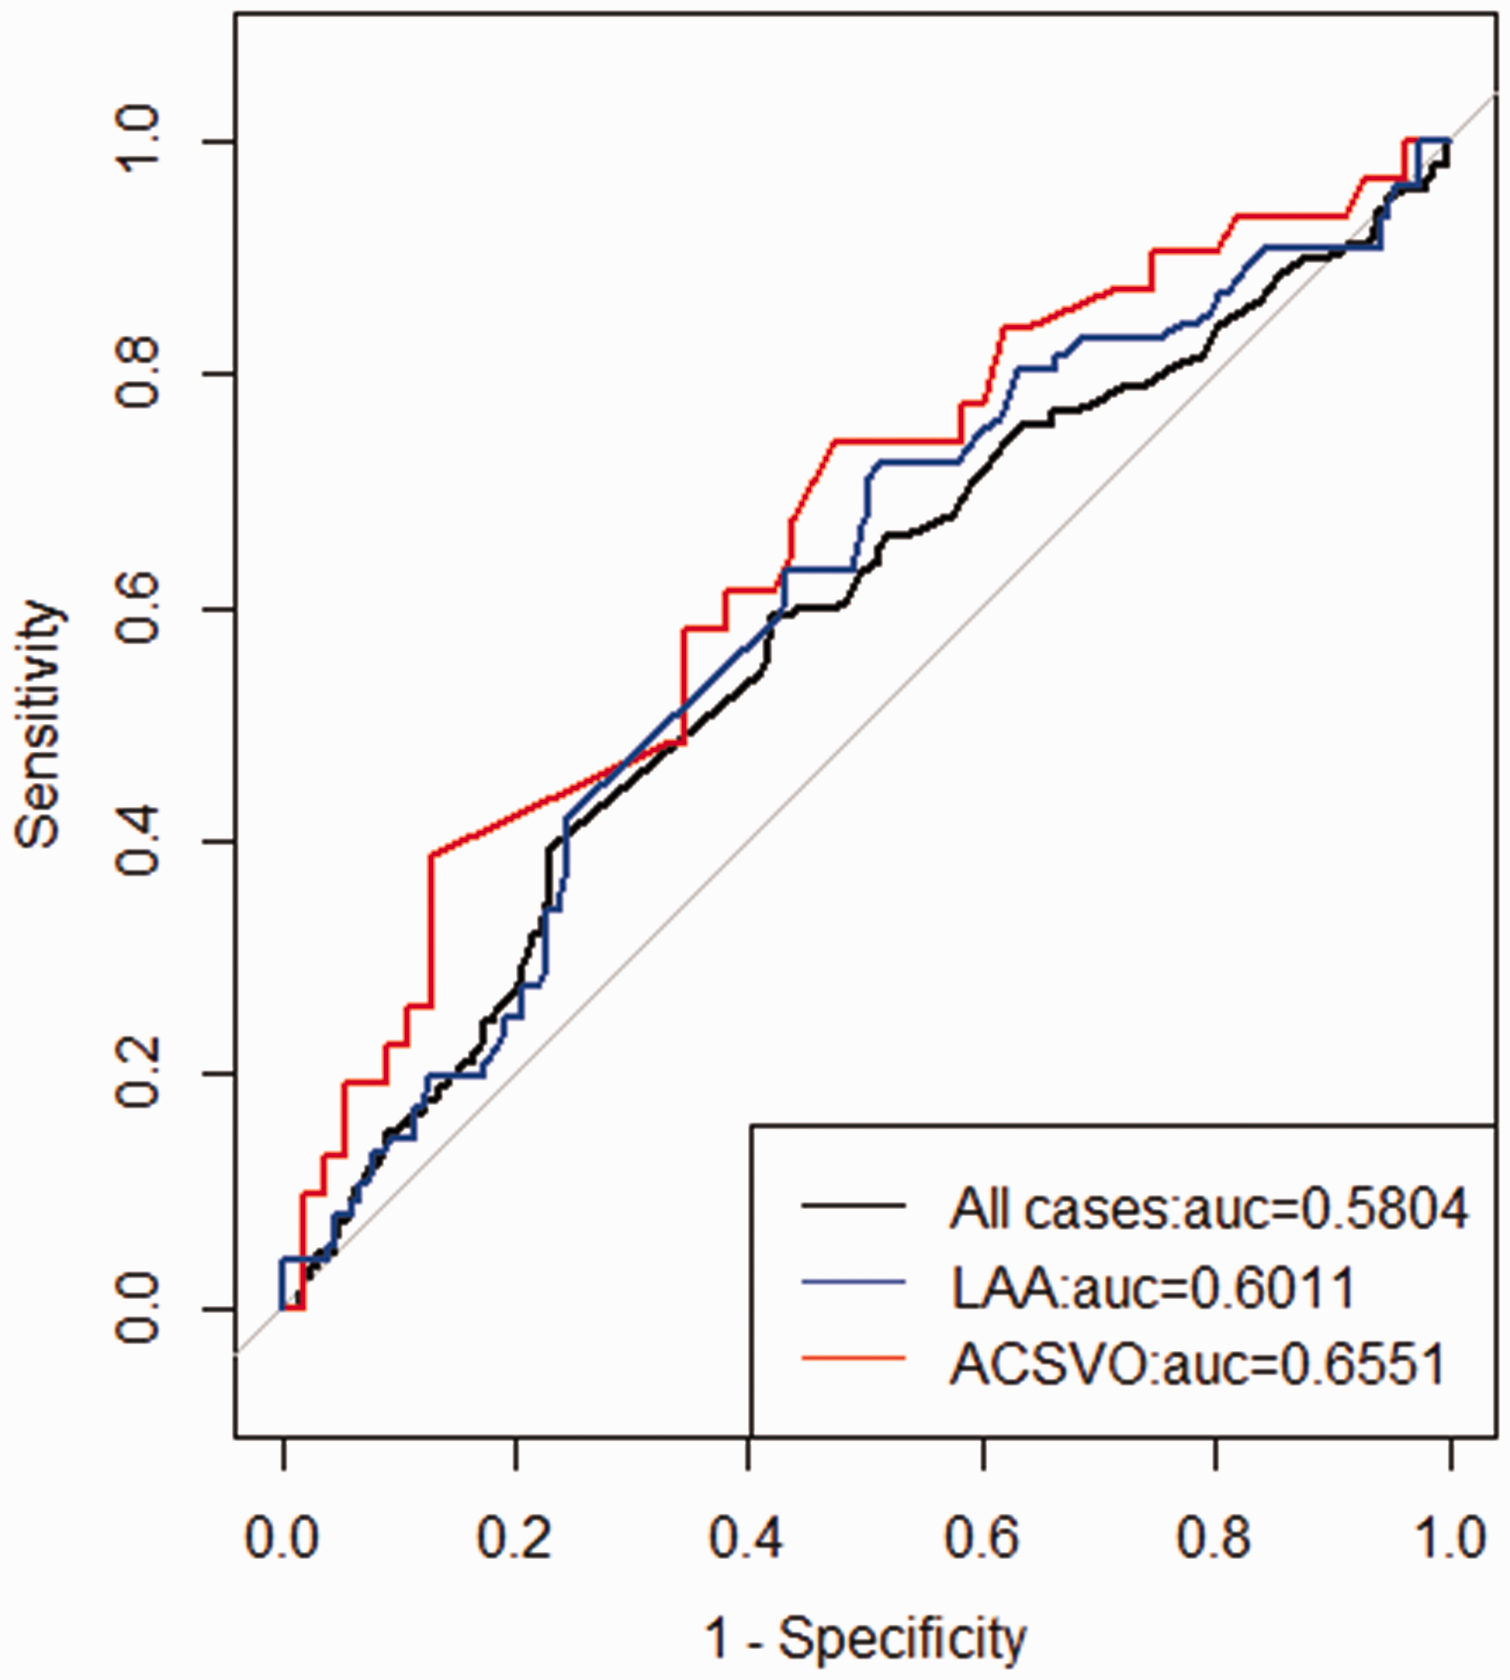
Receiver operating characteristic curve of GSP for predicting progressive infarction in the entire cohort and in the LAA and ACSVO subgroups. GSP, glycated serum protein; LAA, large artery atherosclerosis; ACSVO, anterior circulation small vessel occlusion; AUC, area under the curve.
Evaluation of the association between GSP and progressive infarction based on the cutoff.

PI, progressive infarction; GSP, glycated serum protein; LAA, large artery atherosclerosis; ACSVO. anterior circulation small vessel occlusion.
Discussion
The present study identified GSP as an independent predictor of PI within 48 hours after acute cerebral infarction, especially in patients with LAA and ACSVO. In the entire cohort, patients with GSP ≥ 2.035 mmol/L were more likely to develop PI. In addition, an increased risk of PI was observed in patients with LAA and ACSVO using GSP cutoffs of ≥1.925 and ≥1.865 mmol/L, respectively. To the best of our knowledge, this is the first study demonstrating that GSP is associated with PI.
The definition of END is based on symptomatic changes (an increase of ≥1 point in motor power or ≥2 points in the total NIHSS score within 7 days after admission). 4 Several causes have been proposed for END in acute ischemic stroke, including PI, new infarction, edema, elevated intracranial pressure, seizure, and hemorrhagic conversion.3,5 Weimar et al. reported that END was attributed to progressive stroke in 33.6% of patients, elevated intracranial pressure in 27.3% of patients, recurrent infarction in 11.3% of patients, and hemorrhagic conversion in 10.5% of patients. 5 To date, most studies have used END as an outcome variable, which might reduce the specificity of the predictor. In our study, we purely focused on the association between GSP and PI as confirmed by MRI and concluded that GSP was an independent predictor of PI.
There is compelling evidence that hyperglycemia is associated with poor outcomes after ischemic stroke. 19 Huang et al. found that the admission glucose level can predict neurological worsening in female patients with acute ischemic stroke. 20 In addition, Hui et al. demonstrated that persistent hyperglycemia during the first 24 hours was independently associated with infarct expansion. 13 Of note, the relationship between glycemic variability and END has gradually attracted attention, and it was reported that HbA1c levels and initial glycemic variability were higher among patients with END. 21 HbA1c is used to evaluate glycemic control in the last 2 to 3 months because of the 90- to 120-day lifespan of RBCs. 22 However, in recent years, GSP, which has a shorter half-life, has gradually been used to monitor glycemic control because it reflects antecedent glycemic levels in the preceding 1 to 3 weeks. 12 In addition, GSP is more suitable than HbA1c for assessing glycemic control in certain situations, such as hemodialysis, 23 anemia, 24 and gestational diabetes. 25 Thus, we investigated the association between GSP levels and PI in our study, finding that GSP could predict PI in patients with acute ischemic stroke.
Although previous studies using HbA1c and glycated albumin found that glycemic variability was associated with END,26,27 our study newly explored the relationship between PI and GSP, which reflects recent glycemic fluctuation. However, the precise mechanism by which glycemic variability participates in the development of PI remains unclear, and several studies highlighted the roles of oxidative stress and atherosclerosis. On the one hand, previous studies found that rapid glucose fluctuation was more likely to trigger oxidative stress than persistent hyperglycemia, leading to vascular and brain injury.13,26 On the other hand, acute glucose fluctuation has been postulated to participate in the pathogenesis of atherosclerosis.27–29 PI might be attributable to the development of atherosclerosis and clot progression. 30 Therefore, the correlation between GSP levels and PI might involve arteriosclerosis. The fact that GSP is an independent predictor of PI only in patients with LAA or ACSVO in our study supports this hypothesis.
Although our results revealed that the TOAST classification was not significantly different between the PI and non-PI groups, some studies found that different mechanisms of ischemic stroke were associated with different rates of END.31,32 Patients with ischemic stroke attributable to non-cardiac embolism were more likely to experience deterioration than those with cardioembolic infarcts, and lacunar stroke caused by SVO was the major cause of neurological worsening.33,34 Sumer et al. and Jones et al. demonstrated that patients with posterior circulation infarcts experienced a higher rate of progression than those with anterior circulation infarcts.35,36 However, other studies revealed that anterior circulation infarcts were more frequent in patients with END.32,37 Therefore, we further analyzed the relationship between GSP and PI in patients with different mechanisms or different lesion topography and found that GSP was an independent predictor for PI in patients with LAA or ASCVO but not in those with PCSVO.
This study had two potential limitations. First, although the entire sample is adequate, this was a single-center, retrospective study with patients of a single ethnic background. Second, the sample size for cardioembolism, undetermined etiology, or other etiology in the TOAST classification was relatively small, and we only analyzed the relationship between GSP levels and PI in patients with LAA or SVO. Therefore, a multicenter study with a larger and multiracial patient population is needed to further explore the association between GSP and PI.
Conclusion
GSP might be an independent predictor for PI in patients with acute ischemic stroke, especially in those with LAA or ACSVO.
Footnotes
Author contributions
Concept and design: KZ, CW, JZ, and YY; acquisition, analysis, or interpretation of data: XM, QH, ZX, CZ, JL, HZ, and LZ; drafting of the manuscript: KZ and CW; critical revision of the manuscript for important intellectual content: JZ and YY; obtaining funding: JL. All authors have read and approved the final manuscript.
Data availability statement
All data are available from the corresponding author upon reasonable request.
Declaration of conflicting interest
The authors declare that there is no conflict of interest.
Funding
This study was supported by the National Natural Science Foundation of China (No. 82101405) and the Natural Science Foundation of Jiangxi Province (No. 20212BAB216023).