
Abstract
Objective
Blood glucose is related to early neurological deterioration in acute ischemic stroke, but multiple mechanisms are involved in early neurological deterioration, such as progressive infarction. This study aimed to determine whether fasting blood glucose (FBG) is an independent predictor of progressive infarction.
Methods
From April 2017 to December 2020, we retrospectively enrolled 477 patients with acute ischemic stroke within 48 hours of onset. Demographic characteristics, clinical information, neuroimaging characteristics, and laboratory data were collected after admission.
Results
We found that 147 (30.8%) patients had progressive infarction. Multiple regression analysis showed that high FBG concentrations (>7.66 mmol/L) were independently associated with progressive infarction. Sex subgroup analysis showed that high FBG concentrations were an independent predictor of progressive infarction in male patients (odds ratio, 2.559; 95% confidence interval, 1.279–5.121). In a receiver operating characteristic curve analysis, FBG concentrations were a predictor of progressive infarction in all cases, especially in male patients. The cutoff value of FBG in all patients and men was 7.155 mmol/L.
Conclusions
FBG is an independent predictor of progressive infarction in patients with acute ischemic stroke within 48 hours of onset, especially in men. Patients with FBG concentrations ≥7.155 mmol/L are more likely to develop progressive infarction.
Keywords
Introduction
Stroke is the main cause of death and disability, and the age when stroke occurs is becoming younger. 1 In China, cerebrovascular disease has become the leading cause of death, and approximately 2 million patients die of cerebrovascular disease each year. 2 Ischemic stroke accounts for approximately 80% of strokes. More than one third of patients with ischemic stroke will develop early neurological deterioration (END) within 24 to 72 hours of onset. 3 END is frequently observed and associated with a poor functional outcome in patients with ischemic stroke. 4
END is defined as an incremental increase in the National Institute of Health Stroke Scale (NIHSS) score by ≥1 point in motor power or ≥2 points in the total score within 7 days after admission. 5 In acute ischemic stroke (AIS), multiple mechanisms contribute to early neurological deterioration, including progressive infarction representing extension of the original infarction, increased intracranial pressure, recurrent cerebral ischemia on behalf of a new stroke, and secondary parenchymal bleeding.3,6
The mechanisms of END are complex. Madsen et al reported that there were sex differences in the occurrence of END in patients with AIS. 7 In the acute phase of cerebral infarction, hyperglycemia occurs in approximately 40% 8 of patients and is associated with poor clinical outcomes, 9 including infarct volume enlargement 10 and hemorrhagic infarct conversion. 11 Higher admission blood glucose concentrations are associated with a worse outcome in patients with AIS at 3 months. 12 Moreover, a study showed that fasting blood glucose (FBG) was positively associated with the risk of stroke. 13 However, to the best of our knowledge, few studies have focused on the association between FBG and progressive infarction. 10
Therefore, this study aimed to assess whether FBG is a predictor of progressive infarction in patients with AIS and to determine whether patients differ by sex.
Methods
Patients
We retrospectively collected data from patients with AIS who were hospitalized in the Stroke Unit of the First Affiliated Hospital of Nanchang University from April 2017 to December 2020. This study was approved by the Ethics Committee of the First Affiliated Hospital of Nanchang University (Medical Research Ethic Rapid Review No. 3-004). Enrolled patients met the following criteria: (1) the patient’s admission to the hospital was within 48 hours of symptom onset; and (2) there was evidence of cerebral infarction on diffusion-weighted imaging (DWI) consistent with the clinical deficit. Patients were excluded from this study if they (1) lacked complete imaging, laboratory, or follow-up data, or (2) had received intravenous thrombolysis or endovascular therapy. We have de-identified all patients’ details. Informed consent of the patients was not required because of the retrospective nature of the study. The reporting of this study conforms to the STROBE guidelines. 14
Clinical characteristics and laboratory parameters
Basic information of the enrolled patients was collected, such as age, sex, a history of hypertension and diabetes, the initial NIHSS score, the discharge NIHSS score, and the modified Rankin Scale (mRS) score at 90 days. The mRS score was assessed through face-to-face interviews or phone calls. Laboratory data of patients were collected within 24 hours of admission. These data included the white blood cell count, red blood cell count, platelet count, prothrombin time, and concentrations of hemoglobin, fibrinogen, D-dimer, blood urea nitrogen, creatinine, uric acid, total cholesterol, triglycerides, high-density lipoprotein cholesterol, low-density lipoprotein cholesterol, and FBG (fasting blood samples were collected within 24 hours of admission).
Evaluation of neuroimaging information
All patients underwent magnetic resonance imaging (MRI) with a 3.0-Tesla scanner (MAGNETOM Trio; Siemens, Erlangen, Germany) within 48 hours of onset. MRI was immediately performed if there was an increase of ≥1 point in motor power or ≥2 points in the total NIHSS score within 7 days after admission. The protocol included T1-weighted imaging, T2-weighted imaging, fluid-attenuated inversion recovery, and DWI. The following parameters were used: repetition time/echo time: 3100/91 ms; field of view: 230 × 230 mm2; 19 slices with a slice thickness of 5 mm; voxel size: 1.2 × 1.2 × 5 mm3; 2b values of 0 and 1000 s/mm2; and scan time: 1.16 minutes. The protocol also included three-dimensional time-of-flight MRA with the following parameters: repetition time/echo time: 22/3.86 ms; field of view: 235 × 235 mm2; voxel size: 0.9 × 0.6 × 0.6 mm3; 2b values of 0 and 1000 s/mm2; and scan time: 3.12 minutes. All images were read and evaluated by two trained neurologists who were blind to the patients’ information. Leukoaraiosis was analyzed with a score of 4, as suggested by Fazekas et al. 15 Ischemic stroke was subtyped using the Trial of Org 10172 In Acute Stroke Treatment criteria. 16
Definition of progressive infarction
Progressive infarction was defined as an incremental increase in the NIHSS score by ≥1 point in motor power or ≥2 points in the total score within 7 days after admission. 5 Extension of the original infarction was further confirmed by DWI.
Statistical analysis
Demographic characteristics were compared using Student’s t test or the Mann–Whitney U test for continuous variables, and the chi-square test or Fisher’s exact test for categorical variables. Categorical data are shown as frequencies and percentages. Continuous data are expressed as the mean ± standard deviation (SD). Variables that were not normally distributed are expressed as the median (interquartile range). A multivariate logistic regression analysis was performed to analyze independent factors of progressive infarction, and the lowest quartile was used as the reference. All patients were divided into quartiles on the basis of FBG concentrations (Q1, <4.895 mmol/L; Q2, 4.895–5.84 mmol/L; Q3, 5.85–7.66 mmol/L; and Q4, >7.66 mmol/L). In addition, logistic regression models were used to analyze the association between FBG concentrations and progressive infarction in male and female subgroups. In the male subgroup, the patients were divided into quartiles on the basis of FGB concentrations (Q1, <4.79 mmol/L; Q2, 4.79–5.695 mmol/L; Q3, 5.696–7.54 mmol/L; and Q4, >7.54 mmol/L). In the female subgroup, the patients were divided into quartiles based on FGB concentrations (Q1, <5.13 mmol/L; Q2, 5.13–6.3 mmol/L; Q3, 6.4–7.96 mmol/L; and Q4, >7.96 mmol/L). A receiver operating characteristic curve was constructed for FBG, and the area under the curve and Youden’s index were calculated to determine critical values. The patients were divided into two groups according to the cutoff value, and the frequencies between the two groups were compared using the chi-square test. All statistical assessments were set at a P < 0.05 level of significance for two-tailed tests. Statistical analysis was performed using IBM SPSS version 26.0 (IBM Corp., Armonk, NY, USA).
Results
From April 2017 to December 2020, 3373 patients with AIS who were admitted within 48 hours of onset were screened according to the inclusion and exclusion criteria (Figure 1). We enrolled 477 eligible patients. The mean age of the patients was 63.68 ± 11.9 years. Table 1 shows the demographic, clinical, laboratory, and imaging characteristics of the patients. A total of 310 (90 with progressive infarction and 220 with non-progressive infarction) patients were men. A total of 147 (30.8%) patients were diagnosed with progressive infarction, and 330 (69.2%) patients did not have progressive infarction (non-progressive infarction). The rate of hypertension and initial NIHSS and discharge NIHSS scores were higher, the prothrombin time and creatinine concentrations were lower, and FBG concentrations were higher in patients with progressive infarction than in those with non-progressive infarction (all P < 0.05). The mRS scores at 3 months after onset were also significantly different between the groups of patients (P <0.001).

Selection of the study participants.
Comparison of baseline characteristics between the progressive infarction and non-progressive infarction groups.

SD, standard deviation; NIHSS, National Institute of Health Stroke Scale; IQR, interquartile range; mRS, modified Rankin Scale; WBCs, white blood cells; RBC, red blood cells; HGB, hemoglobin; PLTs, blood platelets; PT, prothrombin time; BUN, blood urea nitrogen; Cr, creatinine; UA, uric acid; HDL, high-density lipoprotein; LDL, low-density lipoprotein; FBG, fasting blood glucose; TOAST, Trial of Org 10172 In Acute Stroke Treatment; LAA, large artery atherosclerosis; SVO, small vessel occlusion; CE, cardioembolism; UE, undetermined etiology; OE, other etiology.
As shown in Table 2, using the lowest quartile as the reference value, the odds ratios (ORs) for progressive infarction increased with increasing FBG quartiles in all models. A multivariate logistic regression model adjusted for age and sex (model 1) showed that FBG concentrations (>7.66 mmol/L) were independently associated with progressive infarction (P = 0.002; OR, 2.383; 95% CI, 1.361–4.173). After adjusting for significant factors, namely hypertension, the initial NIHSS score, creatinine, and the prothrombin time (model 2), FBG concentrations (>7.66 mmol/L) were also independently associated with progressive infarction (P = 0.01; OR, 2.122; 95% CI, 1.198–3.760). Finally, after adjusting for multiple related confounders, namely hypertension, the initial NIHSS score, creatinine, the prothrombin time triglycerides, and D-dimer (model 3), FBG concentrations (>7.66 mmol/L) remained significantly associated with progressive infarction (P = 0.023; OR, 1.959; 95% CI, 1.097–3.501).
Evaluation of the effect of FBG on progressive infarction using multivariate logistic regression models.

Model 1 was adjusted for age and male sex.Model 2 was adjusted for hypertension, the initial NIHSS score, creatinine, and the prothrombin time.Model 3 was adjusted for hypertension, the initial NIHSS score, creatinine, the prothrombin time, triglycerides, and D-dimer.OR, odds ratio; CI, confidence interval; FBG, fasting blood glucose; Q, quartile; NIHSS, National Institute of Health Stroke Scale.
The male and female subgroup analysis results are shown in Table 3. In male patients, a multivariate logistic regression model adjusted for D-dimer and the prothrombin time showed that FBG concentrations (>7.54 mmol/L) were independently associated with progressive infarction (P = 0.008), but this association was not found in female patients.
Evaluation of the effect of FBG on progressive infarction in sex subgroups using multivariate logistic regression models.
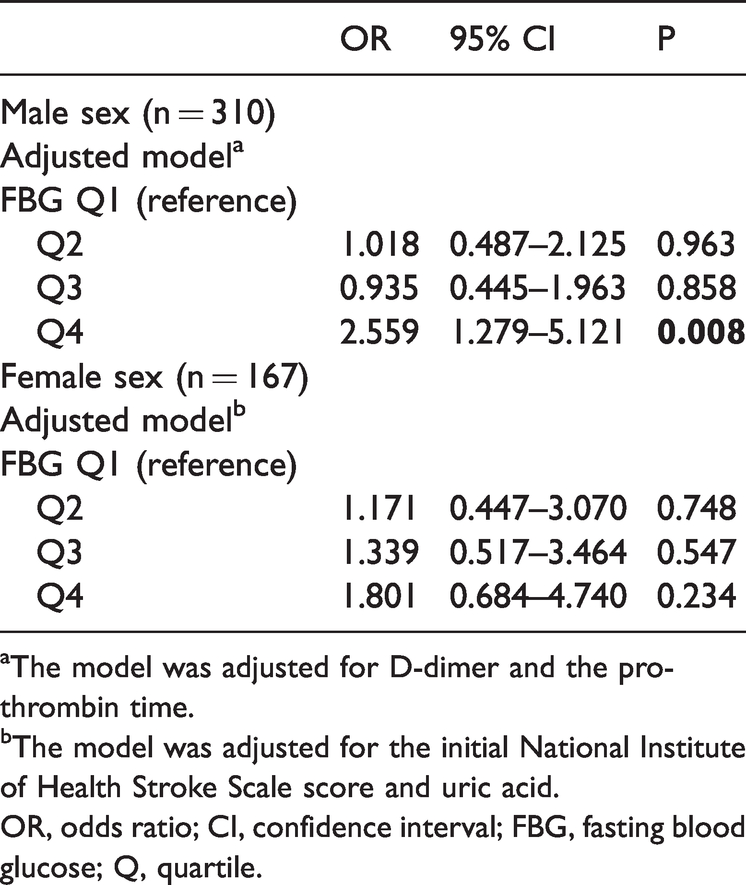
aThe model was adjusted for D-dimer and the prothrombin time.bThe model was adjusted for the initial National Institute of Health Stroke Scale score and uric acid.OR, odds ratio; CI, confidence interval; FBG, fasting blood glucose; Q, quartile.
The receiver operating characteristic curve analysis showed that FBG concentrations were a predictor of progressive infarction in all patients (sensitivity, 41.5%; specificity, 75.5%) and in male patients (sensitivity, 44.4%; specificity, 79.1%), with a cutoff value of 7.155 mmol/L. All patients and male patients were divided into two groups according to the cutoff values. In all patients, the frequency of progressive infarction was 25.7% in patients with FBG concentrations <7.155 mmol/L and 43.0% in patients with FBG concentrations ≥7.155 mmol/L (P < 0.001). Among male patients, the frequency of progressive infarction was 22.3% in patients with FBG concentrations <7.155 mmol/L and 46.5% in patients with FBG concentrations ≥7.155 (P < 0.001).
Discussion
This study showed that FBG concentrations were an independent predictor of progressive infarction within 48 hours after AIS. In all patients, and especially in male patients, patients with FBG concentrations ≥7.155 mmol/L were more likely to develop progressive infarction. The sensitivity and specificity for prediction were 41.5% and 75.5% in all patients, and 44.4% and 79.1% in male patients, respectively.
In AIS, the occurrence of END is a common event and is associated with a poor prognosis. 4 There are many forms of END, including progressive infarction, new infarction, developing edema, elevated intracranial pressure, seizures, hemorrhagic transformation, and others. 3 Weimar et al reported that 33.6% of patients showed END due to progressive infarction, 27.3% to increased intracranial pressure, 11.3% to recurrent infarction, and 10.5% to hemorrhagic transformation. 6 Progressive infarction is the most common type of END. There are various definitions of END because of differences in the study design, the method of neurological assessment, and the source of subjects. In our study, END was defined as an increase of ≥1 point in motor power or ≥2 points in the total NIHSS score within 7 days after admission. 5 However, we enrolled patients with cerebral infarction within 48 hours of onset, and END was attributed to progressive infarction, which was confirmed by MRI. This approach can distinguish progressive infarction from other mechanisms of END and narrows the effect of interrater variability. 6
In AIS, hyperglycemia frequently occurs. 8 Several clinical studies have shown that blood glucose concentrations on admission are associated with a poor prognosis in patients with AIS. 10 The GLycemia in Acute Stroke study suggested that capillary blood glucose concentrations ≥8.6 mmol/L within 48 hours of stroke are associated with a poor prognosis, independent of age, stroke severity, or stroke types. 17 Cao et al found that patients with fasting blood glucose concentrations ≥5.6 mmol/L had a longer hospital stay and increased rates of recurrence and mortality. 18 In our study, FBG concentrations ≥7.155 mmol/L were more likely to lead to progressive infarction in all patients and in men. The mechanism by which hyperglycemia causes progressive infarction is unclear, but the potential mechanisms include endothelial injury, increased oxidative stress, lactate product accumulation, and blood–brain barrier damage.19–23 In addition to hyperglycemia and hypoglycemia, blood glucose variability, a manifestation of blood glucose dysfunction, was reported to be associated with END, and the pathophysiological mechanism may involve endothelial dysfunction and oxidative stress. 24 Future studies need to investigate the pathophysiological mechanism of blood glucose-induced END. Our study suggests that fasting blood glucose concentrations within 48 hours of the onset of acute ischemic infarction can predict progressive infarction. Therefore, early aggressive control of fasting glucose concentrations may reduce END in patients with AIS.
Multiple factors are involved in END after AIS, including glucose concentrations, blood pressure, the presence of atrial fibrillation, previous statin therapy, stroke severity, the type of acute therapy performed, severe neurological complications, white blood cell levels, and genetic factors. 25 Madsen et al found that the association between FBG concentrations and the ischemic stroke risk varied by sex and race. 7 Sui et al found that fasting blood glucose concentrations were associated with a higher risk of fatal, nonfatal, or total stroke events in asymptomatic men. 26 In our study, there was no significant difference in sex between the progressive infarction and non-progressive infarction groups. In a sex subgroup analysis, FBG concentrations were an independent predictor of infarct progression in AIS within 48 hours of onset in male patients. This finding has important clinical implications. In patients with AIS within 48 hours of onset, especially in men, FBG concentrations should be closely monitored to prevent progressive infarction.
There are some limitations to our study. First, this was a single-center study in China, and the results are not representative of all populations. Although we found that patients with FBG concentrations ≥7.155 mmol/L within 48 hours of AIS were more prone to developing progressive infarction, especially in men, this was an observational study. Additionally, the dose–response association between fasting blood glucose concentrations and progressive infarction is unclear. Further clinical studies are required to confirm these findings.
Conclusion
This study shows that FBG is an independent predictor of progressive infarction in patients with AIS within 48 hours of onset, especially in men. Patients with FBG concentrations ≥7.155 mmol/L are more likely to develop progressive infarction.
Footnotes
Author contributions
Concept and design: QY, XM, DH, and JL; acquisition, analysis or interpretation of data: ZF, SL, QH, QC, ShL, JZ, and PF; drafting of the manuscript: QY and XM; critical revision of the manuscript for important intellectual content: DH and JL; statistical analysis: YQ and YW; obtaining funding: JL and DH. All authors have read and approved the final manuscript.
Data availability statement
Data are available upon reasonable request. All data are available from the corresponding author.
Declaration of conflicting interest
The authors declare that there is no conflict of interest.
Funding
The authors disclosed receipt of the following financial support for the research, authorship, and/or publication of this article: This study was supported by the National Natural Science Foundation of China for Young Scientists (No. 82101405), the National Natural Science Foundation of China (Nos. 81460199 and 82160252), the Natural Science Foundation of Jiangxi Province for Young Scientists (No. 20212BAB216023), the Science and Technology project of Jiangxi Health Commission (No. 202110028), the Double Thousand Talents Program of Jiangxi Province (No. jxsq2019101021), and the Young Talent Research and Cultivation Fund of the First Affiliated Hospital of Nanchang University (No. YFYPY202012).