
Abstract
Objective
We aimed to investigate trends in residency program application and acceptance rates according to sex and race and ethnicity.
Methods
We collected data from the Journal of the American Medical Association Graduation Medical Education Reports. We extracted the data for 25 residency programs in the United States from 2005 to 2021 and conducted statistical analyses.
Results
Men were most matched for orthopedics (84.7%, 95% confidence interval [CI] 84.2%–85.1%), and women for oncology (78.7%, 95% CI 78.2%–79.2%). The most matched program was orthopedics for the White subgroup (43.5%, 95% CI 43.2%–43.9%), radiology for the Black subgroup (20%, 95% CI 18.9%–20.9%), general surgery for the Hispanic subgroup (11%, 95% CI 10.7%–11.2%), and internal medicine for the Asian subgroup (35.3%, 95% CI 34.9%–35.6%).
Conclusion
Match rates for women were lower than those for men in all programs except psychiatry, pediatrics, obstetrics and gynecology, and dermatology. Match rates were significantly lower for Black, Hispanic, and Asian subgroups than the White subgroup in all programs except for internal medicine, with the Asian subgroup being higher. We observed a significant increase in both application and acceptance rates for women and racial and ethnic minorities over the past 40 years.
Introduction
The level of competition for residency programs following graduation from medical school in the United States (US) continues to rise. Owing to the limited number of available positions, not all US applicants for residency will obtain a position. 1 The medical community is often interested in a comprehensive review of the factors determining an applicant's successful matching among the different residencies. However, there is an underrepresentation of women and minorities in medicine, particularly Hispanics, American Indians, African Americans, and Alaska Natives. There is increasing demand for a health care workforce that includes these underrepresented races and ethnicities. 2 The National Institutes of Health has demonstrated that racial and ethnic diversity among medical trainees and faculty may improve productivity and health care quality, especially for minority patients.3,4
The number of female medical students has risen from 5% in 1961 to 42.4% in 2000. 5 Presently 46% of medical graduates are women. 6 Nevertheless, an imbalance remains between the number of new graduates and the makeup of residents in different specialties. Women account for only 14% of orthopedic surgery residents and 27% of radiology residents.6–8
There are increasing national efforts to increase the diversity and number of underrepresented medical workers in all specialties. In particular, Blacks, Hispanics, and Native Americans currently account for one-third of the US population yet together make up only 9% of medical workers. Despite efforts, the combined proportion of underrepresented minorities in medicine has not shown any substantial increase over the past decade. 8 Moreover, the overall number of Black applicants to medical schools is decreasing, according to the Association of American Medical Colleges. 9
The aim of this study was to investigate and describe current trends in the application and acceptance rates of medical school graduates into residency programs according to sex as well as race and ethnicity.
Methods
Data collection
We obtained our data from the Journal of the American Medical Association Graduation Medical Education Reports (JAMA-GME reports). We extracted the data for residency programs in the US from 2005 to 2021.7,10–25 The extracted data included sex (male and female) and race and ethnicity (white, Black, Asian, and Hispanic). We had initially planned to include data from all 179 different specialty programs included in the JAMA-GME reports. However, after considering the robustness of data and potential for sample bias in specialty programs with a lower volume, we ultimately chose to analyze only the 25 programs with the highest volumes according to total physician matriculation. As a result, we included the following residency programs: allergy and immunology, internal medicine, radiology, oncology, orthopedics, emergency medicine, obstetrics and gynecology (OB-GYN), ophthalmology, pediatrics, plastic surgery, neurosurgery, otolaryngology, urology, family medicine, anesthesiology, colorectal surgery, dermatology, neurology, psychiatry, and pain management medicine.
Data analysis
Statistical analyses were conducted using Stata version 16.0 (StataCorp LLC, College Station, TX, USA). We ultimately used the random-effects model “IVhet method” for head-to-head comparisons. All data were dichotomous (events and no events) and were pooled as weighted proportions and risk ratios (RRs), with relevant 95% confidence intervals (CI). 26 Pooled rates of proportions were calculated using Freeman–Tukey transformation meta-analysis of proportions with MedCalc version 15.0 (MedCalc Software, Ostend, Belgium). Heterogeneity between studies was inspected visually and statistically using chi-square and I2 tests; a Q statistic with P < 0.1 indicated heterogeneity whereas I2 values of 0%, 25%, 50%, and 75% represented no, low, moderate, and high heterogeneity, respectively. 27 Further, meta-regression was conducted to examine changes in the match percentages for each subgroup over time. The PRISMA guidelines were followed throughout the performance of this meta-analysis. 28 In error, we did not prospectively register this study; however, it was registered retrospectively at INPLASY (International Platform of Registered Systematic Review and Meta-analysis Protocols; registration number INPLASY202420108).
Ethics approval and consent to participate
This manuscript was reviewed by the Institutional Review Board (IRB) at Marchand Institute and was found to be exempt from IRB review (May 2023). The data used were exempt from the requirement to obtain consent to participate or publication secondary to the nature of the study being a systematic review, retrospectively examining previously published data.
Results
Search results
As a result of our search, we extracted the reported data for each year in the JAMA-GME reports7,29–31 from 2005 to 2021. Twenty-five medical specialties were reported in the JAMA-GME reports as well as data for sex and race and ethnicity for the applicants in these specialties.
Outcomes
Single arm meta-analysis for subgroups of sex and race and ethnicity
The overall male and female applicants and matched frequency per each program are depicted in Figure 1(a)–1(b) and Supplemental Figure S1. According to the estimates, the programs most applied to were orthopedics for men (86%, 95% CI 85.3%–87.6%) and OB-GYN for women at (80%, 95% CI 77%–84%). Furthermore, the most-matched programs for men were orthopedics (84.7%, 95% CI 84.2%–85.1%) and oncology for women (78.7%, 95% CI 78.2%–79.2%). The pooled analyses were homogenous.

Overall male and female applicants and match frequency per specialty. (a) Overall match frequency per specialty for male applicants and (b) overall match frequency per specialty for female applicants. CI, confidence interval; ENT, ear, nose, throat; OB-GYN, obstetrics and gynecology.
The overall White, Black, Hispanic, and Asian applicants as well as matched frequency per each program are displayed in Figure 2(a)–2(d) and Supplemental Figure S2. According to these estimates, the most matched programs were orthopedics (43.5%, 95% CI 43.2%–43.9%) for the White subgroup, radiology (20%, 95% CI 18.9%–20.9%) for the Black subgroup, general surgery for the Hispanic subgroup (11%, 95% CI 10.7%–11.2%) and internal medicine for the Asian subgroup (35.3%, 95% CI 34.9%–35.6%). The pooled analyses were homogenous.

Overall match frequency by applicant race and ethnicity per specialty. (a) Overall match frequency per specialty by applicant race and ethnicity for White subgroup. (b) Overall match frequency per specialty by applicant race and ethnicity for Black subgroup. (c) Overall match frequency per specialty by applicant race and ethnicity for Hispanic subgroup and (d) overall match frequency per specialty by applicant race and ethnicity for Asian subgroup. CI, confidence interval; ENT, ear, nose, throat; OB-GYN, obstetrics and gynecology; RR, risk ratio.
Head-to-head meta-analysis for subgroups of sex and race and ethnicity
The match rates were significantly lower for women than men in all programs except psychiatry (RR = 1.23), pediatrics (RR = 1.90), OB-GYN (RR = 1.94), and dermatology (RR = 1.99) (Figure 3(a)). Likewise, the match rates were significantly lower for the Black, Hispanic, and Asian subgroups than the White subgroup in all programs except internal medicine in the Asian subgroup (RR = 1) (Figure 3(b)–3(d)). The pooled analyses were homogenous.
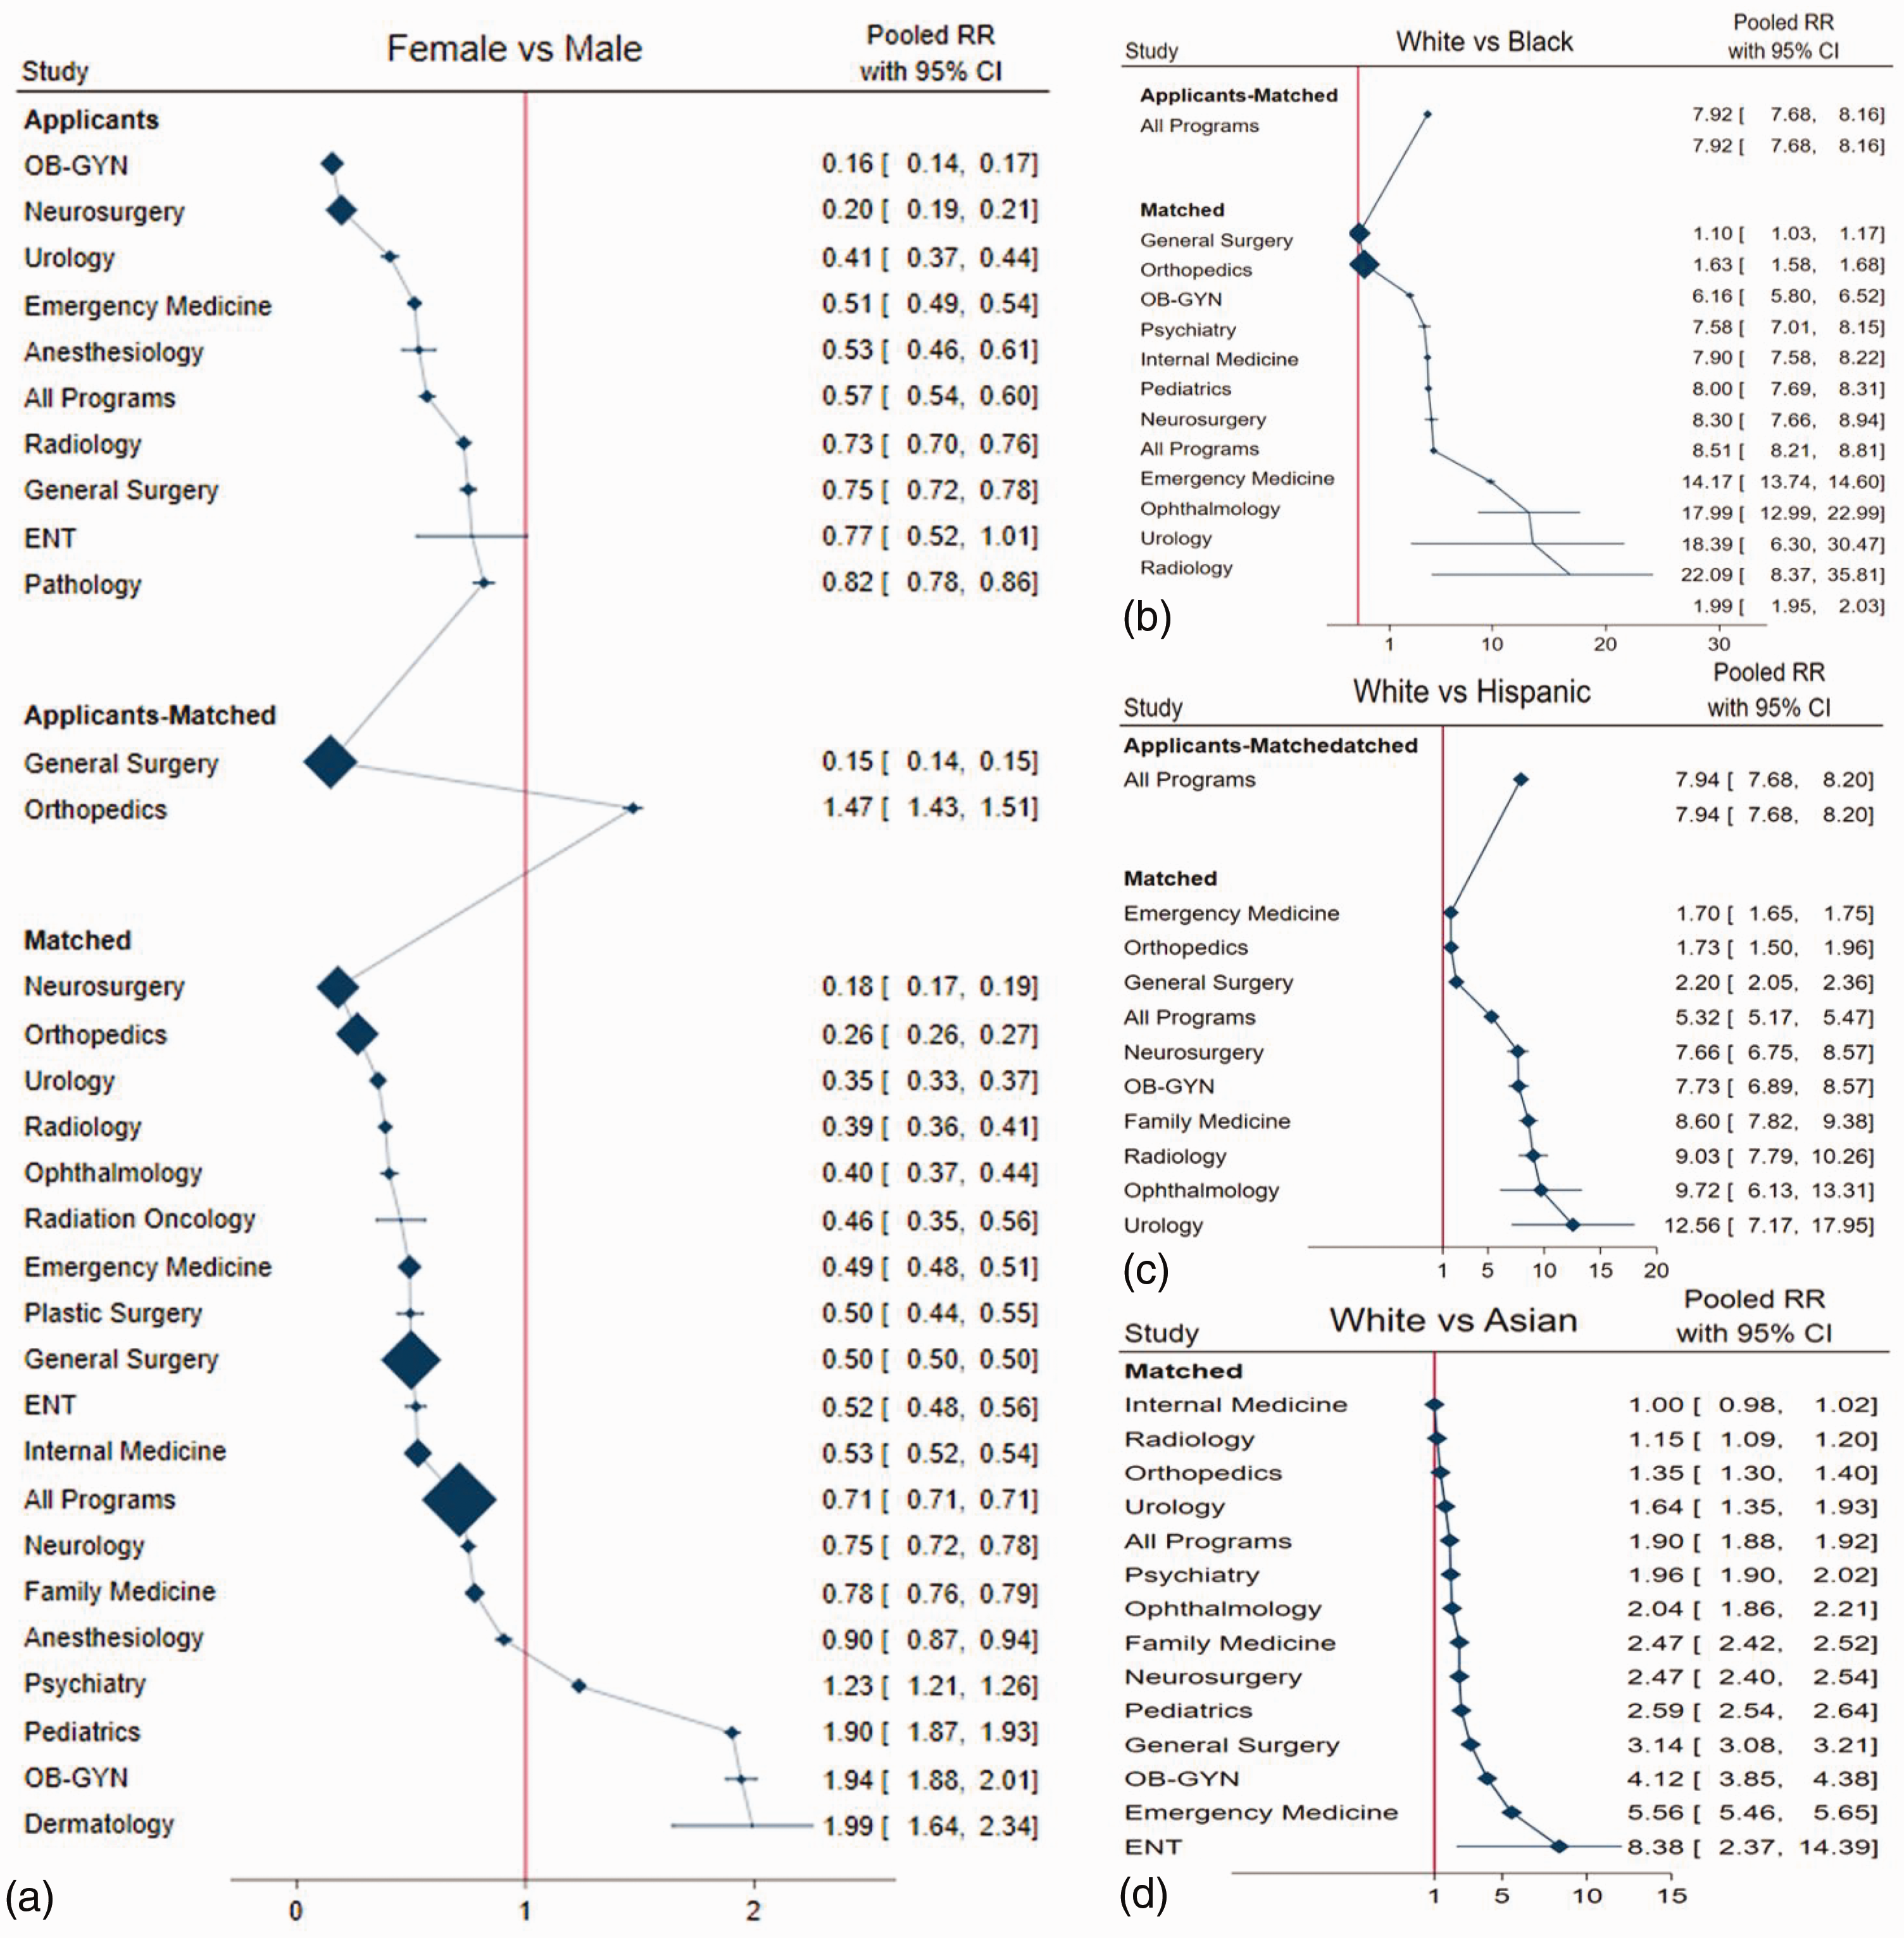
Head-to-head meta-analysis for subgroups of sex and race and ethnicity. (a) Head-to-head meta-analysis for sex and for race and ethnicity in male versus female subgroups. (b) Head-to-head meta-analysis for sex and for race and ethnicity in White versus Black subgroups. (c) Head-to-head meta-analysis for sex and for race and ethnicity in White versus Hispanic subgroups and (d) head-to-head meta-analysis for sex and for race and ethnicity in White versus Asian subgroups. CI, confidence interval; ENT, ear, nose, throat; OB-GYN, obstetrics and gynecology.
Meta-regression for match rates according to subgroups of sex and race and ethnicity over 40 years
Results from meta-regression revealed a significant increase the match rate for women (Coef. = 0.005, P = 0.002) compared with men (Coef. = −0.003, P = 0.1) (Figure 4(a)–4(b)). Likewise, the match rates for the White subgroup decreased significantly (Coef. = −0.008, P = 0.04) over the past 40 years compared with the Black, Hispanic, and Asian subgroups (Figure 4(c)–4(f)). However, the R-squared estimates were not significant, meaning that the current data cannot be considered to accurately predict this increase or decrease in the following years.

Meta-regression for match rates according to subgroups of sex and race and ethnicity over 40 years. (a) Meta-regression for matching rates over 40 years by sex and by race and ethnicity in the male subgroup. (b) Meta-regression for matching rates over 40 years by sex and by race and ethnicity in the female subgroup. (c) Meta-regression for matching rates over 40 years by sex and by race and ethnicity in the White subgroup. (d) Meta-regression for matching rates over 40 years by sex and by race and ethnicity in the Asian subgroup. (e) Meta-regression for matching rates over 40 years by sex and by race and ethnicity in the Black subgroup and (f) meta-regression for matching rates over 40 years by sex and by race and ethnicity in the Hispanic subgroup
Discussion
We found that orthopedics was the most sought-after residency program among men and that OB-GYN was preferred by female applicants. Furthermore, the most matched programs were orthopedics for men and oncology for women. Regarding race and ethnicity, the most matched programs for the White subgroup were orthopedics, radiology for the Black subgroup, general surgery for the Hispanic subgroup, and internal medicine for the Asian subgroup.
Importantly, we noted the presence of bias against women and racial minorities. Our analysis revealed that the match rates were significantly lower for women than men in all programs except psychiatry, pediatrics, OB-GYN, and dermatology. Likewise, the match rates were significantly lower for Black, Hispanic, and Asian subgroups than the White subgroup in all programs except for internal medicine in the Asian subgroup.
Trend analysis over the study years revealed a significant increase in match rates for women compared with those for men. Likewise, the match rates for the White subgroup have decreased significantly over the past 40 years in comparison with those for the Black, Hispanic, and Asian subgroups. However, the current data cannot provide accurate predictions regarding an increase or decrease in future years.
Currently, women generally make up nearly half of medical students and half of the medical workforce in the US. 6 Between 1990 and 2019, there were 1,089,892 female faculty members in academic departments at medical institutions in the US out of 3,146,342 (34.6%). Since 2019, women have comprised more than 50% of the clinical workforce in academic departments. 32 Additionally, it has been reported that female representation increased by 13.27% compared with +14.77% for men from 2007 to 2021, especially in pediatric residency programs. 33 Similarly, pediatricians in the US now comprise 63% women.34,35
In contrast to those reports, studies conducted on residency programs such as orthopedics continue to report an underrepresentation of women within their workforce.36–38 As of 2022, it was reported that several orthopedic surgery programs have no female residents at all. 39 A study by Rajani et al. 40 found that women receive less training in some surgical residency programs than their male counterparts. This was found to be especially true in neurosurgery, otolaryngology, plastic surgery, general surgery, urology, and orthopedic surgery.
It is widely held that it is most appropriate for a health care workforce to be representative of the characteristics regarding sex and race and ethnicity of the community it serves. 41 Diversity among health care providers comes with the important benefits of better understanding and meeting the needs of diverse populations as well as providing more culturally sensitive care. 41 Many studies have discussed the importance of diversity and have proposed antiracism measures beyond diversity.42–45 Despite this, Black medical students and trainees are still underrepresented in the medical workforce.46–48 Moreover, those who succeed in enrolling in medical school still have trouble in nearly all aspects of their assessment, which affects their professional opportunities, including but not limited to the ability to be promoted at work or selected for leading positions.49–57 Strategies for the improvement of diversity and what diversity specifically entails in the US health care system is clearly a critical topic, but this falls well beyond the scope of this paper. Also outside the scope of this paper is investigation of the underlying factors contributing to these inequalities. Which barriers prevent progress should the topic of future research in this area.
Regarding other racial minorities, Rajani et al. 40 found significant inequality in the racial and ethnic distribution among surgical specialties. Compared with other surgical subspecialties, orthopedic surgery showed the lowest representation of racial minorities. 40 Additionally, Saboor et al 33 investigated the sex and racial and ethnic profiles of pediatric residents from 2011 to 2021. Those authors noted a large increase in the Asian (Pacific Islander) group by +58.42%, followed by Black (non-Hispanic) +45.24%, White (non-Hispanic) +43.37%, and Hispanic +42.18% groups. They also reported a relative decrease of 50% for the American Indian/Alaska Native population during this same time period.
It has been reported that not all Asian subpopulations are underrepresented. 58 Southern and Eastern Asians are considered to be overrepresented. However, some Asian subgroups such as Filipinos, Vietnamese, and Cambodians continue to be underrepresented. 58 This points to the need for more detailed studies of racial trends to better understand the factors affecting these specific subgroups.
As for the geographic distribution of residents across US regions, Rajani et al 40 looked at geographic differences regarding the minority distribution among orthopedic residents during the academic year 2013–2014. They found that the distribution of women varied according to geographic region. The highest female representation was found in the west and northeast parts of the country, as compared with the lowest female representation found in the south. A similar pattern was observed regarding the racial and ethnic distribution in that minorities were commonly represented in programs in the western and northeastern US. In contrast, programs in the southern US had an underrepresentation of racial and ethnic minorities, despite these programs having relatively strong representation of Blacks. 40
Our study highlights some strong points. The most important strength of this study is the homogeneity of the pooled data analyses, despite the high variation in the number of residencies and applicants. Moreover, we analyzed data from a large sample (1,277,052 residents), which supports the evidence provided in our results. Additionally, we included nearly all studies from various databases investigating the presence of bias with respect to sex or race and ethnicity over the past 40 years. Our analysis included nearly all residency programs in the US. We also stratified residency programs according to which had the most bias.
Limitations
The number of residents applying to residency programs varied significantly among specialties. Moreover, the number of offered programs varied over the years. This variation in the number of residencies and applicants did not allow us to conduct an accurate meta-regression. Additionally, the data regarding race and ethnicity depend on self-reporting by the applicants themselves. Finally most studies did not include an explanation regarding the underrepresentation of minorities in most specialties.
Conclusion
Orthopedic residency programs had the most male applicants and OB-GYN programs had the most female applicant. The most matched program for men was orthopedics and that for women was oncology. As for the distribution by race and ethnicity, orthopedic surgery was the most White-predominant specialty. Radiology, general surgery, and internal medicine were predominated by Black, Hispanic, and Asian subgroups, respectively.
The match rates among women were lower than those among men in all residency programs except psychiatry, pediatrics, OB-GYN, and dermatology. Similarly, the match rates were significantly lower for Black, Hispanic, and Asian subgroups than the White subgroup in all programs except internal medicine in the Asian subgroup.
We observed a significant increase in sex and racial and ethnic minorities over the past 40 years. However, the current data cannot be relied on to produce accurate predictions regarding this increase or decrease in the coming years.
Supplemental Material
sj-pdf-1-imr-10.1177_03000605241244993 - Supplemental material for Meta-analysis of residency program application and acceptance according to sex, race and ethnicity
Supplemental material, sj-pdf-1-imr-10.1177_03000605241244993 for Meta-analysis of residency program application and acceptance according to sex, race and ethnicity by Greg Marchand, Amanda Arroyo, Carmen Moir, Madison Blanco, Daniela Gonzalez Herrera, Brooke Hamilton, Kate Ruffley, Mary Petersen, Sarena Fernandez and Hollie Ulibarri in Journal of International Medical Research
Footnotes
Acknowledgements
The Marchand Institute for Minimally Invasive Surgery would like to acknowledge the efforts of all the students, researchers, residents, and fellows at the institute who put their time and effort into these projects without compensation, for the betterment of women’s health. We firmly assure them that the future of medicine belongs to them.
Authors’ contributions
All authors attest to making substantial contributions to this work.
Data availability statement
All data used in creating this paper are available from the authors upon reasonable request.
Declaration of conflicting interests
The authors declare that there is no conflict of interest.
Funding
This research received no specific grant from any funding agency in the public, commercial, or not-for-profit sectors.
Supplementary material
Supplemental material for this article is available online.
Supplementary material
Supplemental material for this article is available online.
References
Supplementary Material
Please find the following supplemental material available below.
For Open Access articles published under a Creative Commons License, all supplemental material carries the same license as the article it is associated with.
For non-Open Access articles published, all supplemental material carries a non-exclusive license, and permission requests for re-use of supplemental material or any part of supplemental material shall be sent directly to the copyright owner as specified in the copyright notice associated with the article.