
Abstract
Objective
We identified predictive factors and developed a novel machine learning (ML) model for predicting mortality risk in patients with sepsis-associated encephalopathy (SAE).
Methods
In this retrospective cohort study, data from the Medical Information Mart for Intensive Care IV (MIMIC-IV) and eICU Collaborative Research Database were used for model development and external validation. The primary outcome was the in-hospital mortality rate among patients with SAE; the observed in-hospital mortality rate was 14.74% (MIMIC IV: 1112, eICU: 594). Using the least absolute shrinkage and selection operator (LASSO), we built nine ML models and a stacking ensemble model and determined the optimal model based on the area under the receiver operating characteristic curve (AUC). We used the Shapley additive explanations (SHAP) algorithm to determine the optimal model.
Results
The study included 9943 patients. LASSO identified 15 variables. The stacking ensemble model achieved the highest AUC on the test set (0.807) and 0.671 on external validation. SHAP analysis highlighted Glasgow Coma Scale (GCS) and age as key variables. The model (https://sic1.shinyapps.io/SSAAEE/) can predict in-hospital mortality risk for patients with SAE.
Conclusions
We developed a stacked ensemble model with enhanced generalization capabilities using novel data to predict mortality risk in patients with SAE.
Keywords
Introduction
Sepsis-associated encephalopathy (SAE) refers to a series of neurological symptoms observed in patients with sepsis, resulting from systemic inflammatory responses leading to abnormal central nervous system function. In SAE, clinical or standard laboratory examinations do not reveal direct evidence of central nervous system infection, structural abnormalities, or other types of brain diseases, such as hepatic encephalopathy. 1 Brain involvement is considered a consequence of sepsis progressing to a severe stage. 2 The pathological mechanisms of SAE remain unclear, potentially involving alterations in cerebral microcirculation, dysfunction of the blood–brain barrier, mitochondrial impairment, neurotransmitter dysfunction, or involvement of inflammatory mediators and the complement system, among others. 3 SAE is the most prevalent type of neurological disorder in the intensive care unit (ICU), with over 50% of patients with sepsis experiencing encephalopathy.2,4 Despite being a highly prevalent condition, definitive therapeutic approaches to treatment are lacking for SAE, which is characterized by a high mortality rate and poor prognosis. Early identification and management of patients with SAE at risk of death are crucial for averting severe complications and reducing mortality rates. 5
To provide an exclusionary diagnosis for SAE, it is necessary to rule out pre-existing conditions such as chronic liver or renal failure, severe electrolyte imbalance, blood glucose disturbance, central nervous system infection, or pre-existing central nervous system diseases because specific biomarkers are lacking. 6 Thus, the diagnosis of SAE is relatively challenging. 7 As previously reported, Sequential Organ Failure Assessment (SOFA) and quick SOFA scores have been widely used as prognostic tools for sepsis and treatment of other infections in clinical practice.8,9 However, these still have limitations in terms of discriminative power and predictive accuracy. 10 Currently, there is a lack of mature tools or methods to assess the mortality risk in patients with SAE. Therefore, it is imperative to establish a novel model for the effective and accurate prediction of SAE outcomes.
In recent years, the healthcare industry has increasingly incorporated machine learning (ML) into various clinical scenarios, particularly for predicting outcomes in critically ill patients.11–13 The application of ML in the medical field using extensive datasets and predictive models enables clinical practitioners to approach challenges in patient care with increased assurance. 14 The aim of this study was to establish and validate ML models for predicting in-hospital mortality among patients with SAE.
Methods
Data source
We collected pertinent data from the Medical Information Mart for Intensive Care IV (MIMIC-IV) database and eICU Collaborative Research Database for development and validation of the model. Data from MIMIC-IV originated from patients admitted to the ICU at Beth Israel Deaconess Medical Center, affiliated with Harvard Medical School in Boston, Massachusetts, USA, spanning the years 2008 to 2019. The eICU Collaborative Research Database is a multicenter database comprising anonymized health data from over 200,000 ICU admissions across the United States. The temporal scope of the data spans from 2014 to 2015. A researcher on our team successfully completed the Institutional Review Board (IRB) examination regarding the protection of human research participants (ID number 50618389) and obtained access credentials for these two databases. The MIMIC-IV database (version 1.0) is publicly accessible at https://physionet.org/content/mimiciv/1.0/. The eICU database is openly accessible at https://eICU-crd.mit.edu/about/eICU/.
All patient details have been de-identified to maintain confidentiality and privacy. The data presented in this study have undergone a thorough de-identification process to prevent any form of patient identification. The study protocol received approval from the Collaborative Institutional Training Initiative (CITI Program) Ethics Review Committee. The affiliated institution is the Massachusetts Institute of Technology Affiliates (ID: 1912); the approval number is 50618389, and the study approval was granted on 12 August 2022. Written informed consent for participation was not required for this study. The study complies with the Transparent Reporting of a multivariable prediction model for Individual Prognosis Or Diagnosis (TRIPOD) guidelines. 15 This study was conducted in accordance with the principles of the 2013 Helsinki Declaration.
Study population
According to past references, we defined SAE as sepsis occurring upon admission to the ICU, accompanied by Glasgow Coma Scale (GCS) score <15, or delirium (International Classification of Diseases [ICD] codes 2930, 2931), or cognitive impairment (ICD codes 33183, G3184). 16 We excluded patients with delirium caused by alcohol dependence, drug dependence, and other primary neurological disorders.
The inclusion criteria were (1) patients conforming to the diagnostic criteria of Sepsis-3; 17 (2) those who met the definition of SAE; (3) age ≥18 years; (4) first hospitalization and initial admission to the ICU; (5) ICU stay >24 hours. The exclusion criteria were: (1) primary brain injury (such as head trauma, intracranial bleeding, cerebral contusion, skull fractures, cerebral embolism, ischemic stroke, epilepsy, intracranial infection, and other cerebrovascular diseases); (2) psychiatric disorders; (3) substance abuse, drug dependency, or alcohol dependence; (4) conditions affecting consciousness including hepatic coma, hypoglycemic coma, or hypertensive encephalopathy; (6) severe electrolyte disturbances or glucose abnormalities, including hyponatremia (<120 mmol/L), hyperglycemia (>180 mg/dL), or hypoglycemia (<54 mg/dL), as shown in the Supplementary materials.
Data collection and results
This study was a retrospective cohort investigation involving data collection across several dimensions: (1) demographic characteristics including age and sex; (2) antibiotic treatment; (3) vital signs on the first day including heart rate, respiratory rate, mean blood pressure, temperature, and arterial oxygen saturation (SpO2); (4) scale scores on the first day in the ICU including SOFA score, systemic inflammatory response syndrome (SIRS) score, and GCS; (5) laboratory test results on the first day in the ICU including hematocrit, hemoglobin, platelets, white blood cells (WBC), anion gap, bicarbonate, blood urea nitrogen (BUN), calcium, glucose, chloride, creatinine, sodium, potassium, absolute (Abs) basophils, Abs eosinophils, Abs lymphocytes, Abs monocytes, Abs neutrophils, international normalized ratio (INR), prothrombin time, and partial thromboplastin time (PTT); (6) complications including myocardial infarction, congestive heart failure, chronic pulmonary disease, diabetes, hypertension, and septic shock; and (7) ICU length of stay. We used laboratory test results and blood biomarker levels measured within the first day of ICU admission. In cases where multiple measurements were taken on the initial day, we considered the minimum value for each indicator. The primary outcome event for this study was in-hospital mortality among patients with SAE.
Statistical analysis
We used multiple imputation to fill in missing values for the variables. Continuous variables were subjected to the Kolmogorov–Smirnov test to assess the distribution of the data. Parametric continuous variables were assessed using t-tests and are presented as mean and standard deviation. Non-parametric continuous variables were evaluated with the Mann–Whitney U test and are expressed as median with the interquartile range (IQR). Categorical variables are presented as number (percentage) and were assessed using the χ2 test or Fisher’s exact test. All statistical tests were two-tailed. A significance level of P < 0.05 was considered statistically significant. Statistical analysis was performed using IBM SPSS 27.0 software (IBM Corp., Armonk, NY, USA). ML models were developed and validated using R software version 4.3.0 (www.r-project.org).
Feature selection
We used the least absolute shrinkage and selection operator (LASSO) for feature selection. LASSO is a regularization method frequently applied in linear regression and classification, incorporating an L1 regularization term in the loss function to automatically select features that exert a significant impact on the target variable. 18 LASSO can mitigate overfitting to noise in the training set, thereby enhancing the model’s generalization capability and interpretability. 19
Model development and validation
We used nine different ML algorithms as well as the stacking ensemble model algorithm. Using the stacking ensemble model, we selected the three top-performing models (elastic net [ENet] + support vector machine [SVM] + extreme gradient boosting [XGBoost]) from the pool of nine ML models and combined them into a meta-model for the computations. We ultimately developed 10 ML models: logistic regression (LR), decision tree (DT), ENet, K-nearest neighbor, light gradient boosting machine (LightGBM), random forest (RF), XGBoost, SVM, multi-layer perceptron, and the stacking ensemble model. The “initial_split” function was used to randomly partition the dataset into training and testing sets in a 7:3 ratio. We conducted five-fold cross-validation and applied Bayesian optimization for hyperparameter tuning, which proved effective in reducing overfitting. To gain a more comprehensive understanding of the performance of the 10 models, we also measured their accuracy, sensitivity, specificity, recall, and F1 score. The optimal model was selected by comparing the area under the receiver operating characteristic (ROC) curve (AUC). We also generated ROC curves, clinical decision curve analysis (DCA) curves, and calibration curves to visualize the performance of the models. Finally, the Shapley additive explanations (SHAP) algorithm was adopted to quantify the contribution of each feature to the predictions made by the optimal model. An analysis of two cases was simultaneously conducted so as to interpret the results generated by the model output. We also developed a web-based tool. The optimal model was to be deployed on a Shiny web page for public access.
For comprehensive assessment of performance of the ML model, we conducted a comparison of its predictive capability with that of the SOFA and SIRS scores, which are currently prevalent in mortality assessment among patients with SAE. We used ROC curves as a comparative tool to quantify the differences in performance of the ML models relative to SOFA and SIRS scores.
Results
Baseline characteristics
We included 6551 patients with SAE from the MIMIC-IV database, among whom 1112 were deceased. We enrolled 3392 patients with SAE from the eICU database (Supplementary Table 1). The flowchart of the case screening process is depicted in Figure 1. Patients’ baseline characteristics are presented in Table 1. Among included patients, the median age was 70 years (IQR, 58–81 years), and 3589 individuals (54.79%) were men. Hypertension was the most common comorbidity (2816 cases, 42.99%), followed by congestive heart failure (2129 cases, 32.50%). The results of differential analysis between the survival and death groups indicated that for age, SOFA score, SIRS score, GCS score, heart rate, SBP, DBP, mean blood pressure, respiratory rate, temperature, SpO2, hemoglobin, WBC, anion gap, bicarbonate, BUN, calcium, chloride, creatinine, glucose, potassium, Abs basophils, Abs eosinophils, Abs lymphocytes, INR, PT, PTT, myocardial infarction, congestive heart failure, hypertension, septic shock, antibiotic treatment, and LOS were all P < 0.001, indicating statistically significant differences.
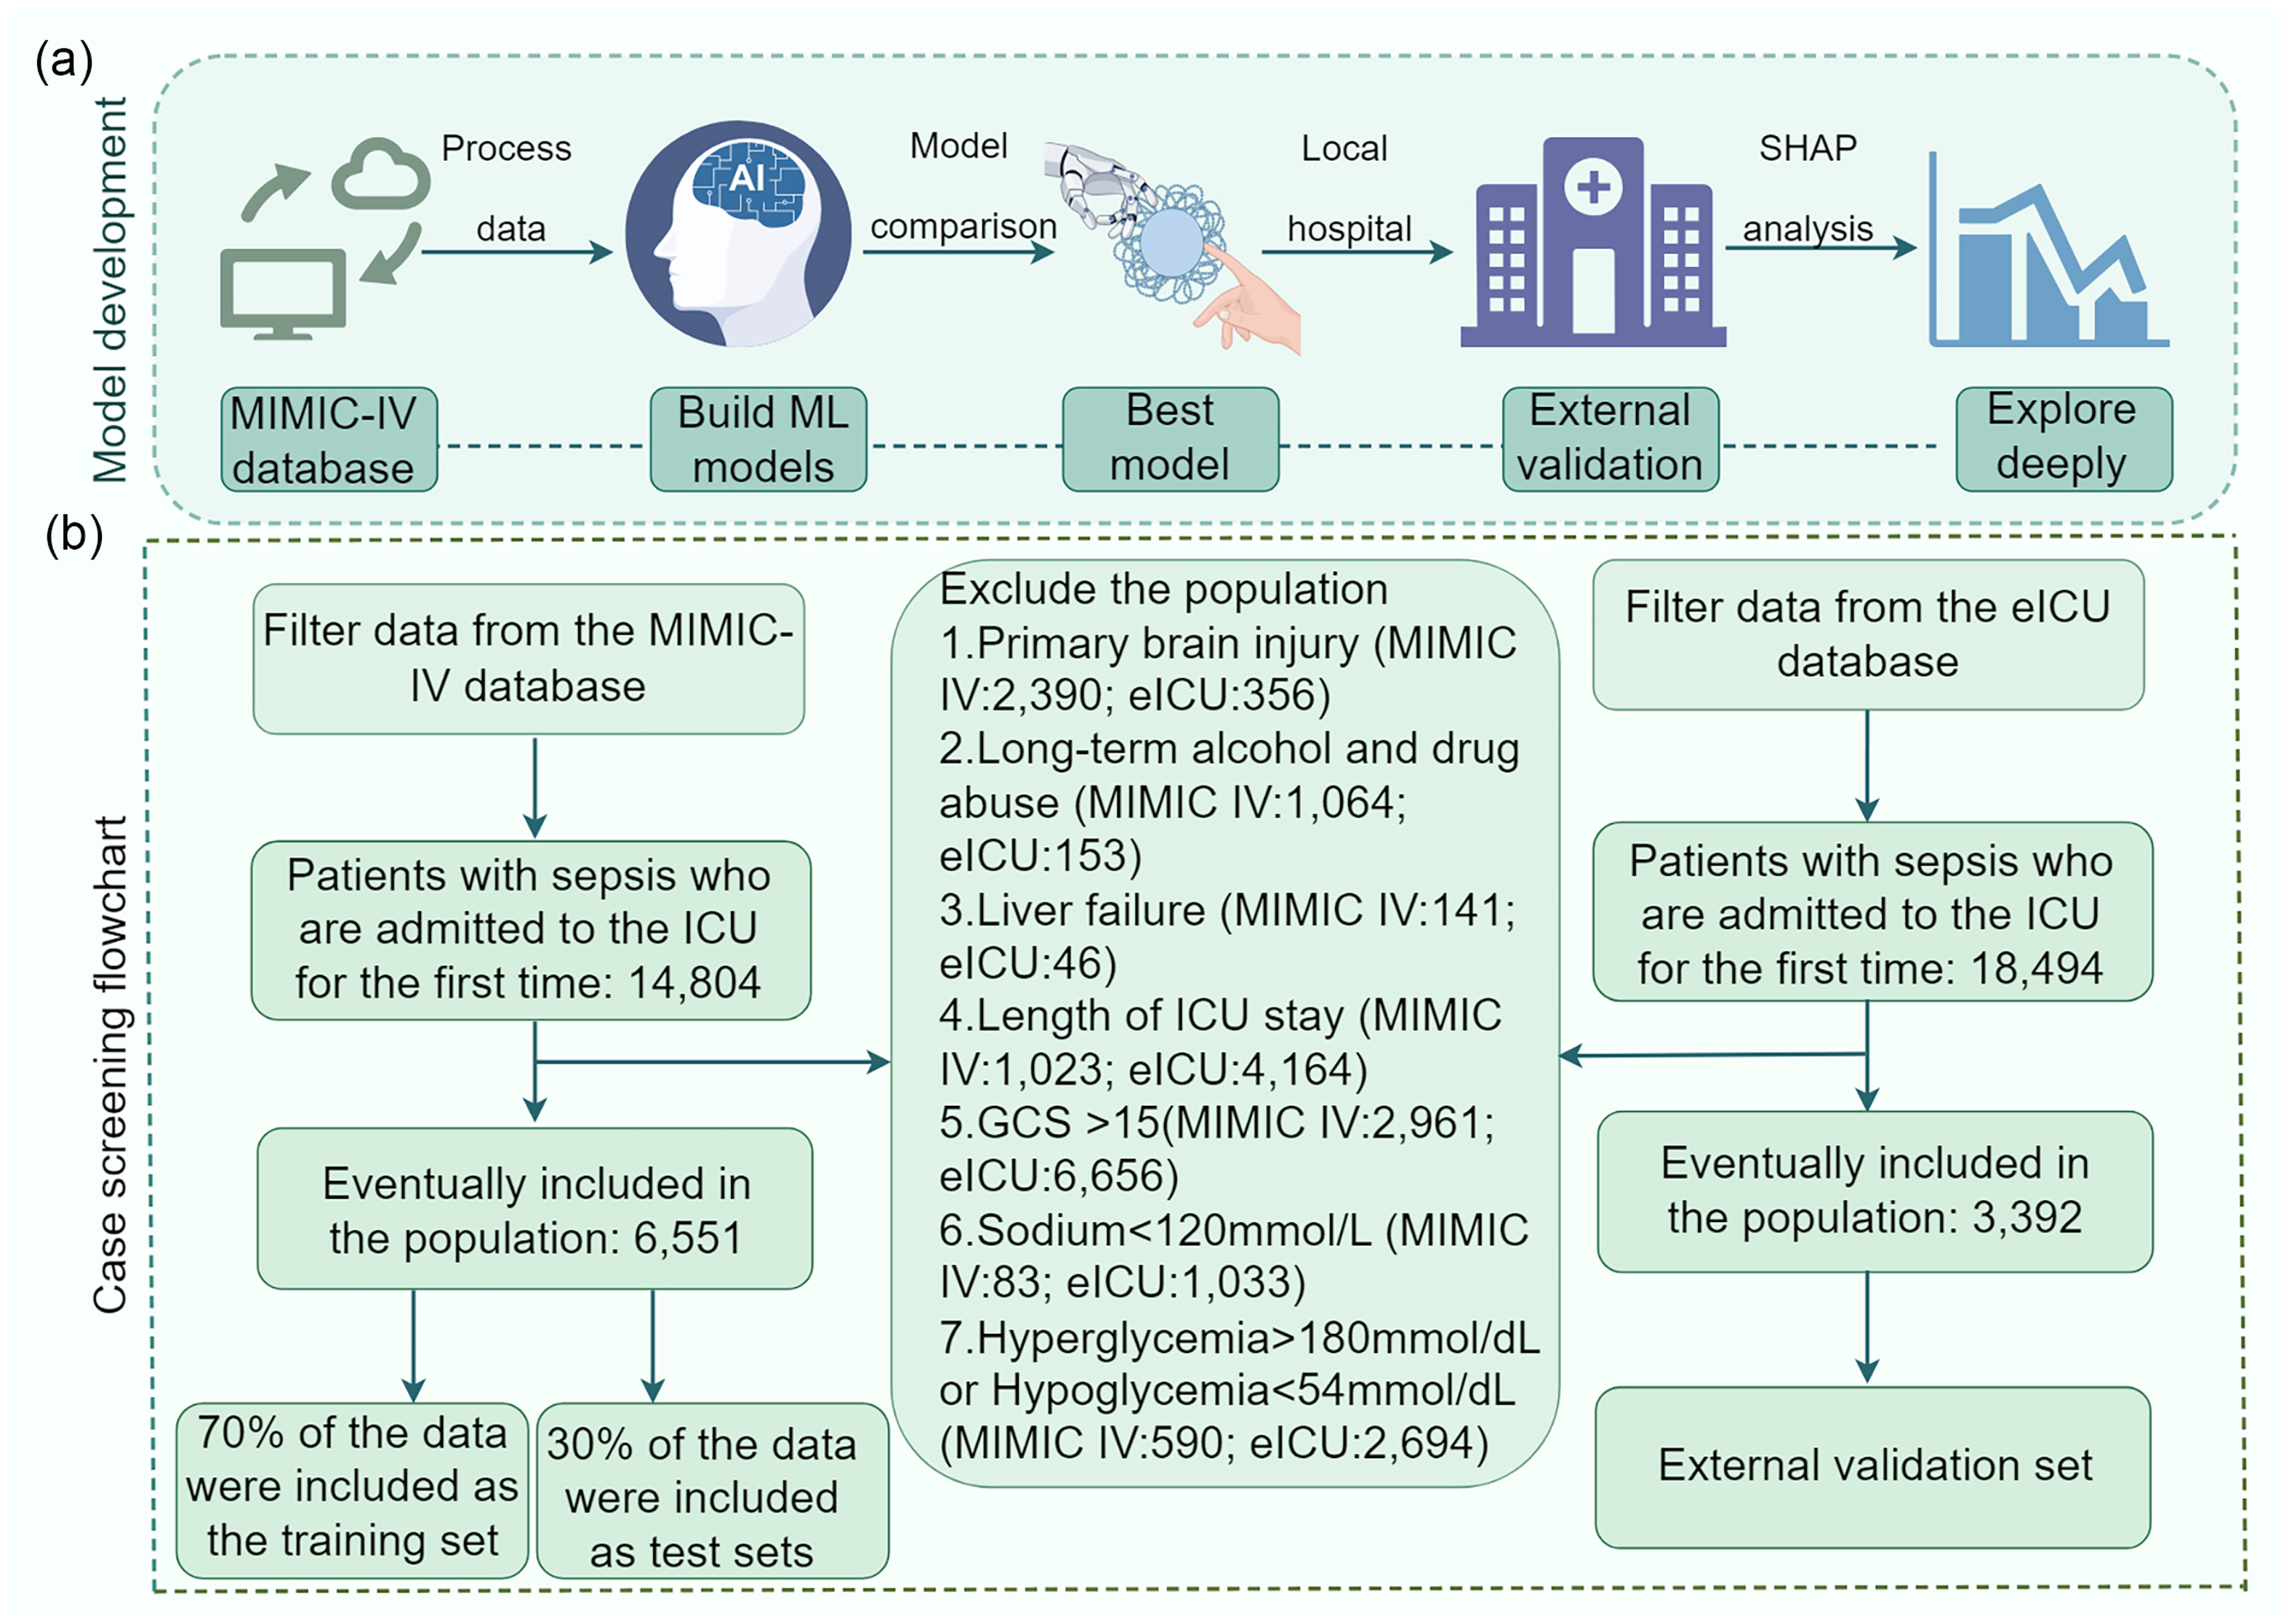
Study flowchart. (a) Model construction workflow diagram and (b) case screening process flowchart. MIMIC-IV, Medical Information Mart for Intensive Care IV; eICU, eICU Collaborative Research Database; ICU, intensive care unit; GCS, Glasgow Coma Scale; SHAP, Shapley additive explanations; ML, machine learning.
Baseline characteristics of patients with SAE.
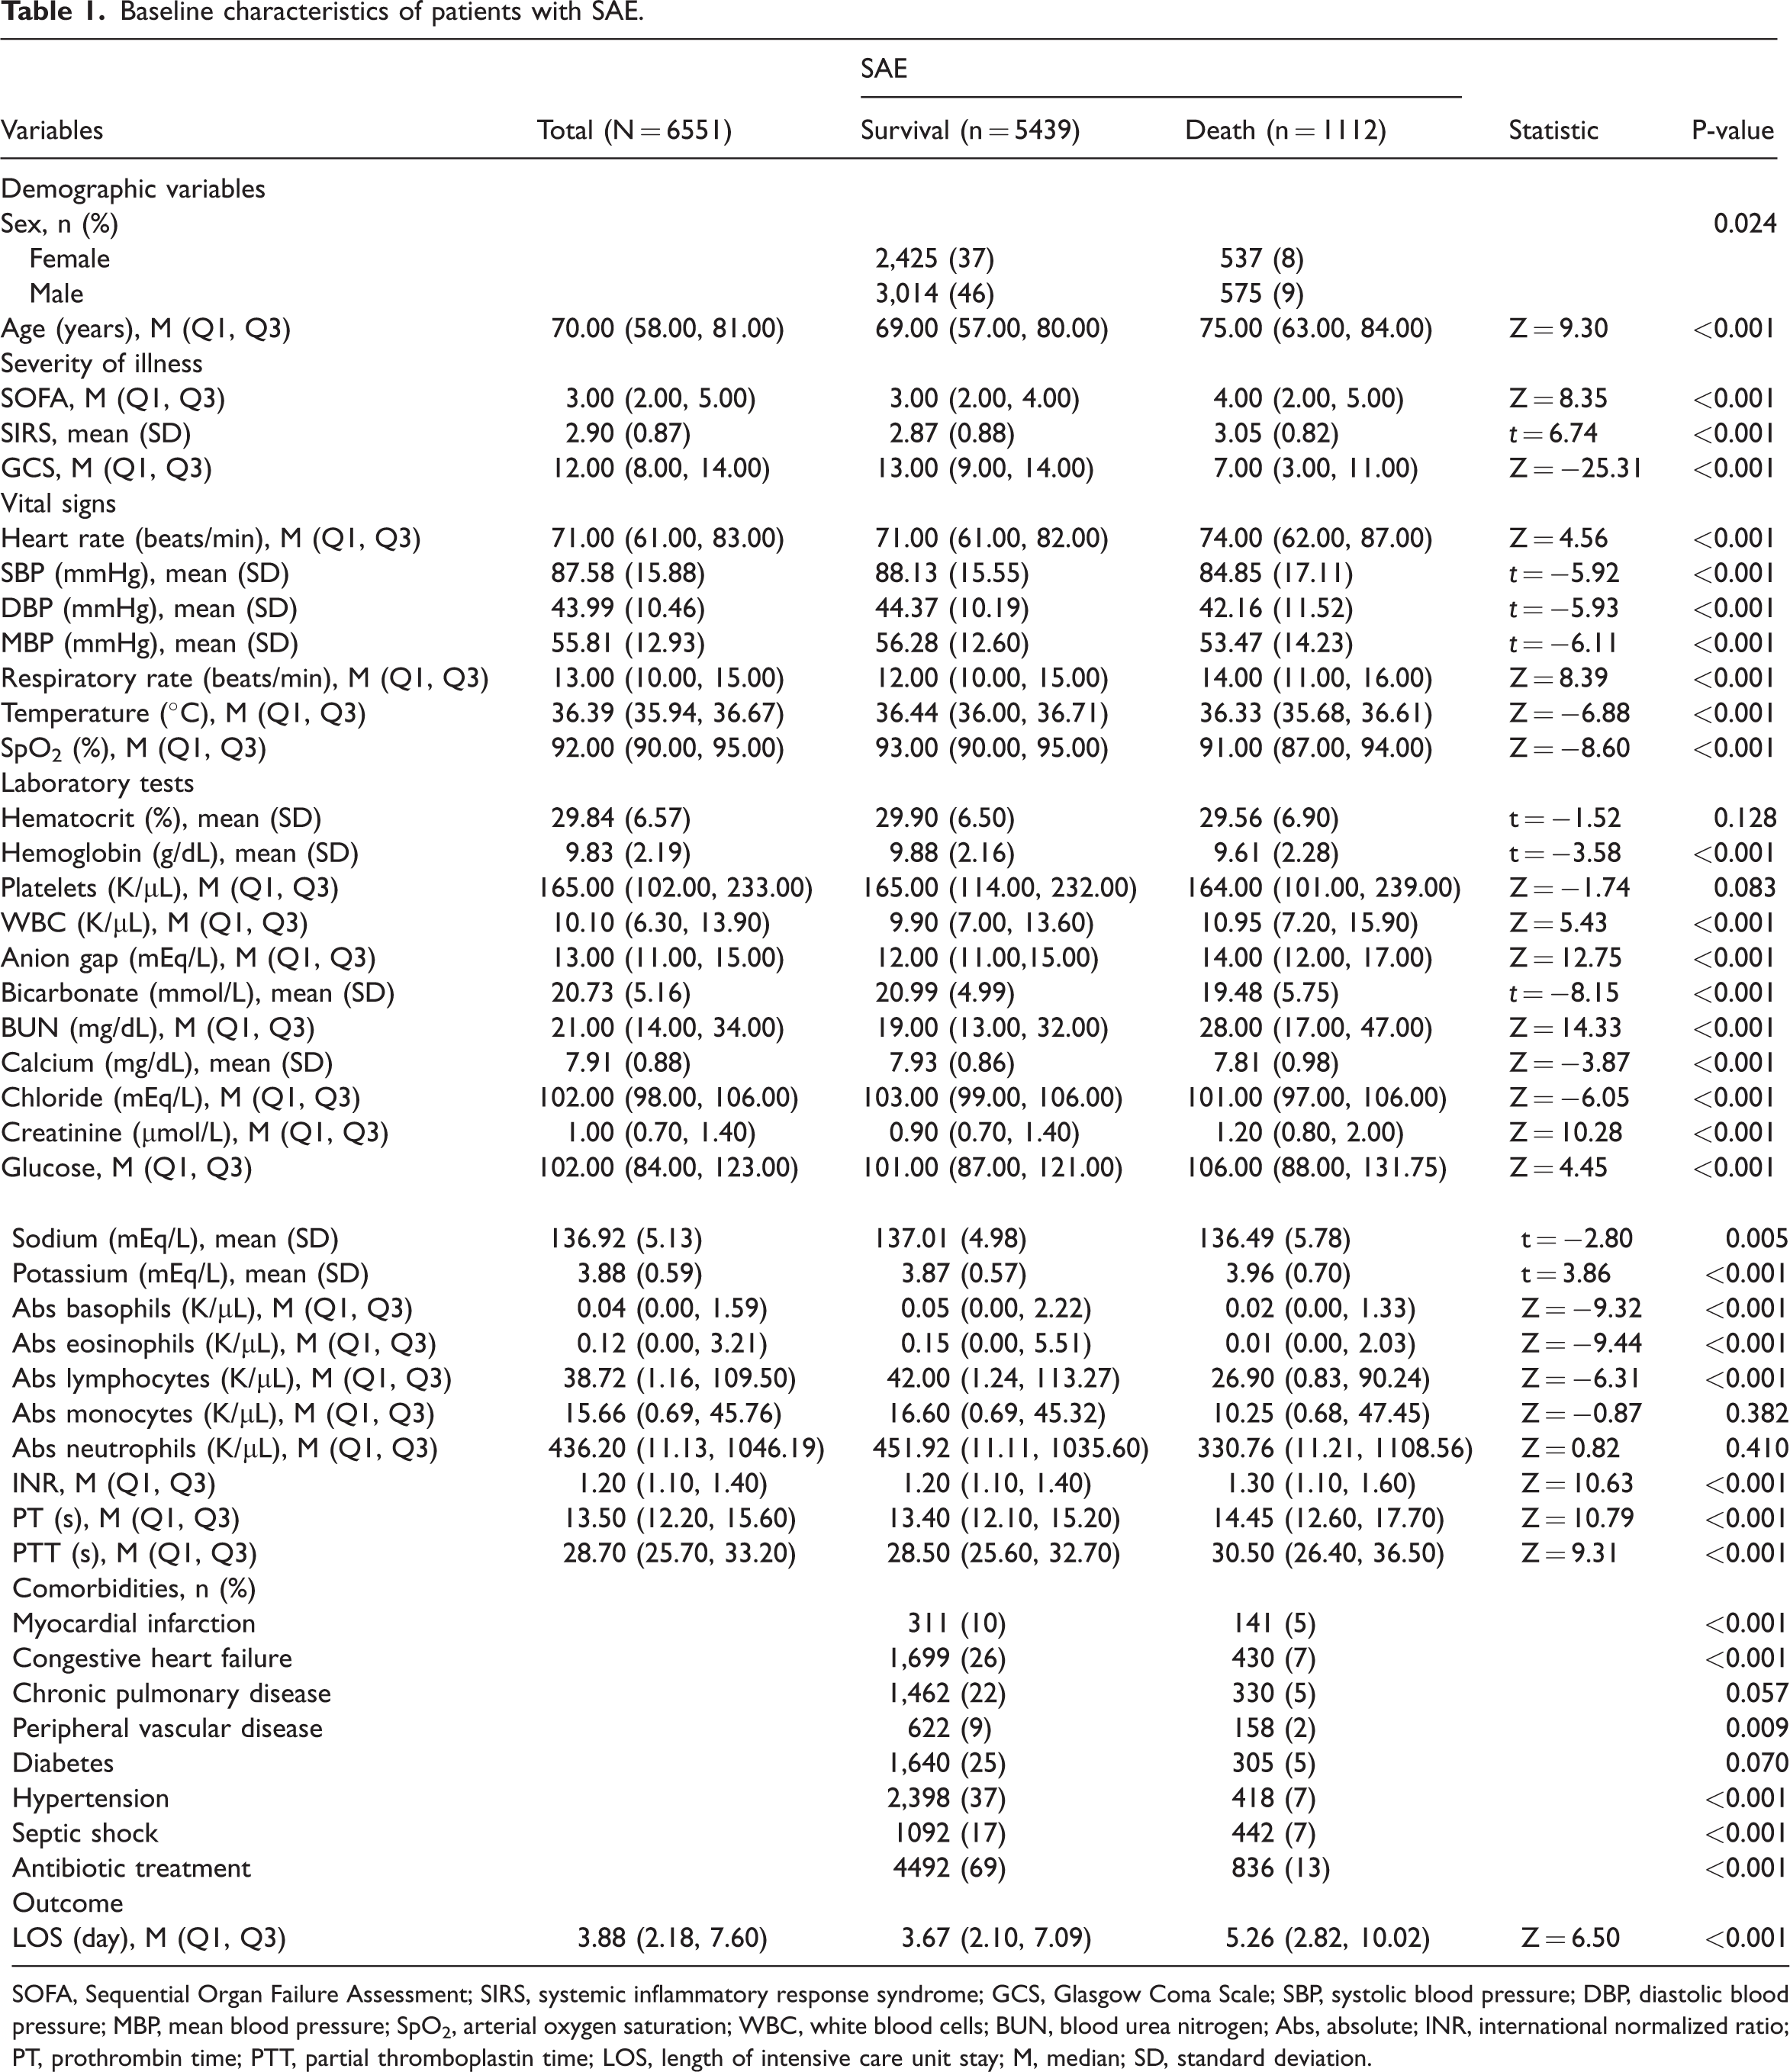
SOFA, Sequential Organ Failure Assessment; SIRS, systemic inflammatory response syndrome; GCS, Glasgow Coma Scale; SBP, systolic blood pressure; DBP, diastolic blood pressure; MBP, mean blood pressure; SpO2, arterial oxygen saturation; WBC, white blood cells; BUN, blood urea nitrogen; Abs, absolute; INR, international normalized ratio; PT, prothrombin time; PTT, partial thromboplastin time; LOS, length of intensive care unit stay; M, median; SD, standard deviation.
Developing and validating the model
We collected a total of 40 clinical features (Supplementary Figure 1). After LASSO regression screening, 15 features remained for model development (Supplementary Figure 1b): GCS score, age, SpO2, BUN, INR, chloride, temperature, respiratory rate, PTT, anion gap, WBC, hypertension, diabetes, septic shock, and antibiotic treatment.
The cohort of 6551 patients was randomly divided into a training set comprising 4585 individuals (70%) and a testing set comprising 1966 individuals (30%) (Supplementary Table 2). In comparing the performance metrics, the stacking ensemble model exhibited the highest AUC (0.807, 95% confidence interval [CI]: 0.783–0.831) on the testing set. DT excelled in terms of accuracy and specificity. LR exhibited optimal sensitivity and recall rates. The F-value of the SVM model outperformed that of other models (Table 2). We plotted the ROC curves (Figure 2a), and the results demonstrated that the stacking ensemble model achieved the highest AUC. Figure 2b and Supplementary Figure 2 respectively illustrate the DCA curve and calibration curve of the models on the testing set, with different colors representing the different models. The DCA curve demonstrates that XGBoost exhibited favorable net benefit within the threshold probability range of 5% to 94%. The calibration curves indicate that XGBoost and LightGBM had the highest alignment with the 45-degree diagonal, followed by the stacking ensemble model. The higher the degree of coincidence, the closer the correspondence between the model predictions and the actual observations.
Performance metrics of 10 machine learning models.

LR, logistic regression; DT, decision tree; ENet, elastic net; KNN, K-nearest neighbor; LightGBM, light gradient boosting machine; RF, random forest; XGBoost, extreme gradient boosting; SVM, support vector machine; MLP, multi-layer perceptron.

Line chart. (a) Discriminative ability of the 10 models compared using receiver operating characteristic (ROC) curves and area under the ROC curve (AUC) and (b) decision curve analysis (DCA) curves for the 10 models. LR, logistic regression; DT, decision tree; ENet, elastic net; KNN, K-nearest neighbor; LightGBM, light gradient boosting machine; RF, random forest; XGBoost, extreme gradient boosting; SVM, support vector machine; MLP, multi-layer perceptron.
In the external validation set, the stacking ensemble model achieved an AUC of 0.671 (95% CI, 0.647–0.695), with accuracy, sensitivity, and recall rates of 0.476, 0.808, and 0.808, respectively. The ROC curve is depicted in Supplementary Figure 3. This indicates that the predictive model is well-suited for external validation data (Supplementary Table 3).
Model interpretability
To delve further into mortality prediction using the stacking ensemble model, we used the SHAP algorithm to analyze the model’s output process. The feature importance of the stacking ensemble model is illustrated in Figure 3a, where GCS and age emerge as the two most crucial variables. We used SHAP summary plots to illustrate the overall positive and negative impacts of continuous and categorical variables on the output of the stacking ensemble model. Among the categorical variables, septic shock had the greatest value in the model (Figure 3b). Among continuous variables, GCS had the greatest value in the model (Figure 3c). Figure 4 depicts a univariate distribution plot, which indicates that with decreasing GCS score and increasing age, the importance of these factors in predicting the model’s outcomes also increases.

SHAP plot. (a) SHAP feature importance. The greater the variable importance, the longer the corresponding bar. (b) Boxplot: importance of categorical variables and (c) Beeswarm plot: swarm plot for continuous variables. GCS, Glasgow Coma Scale; SpO2, arterial oxygen saturation; WBC, white blood cell; BUN, blood urea nitrogen; INR, international normalized ratio; PTT, partial thromboplastin time; SHAP, Shapley additive explanations.

Univariate distribution plot. (a) Glasgow Coma Scale (GCS) and (b) Age. Yellow dots represent deceased patients; purple dots represent surviving patients. Red line depicts overall trend in the Shapley additive explanations (SHAP) values of the variable. Blue histogram illustrates the sample count corresponding to different SHAP values.
We selected two samples and used the SHAP algorithm to analyze the prediction results of the stacking ensemble model. Figure 5 depicts SHAP force plots for the samples, in which different colors denote varying contributions to the predicted outcome, which we defined as death. Figure 5a depicts deceased patients, where septic shock = 1 and GCS = 9 showed a predominantly positive role in the outcome of death, and age = 53 years exhibited a primary negative impact on the outcome of death. The model’s output value was 0.18, which is below the baseline value of 0.17. In this situation, factors such as septic shock lead to patient mortality whereas factors such as age 53 years lead toward survival. The length of the red bars exceeded that of the blue bars, predicting the outcome as death, which is in alignment with the actual outcome for this patient. Figure 5b illustrates surviving patients, where age = 96 years and GCS = 10 showed a positive effect on the outcome of death, and septic shock = 0 and anion gap = 10 exhibited a negative impact on the outcome of death. The model’s output value was 0.12, which is below the baseline value of 0.17. In this scenario, advanced age and GCS = 10, among other factors, contribute to patient mortality whereas the absence of septic shock and anion gap = 10, among other factors, lead toward patient survival. The length of the blue bars exceeded that of the red bars, predicting the outcome as survival, which is consistent with the actual outcome for this patient. Figure 5c and 5d presents waterfall plots for the abovementioned cases as another depiction of the SHAP force plots. Figure 5c represents deceased patients, and Figure 5d represents surviving patients. From the graph, it can be observed that GCS score and age are the two most crucial variables influencing the model output.

Bar chart. (a) Force plots for deceased patients. (b) Force plots for surviving patients. For force plots, red denotes a positive effect on the model outcome, and blue signifies a negative effect on the model outcome. The longer the bar, the greater the importance of the feature. (c) Waterfall plots for deceased patients and (d) Waterfall plots for surviving patients. For waterfall plots, yellow indicates a positive impact on the outcome of death, and purple signifies a negative impact on the outcome of death, with the length representing the contribution value. GCS, Glasgow Coma Scale; SpO2, arterial oxygen saturation; WBC, white blood cell; BUN, blood urea nitrogen; INR, international normalized ratio; PTT, partial thromboplastin time; SHAP, Shapley additive explanations.
The results of a comparison between the optimal model and SOFA score, as well as the SIRS score, revealed that the AUC for the SOFA score is 0.577 (95% CI, 0.558–0.595), and the AUC for the SIRS score is 0.556 (95% CI, 0.538–0.574) (Supplementary Figure 4). These results indicated that the optimal model outperforms the SOFA score and SIRS score in predicting in-hospital mortality among patients with SAE.
Application of the optimal model
We additionally created a website (https://sic1.shinyapps.io/SSAAEE/) and deployed the stacking ensemble model on the Shiny web platform. This provides a convenient platform for peer communication and utilization to facilitate the assessment of mortality risk in patients with SAE.
Discussion
There remains a paucity of research on predicting the in-hospital mortality risk among patients with SAE in the ICU. Based on 18 clinical features within the first 24 hours of ICU admission, we developed and validated 10 ML models to predict the in-hospital mortality risk among patients with SAE. Compared with other models, the stacked ensemble model exhibited subtle yet remarkable performance superiority.
As an amalgamation of computer science and statistics, ML processes data in a semi-automated manner and creates intricate models within learning frameworks, thereby yielding accurate diagnostic algorithms and personalized patient treatments. 20 As an excellent algorithm, the stacking ensemble model has been applied in the development of disease prediction models. Huangbo and colleagues successfully constructed a stacking ensemble model that could predict the 6-month mortality rate in patients with ischemic stroke. 21 Gupta et al. successfully used a stacking ensemble ML approach to predict the risk of cardiac complications following COVID-19 infection. 22 Peng et al. explored predictors and developed ML models for predicting 30-day mortality in patients with SAE, using the MIMIC-IV database. Their evaluation, including metrics such as AUC, accuracy, and calibration performance, adds valuable insights to the understanding of prognostic modeling in critical care settings. 23 In the context of our study, we used 10 ML models based on the MIMIC-IV database to predict in-hospital mortality risk among patients with SAE, with the stacked ensemble model emerging as the most effective.
To authentically demonstrate the generalization performance of our model across diverse datasets, we conducted external validation using the eICU database. However, the stacking ensemble model had an AUC of 0.671 for the external validation set, significantly lower than the 0.807 observed for the internal validation set. The reasons for this disparity may be owing to various factors. First, the internal and external datasets originated from distinct distributions, and the patient characteristics varied among different medical centers. This disparity may lead to a decline in model performance when using external data. Additionally, differences in sample size could impact the model’s performance because smaller external datasets may offer relatively limited information.
We found that the two most significant variables influencing the optimal model output were GCS and age. The GCS is commonly used to assess the severity of injury and illness, helping with classification and intervention and enabling timely detection of changes in consciousness. 24 Despite the fluctuating accuracy of the GCS, this scale remains a commonly used tool for distinguishing survivors and non-survivors among trauma patients. 25 Research indicates that the mortality rate in brain disorders is associated with GCS scores; the mortality rate is 16% with a GCS score of 15, 20% with scores ranging from 13 to 14, 50% with scores between 9 and 12, and 63% with scores from 3 to 8. 26 Our model also demonstrated that a smaller GCS has a more significant impact on the model output. In addition, the impact on the model output was more significant with increasing age. Advanced age may be associated with inflammatory aging in older people, which has clear involvement in cardiovascular disease and metabolic abnormalities in sarcopenia. 27 Opal and colleagues observed that older patients with sepsis had a significantly increased mortality rate than their younger counterparts. This elevation in mortality is possibly attributable to advanced age inducing innate immune response abnormalities, thereby influencing sepsis. 28 The assessment of other continuous variables aligns with medical knowledge, where a greater deviation from the normal range corresponds to a more substantial impact on the model output.
To the best of our knowledge, this study represents the first attempt at using a stacked ensemble model to predict the mortality risk in SAE. The stacked ensemble model, distinguished for its ability to amalgamate advantages from multiple foundational models, exhibits heightened generalization capabilities when using novel data. Particularly in clinical scenarios when predicting high-risk patients with SAE across multicenter ICUs, this model’s robustness when using new data is notable. Furthermore, relative to singular models, the stacked ensemble model demonstrates enhanced resilience when dealing with noise or outliers owing to its capacity to harmonize predictions from individual sub-models. In contrast to certain deep learning models, the stacked ensemble model affords a higher degree of interpretability. In our study, we conducted external validation of the predictive models using the eICU database, with results consistently showcasing robust performance of the predictive models. We also developed an online tool to facilitate convenient use of our predictive model with clinical practitioners, which can provide valuable insights for clinical decision-making.
This study has several limitations. Prospective data for validation of our predictive models and corresponding controlled studies to verify the improvement in clinical outcomes are lacking. Addressing these limitations will be a focus of our future research efforts.
Conclusion
In this study, we successfully developed a stacked ensemble model characterized by improved generalization capabilities using novel data, specifically designed to predict mortality risk in patients diagnosed with SAE. This innovative clinical support model can play a pivotal role in augmenting physician awareness, providing valuable insights for the identification of high-risk patients with SAE. The developed model can empower healthcare professionals to proactively address the needs of these patients by facilitating timely interventions, thereby contributing to enhanced clinical outcomes and patient prognosis.
Supplemental Material
sj-pdf-1-imr-10.1177_03000605241239013 - Supplemental material for Enhancing predictions with a stacking ensemble model for ICU mortality risk in patients with sepsis-associated encephalopathy
Supplemental material, sj-pdf-1-imr-10.1177_03000605241239013 for Enhancing predictions with a stacking ensemble model for ICU mortality risk in patients with sepsis-associated encephalopathy by Xuhui Liu, Hao Niu and Jiahua Peng in Journal of International Medical Research
Supplemental Material
sj-pdf-2-imr-10.1177_03000605241239013 - Supplemental material for Enhancing predictions with a stacking ensemble model for ICU mortality risk in patients with sepsis-associated encephalopathy
Supplemental material, sj-pdf-2-imr-10.1177_03000605241239013 for Enhancing predictions with a stacking ensemble model for ICU mortality risk in patients with sepsis-associated encephalopathy by Xuhui Liu, Hao Niu and Jiahua Peng in Journal of International Medical Research
Footnotes
Authors’ contributions
H.N. was responsible for data collection. X.L. was in charge of statistical analysis, model construction, and manuscript writing. J.P. critically revised the article. All authors read and approved the final manuscript.
Data availability statement
The datasets supporting the conclusions of this article are available in the MIMIC-IV (version 1.0) repository at (https://physionet.org/content/mimiciv/1.0/). The eICU database is openly accessible at (![]() ). The code used for data extraction and analysis can be requested from the corresponding author.
). The code used for data extraction and analysis can be requested from the corresponding author.
Declaration of conflicting interest
The authors declare that there is no conflict of interest.
Funding
This research received no specific grant from funding agencies in the public, commercial, or not-for-profit sectors.
Supplemental material
Supplemental material for this article is available online.
References
Supplementary Material
Please find the following supplemental material available below.
For Open Access articles published under a Creative Commons License, all supplemental material carries the same license as the article it is associated with.
For non-Open Access articles published, all supplemental material carries a non-exclusive license, and permission requests for re-use of supplemental material or any part of supplemental material shall be sent directly to the copyright owner as specified in the copyright notice associated with the article.