
Abstract
Objective
To predict the 28-day mortality of critically ill, elderly patients with colorectal cancer (CRC) using five machine learning approaches.
Methods
Data were extracted from the eICU Collaborative Research Database (eICU-CRD) (version 2.0) for a training cohort and from the Medical Information Mart for Intensive Care-IV (MIMIC-IV) and Wuhan Union hospital for validation cohorts. Clinical information (i.e., demographics; initial laboratory tests; vital signs; outcomes) were collected. Five machine learning algorithms (LightGBM, decision tree, XGBoost, random forest, and ensemble model) and a logistic regression were applied for the prediction of 28-day mortality.
Results
Overall, 693 patients were included from the eICU cohort, 181 patients from the MIMIC-IV cohort and 95 from the Wuhan Union cohort. Among the six machine learning models, the ensemble model exhibited the best predictive ability (AUC, 0.86), followed by random forest (AUC, 0.83) and LightGBM (AUC, 0.82) in the training cohort. The models also obtained the good predictive performance for the 28-day mortality in the validation cohorts.
Conclusions
We showed that machine learning algorithms can be used for the 28-day mortality prediction in critically ill, elderly patients with CRC.
Introduction
The global burden of malignant tumours is rapidly increasing, and it has been estimated that worldwide, the number of new cancer cases will increase to 24 million per year by 2035. 1 Cancer is the second most common cause of death across the world. 2 In addition, cancer patients are at risk from life-threatening complications, such as acute renal failure, sepsis, acute respiratory distress syndrome due to severe infection, chemoradiotherapy side effects, and progressive disease from the underlying malignancy. 3 Therefore, patients with advanced stage cancer are viewed as potential candidates for admission into the intensive care unit (ICU). 4 Importantly, early ICU admission, has been linked with decreased mortality in critically ill, cancer patients. 5 Several studies have found that the 180-day mortality rate of critically ill, cancer patients who were admitted to ICU was approximately 50%. 6 Due to the high mortality rate of critically ill, cancer patients, it is important for clinicians and oncologists to identify those patients who may benefit from admission to ICU.
The aging population has substantially contributed to the increasing number of newly diagnosed cancer cases worldwide. 1 Indeed, the number of elderly individuals with cancer is estimated to double worldwide over the next decade. 1 Colorectal cancer (CRC) is one of the most common malignant tumours in the elderly. 7 Moreover, cancer management in the elderly can be complex because the patients are more likely to have other chronic health conditions. Importantly, accurate prognosis prediction in critically ill, patients with CRC is essential in clinical decision making. However, there is a need for improved prognostic tools which will help guide treatment protocols. With rapid advances being made in machine learning techniques, this complex issue may well be resolved. For example, the light gradient boosting machine (LightGBM) model is a gradient boosting framework that uses tree-based learning algorithms and it has been shown to be accurate and reliable in predicting survival outcomes in elderly patients with breast cancer who received chemotherapy. 8
Machine learning methods can extract key clinical information which affect expected outcomes. 9 Moreover, using this technology will improve the speed and accuracy of physicians' and oncologists’ work. Machine learning methods learn from clinical data in a ‘training set’, they estimate the relationship between the observed and predicted outcomes in a ‘testing set’, and use that relationship to correct subsequent inference in a ‘validation set’. 10 In this present study, we extracted data from critically ill, elderly patients with CRC from three datasets (i.e., two large USA-based publicly accessible datasets and one relatively small local dataset) and used five machine learning methods to identify risk factors associated with mortality prediction.
Methods
Data source
For this study we used the eICU Collaborative Research Database (eICU-CRD) (version 2.0), which is a multicentre database with data from over 200,000 ICU admissions in the United States. 9 We also used the Medica Information Mart for Intensive Care (MIMIC)-IV (version 1.0) database which contains data from over 50,000 ICU patients from Beth Israel Deaconess Medical Center in Boston, USA, collected over a decade of admissions between 2008 and 2019. 10 Because the aforementioned ICU cohorts were USA-based, it was necessary to test the prediction models using local clinical data. Therefore, we also used data from a cohort of 95 elderly Chinese patients with CRC who were admitted to ICU at Wuhan Union Hospital. Information for these patients was obtained from hospital medical records.
This was a two-step analysis; we built 28-day mortality prediction models based on data from the eICU database (training set), and then externally confirmed the prediction models with data from MIMIC-IV and the Wuhan Union cohort (validation sets).
Written/verbal consent from the patients was not required because this was a retrospective study and patient data were anonymized prior to analysis. The study was approved by the clinical research ethics committee of Wuhan Union hospital.
Study population
This was a retrospective cohort study. We selected the eICU-CRD database as the training set and the MIMIC-IV database and Wuhan Union cohort as the validation sets. Elderly, critically ill, patients with a confirmed diagnosis of CRC were eligible for the study. Exclusion criteria were as follows: <60 years of age; repeated ICU admissions; ICU stay <24 hours; missing data (i.e., >70%).
Baseline characteristics and admission information (i.e., age; sex; body mass index [BMI], ethnicity) were recorded. Comorbidities including hypertension, diabetes, chronic kidney disease, myocardial infarction (MI), congestive heart disease (CHD), and liver disease were also collected. The Charlson comorbidity index (CCI) was also included. In addition, severity scores including, sequential organ failure assessment (SOFA) score, the oxford acute severity of illness score (OASIS) and the acute physiology score III (APSII) were recorded. Laboratory indices and vital signs obtained within the first 24 h of ICU admission, were extracted from the databases or patient records. The primary outcome of the study was the prediction of 28-day mortality after ICU admission.
Construction and verification of 28-day mortality predictive models
Five machine learning approaches (i.e., random forest, decision tree, XGBoost, LightGBM, and ensemble model) and one conventional logistic model, were selected to derive the 28-day mortality prediction models for elderly critically ill, patients with CRC in the eICU cohort. Although their feature processing strategies are different, the XGBoost and the LightGBM are based on improvement of gradient boosting decision tree (GBDT) algorithm. An ensemble model was constructed to improve prediction, which applied staking strategy using random forest, LightGBM and XGBoost.
Details of the machine learning algorithms have been reported elsewhere. 11 To obtain the best model for the prognosis of elderly patients with CRC, the optimal hyperparameters (e.g., number of trees or depth of each tree) of the models were selected and fine-tuned by grid search using a 10-fold cross-validation procedure. Each model was evaluated according to accuracy, recall, F1 score, and area under the receiver operating characteristic curve (AUC). 12 Receiver operating characteristic (ROC) curves were generated using Python software (version 3.5). A shapely additive explanations (SHAP) analysis was used to rate the negative and positive impact of every feature on 28-day mortality prediction and show dependencies among the various features.
Statistical analysis
Statistical analysis was performed using SPSS software (version 20.0 for Windows®; IBM Corp, Armonk, NY, USA). A P-value <0.05 was considered to indicate statistical significance. Categorical variables were compared using χ2 test or Fisher’s exact test and continuous variables were expressed as mean ± SD and analysed using analysis of variance (ANOVA). Missing values were reasonably estimated using the iterative singular value decomposition (SVD) data imputation method. 13
Results
Baseline characteristics
Overall, 693 patients were included from the eICU cohort, 181 patients from the MIMIC-IV cohort and 95 from the Wuhan Union cohort (Figure 1 and Table 1). Baseline characteristics, laboratory indices and clinical outcome for the three cohorts are shown in in Table 1 and 2, respectively. Mean age, BMI and number of male patients were statistically significantly (P ≤ 0.017) lower for the Union group compared with the eICU and the MIMIC-IV cohorts (Table 1). Primary sites (i.e., colon or rectum) differed between groups and significantly more patients in the Union cohort (64%) were on mechanical ventilation compared with eICU (30%) and the MIMIC-IV (33%) cohorts. Statistically significant differences were also detected among cohorts in medications, concomitant illnesses, scoring systems and vital signs (Table 1). In addition, significant differences were observed among cohorts in many laboratory indices (Table 2). With regard to 28-day mortality, there were 93 (13%) deaths in the training cohort, 28 (16%) in the validation cohort and 6 (6%) in the Union cohort.

Patient flow chart.
Baseline characteristics.

Data are expressed as, n, n (%) or mean ± standard deviation.
ACEI/ARB, Angiotensin converting enzyme inhibitors/Angiotensin receptor blockers; APSIII, acute physiology score III; BMI, body mass index; CCB, Calcium channel blockers; CCI, Charlson comorbidity index; CHD, chronic heart disease; CKD, chronic kidney disease; DM, diabetes mellitus; MV, mechanical ventilation; ns, not statistically significant; OASIS, oxford acute severity of illness score; RRT, renal replacement therapy, SOFA, sequential organ failure assessment.
Vital signs and Laboratory tests.
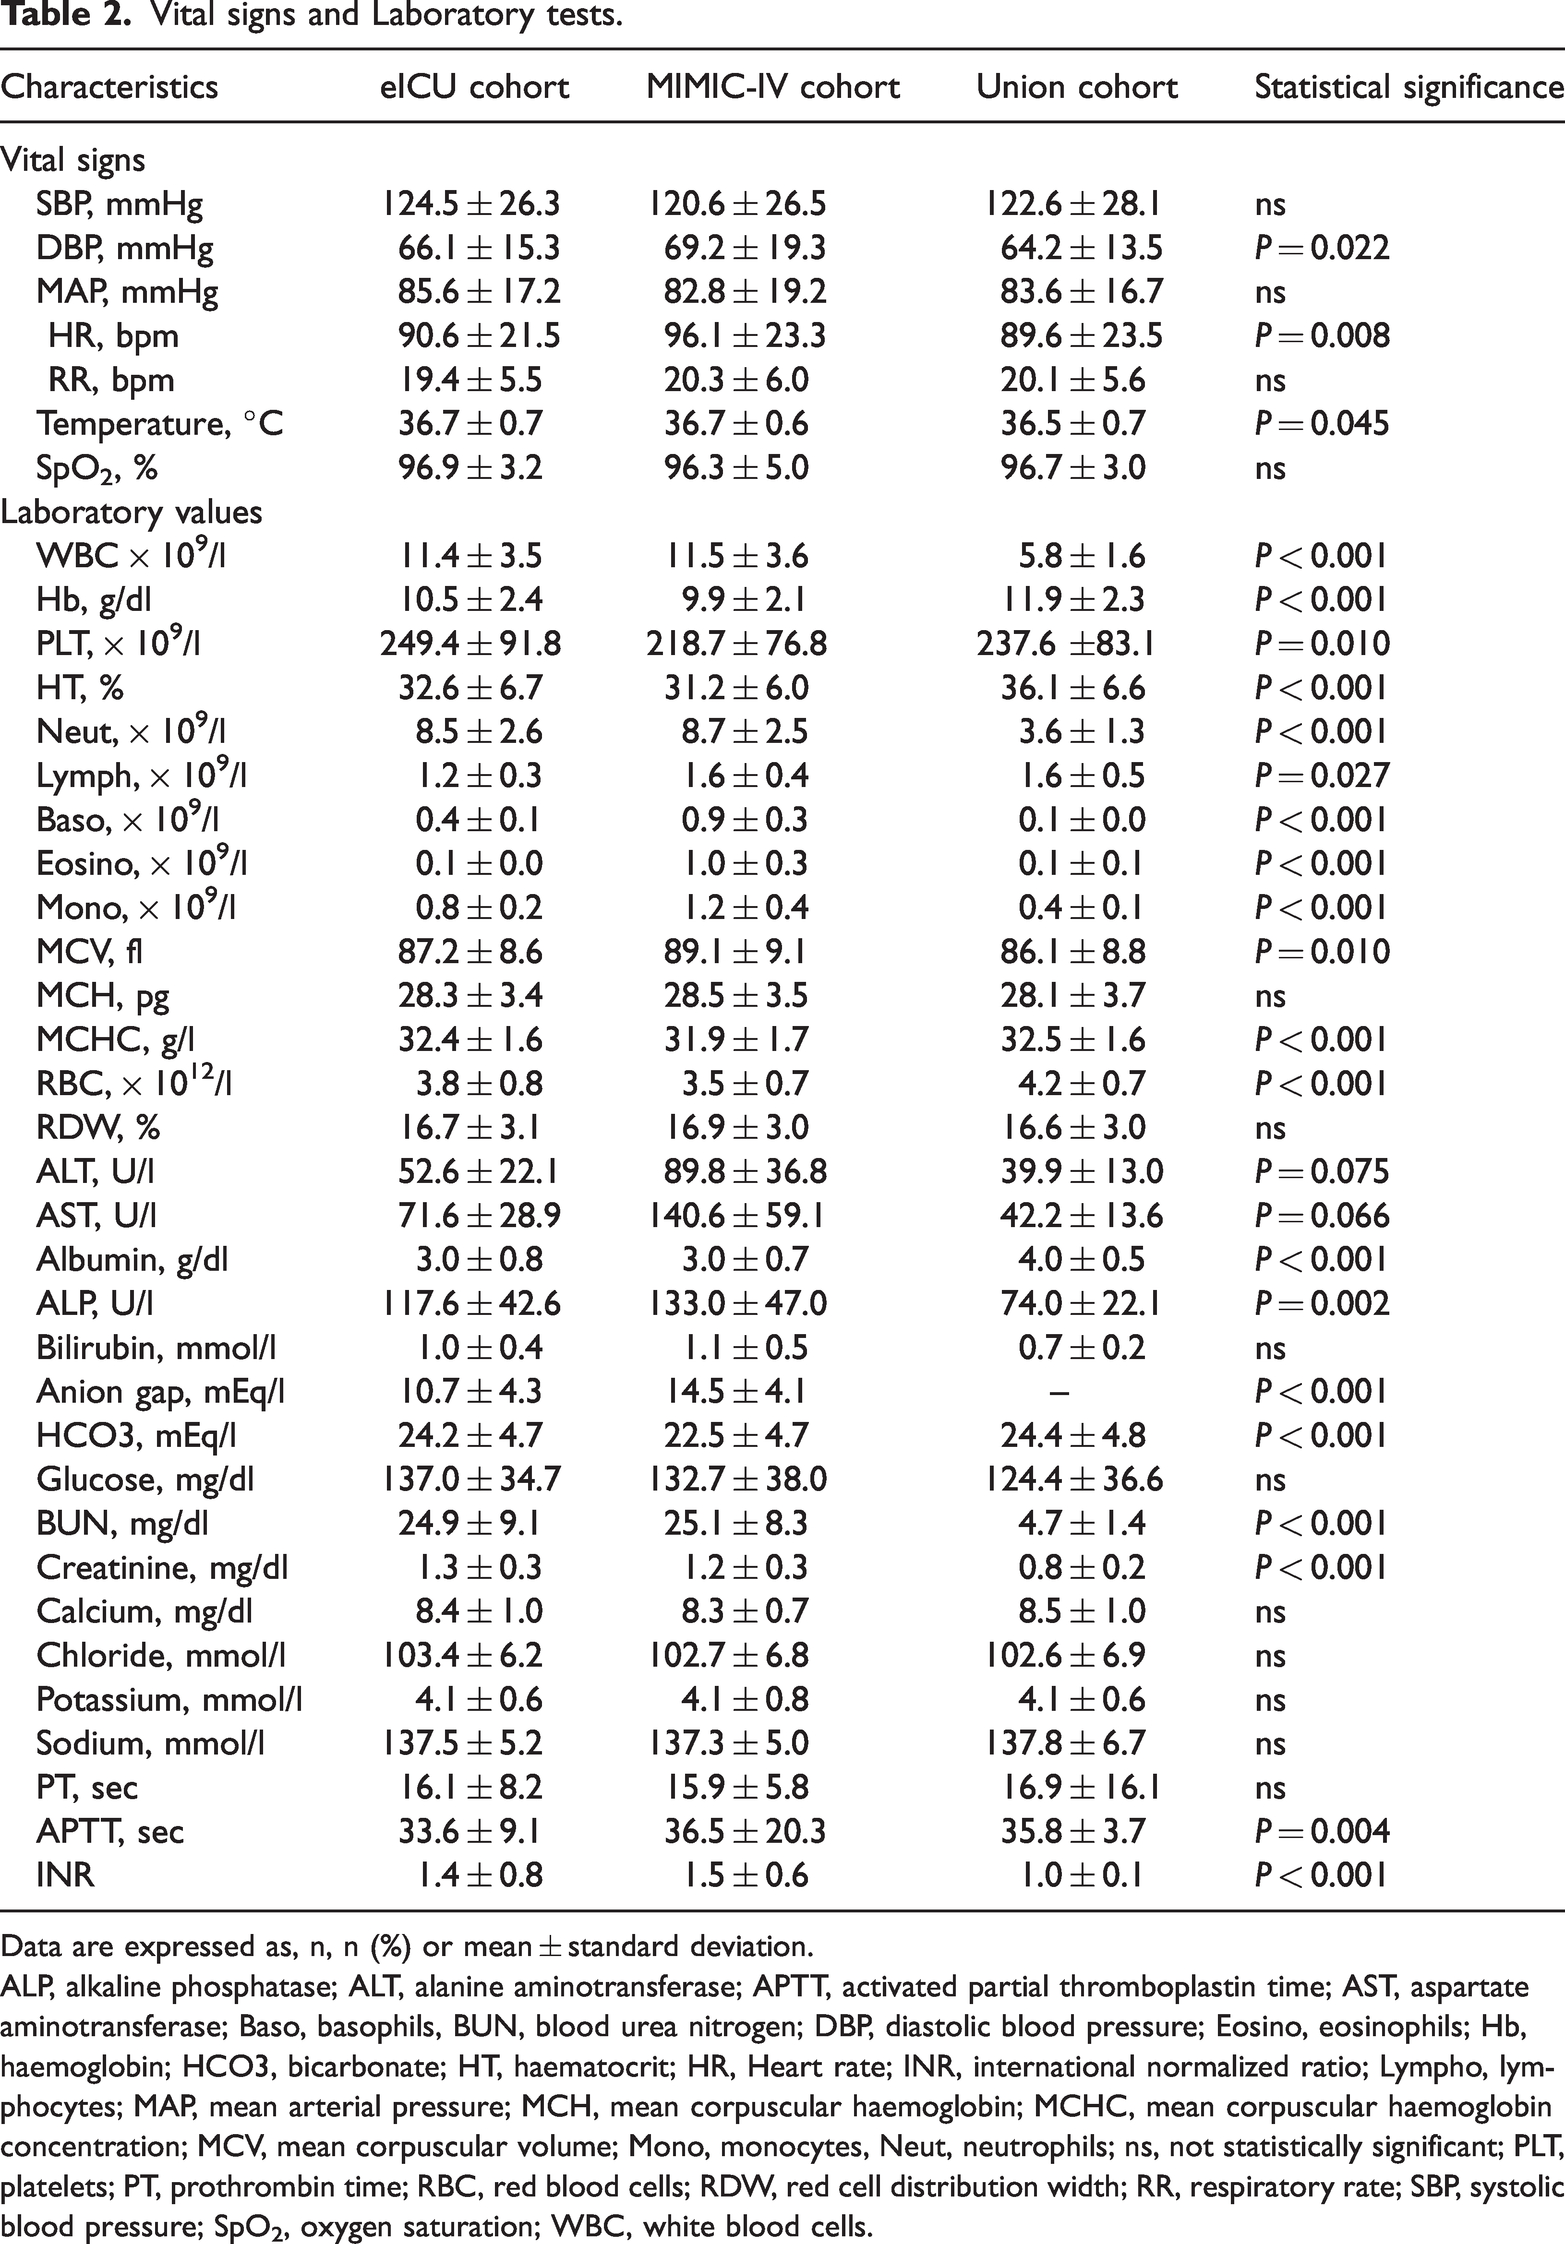
Data are expressed as, n, n (%) or mean ± standard deviation.
ALP, alkaline phosphatase; ALT, alanine aminotransferase; APTT, activated partial thromboplastin time; AST, aspartate aminotransferase; Baso, basophils, BUN, blood urea nitrogen; DBP, diastolic blood pressure; Eosino, eosinophils; Hb, haemoglobin; HCO3, bicarbonate; HT, haematocrit; HR, Heart rate; INR, international normalized ratio; Lympho, lymphocytes; MAP, mean arterial pressure; MCH, mean corpuscular haemoglobin; MCHC, mean corpuscular haemoglobin concentration; MCV, mean corpuscular volume; Mono, monocytes, Neut, neutrophils; ns, not statistically significant; PLT, platelets; PT, prothrombin time; RBC, red blood cells; RDW, red cell distribution width; RR, respiratory rate; SBP, systolic blood pressure; SpO2, oxygen saturation; WBC, white blood cells.
Performance evaluation of the models
We generated ROC curves to assess the overall performance of the five machine learning models and the conventional logistic model. As shown in Figure 2a and Table 3), for the training cohort, the ensemble model exhibited the best predictive ability (AUC, 0.86), followed by random forest (AUC, 0.83) and LightGBM (AUC, 0.82). The logistic regression model obtained the worst predictive performance (AUC, 0.68).

Receiver operating characteristic (ROC) curves for the six prediction models using all features for predicting 28-day mortality in: (a) the eICU [training] cohort; (b) the MIMIC-IV [validation] cohort (c), the Union cohort.
Predictive performance of the prediction models.

AUC, area under the receiver operating characteristic (ROC) curve.
The results in the validation cohort were similar to the results in the training cohort (Figure 2b and Table 3). The ensemble model exhibited the best predictive ability (AUC, 0.73), while the decision tree model obtained the worst predictive performance (AUC, 0.57).
We verified the prediction models using the Union cohort. The ensemble model exhibited the best predictive ability (AUC, 0.81), while the logistic regression model obtained the worst predictive performance (AUC, 0.65) (Figure 2c and Table 3). Other parameters related to predictive models, (e.g., accuracy, recall and F1 scores) are shown in Table 3.
Feature importance analysis
To clarify the important features that have an impact on the model output, we identified the top 20 clinical features closely associated with 28-day mortality among elderly critically ill, patients with CRC. In the random forest model, vasopressors, blood urea nitrogen (BUN), and the Charlson comorbidity index (CCI) were the top three most influential features related to 28-day mortality (Figure 3a). In the LightGBM model serum albumin, haemoglobin, and alkaline phosphatase (ALP) were the top three most influential features (Figure 3b). In the XGBoost model, vasopressors, serum albumin, and BUN were the top three features related to 28-day mortality (Figure 3c).
The top 20 features derived from the (a), random forest, (b) LightGBM and (c) XGBoost models.
To analyse the impact of important features on the model, a SHAP summary figure was used to show how top features affected the probability of 28-day mortality (Figure 4). Based on SHAP analysis, we used the direction and strength of each clinical feature to illustrate its impact on the probability of 28-day mortality. Using the XGBoost model as an example, a high level of serum albumin was negatively associated with the probability of 28-day mortality, whereas a high level of serum BUN was positively correlated with a high probability of 28-day mortality (Figure 4).

SHAP summary plot of the features of the XGBoost model. The higher the SHAP value of a feature, the higher the probability of 28-day mortality development. Red represents higher feature values, and blue represents lower feature values.
Analysis of the XGBoost model at the individual level
Using the XGBoost model combined with the SHAP analysis method, a representative survival patient and a dead patient were selected to illustrate the effect of features on the prediction ability. As illustrated in Figure 5, decremental mortality effects of key features (red) and incremental mortality effects of key features (blue) were shown in the SHAP force figure.

Two representative SHAP force plots of survival (a) and dead (b) patients.
For the survival patient, the predicted probability for 28-day mortality was relatively low due to several decreased values (i.e., BUN [13 mg/dl]; activated partial thromboplastin time [APTT, 20.9 sec]; sodium [139 mmol/l]; ALP [88 U/l]; MCV [92 fl]; haematocrit [33%]) (Figure 5a). This patient received mechanical ventilation and vasopressors.
For the dead patient, the predicted probability for 28-day mortality was relatively high due to several elevated values (i.e., platelets [264 × 109/l]; APTT [39 sec]; respiratory rate [33 bpm]; alanine aminotransferase [ALT, 9.0 U/l]; haemoglobin [10.5 g/dl]; red blood cells [3.9 × 10¹²/l]; lymphocytes [2.0 × 10⁹/l]) (Figure 5b).
Discussion
Using ICU data from two, large, public databases and from a cohort of patients at Wuhan Union Hospital, we applied five machine learning approaches (i.e., random forest, decision tree, XGBoost, Light GBM, and, ensemble model) to predict the 28-day mortality for critically ill, elderly patients with CRC. The five machine learning algorithms showed good performance for the prediction of 28-day mortality in the e-ICU training cohort, and validated well in the MIMIC-IV database and Union cohort. Furthermore, compared with the conventional model (i.e., logistic regression), the machine learning algorithms obtained superior performance for predictive accuracy. To our knowledge, this is the first clinical investigation using a relatively large sample size that has investigated the usefulness of five machine learning models in the prediction of 28-day mortality in critically ill, elderly patients with CRC.
Consistent with our results, a study using data from the Surveillance, Epidemiology, and End Results (SEER) database, found that the LightGBM model attained a superior performance in predicting 5-year-survival of patients with CRC compared with American Joint Committee on Cancer (AJCC) staging. 14 In another study conducted in Brazil, researchers used five different machine learning models to predict survival outcomes of patients with CRC and found that their predictive models achieved good performance. 15 In addition, other investigators using data from the Cancer Genome Atlas (TCGA) database, showed that machine learning framework can be used to predict the 3-year survival of patients with CRC. 16 Nevertheless, unlike our study, these studies did not focus on critically ill, elderly patients with CRC. Importantly, we used five machine learning models and a conventional logistic regression method to predict 28-day mortality of critically ill, elderly patients with CRC using a large sample size, and validating the predictive ability of our models with real world clinical data.
Machine learning models, whereby computers learn to determine decision-making algorithms, have been widely applied in the early diagnosis and survival assessment of CRC.17–21 The high efficiency of machine learning algorithms relies on their ability to abstract significant metrics from millions of data and complex associations, and automatically make classifications. 22 Among the current machine learning approaches, random forest, decision tree, XGBoost, LightGBM, and, ensemble models have proven to be suitable selection platforms for handling large datasets. 23 The most obvious advantage of a machine learning approach is that it increases sample size and so enhances statistical power while requiring a short computation time in handling large datasets. 24
In our analysis, we found that the accuracy of machine learning models was higher than a conventional model (logistic regression) for the prediction of 28-day mortality among critically ill, elderly patients with CRC. We believe that our machine learning algorithms were good at dealing with high-order associations between the predictive factors and the non-linear relationships with survival outcome. In addition, modern machine learning algorithms use various rigorous approaches, such as cross-validation, dropout, and regularization, to avoid overfitting which is often inevitable in logistic regression. Indeed, based on our analysis, we conclude that machine learning algorithms were superior to conventional logistic regression for the survival prediction of critically ill, elderly patients with CRC.
Aging patients with CRC possess a higher risk for treatment-associated morbidity and mortality than younger patients. 25 For example, a study conducted in Japan showed that elderly patients with CRC and Glasgow Prognostic Score (GPS) ≥2 exhibited a significantly lower 5-year survival rate than those with GPS 0 or 1. 26 However, there is a paucity of data regarding critically ill, elderly patients with CRC who are admitted to ICU. Importantly, nutrition status may play an important role in cancer mortality in this group of patients. 27 Indeed, protein malnutrition has been shown to be a risk factor in patients who were admitted to ICU. 28 Interestingly, our analysis showed that a low level of serum albumin was the most significant risk factor, selected by the LightGBM model, for 28-day mortality of critically ill, elderly patients with CRC. Therefore, perhaps we should focus on the nutritional status of these patients and initiate nutritional support therapy as soon as possible.
The study had several limitations. For example, the predictive accuracy of machine learning models was good, but not excellent, and this was probably due to the retrospective design of the study. In addition, the sample size of the external validation set (i.e., the Union cohort) was relatively small (n = 95). Furthermore, we obtained laboratory data, but did not collect pathology data (e.g., tumour, node and metastasis [TNM] staging; tumour size; tumour grade). Therefore, further studies using a variety of data are required to confirm the robustness and applicability of machine learning models in predicting survival in critically ill, elderly patients with CRC.
In conclusion, our study showed that machine learning algorithms can be used for survival prediction of critically ill, elderly patients with CRC, and the models exhibit superior predictive performance compared with a conventional logistic regression model. We used data from two large databases derived from multiple hospitals across the USA, and confirmed the predictive accuracy of the models with hospital data from our own centre. Our analysis suggests that machine learning algorithms can be adapted to improve the survival prediction for critically ill, elderly patients with CRC. Our study provides critical insights for clinical experts and policy makers who are tasked to cope with issues of a rapidly growing aging population.
Supplemental Material
sj-pdf-1-imr-10.1177_03000605231198725 - Supplemental material for Using machine learning algorithms to predict 28-day mortality in critically ill elderly patients with colorectal cancer
Supplemental material, sj-pdf-1-imr-10.1177_03000605231198725 for Using machine learning algorithms to predict 28-day mortality in critically ill elderly patients with colorectal cancer by Chunxia Guo, Jun Pan, Shan Tian and Yuanjun Gao in Journal of International Medical Research
Supplemental Material
sj-pdf-2-imr-10.1177_03000605231198725 - Supplemental material for Using machine learning algorithms to predict 28-day mortality in critically ill elderly patients with colorectal cancer
Supplemental material, sj-pdf-2-imr-10.1177_03000605231198725 for Using machine learning algorithms to predict 28-day mortality in critically ill elderly patients with colorectal cancer by Chunxia Guo, Jun Pan, Shan Tian and Yuanjun Gao in Journal of International Medical Research
Footnotes
References
Supplementary Material
Please find the following supplemental material available below.
For Open Access articles published under a Creative Commons License, all supplemental material carries the same license as the article it is associated with.
For non-Open Access articles published, all supplemental material carries a non-exclusive license, and permission requests for re-use of supplemental material or any part of supplemental material shall be sent directly to the copyright owner as specified in the copyright notice associated with the article.