
Abstract
Objective
To explore the association between the controlling nutritional status (CONUT) score and disease activity in patients with ulcerative colitis (UC).
Methods
This retrospective study enrolled patients with UC. Demographic, clinical and laboratory data were collected and compared. The CONUT score was obtained for each patient. The association between the CONUT score and laboratory parameters was analysed and the ability of the score to assess disease activity was evaluated.
Results
A total of 182 patients with UC were enrolled. Patients with active disease showed significantly increased inflammatory biomarkers and decreased nutritional biomarkers compared with patients in remission. Malnourished individuals had significantly elevated inflammatory biomarkers and significantly reduced haemoglobin, prealbumin and retinol-binding protein. The CONUT score was inversely correlated with haemoglobin, prealbumin, retinol-binding protein and was positively correlated with faecal calprotectin, C-reactive protein, erythrocyte sedimentation rate, neutrophil/lymphocyte ratio and platelet/lymphocyte ratio. The area under the receiver operating characteristic curve was 0.655 (95% confidence interval, 0.557–0.752). The optimal cut-off value was 1.5 points, with a sensitivity of 75.7% and a specificity of 50.0%.
Conclusion
The CONUT score may evaluate the inflammatory response and nutritional status of UC patients, so it could be a potential biomarker to assess disease activity in UC.
Introduction
Ulcerative colitis (UC) is a chronic intestinal disease that presents with diarrhoea, bloody stools and abdominal pain, which is characterized by alternating phases of remission and relapse. 1 The usual tool for evaluating the disease activity of UC is the Mayo score, a comprehensive scoring system that includes defecation situation, endoscopic results, rectal bleeding and the doctor’s overall evaluation. 2 Due to colonoscopy being an invasive procedure that cannot be undertaken frequently, the Mayo score cannot be obtained quickly, regularly and conveniently. Therefore, a simple, easy-to-obtain index is needed to evaluate the disease activity of UC patients.
The development of UC is associated with an inflammatory response, immune-mediated factors and the nutritional condition of the affected individuals. 3 Malnutrition is a common complication of UC, because diarrhoea and intestinal inflammation may lead to increased energy consumption and malabsorption of nutrients. 4 In addition, malnutrition is also a negative factor for intestinal inflammation. For example, it was reported that malnutrition was a risk factor for surgical procedures and increasing mortality in patients with inflammatory bowel disease (IBD). 5 Previous research has also reported that malnourished IBD patients were more likely to be infected and the severity of malnutrition was related to the systemic inflammatory response mediated by tumour necrosis factor-α and interleukin-6. 6
The controlling nutritional status (CONUT) score is a simple and comprehensive nutritional index including three parameters: serum albumin, serum total cholesterol and total lymphocyte count. 7 There has been a considerable amount of research investigating its potential prognostic value for malignant tumours in patients after surgical procedures and heart disease patients.8,9 In addition, the association between the CONUT score and ulcer healing, 10 Parkinson's disease, 11 vasculitis 12 and myelodysplastic syndromes has been reported, 13 which indicates that this score not only assesses nutritional condition but also evaluates the inflammatory response and immunocompetence of individuals. Therefore, the CONUT score has the advantage that it can be used in inflammatory diseases and immune disorders. However, the ability of the CONUT score to assess the disease activity of UC had not been researched. This current retrospective study investigated the relationship between the CONUT score and the clinical characteristics of patients with UC in order to determine if it could be used to assess the disease activity of UC.
Patients and methods
Patient population
This retrospective study enrolled consecutive patients with UC from the Department of Gastroenterology, Affiliated Hospital of Nanjing University of Chinese Medicine, Nanjing, Jiangsu Province, China between January 2020 and June 2022. The inclusion criteria were as follows: (i) patients were diagnosed with UC according to established conventional criteria including clinical manifestations and endoscopic features; (ii) patients ≥ 18 years old. The exclusion criteria were as follows: (i) patients with infections, malignant diseases, haematological diseases, autoimmune diseases and metabolic syndrome diseases; (ii) patients with liver and kidney dysfunction; (iii) patients with a history of colectomy; (iv) patients with incomplete CONUT and Mayo scores.
This study was conducted in accordance with the principles of the Declaration of Helsinki and was approved by the Ethics Committee of the Affiliated Hospital of Nanjing University of Chinese Medicine, Nanjing, Jiangsu Province, China (approval number: 2019NL-097-04). Written informed consent was waived because the study data were collected retrospectively. All patient details were de-identified. The reporting of this study conforms to the STROBE guidelines. 14
Data collection
Data for the following were collected retrospectively from the hospital records: (i) demographic data including sex, age and body mass index (BMI); (ii) clinical characteristics including disease extent and Mayo score; (iii) laboratory parameters including faecal calprotectin (FC), C-reactive protein (CRP), erythrocyte sedimentation rate (ESR), haemoglobin (Hb), prealbumin (PAB), retinol-binding protein (RBP), serum albumin, serum total cholesterol, total lymphocyte count, neutrophil/lymphocyte ratio (NLR) and platelet/lymphocyte ratio (PLR). The laboratory tests and colonoscopy for each patient were performed within 1 week.
Disease activity was assessed using the Mayo score. Patients with a Mayo score > 2 were defined as active UC and those with a Mayo score ≤ 2 were defined as being in remission (see supplementary materials, Table S1). The disease extent was described by the Montreal classification including ulcerative proctitis, left-sided UC and extensive UC. 15 The nutritional condition of the patients was assessed by the CONUT score and was classified as normal (score of 0–1), mild (score of 2–4), moderate (score of 5–8), severe (score of 9–12) (see supplementary materials, Table S2). 7 The histological disease activity of UC patients was assessed using the Nancy index, which includes a 5-level classification system ranging from grade 0 to grade 4 as follows: (i) grade 0 corresponds to no histologically significant disease; (ii) grade 1 corresponds to chronic inflammatory infiltrate with no acute inflammatory infiltrate; (iii) grade 2 corresponds to mildly active disease; (iv) grade 3 corresponds to moderately active disease; (v) grade 4 corresponds to severely active disease. 16 Furthermore, patients with grades 0 and 1 were defined as having histological remission; and grades 2 to 4 were defined as histological activity. 17
Statistical analyses
All statistical analyses were performed using the SPSS® statistical package, version 16.0 (SPSS Inc., Chicago, IL, USA) for Windows®. Continuous variables are presented as mean ± SD or medians (range) according to data distribution. Categorical variables are presented as frequency (percentage). Student’s t-test or analysis of variance (ANOVA) was used to compare continuous variables with a normal distribution. Mann–Whitney U-test or Kruskal–Wallis H test was used to compare categorical variables and continuous variables without a normal distribution. Spearman's rank correlation analyses were used to evaluate the correlation between the CONUT score and laboratory parameters. Receiver operator characteristic (ROC) curve analysis was used to estimate the area under the curve and the optimal cut-off value. The sensitivity and specificity of the cut-off value were calculated. A P-value <0.05 was considered statistically significant.
Results
This retrospective study enrolled 336 patients with UC based on the data collected from the hospital records. Of these, 42 did not meet the inclusion criteria and 112 did not have the necessary data. Therefore, 182 (97 [53.30%] males and 85 [46.70%] females) patients were enrolled and analysed in this study. The demographic and clinical characteristics of the patients stratified according to their Mayo score are summarized in Table 1 and Table 2. The median age was 47 years (range, 20–86 years) and the median BMI was 21.27 (range, 15.50–34.55 kg/m2). According to the Montreal classification, 24 (13.19%), 64 (35.16%) and 94 (51.65%) patients were defined as having ulcerative proctitis, left-sided UC and extensive UC, respectively. Based on the Mayo score, there were 38 patients in remission and 144 with active disease. There were no significant differences observed between the two groups in age, sex distribution, BMI and extent of the disease. There was a significant difference in the CONUT score between the two groups with 19 (50.00%) undernourished patients in remission and 109 (75.69%) undernourished patients with active disease (P = 0.003). As shown in Table 2, patients with active UC showed significantly increased FC, ESR, CRP, NLR and PLR; and significantly decreased Hb, PAB, and RBP compared with the patients in remission (P < 0.0001 for all comparisons). Furthermore, the demographic and clinical characteristics were compared based on disease severity (i.e. in remission, mild, moderate and severe UC). The results showed there were significant differences in the CONUT score (P < 0.001) and laboratory data among the four groups (P < 0.001 for all comparisons; except for Hb, P = 0.001) (Table 3 and Table 4).
Demographic and clinical characteristics of patients (n = 182) with ulcerative colitis (UC) stratified according to their Mayo score who were included in a retrospective study to investigate the relationship between the controlling nutritional status (CONUT) score and the clinical characteristics.

Data presented as median (range) or n of patients (%).
Student’s t-test was used to compare continuous variables with a normal distribution. Mann–Whitney U-test was used to compare categorical variables and continuous variables without a normal distribution; NS, no significant between-group difference (P ≥ 0.05).
BMI, body mass index.
Laboratory data of patients (n = 182) with ulcerative colitis (UC) stratified according to their Mayo score who were included in a retrospective study to investigate the relationship between the controlling nutritional status (CONUT) score and the clinical characteristics.

Data presented as median (range) or mean ± SD.
Student’s t-test was used to compare continuous variables with anormal distribution. Mann–Whitney U-test was used to compare continuous variables without a normal distribution.
In the group of patients with UC in remission, there were 7, 2, 1 and 1 missing values for FC, ESR, PAB and RBP, respectively; in the patients with active UC, there were 63, 15, 2, 1, 3, 2 and 12 missing values for FC, ESR, CRP, PLR, Hb, PAB and RBP, respectively.
FC, faecal calprotectin; ESR, erythrocyte sedimentation rate; CRP, C-reactive protein; NLR, neutrophil/lymphocyte ratio; PLR, platelet/lymphocyte ratio; Hb, haemoglobin; PAB, prealbumin; RBP, retinol-binding protein.
Demographic and clinical characteristics of patients (n = 182) with ulcerative colitis (UC) stratified according to the severity of the UC who were included in a retrospective study to investigate the relationship between the controlling nutritional status (CONUT) score and the clinical characteristics.

Data presented as median (range) or n of patients (%).
Analysis of variance was used to compare continuous variables with a normal distribution; Kruskal–Wallis H test was used to compare categorical variables and continuous variables without a normal distribution; NS, no significant between-group difference (P ≥ 0.05).
BMI, body mass index.
Laboratory data of patients (n = 182) with ulcerative colitis (UC) stratified according to the severity of the UC who were included in a retrospective study to investigate the relationship between the controlling nutritional status (CONUT) score and the clinical characteristics.
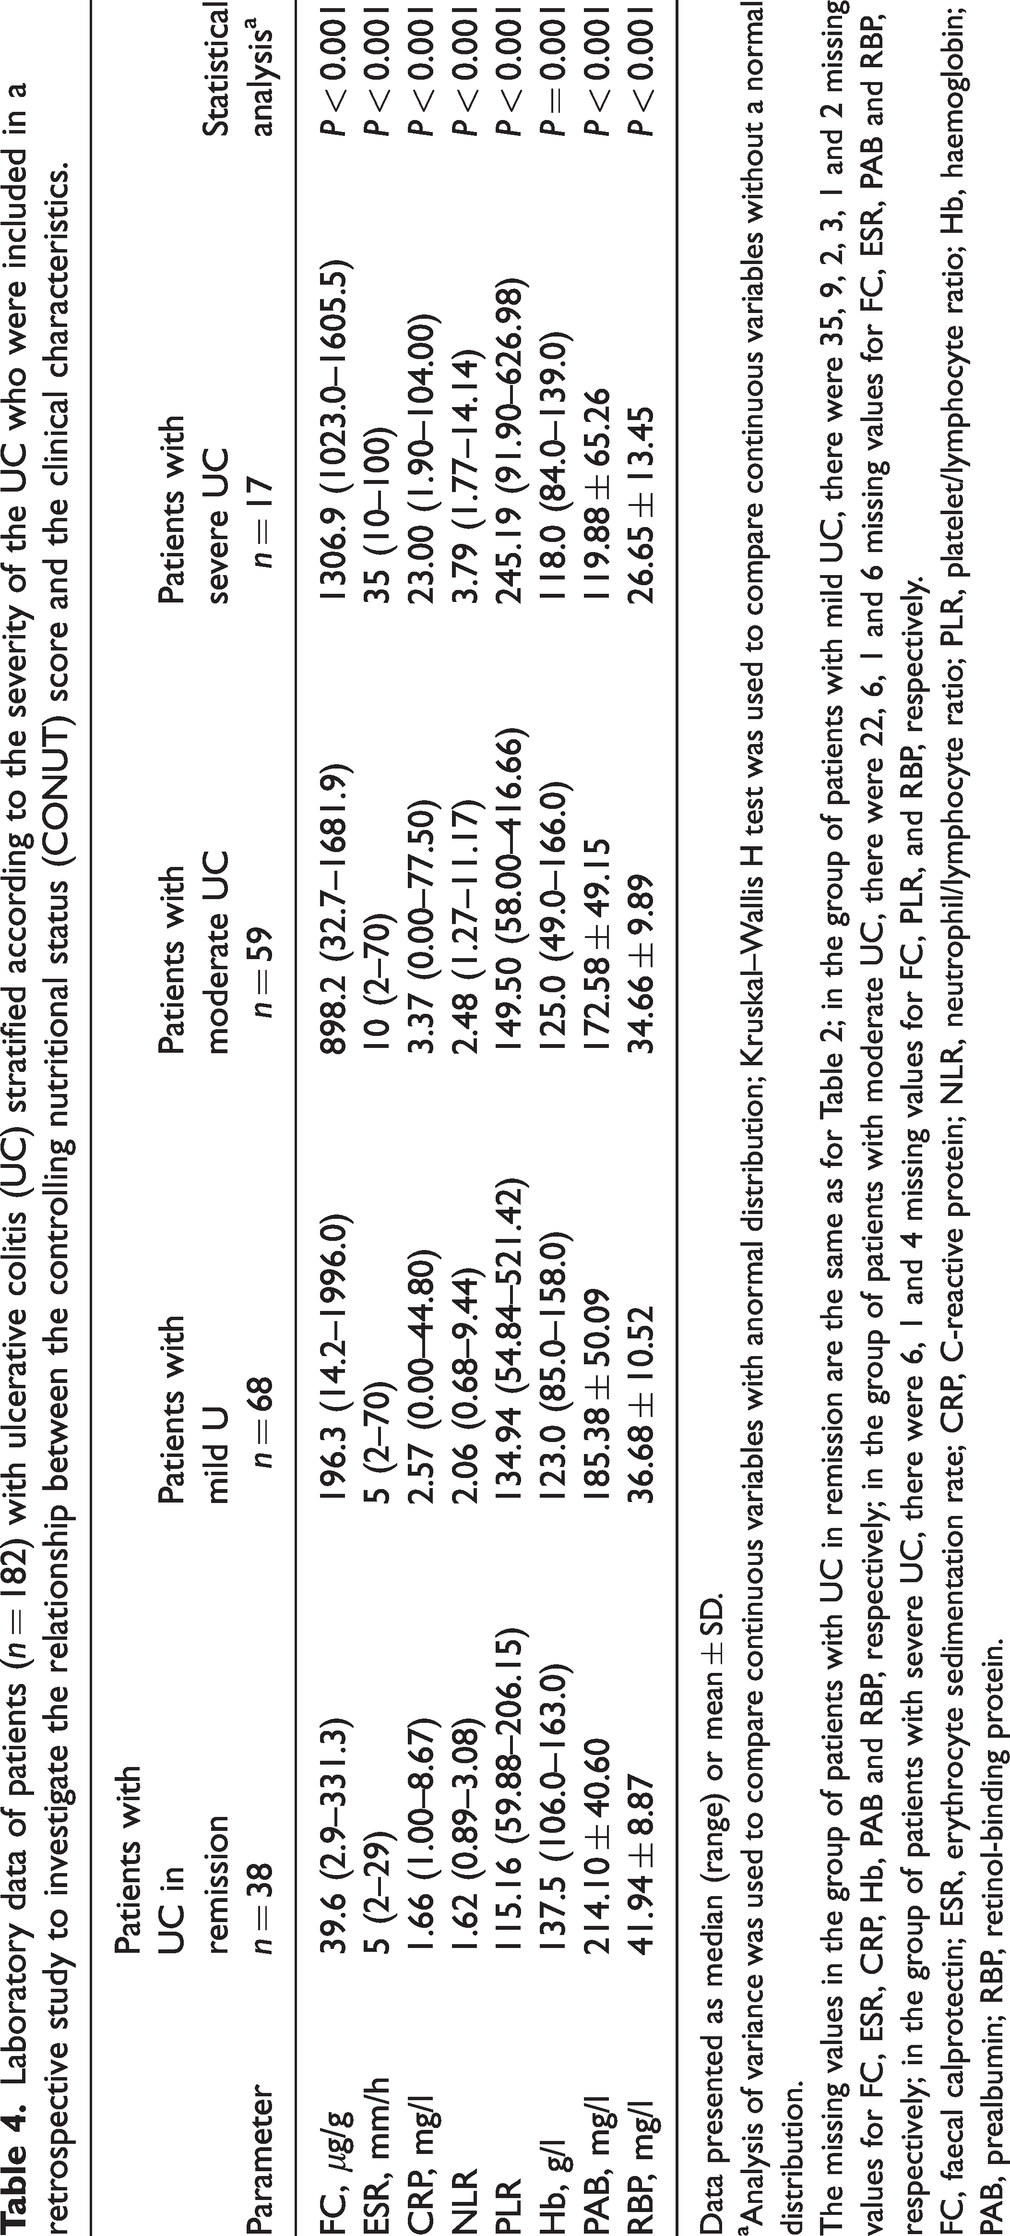
Data presented as median (range) or mean ± SD.
Analysis of variance was used to compare continuous variables with anormal distribution; Kruskal–Wallis H test was used to compare continuous variables without a normal distribution.
The missing values in the group of patients with UC in remission are the same as for Table 2; in the group of patients with mild UC, there were 35, 9, 2, 3, 1 and 2 missing values for FC, ESR, CRP, Hb, PAB and RBP, respectively; in the group of patients with moderate UC, there were 22, 6, 1 and 6 missing values for FC, ESR, PAB and RBP, respectively; in the group of patients with severe UC, there were 6, 1 and 4 missing values for FC, PLR, and RBP, respectively.
FC, faecal calprotectin; ESR, erythrocyte sedimentation rate; CRP, C-reactive protein; NLR, neutrophil/lymphocyte ratio; PLR, platelet/lymphocyte ratio; Hb, haemoglobin; PAB, prealbumin; RBP, retinol-binding protein.
The nutritional biomarkers and CONUT scores were compared in patients stratified according to the Nancy index (Table 5). The results showed that UC patients with histological activity (i.e. grades 2 to 4) exhibited significantly lower levels of Hb, PAB and RBP (P < 0.05 for all comparisons) than those with histological remission (i.e. grade 0 and 1); and a significantly lower prevalence of malnutrition was observed in patients with histological remission (i.e. grade 0 and 1) compared with those with histological activity (i.e. grades 2 to 4) (P = 0.001).
The controlling nutritional status (CONUT) score and nutritional biomarkers of patients (n = 182) with ulcerative colitis (UC) stratified according to the histological severity of the UC.

Data presented as median (range), mean ± SD or n of patients (%).
Student’s t-test was used to compare continuous variables with a normal distribution. Mann–Whitney U-test was used to compare categorical variables and continuous variables without a normal distribution; comparisons were undertaken between patients with histological remission and those with histological activity; NS, no significant between-group difference (P ≥ 0.05).
In the patients with grade 1, there were 1, 1 and 2 missing values for Hb, PAB and RBP, respectively; in patients with grade 2, there were 2, 1 and 4 missing values for Hb, PAB and RBP, respectively; in patients with grade 3, there were 1 and 4 missing values for PAB and RBP, respectively; in patients with grade 4, there were 3 missing values for RBP.
BMI, body mass index; Hb, haemoglobin; PAB, prealbumin; RBP, retinol-binding protein.
Based on the CONUT score, 128 patients (70.33%) were malnourished, of which 109 patients (59.89%) had mild malnutrition, 17 patients (9.34%) had moderate malnutrition and two patients (1.10%) had severe malnutrition. The demographic and clinical characteristics of the patients stratified according to a CONUT score < 2 and CONUT score ≥ 2 are summarized in Table 6. There were no significant differences in age, sex and BMI between the two groups, but the Mayo score (P = 0.004) and disease extent (P = 0.001) showed significant differences. As shown in Figure 1, in comparison with a CONUT score < 2, malnourished individuals exhibited elevated FC (P = 0.023), ESR (P = 0.038), CRP (P = 0.001), NLR (P < 0.0001), PLR (P < 0.0001); and reduced Hb (P < 0.001), PAB (P < 0.0001) and RBP (P < 0.0001).
Demographic and clinical characteristics of patients (n = 182) with ulcerative colitis (UC) stratified according to the nutritional status determined by the controlling nutritional status (CONUT) score.

Data presented as median (range) or n of patients (%).
Student’s t-test was used to compare continuous variables with a normal distribution. Mann–Whitney U-test was used to compare categorical variables and continuous variables without a normal distribution; NS, no significant between-group difference (P ≥ 0.05).
BMI, body mass index.

Laboratory parameters of patients with ulcerative colitis stratified according to the nutritional status determined by the controlling nutritional status (CONUT) score. Student’s t-test was used to compare continuous variables with a normal distribution; and Mann–Whitney U-test was used to compare continuous variables without a normal distribution. FC, faecal calprotectin; CRP, C-reactive protein; ESR, erythrocyte sedimentation rate; NLR, neutrophil/lymphocyte ratio; PLR, platelet/lymphocyte ratio; Hb, haemoglobin; PAB, prealbumin; RBP, retinol-binding protein. The colour version of this figure is available at: http://imr.sagepub.com.
The results of Spearman's rank correlation analyses between the CONUT score and laboratory parameters are shown in Figure 2. The CONUT score was positively correlated with FC (r = 0.295, P = 0.002), CRP (r = 0.298, P < 0.0001), ESR (r = 0.237, P = 0.002), NLR (r = 0.378, P < 0.0001) and PLR (r = 0.442, P < 0.0001), while it was inversely correlated with Hb (r = –0.399, P < 0.0001), PAB (r = –0.459, P < 0.0001) and RBP (r = –0.449, P < 0.0001).

Spearman's rank correlation analyses of the laboratory parameters and the controlling nutritional status (CONUT) score of patients with ulcerative colitis. FC, faecal calprotectin; CRP, C-reactive protein; ESR, erythrocyte sedimentation rate; NLR, neutrophil/lymphocyte ratio; PLR, platelet/lymphocyte ratio; Hb, haemoglobin; PAB, prealbumin; RBP, retinol-binding protein. The colour version of this figure is available at: http://imr.sagepub.com.
The ability of the CONUT score to assess the disease activity of UC was shown by ROC curve analysis (area under the curve = 0.655, P = 0.003, 95% confidence interval, 0.557–0.752) (Figure 3). The optimal cut-off value was 1.5 points, with a sensitivity of 75.7% and a specificity of 50.0%.
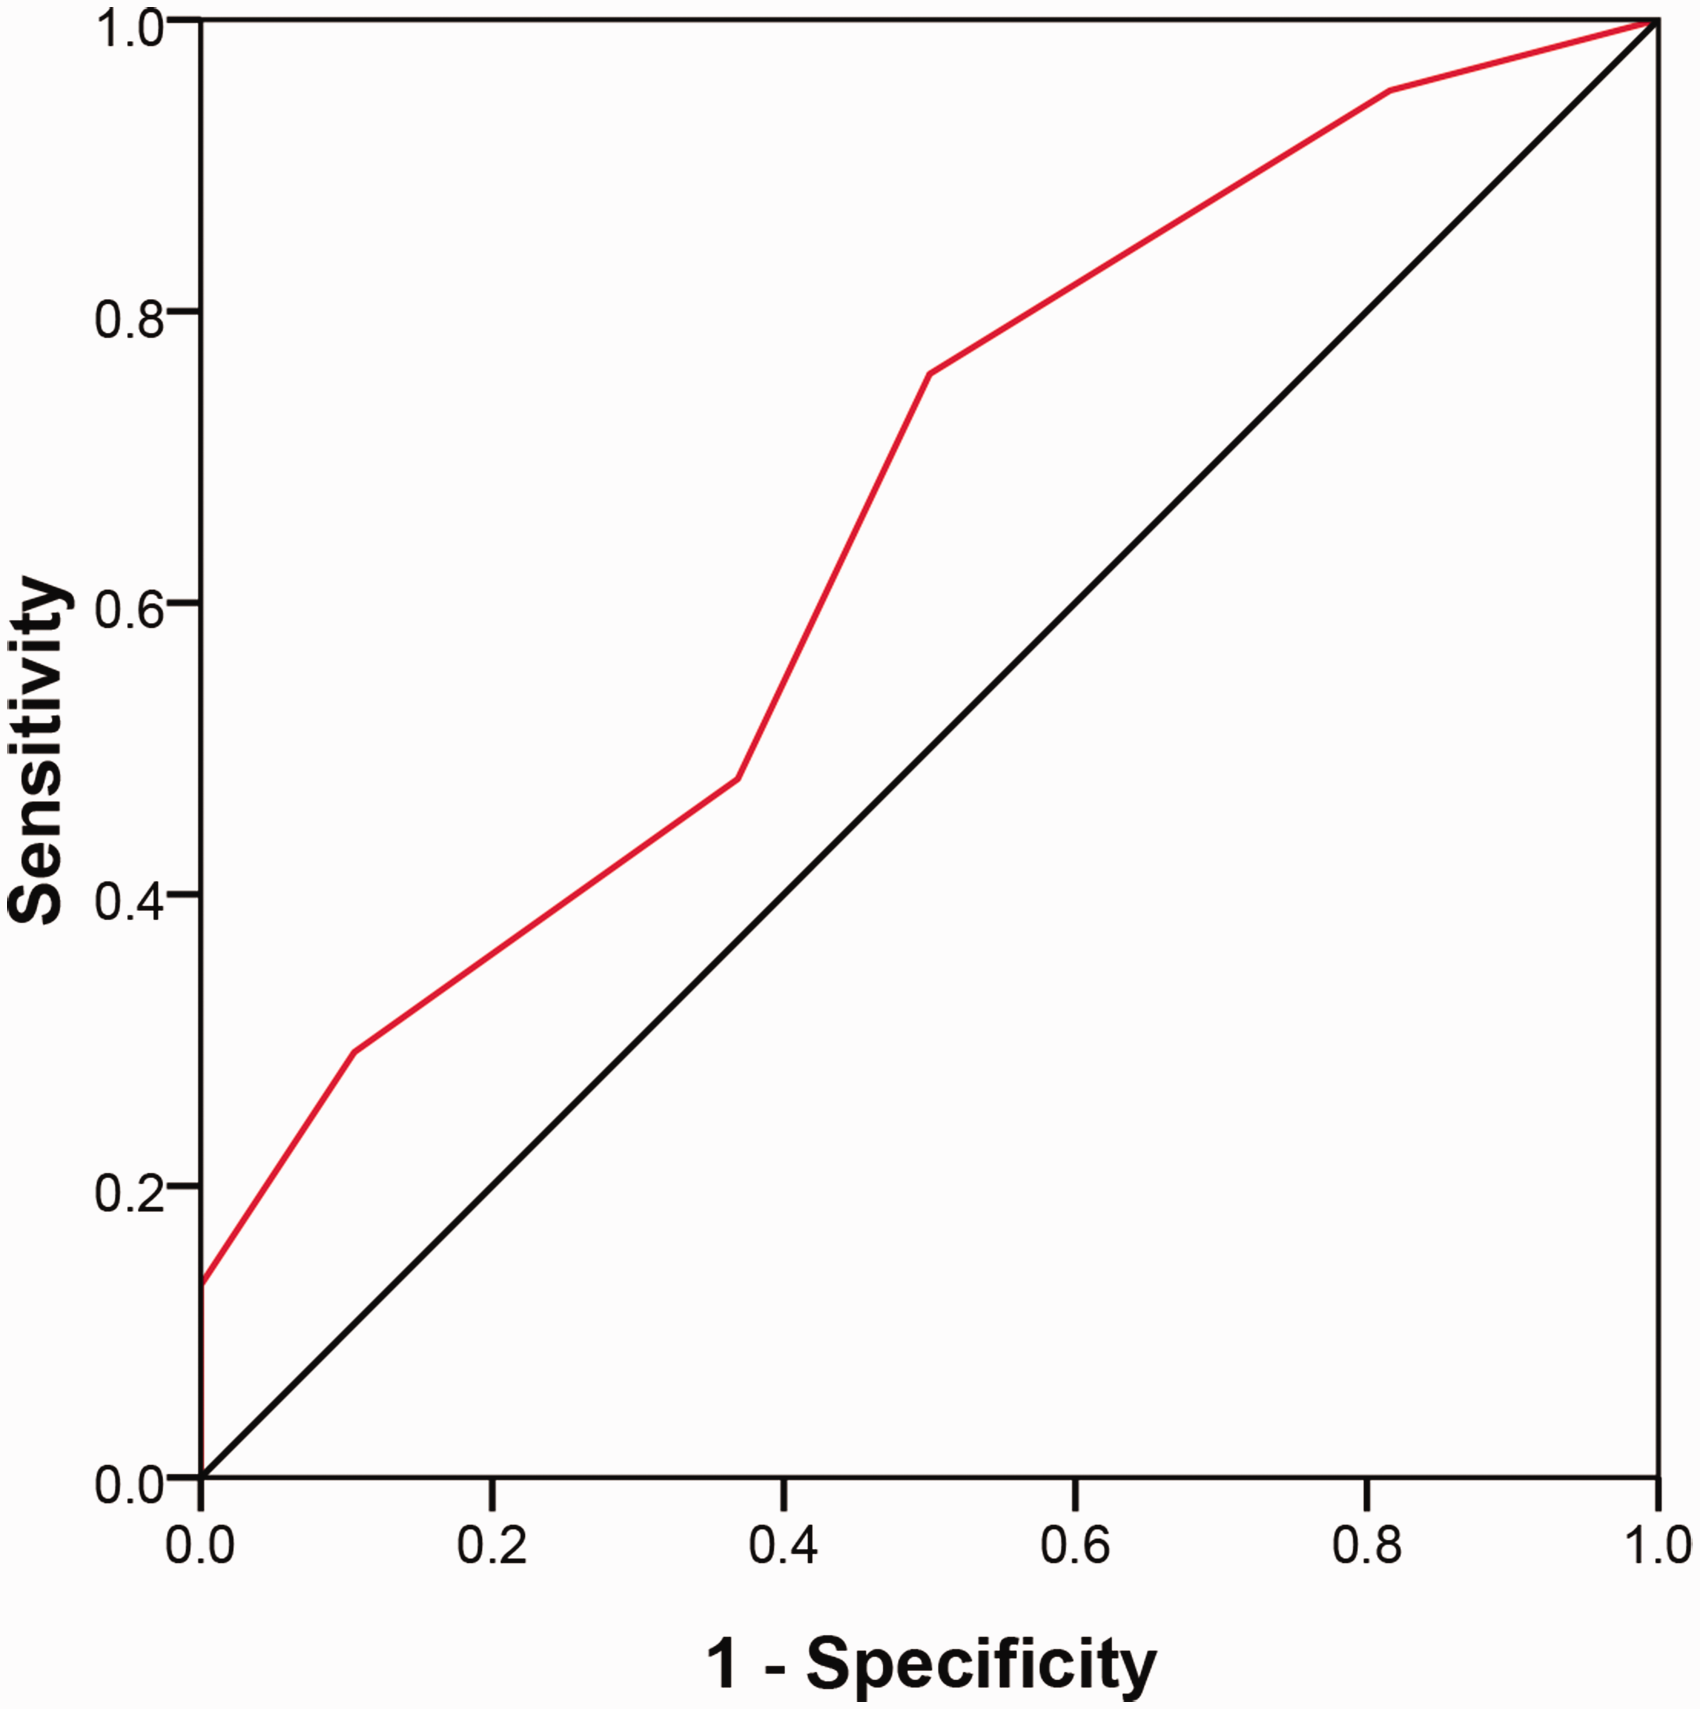
Receiver operating characteristic curve analysis of the ability of the controlling nutritional status score to assess the disease activity of ulcerative colitis (area under the curve = 0.655, P = 0.003, 95% confidence interval, 0.557–0.752). The colour version of this figure is available at: http://imr.sagepub.com.
Discussion
In this current retrospective study, 70% of UC patients were demonstrated to have malnutrition according to the CONUT score, which was consistent with the conclusions of previous research that demonstrated that the prevalence of malnutrition in IBD patients ranged between 20% and 85%. 18 In addition, 50% of UC patients in remission were malnourished in this current study, indicating that patients in remission were also at risk of malnutrition. These findings support previous guidelines that recommended IBD patients in remission should be screened for malnutrition on a regular basis and that nutritional therapy should be improved to avoid malnutrition. 19
There was no significant difference in the BMI between normal (CONUT score < 2) and malnourished (CONUT score ≥ 2) UC patients in this current study. A previous study demonstrated that 20% of overweight or obese patients with ST-segment elevation myocardial infarction had malnutrition. 20 This shows that malnutrition does not only occur in patients with a low BMI. Previous research has held the viewpoint that the severity of malnutrition in IBD patients is related to disease extent. 21 This current study supports this view as there was a significant difference in the extent of the disease between UC patients with or without malnutrition; and malnourished patients had a higher proportion of extensive UC.
The current study showed that the CONUT score was significantly inversely correlated with Hb, PAB and RBP and was significantly positively correlated with FC, CRP, ESR, NLR and PLR. Hb, PAB and RBP are common indicators for assessing the nutritional condition of humans. Hb represents blood content in the human body and an abnormal decrease in Hb indicates anaemia. 22 PAB represents protein content and RBP is associated with protein metabolism.23,24 The results of the current study suggested that the CONUT score could be used to assess the nutritional status of UC patients. FC is a calcium-binding protein derived from colonic mucosal neutrophils and it is a critical biomarker for evaluating the activity of UC. 25 CRP and ESR are biomarkers of an inflammatory response and their levels are significantly elevated in active UC. 26 NLR and PLR are biomarkers of the systemic inflammatory response and disease activity of UC. 27 The results of this current study demonstrated that the CONUT score had the ability to evaluate the inflammatory response of UC.
The CONUT score includes three parameters: serum albumin, serum total cholesterol and total lymphocyte count. 7 Serum albumin is a critical index of nutritional status and immune-inflammatory responses as well as representing protein metabolism in humans. 28 Upregulated energy consumption and downregulated nutrient absorption lead to decreased levels of serum albumin and this in turn aggravates inflammation. 29 A previous study found that serum albumin was a predictor of clinical and endoscopic outcomes in patients with UC. 30 Another study reported that the level of serum albumin could predict clinical outcomes of UC with tacrolimus administration. 31 The level of serum total cholesterol reflects lipid metabolism and it is inversely correlated with systemic inflammation. 32 A previous study found that low total cholesterol levels were associated with more severe disease and hospitalizations in patients with IBD. 33 Lymphocyte count is considered a marker for immunocompetence of the organism. 34 Taken together, the nature of these three parameters provides a foundation for the CONUT score assessing the disease activity of UC. The optimal cut-off value of the CONUT score for it to be able to assess disease activity of UC was 1.5 points in this current study, which was similar to the criterion that a CONUT score < 2 was defined as a normal nutritional condition. More research is needed to verify the optimal cut-off value.
There is a close relationship between malnutrition and UC, but whether malnutrition is a cause or a consequence of UC has not been clarified. The nutritional condition of UC patients is affected by several factors. The reduction of food intake due to abdominal pain and prolonged use of a restricted diet play a critical role in nutritional status. Diarrhoea and systemic inflammation of UC patients may increase their energy consumption and lead to malnutrition. Intestinal bacterial overgrowth and increased intestinal mobility have an adverse effect on the absorption of nutrients. 18 However, malnutrition is also a negative factor for intestinal inflammation. Malnutrition can trigger inflammatory responses through disturbing the gut microbiome composition and increase the risk of surgery and mortality. 5 To clarify the relationship between malnutrition and intestinal inflammation requires more in-depth research on the mechanisms.
A previous study that investigated the ability of the CONUT score to predict the severity of UC in Mexico, demonstrated that UC patients with a high CONUT score presented with moderate-to-severe activity of disease. 35 However, the characteristics and constitutions of patients in China are different to those in Mexico due to different races and lifestyle habits. Therefore, this current study was undertaken to explore the potential ability of the CONUT score to assess the disease activity of UC patients in China.
This current study had several limitations. First, it was a retrospective, single-centre study with a relatively small sample size, so there was the possibility of selection bias. Secondly, this study only collected data at a certain time-point and it did not explore the relationship between the CONUT score and the progress of UC. Thirdly, there was no validation for the cut-off of the CONUT score.
In conclusion, the CONUT score may evaluate the inflammatory response and nutritional status of UC patients, so it may become a valuable biomarker to help assess disease activity in patients with UC. Further multi-centre randomized controlled trials with large sample sizes are needed to confirm these initial observations.
Supplemental Material
sj-pdf-1-imr-10.1177_03000605231184046 - Supplemental material for Association with controlling nutritional status score and disease activity of ulcerative colitis
Supplemental material, sj-pdf-1-imr-10.1177_03000605231184046 for Association with controlling nutritional status score and disease activity of ulcerative colitis by Ziyu Lian, Jingyi Hu, Cheng Cheng, Yajun Liu, Lei Zhu and Hong Shen in Journal of International Medical Research
Supplemental Material
sj-pdf-2-imr-10.1177_03000605231184046 - Supplemental material for Association with controlling nutritional status score and disease activity of ulcerative colitis
Supplemental material, sj-pdf-2-imr-10.1177_03000605231184046 for Association with controlling nutritional status score and disease activity of ulcerative colitis by Ziyu Lian, Jingyi Hu, Cheng Cheng, Yajun Liu, Lei Zhu and Hong Shen in Journal of International Medical Research
Supplemental Material
sj-pdf-3-imr-10.1177_03000605231184046 - Supplemental material for Association with controlling nutritional status score and disease activity of ulcerative colitis
Supplemental material, sj-pdf-3-imr-10.1177_03000605231184046 for Association with controlling nutritional status score and disease activity of ulcerative colitis by Ziyu Lian, Jingyi Hu, Cheng Cheng, Yajun Liu, Lei Zhu and Hong Shen in Journal of International Medical Research
Supplemental Material
sj-pdf-4-imr-10.1177_03000605231184046 - Supplemental material for Association with controlling nutritional status score and disease activity of ulcerative colitis
Supplemental material, sj-pdf-4-imr-10.1177_03000605231184046 for Association with controlling nutritional status score and disease activity of ulcerative colitis by Ziyu Lian, Jingyi Hu, Cheng Cheng, Yajun Liu, Lei Zhu and Hong Shen in Journal of International Medical Research
Supplemental Material
sj-pdf-5-imr-10.1177_03000605231184046 - Supplemental material for Association with controlling nutritional status score and disease activity of ulcerative colitis
Supplemental material, sj-pdf-5-imr-10.1177_03000605231184046 for Association with controlling nutritional status score and disease activity of ulcerative colitis by Ziyu Lian, Jingyi Hu, Cheng Cheng, Yajun Liu, Lei Zhu and Hong Shen in Journal of International Medical Research
Footnotes
Author contributions
Study concept and design: Ziyu Lian, Lei Zhu and Hong Shen; data collection: Ziyu Lian, Lei Zhu and Yajun Liu; data analysis: Jingyi Hu and Cheng Cheng; first draft: Ziyu Lian and Lei Zhu; critical revision and final approval: all the authors.
Declaration of conflicting interest
The authors declare that there are no conflicts of interest.
Funding
This study was supported by the National Key Research and Development Project (no. 2017YFC1700104) and the Postgraduate Research & Practice Innovation Program of Jiangsu Province (no. SJCX20_0508).
References
Supplementary Material
Please find the following supplemental material available below.
For Open Access articles published under a Creative Commons License, all supplemental material carries the same license as the article it is associated with.
For non-Open Access articles published, all supplemental material carries a non-exclusive license, and permission requests for re-use of supplemental material or any part of supplemental material shall be sent directly to the copyright owner as specified in the copyright notice associated with the article.